Buckhead Ridge, FL Map & Demographics
Buckhead Ridge Map
Buckhead Ridge Overview
$33,383
PER CAPITA INCOME
$62,679
AVG FAMILY INCOME
$34,911
AVG HOUSEHOLD INCOME
30.2%
WAGE / INCOME GAP [ % ]
69.8¢/ $1
WAGE / INCOME GAP [ $ ]
$8,136
FAMILY INCOME DEFICIT
0.47
INEQUALITY / GINI INDEX
1,028
TOTAL POPULATION
583
MALE POPULATION
445
FEMALE POPULATION
131.01
MALES / 100 FEMALES
76.33
FEMALES / 100 MALES
65.8
MEDIAN AGE
2.5
AVG FAMILY SIZE
1.9
AVG HOUSEHOLD SIZE
252
LABOR FORCE [ PEOPLE ]
24.5%
PERCENT IN LABOR FORCE
12.7%
UNEMPLOYMENT RATE
Income in Buckhead Ridge
Income Overview in Buckhead Ridge
Per Capita Income in Buckhead Ridge is $33,383, while median incomes of families and households are $62,679 and $34,911 respectively.
| Characteristic | Number | Measure |
| Per Capita Income | 1,028 | $33,383 |
| Median Family Income | 281 | $62,679 |
| Mean Family Income | 281 | $79,526 |
| Median Household Income | 535 | $34,911 |
| Mean Household Income | 535 | $59,385 |
| Income Deficit | 281 | $8,136 |
| Wage / Income Gap (%) | 1,028 | 30.20% |
| Wage / Income Gap ($) | 1,028 | 69.80¢ per $1 |
| Gini / Inequality Index | 1,028 | 0.47 |
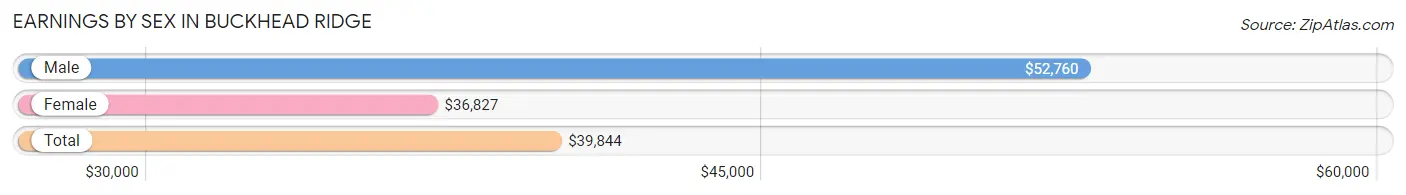
Earnings by Sex in Buckhead Ridge
Average Earnings in Buckhead Ridge are $39,844, $52,760 for men and $36,827 for women, a difference of 30.2%.
| Sex | Number | Average Earnings |
| Male | 151 (61.9%) | $52,760 |
| Female | 93 (38.1%) | $36,827 |
| Total | 244 (100.0%) | $39,844 |
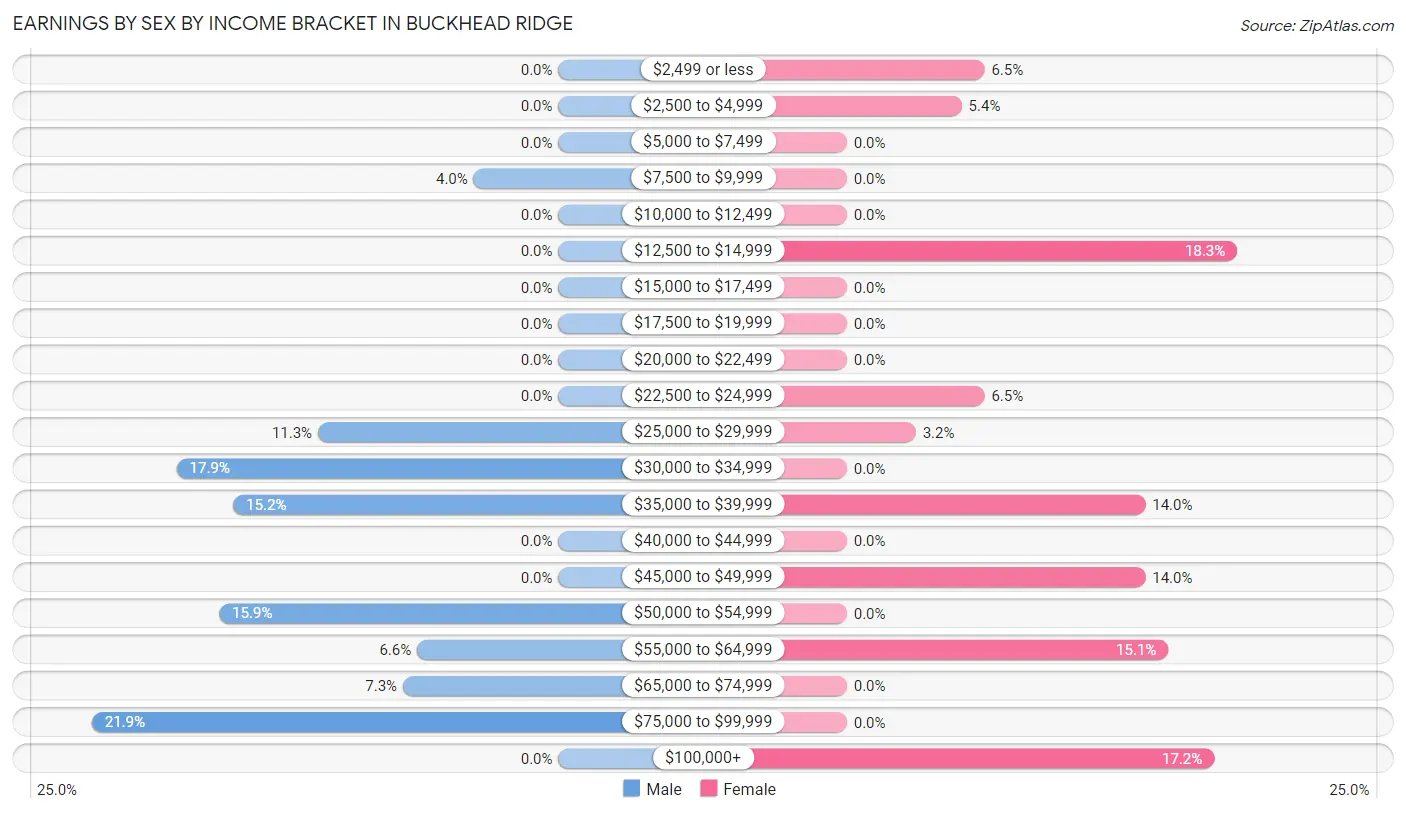
Earnings by Sex by Income Bracket in Buckhead Ridge
The most common earnings brackets in Buckhead Ridge are $75,000 to $99,999 for men (33 | 21.8%) and $12,500 to $14,999 for women (17 | 18.3%).
| Income | Male | Female |
| $2,499 or less | 0 (0.0%) | 6 (6.5%) |
| $2,500 to $4,999 | 0 (0.0%) | 5 (5.4%) |
| $5,000 to $7,499 | 0 (0.0%) | 0 (0.0%) |
| $7,500 to $9,999 | 6 (4.0%) | 0 (0.0%) |
| $10,000 to $12,499 | 0 (0.0%) | 0 (0.0%) |
| $12,500 to $14,999 | 0 (0.0%) | 17 (18.3%) |
| $15,000 to $17,499 | 0 (0.0%) | 0 (0.0%) |
| $17,500 to $19,999 | 0 (0.0%) | 0 (0.0%) |
| $20,000 to $22,499 | 0 (0.0%) | 0 (0.0%) |
| $22,500 to $24,999 | 0 (0.0%) | 6 (6.5%) |
| $25,000 to $29,999 | 17 (11.3%) | 3 (3.2%) |
| $30,000 to $34,999 | 27 (17.9%) | 0 (0.0%) |
| $35,000 to $39,999 | 23 (15.2%) | 13 (14.0%) |
| $40,000 to $44,999 | 0 (0.0%) | 0 (0.0%) |
| $45,000 to $49,999 | 0 (0.0%) | 13 (14.0%) |
| $50,000 to $54,999 | 24 (15.9%) | 0 (0.0%) |
| $55,000 to $64,999 | 10 (6.6%) | 14 (15.0%) |
| $65,000 to $74,999 | 11 (7.3%) | 0 (0.0%) |
| $75,000 to $99,999 | 33 (21.8%) | 0 (0.0%) |
| $100,000+ | 0 (0.0%) | 16 (17.2%) |
| Total | 151 (100.0%) | 93 (100.0%) |
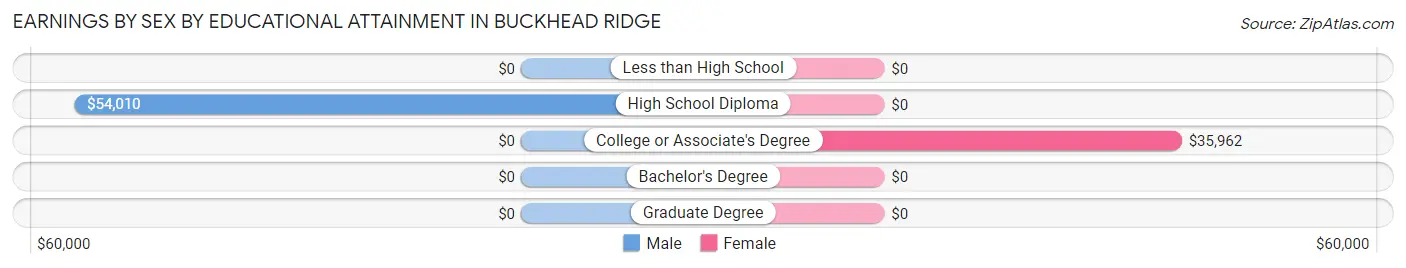
Earnings by Sex by Educational Attainment in Buckhead Ridge
Average earnings in Buckhead Ridge are $52,760 for men and $37,404 for women, a difference of 29.1%. Men with an educational attainment of high school diploma enjoy the highest average annual earnings of $54,010, while those with high school diploma education earn the least with $54,010. Women with an educational attainment of college or associate's degree earn the most with the average annual earnings of $35,962, while those with college or associate's degree education have the smallest earnings of $35,962.
| Educational Attainment | Male Income | Female Income |
| Less than High School | - | - |
| High School Diploma | $54,010 | $0 |
| College or Associate's Degree | - | - |
| Bachelor's Degree | - | - |
| Graduate Degree | - | - |
| Total | $52,760 | $37,404 |
Family Income in Buckhead Ridge
Family Income Brackets in Buckhead Ridge
According to the Buckhead Ridge family income data, there are 77 families falling into the $100,000 to $149,999 income range, which is the most common income bracket and makes up 27.4% of all families.
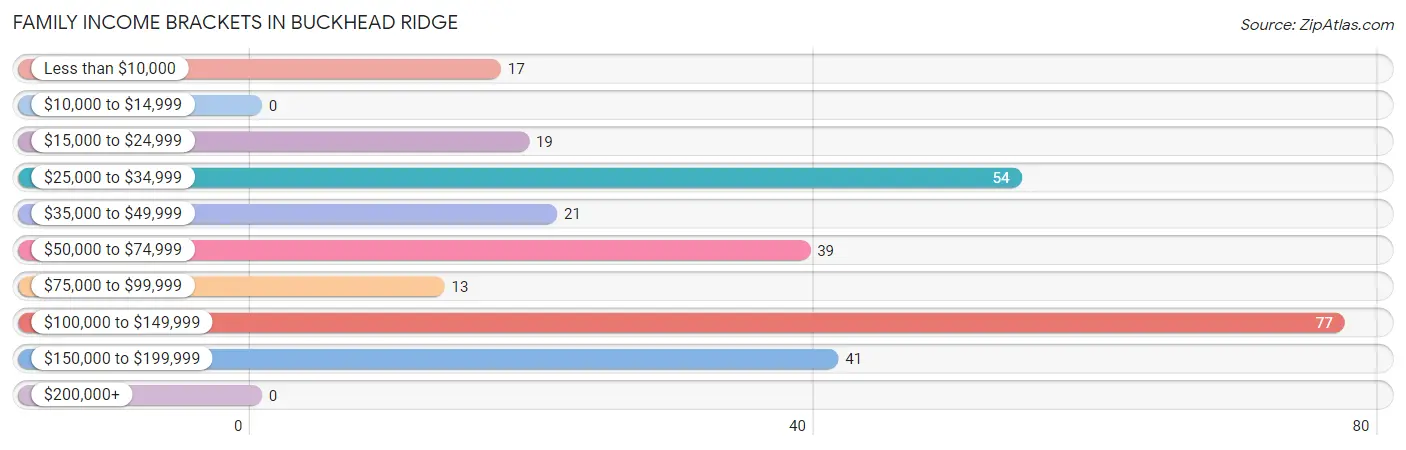
| Income Bracket | # Families | % Families |
| Less than $10,000 | 17 | 6.0% |
| $10,000 to $14,999 | 0 | 0.0% |
| $15,000 to $24,999 | 19 | 6.8% |
| $25,000 to $34,999 | 54 | 19.2% |
| $35,000 to $49,999 | 21 | 7.5% |
| $50,000 to $74,999 | 39 | 13.9% |
| $75,000 to $99,999 | 13 | 4.6% |
| $100,000 to $149,999 | 77 | 27.4% |
| $150,000 to $199,999 | 41 | 14.6% |
| $200,000+ | 0 | 0.0% |
Family Income by Famaliy Size in Buckhead Ridge
2-person families (226 | 80.4%) account for the highest median family income in Buckhead Ridge with $52,500 per family, while 2-person families (226 | 80.4%) have the highest median income of $26,250 per family member.
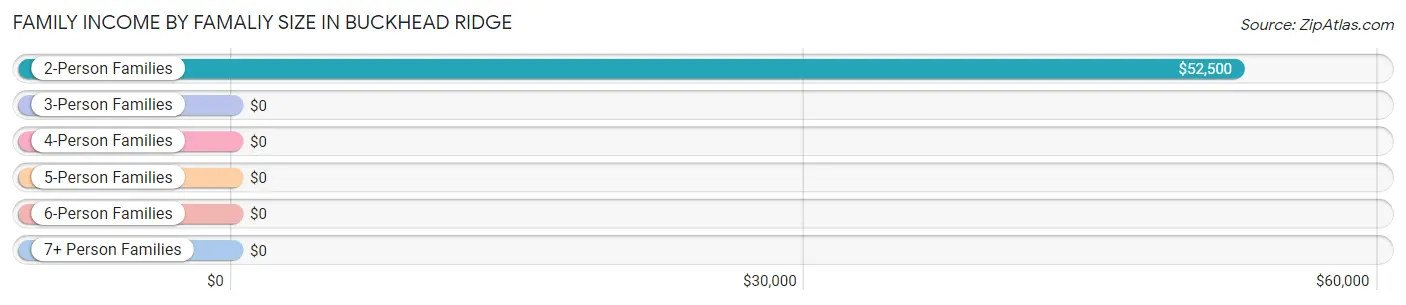
| Income Bracket | # Families | Median Income |
| 2-Person Families | 226 (80.4%) | $52,500 |
| 3-Person Families | 55 (19.6%) | $0 |
| 4-Person Families | 0 (0.0%) | $0 |
| 5-Person Families | 0 (0.0%) | $0 |
| 6-Person Families | 0 (0.0%) | $0 |
| 7+ Person Families | 0 (0.0%) | $0 |
| Total | 281 (100.0%) | $62,679 |
Family Income by Number of Earners in Buckhead Ridge
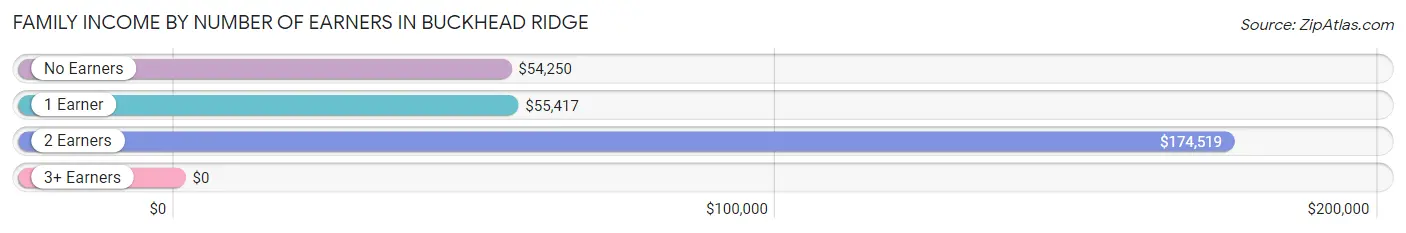
| Number of Earners | # Families | Median Income |
| No Earners | 162 (57.7%) | $54,250 |
| 1 Earner | 82 (29.2%) | $55,417 |
| 2 Earners | 37 (13.2%) | $174,519 |
| 3+ Earners | 0 (0.0%) | $0 |
| Total | 281 (100.0%) | $62,679 |
Household Income in Buckhead Ridge
Household Income Brackets in Buckhead Ridge
With 103 households falling in the category, the $100,000 to $149,999 income range is the most frequent in Buckhead Ridge, accounting for 19.3% of all households.
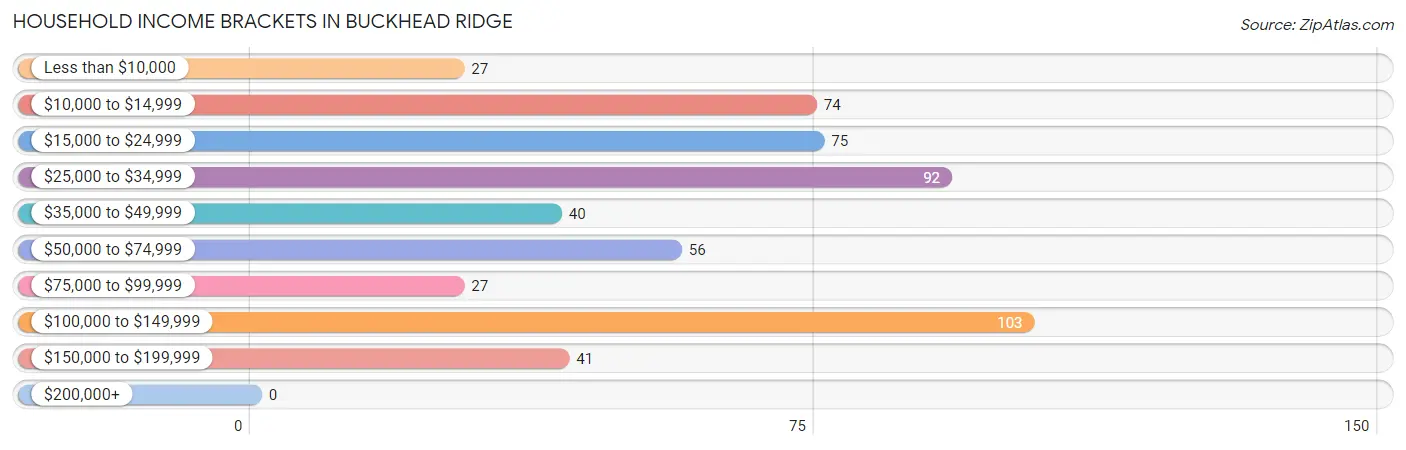
| Income Bracket | # Households | % Households |
| Less than $10,000 | 27 | 5.0% |
| $10,000 to $14,999 | 74 | 13.8% |
| $15,000 to $24,999 | 75 | 14.0% |
| $25,000 to $34,999 | 92 | 17.2% |
| $35,000 to $49,999 | 40 | 7.5% |
| $50,000 to $74,999 | 56 | 10.5% |
| $75,000 to $99,999 | 27 | 5.0% |
| $100,000 to $149,999 | 103 | 19.3% |
| $150,000 to $199,999 | 41 | 7.7% |
| $200,000+ | 0 | 0.0% |
Household Income by Householder Age in Buckhead Ridge
The median household income in Buckhead Ridge is $34,911, with the highest median household income of $55,921 found in the 45 to 64 years age bracket for the primary householder. A total of 160 households (29.9%) fall into this category.
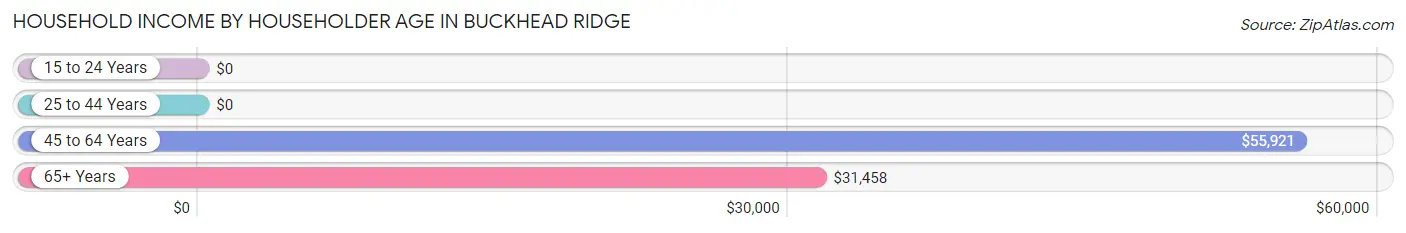
| Income Bracket | # Households | Median Income |
| 15 to 24 Years | 0 (0.0%) | $0 |
| 25 to 44 Years | 23 (4.3%) | $0 |
| 45 to 64 Years | 160 (29.9%) | $55,921 |
| 65+ Years | 352 (65.8%) | $31,458 |
| Total | 535 (100.0%) | $34,911 |
Poverty in Buckhead Ridge
Income Below Poverty by Sex and Age in Buckhead Ridge
With 11.2% poverty level for males and 23.4% for females among the residents of Buckhead Ridge, 55 to 64 year old males and 55 to 64 year old females are the most vulnerable to poverty, with 34 males (16.4%) and 39 females (33.6%) in their respective age groups living below the poverty level.
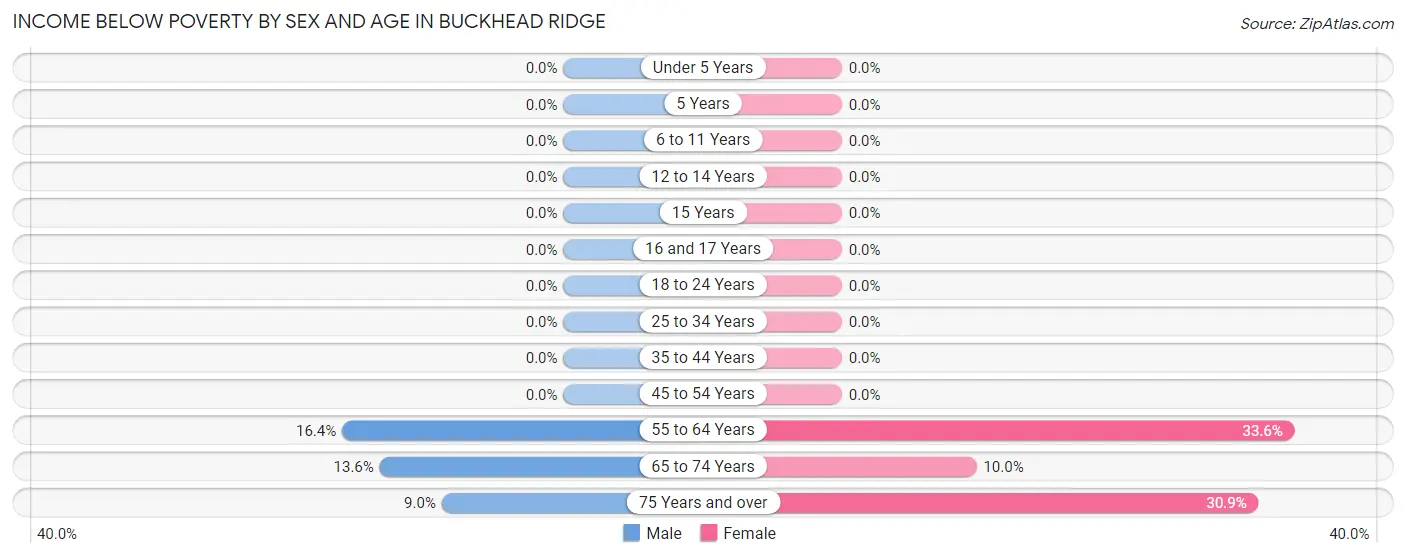
| Age Bracket | Male | Female |
| Under 5 Years | 0 (0.0%) | 0 (0.0%) |
| 5 Years | 0 (0.0%) | 0 (0.0%) |
| 6 to 11 Years | 0 (0.0%) | 0 (0.0%) |
| 12 to 14 Years | 0 (0.0%) | 0 (0.0%) |
| 15 Years | 0 (0.0%) | 0 (0.0%) |
| 16 and 17 Years | 0 (0.0%) | 0 (0.0%) |
| 18 to 24 Years | 0 (0.0%) | 0 (0.0%) |
| 25 to 34 Years | 0 (0.0%) | 0 (0.0%) |
| 35 to 44 Years | 0 (0.0%) | 0 (0.0%) |
| 45 to 54 Years | 0 (0.0%) | 0 (0.0%) |
| 55 to 64 Years | 34 (16.4%) | 39 (33.6%) |
| 65 to 74 Years | 18 (13.6%) | 9 (10.0%) |
| 75 Years and over | 13 (9.0%) | 56 (30.9%) |
| Total | 65 (11.2%) | 104 (23.4%) |
Income Above Poverty by Sex and Age in Buckhead Ridge
According to the poverty statistics in Buckhead Ridge, males aged 16 and 17 years and females aged 18 to 24 years are the age groups that are most secure financially, with 100.0% of males and 100.0% of females in these age groups living above the poverty line.
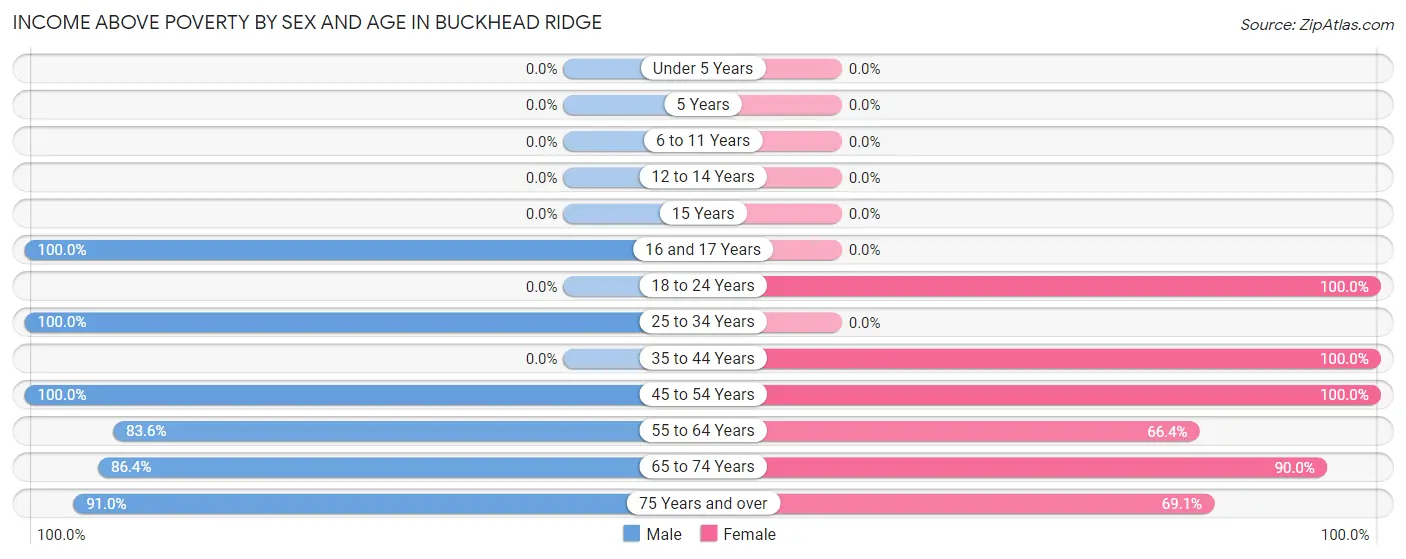
| Age Bracket | Male | Female |
| Under 5 Years | 0 (0.0%) | 0 (0.0%) |
| 5 Years | 0 (0.0%) | 0 (0.0%) |
| 6 to 11 Years | 0 (0.0%) | 0 (0.0%) |
| 12 to 14 Years | 0 (0.0%) | 0 (0.0%) |
| 15 Years | 0 (0.0%) | 0 (0.0%) |
| 16 and 17 Years | 27 (100.0%) | 0 (0.0%) |
| 18 to 24 Years | 0 (0.0%) | 6 (100.0%) |
| 25 to 34 Years | 10 (100.0%) | 0 (0.0%) |
| 35 to 44 Years | 0 (0.0%) | 13 (100.0%) |
| 45 to 54 Years | 63 (100.0%) | 39 (100.0%) |
| 55 to 64 Years | 173 (83.6%) | 77 (66.4%) |
| 65 to 74 Years | 114 (86.4%) | 81 (90.0%) |
| 75 Years and over | 131 (91.0%) | 125 (69.1%) |
| Total | 518 (88.8%) | 341 (76.6%) |
Income Below Poverty Among Married-Couple Families in Buckhead Ridge
The poverty statistics for married-couple families in Buckhead Ridge show that 14.2% or 33 of the total 232 families live below the poverty line. Families with no children have the highest poverty rate of 15.0%, comprising of 33 families. On the other hand, families with 1 or 2 children have the lowest poverty rate of 0.0%, which includes 0 families.
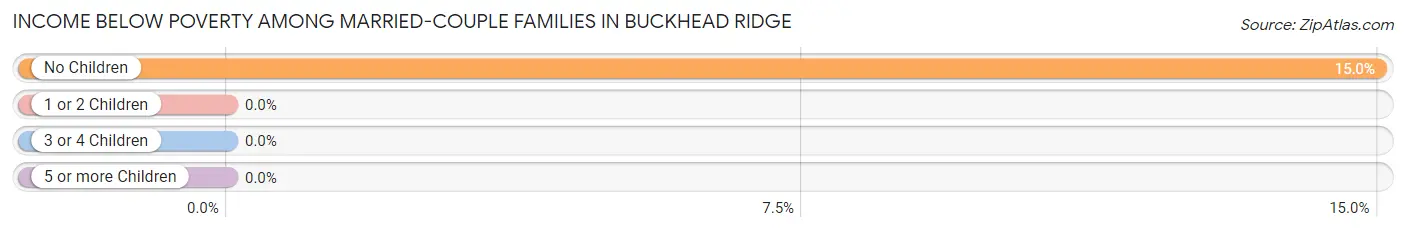
| Children | Above Poverty | Below Poverty |
| No Children | 187 (85.0%) | 33 (15.0%) |
| 1 or 2 Children | 12 (100.0%) | 0 (0.0%) |
| 3 or 4 Children | 0 (0.0%) | 0 (0.0%) |
| 5 or more Children | 0 (0.0%) | 0 (0.0%) |
| Total | 199 (85.8%) | 33 (14.2%) |
Income Below Poverty Among Single-Parent Households in Buckhead Ridge
| Children | Single Father | Single Mother |
| No Children | 0 (0.0%) | 0 (0.0%) |
| 1 or 2 Children | 0 (0.0%) | 0 (0.0%) |
| 3 or 4 Children | 0 (0.0%) | 0 (0.0%) |
| 5 or more Children | 0 (0.0%) | 0 (0.0%) |
| Total | 0 (0.0%) | 0 (0.0%) |
Income Below Poverty Among Married-Couple vs Single-Parent Households in Buckhead Ridge
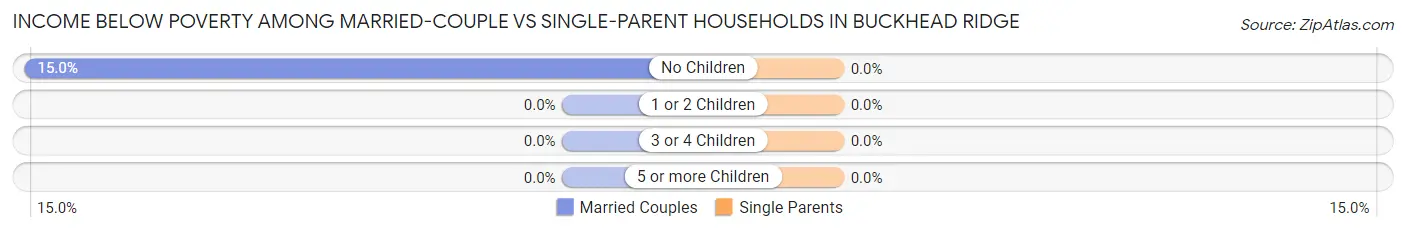
| Children | Married-Couple Families | Single-Parent Households |
| No Children | 33 (15.0%) | 0 (0.0%) |
| 1 or 2 Children | 0 (0.0%) | 0 (0.0%) |
| 3 or 4 Children | 0 (0.0%) | 0 (0.0%) |
| 5 or more Children | 0 (0.0%) | 0 (0.0%) |
| Total | 33 (14.2%) | 0 (0.0%) |
Race in Buckhead Ridge
The most populous races in Buckhead Ridge are White / Caucasian (945 | 91.9%), Asian (53 | 5.2%), and Two or more Races (24 | 2.3%).
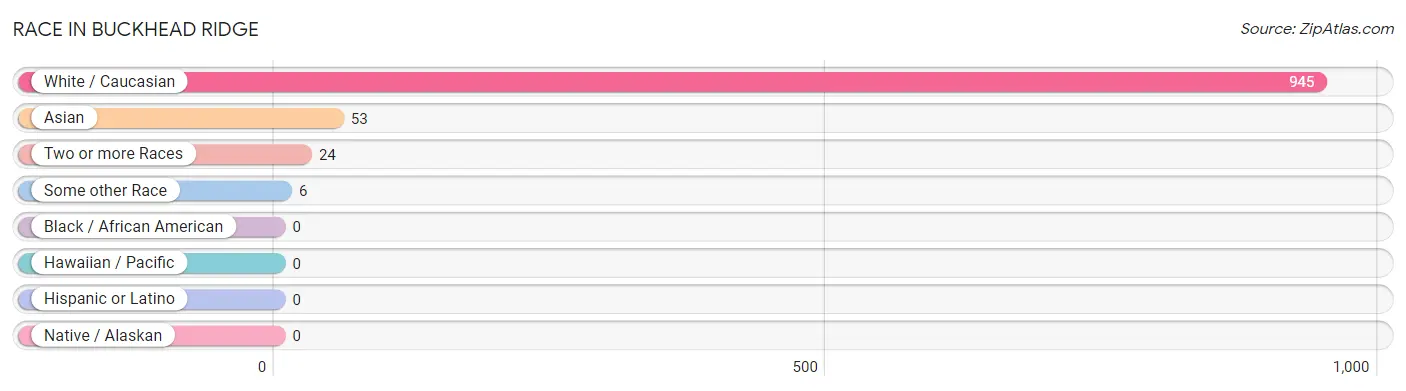
| Race | # Population | % Population |
| Asian | 53 | 5.2% |
| Black / African American | 0 | 0.0% |
| Hawaiian / Pacific | 0 | 0.0% |
| Hispanic or Latino | 0 | 0.0% |
| Native / Alaskan | 0 | 0.0% |
| White / Caucasian | 945 | 91.9% |
| Two or more Races | 24 | 2.3% |
| Some other Race | 6 | 0.6% |
| Total | 1,028 | 100.0% |
Ancestry in Buckhead Ridge
The most populous ancestries reported in Buckhead Ridge are German (187 | 18.2%), English (167 | 16.3%), Irish (162 | 15.8%), American (118 | 11.5%), and Korean (53 | 5.2%), together accounting for 66.8% of all Buckhead Ridge residents.
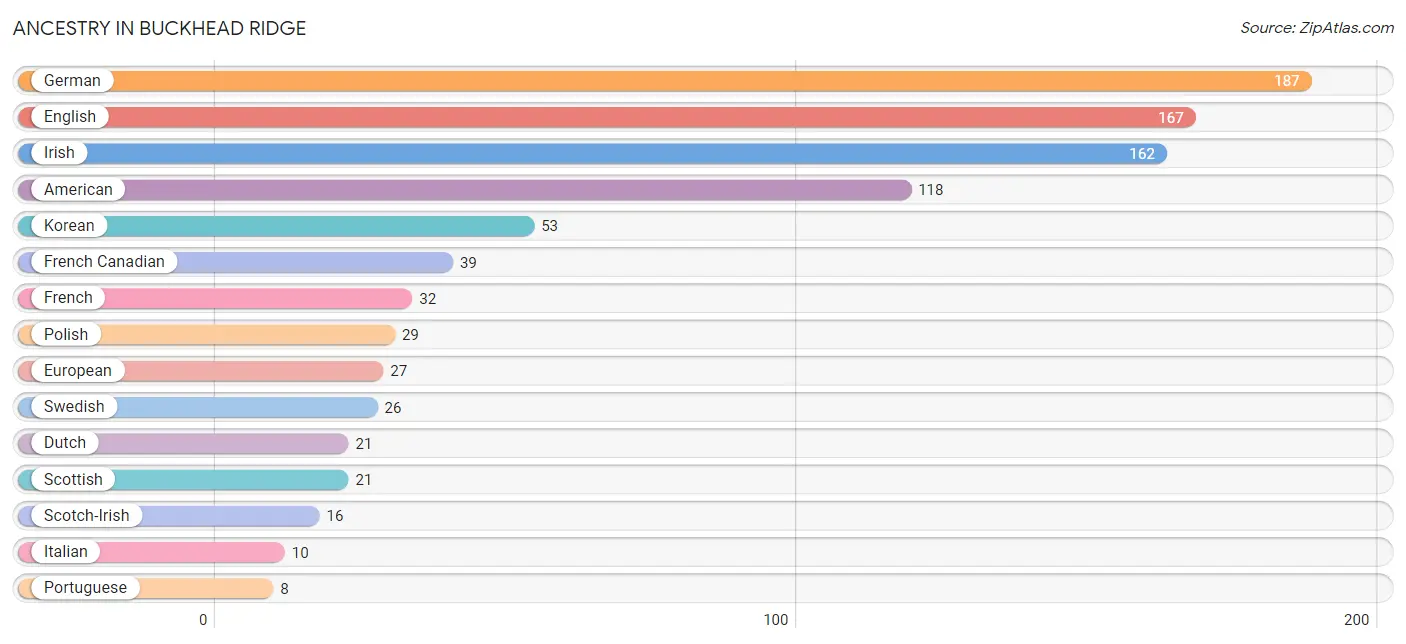
| Ancestry | # Population | % Population |
| American | 118 | 11.5% |
| Belgian | 7 | 0.7% |
| Czechoslovakian | 5 | 0.5% |
| Dutch | 21 | 2.0% |
| English | 167 | 16.3% |
| European | 27 | 2.6% |
| French | 32 | 3.1% |
| French Canadian | 39 | 3.8% |
| German | 187 | 18.2% |
| Irish | 162 | 15.8% |
| Italian | 10 | 1.0% |
| Korean | 53 | 5.2% |
| Polish | 29 | 2.8% |
| Portuguese | 8 | 0.8% |
| Scotch-Irish | 16 | 1.6% |
| Scottish | 21 | 2.0% |
| Swedish | 26 | 2.5% |
| Welsh | 6 | 0.6% | View All 18 Rows |
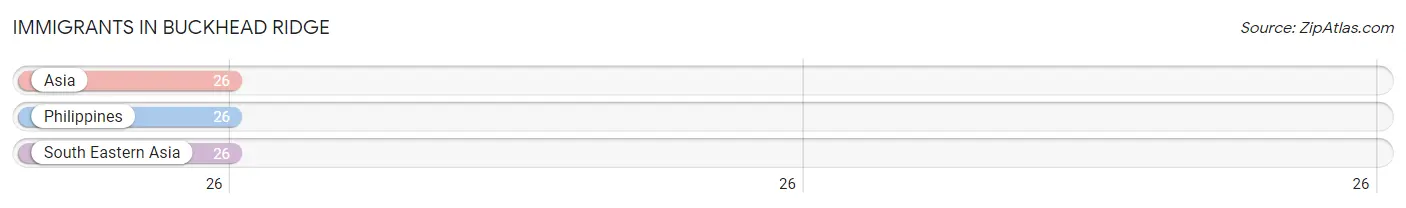
Immigrants in Buckhead Ridge
The most numerous immigrant groups reported in Buckhead Ridge came from Asia (26 | 2.5%), Philippines (26 | 2.5%), and South Eastern Asia (26 | 2.5%), together accounting for 7.6% of all Buckhead Ridge residents.
| Immigration Origin | # Population | % Population |
| Asia | 26 | 2.5% |
| Philippines | 26 | 2.5% |
| South Eastern Asia | 26 | 2.5% | View All 3 Rows |
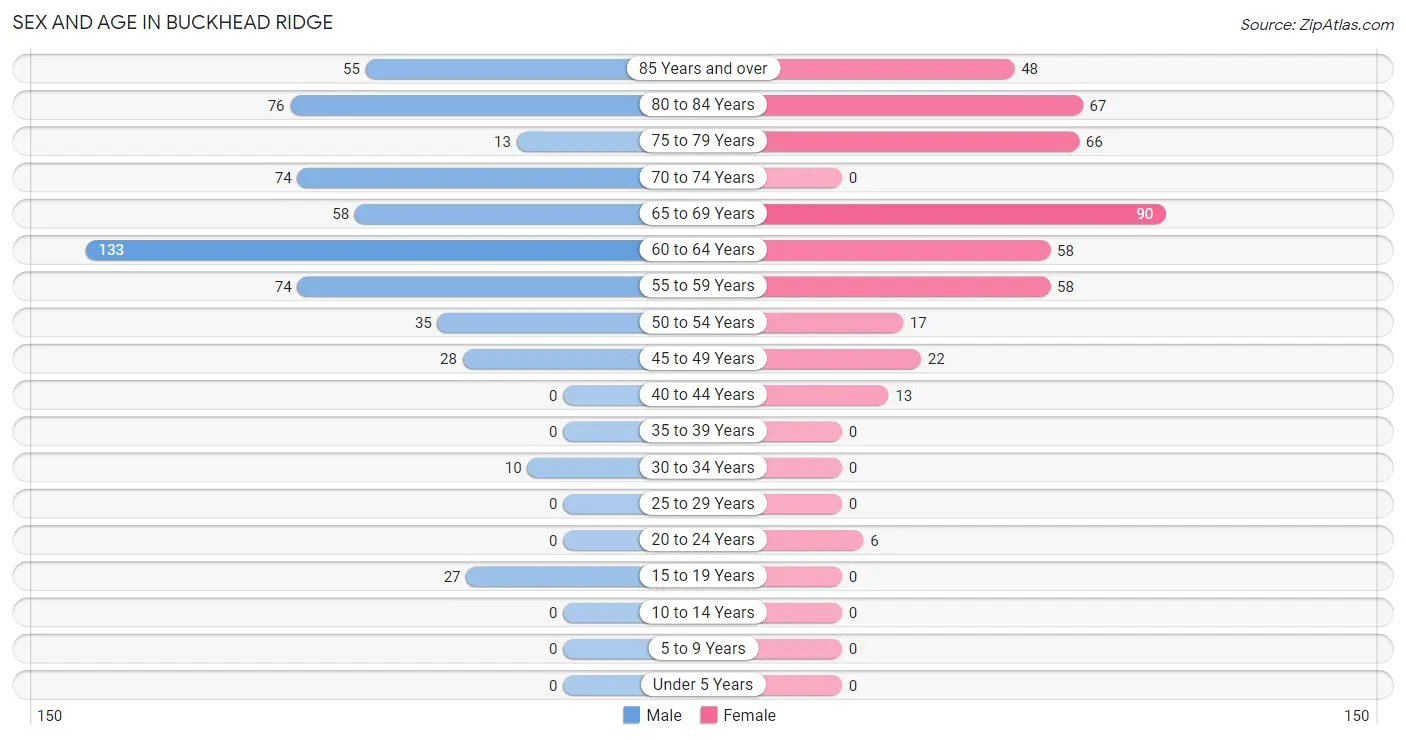
Sex and Age in Buckhead Ridge
Sex and Age in Buckhead Ridge
The most populous age groups in Buckhead Ridge are 60 to 64 Years (133 | 22.8%) for men and 65 to 69 Years (90 | 20.2%) for women.
| Age Bracket | Male | Female |
| Under 5 Years | 0 (0.0%) | 0 (0.0%) |
| 5 to 9 Years | 0 (0.0%) | 0 (0.0%) |
| 10 to 14 Years | 0 (0.0%) | 0 (0.0%) |
| 15 to 19 Years | 27 (4.6%) | 0 (0.0%) |
| 20 to 24 Years | 0 (0.0%) | 6 (1.3%) |
| 25 to 29 Years | 0 (0.0%) | 0 (0.0%) |
| 30 to 34 Years | 10 (1.7%) | 0 (0.0%) |
| 35 to 39 Years | 0 (0.0%) | 0 (0.0%) |
| 40 to 44 Years | 0 (0.0%) | 13 (2.9%) |
| 45 to 49 Years | 28 (4.8%) | 22 (4.9%) |
| 50 to 54 Years | 35 (6.0%) | 17 (3.8%) |
| 55 to 59 Years | 74 (12.7%) | 58 (13.0%) |
| 60 to 64 Years | 133 (22.8%) | 58 (13.0%) |
| 65 to 69 Years | 58 (10.0%) | 90 (20.2%) |
| 70 to 74 Years | 74 (12.7%) | 0 (0.0%) |
| 75 to 79 Years | 13 (2.2%) | 66 (14.8%) |
| 80 to 84 Years | 76 (13.0%) | 67 (15.1%) |
| 85 Years and over | 55 (9.4%) | 48 (10.8%) |
| Total | 583 (100.0%) | 445 (100.0%) |
Families and Households in Buckhead Ridge
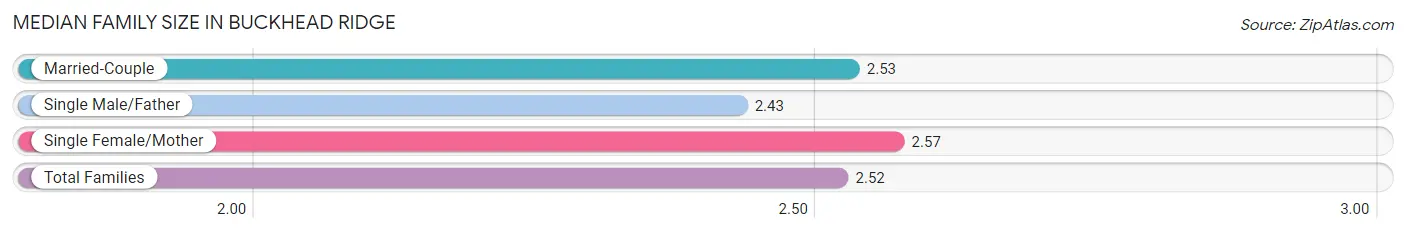
Median Family Size in Buckhead Ridge
The median family size in Buckhead Ridge is 2.52 persons per family, with single female/mother families (21 | 7.5%) accounting for the largest median family size of 2.57 persons per family. On the other hand, single male/father families (28 | 10.0%) represent the smallest median family size with 2.43 persons per family.
| Family Type | # Families | Family Size |
| Married-Couple | 232 (82.6%) | 2.53 |
| Single Male/Father | 28 (10.0%) | 2.43 |
| Single Female/Mother | 21 (7.5%) | 2.57 |
| Total Families | 281 (100.0%) | 2.52 |
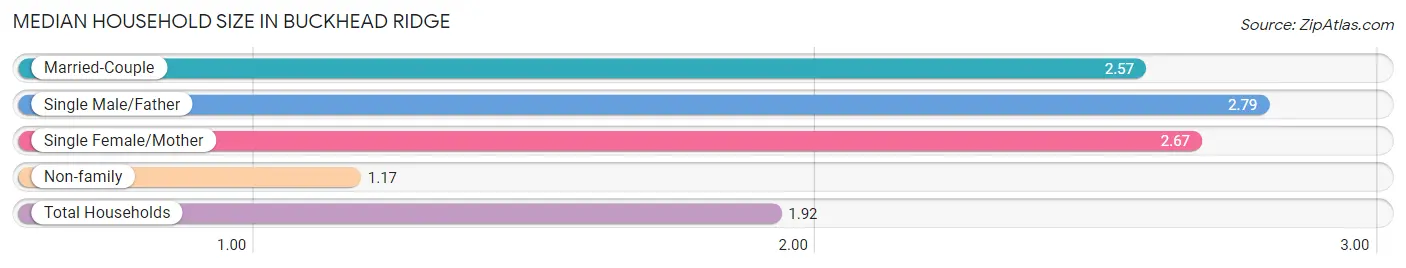
Median Household Size in Buckhead Ridge
The median household size in Buckhead Ridge is 1.92 persons per household, with single male/father households (28 | 5.2%) accounting for the largest median household size of 2.79 persons per household. non-family households (254 | 47.5%) represent the smallest median household size with 1.17 persons per household.
| Household Type | # Households | Household Size |
| Married-Couple | 232 (43.4%) | 2.57 |
| Single Male/Father | 28 (5.2%) | 2.79 |
| Single Female/Mother | 21 (3.9%) | 2.67 |
| Non-family | 254 (47.5%) | 1.17 |
| Total Households | 535 (100.0%) | 1.92 |
Household Size by Marriage Status in Buckhead Ridge
Out of a total of 535 households in Buckhead Ridge, 281 (52.5%) are family households, while 254 (47.5%) are nonfamily households. The most numerous type of family households are 2-person households, comprising 213, and the most common type of nonfamily households are 1-person households, comprising 215.
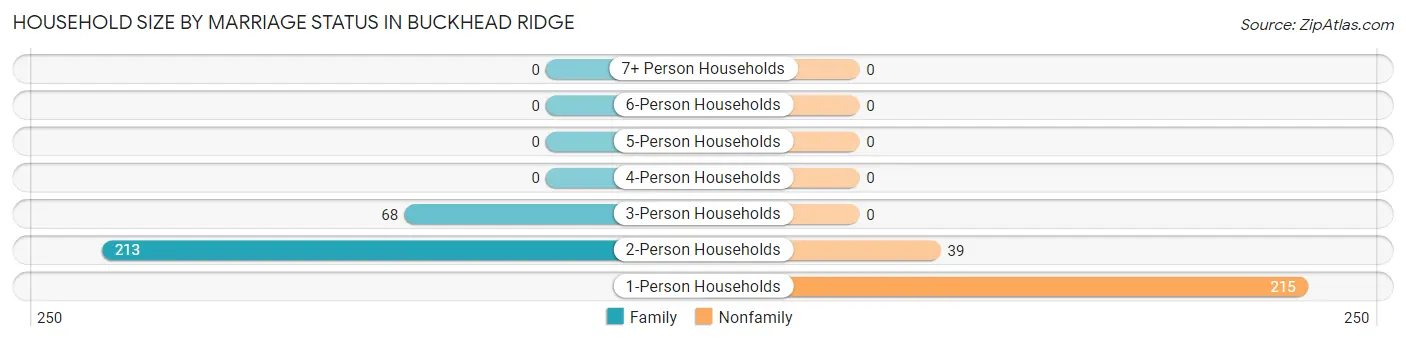
| Household Size | Family Households | Nonfamily Households |
| 1-Person Households | - | 215 (40.2%) |
| 2-Person Households | 213 (39.8%) | 39 (7.3%) |
| 3-Person Households | 68 (12.7%) | 0 (0.0%) |
| 4-Person Households | 0 (0.0%) | 0 (0.0%) |
| 5-Person Households | 0 (0.0%) | 0 (0.0%) |
| 6-Person Households | 0 (0.0%) | 0 (0.0%) |
| 7+ Person Households | 0 (0.0%) | 0 (0.0%) |
| Total | 281 (52.5%) | 254 (47.5%) |
Female Fertility in Buckhead Ridge
Fertility by Age in Buckhead Ridge
| Age Bracket | Women with Births | Births / 1,000 Women |
| 15 to 19 years | 0 (0.0%) | 0.0 |
| 20 to 34 years | 0 (0.0%) | 0.0 |
| 35 to 50 years | 0 (0.0%) | 0.0 |
| Total | 0 (0.0%) | 0.0 |
Fertility by Age by Marriage Status in Buckhead Ridge
| Age Bracket | Married | Unmarried |
| 15 to 19 years | 0 (0.0%) | 0 (0.0%) |
| 20 to 34 years | 0 (0.0%) | 0 (0.0%) |
| 35 to 50 years | 0 (0.0%) | 0 (0.0%) |
| Total | 0 (0.0%) | 0 (0.0%) |
Fertility by Education in Buckhead Ridge
| Educational Attainment | Women with Births | Births / 1,000 Women |
| Less than High School | 0 (0.0%) | 0.0 |
| High School Diploma | 0 (0.0%) | 0.0 |
| College or Associate's Degree | 0 (0.0%) | 0.0 |
| Bachelor's Degree | 0 (0.0%) | 0.0 |
| Graduate Degree | 0 (0.0%) | 0.0 |
| Total | 0 (0.0%) | 0.0 |
Fertility by Education by Marriage Status in Buckhead Ridge
| Educational Attainment | Married | Unmarried |
| Less than High School | 0 (0.0%) | 0 (0.0%) |
| High School Diploma | 0 (0.0%) | 0 (0.0%) |
| College or Associate's Degree | 0 (0.0%) | 0 (0.0%) |
| Bachelor's Degree | 0 (0.0%) | 0 (0.0%) |
| Graduate Degree | 0 (0.0%) | 0 (0.0%) |
| Total | 0 (0.0%) | 0 (0.0%) |
Employment Characteristics in Buckhead Ridge
Employment by Class of Employer in Buckhead Ridge
Among the 197 employed individuals in Buckhead Ridge, private company employees (121 | 61.4%), self-employed (not incorporated) (33 | 16.8%), and self-employed (incorporated) (16 | 8.1%) make up the most common classes of employment.
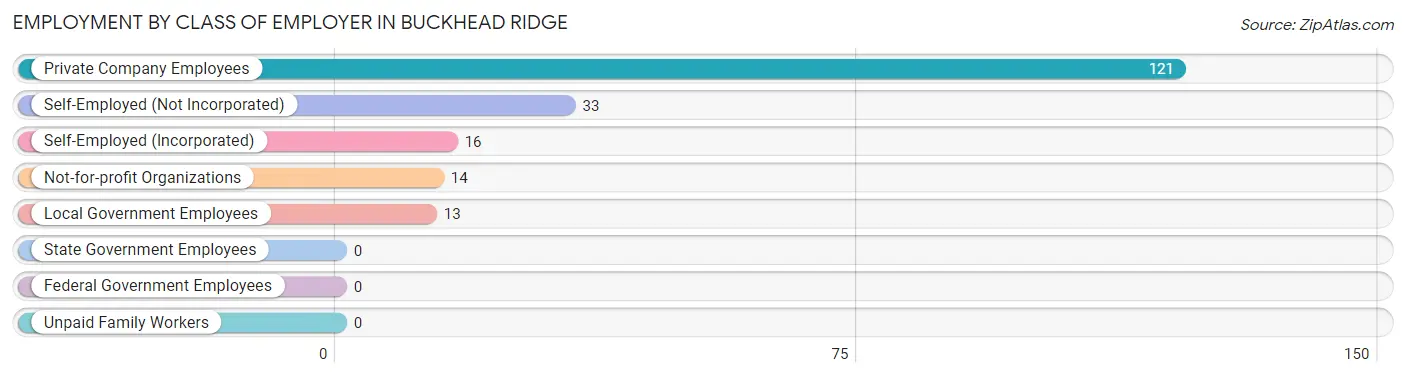
| Employer Class | # Employees | % Employees |
| Private Company Employees | 121 | 61.4% |
| Self-Employed (Incorporated) | 16 | 8.1% |
| Self-Employed (Not Incorporated) | 33 | 16.8% |
| Not-for-profit Organizations | 14 | 7.1% |
| Local Government Employees | 13 | 6.6% |
| State Government Employees | 0 | 0.0% |
| Federal Government Employees | 0 | 0.0% |
| Unpaid Family Workers | 0 | 0.0% |
| Total | 197 | 100.0% |
Employment Status by Age in Buckhead Ridge
According to the labor force statistics for Buckhead Ridge, out of the total population over 16 years of age (1,028), 24.5% or 252 individuals are in the labor force, with 12.7% or 32 of them unemployed. The age group with the highest labor force participation rate is 20 to 24 years, with 100.0% or 6 individuals in the labor force. Within the labor force, the 20 to 24 years age range has the highest percentage of unemployed individuals, with 100.0% or 6 of them being unemployed.
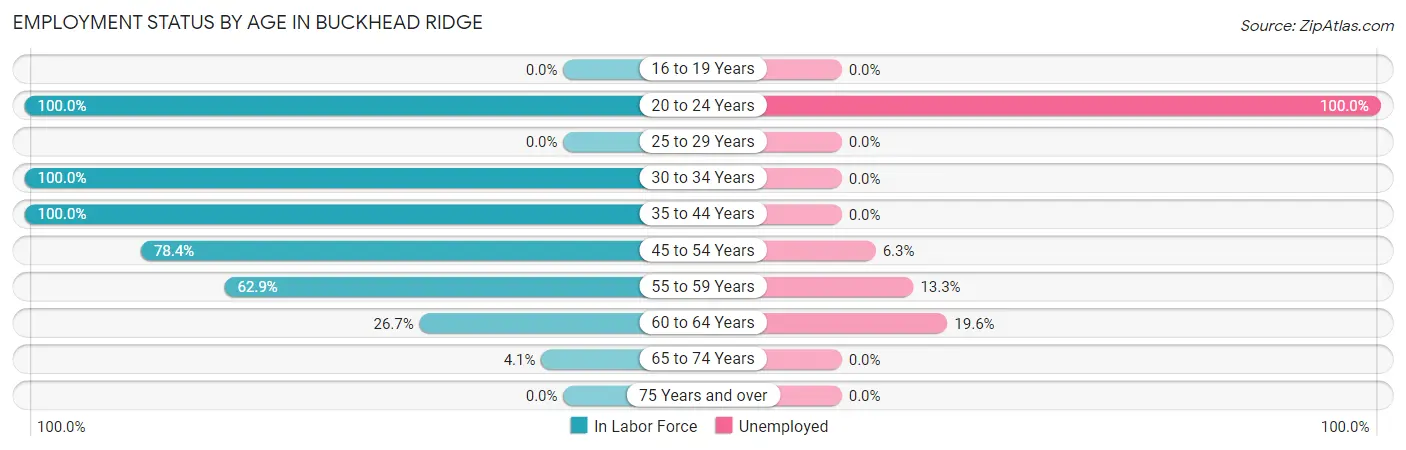
| Age Bracket | In Labor Force | Unemployed |
| 16 to 19 Years | 0 (0.0%) | 0 (0.0%) |
| 20 to 24 Years | 6 (100.0%) | 6 (100.0%) |
| 25 to 29 Years | 0 (0.0%) | 0 (0.0%) |
| 30 to 34 Years | 10 (100.0%) | 0 (0.0%) |
| 35 to 44 Years | 13 (100.0%) | 0 (0.0%) |
| 45 to 54 Years | 80 (78.4%) | 5 (6.3%) |
| 55 to 59 Years | 83 (62.9%) | 11 (13.3%) |
| 60 to 64 Years | 51 (26.7%) | 10 (19.6%) |
| 65 to 74 Years | 9 (4.1%) | 0 (0.0%) |
| 75 Years and over | 0 (0.0%) | 0 (0.0%) |
| Total | 252 (24.5%) | 32 (12.7%) |
Employment Status by Educational Attainment in Buckhead Ridge
According to labor force statistics for Buckhead Ridge, 52.9% of individuals (237) out of the total population between 25 and 64 years of age (448) are in the labor force, with 11.0% or 26 of them being unemployed. The group with the highest labor force participation rate are those with the educational attainment of bachelor's degree or higher, with 100.0% or 10 individuals in the labor force. Within the labor force, individuals with high school diploma education have the highest percentage of unemployment, with 28.0% or 26 of them being unemployed.
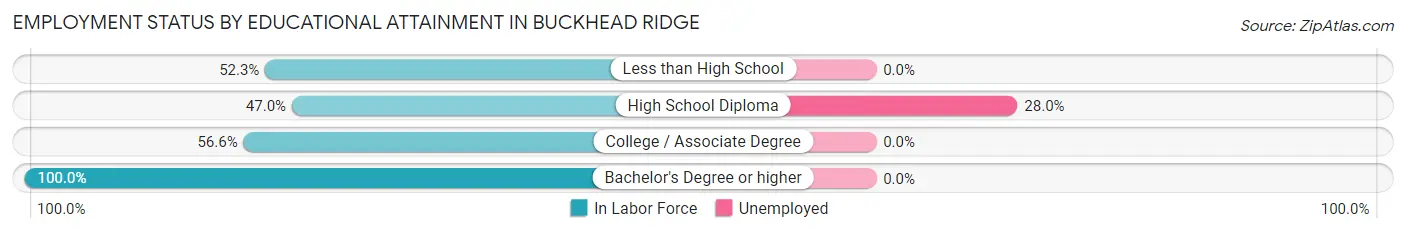
| Educational Attainment | In Labor Force | Unemployed |
| Less than High School | 23 (52.3%) | 0 (0.0%) |
| High School Diploma | 93 (47.0%) | 55 (28.0%) |
| College / Associate Degree | 111 (56.6%) | 0 (0.0%) |
| Bachelor's Degree or higher | 10 (100.0%) | 0 (0.0%) |
| Total | 237 (52.9%) | 49 (11.0%) |
Employment Occupations by Sex in Buckhead Ridge
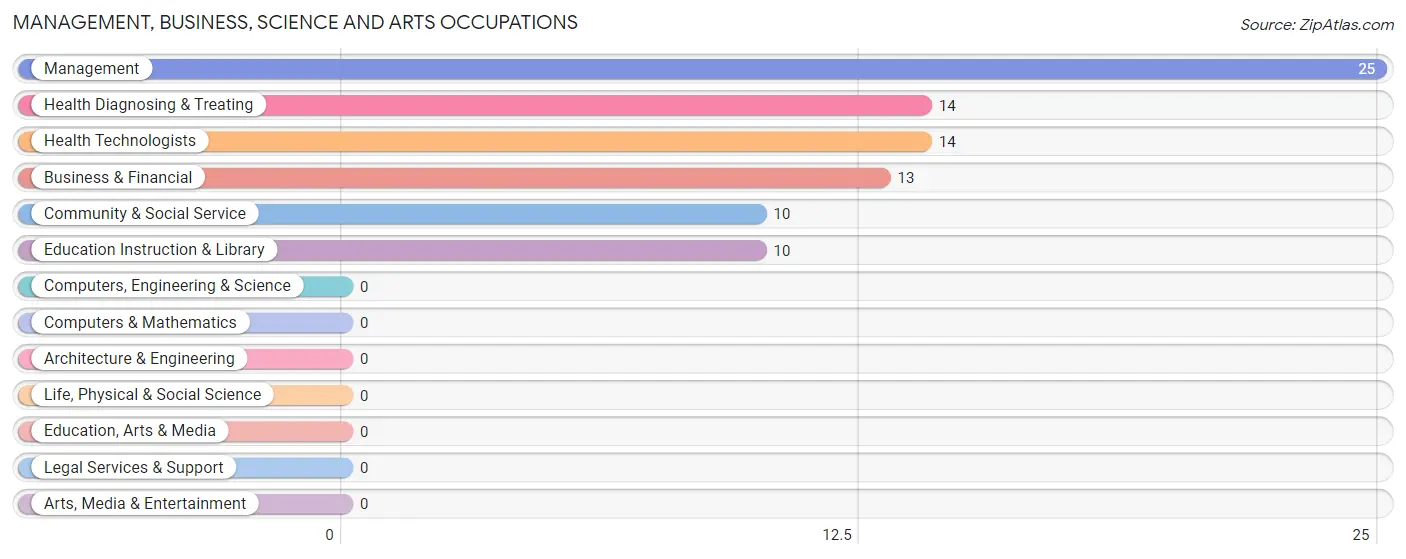
Management, Business, Science and Arts Occupations
The most common Management, Business, Science and Arts occupations in Buckhead Ridge are Management (25 | 11.4%), Health Diagnosing & Treating (14 | 6.4%), Health Technologists (14 | 6.4%), Business & Financial (13 | 5.9%), and Community & Social Service (10 | 4.5%).
Management, Business, Science and Arts Occupations by Sex
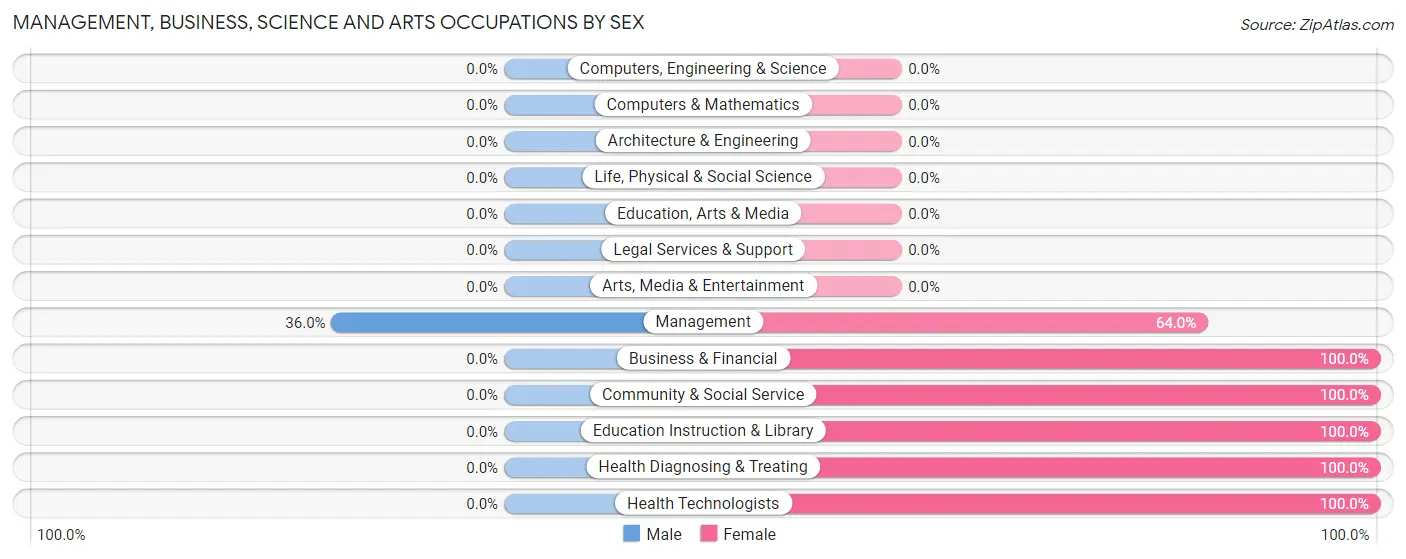
| Occupation | Male | Female |
| Management | 9 (36.0%) | 16 (64.0%) |
| Business & Financial | 0 (0.0%) | 13 (100.0%) |
| Computers, Engineering & Science | 0 (0.0%) | 0 (0.0%) |
| Computers & Mathematics | 0 (0.0%) | 0 (0.0%) |
| Architecture & Engineering | 0 (0.0%) | 0 (0.0%) |
| Life, Physical & Social Science | 0 (0.0%) | 0 (0.0%) |
| Community & Social Service | 0 (0.0%) | 10 (100.0%) |
| Education, Arts & Media | 0 (0.0%) | 0 (0.0%) |
| Legal Services & Support | 0 (0.0%) | 0 (0.0%) |
| Education Instruction & Library | 0 (0.0%) | 10 (100.0%) |
| Arts, Media & Entertainment | 0 (0.0%) | 0 (0.0%) |
| Health Diagnosing & Treating | 0 (0.0%) | 14 (100.0%) |
| Health Technologists | 0 (0.0%) | 14 (100.0%) |
| Total (Category) | 9 (14.5%) | 53 (85.5%) |
| Total (Overall) | 138 (62.7%) | 82 (37.3%) |
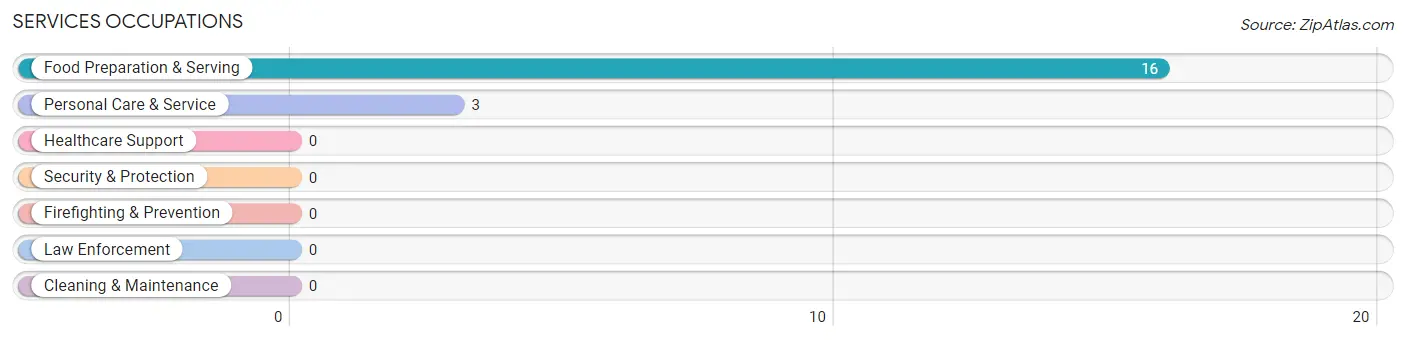
Services Occupations
The most common Services occupations in Buckhead Ridge are Food Preparation & Serving (16 | 7.3%), and Personal Care & Service (3 | 1.4%).
Services Occupations by Sex
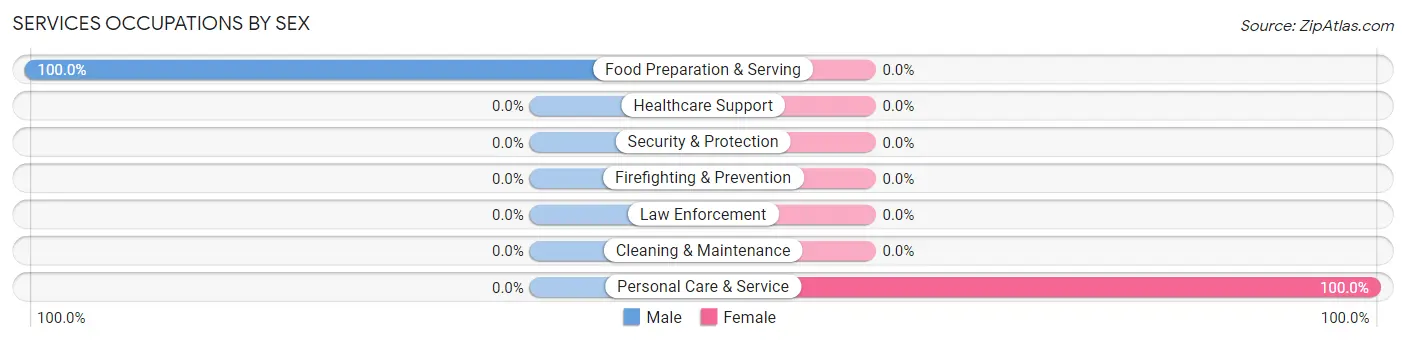
| Occupation | Male | Female |
| Healthcare Support | 0 (0.0%) | 0 (0.0%) |
| Security & Protection | 0 (0.0%) | 0 (0.0%) |
| Firefighting & Prevention | 0 (0.0%) | 0 (0.0%) |
| Law Enforcement | 0 (0.0%) | 0 (0.0%) |
| Food Preparation & Serving | 16 (100.0%) | 0 (0.0%) |
| Cleaning & Maintenance | 0 (0.0%) | 0 (0.0%) |
| Personal Care & Service | 0 (0.0%) | 3 (100.0%) |
| Total (Category) | 16 (84.2%) | 3 (15.8%) |
| Total (Overall) | 138 (62.7%) | 82 (37.3%) |
Sales and Office Occupations
The most common Sales and Office occupations in Buckhead Ridge are , and Sales & Related (32 | 14.5%).
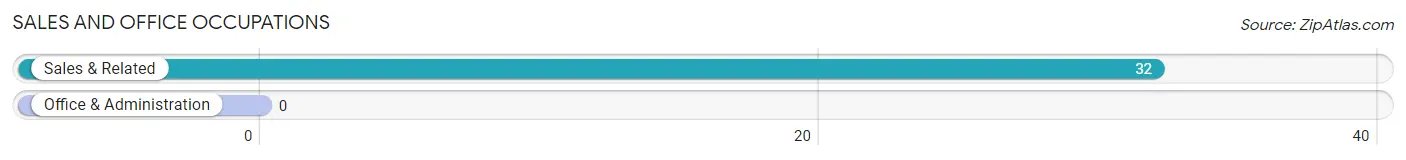
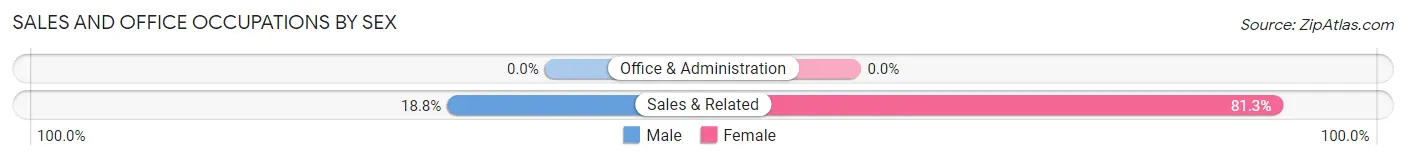
Sales and Office Occupations by Sex
| Occupation | Male | Female |
| Sales & Related | 6 (18.8%) | 26 (81.2%) |
| Office & Administration | 0 (0.0%) | 0 (0.0%) |
| Total (Category) | 6 (18.8%) | 26 (81.2%) |
| Total (Overall) | 138 (62.7%) | 82 (37.3%) |
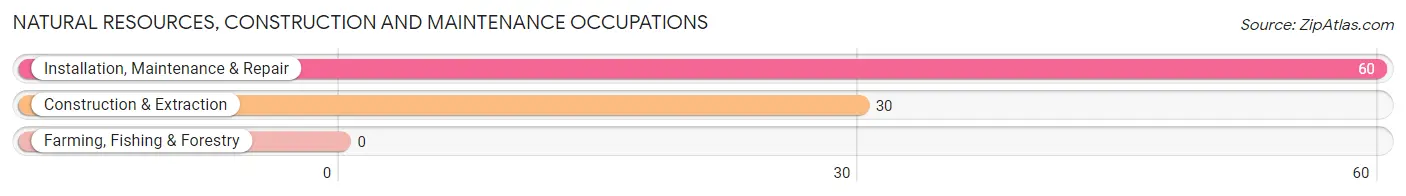
Natural Resources, Construction and Maintenance Occupations
The most common Natural Resources, Construction and Maintenance occupations in Buckhead Ridge are Installation, Maintenance & Repair (60 | 27.3%), and Construction & Extraction (30 | 13.6%).
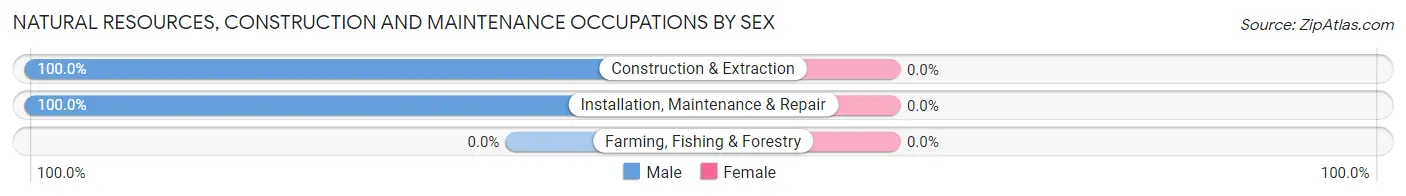
Natural Resources, Construction and Maintenance Occupations by Sex
| Occupation | Male | Female |
| Farming, Fishing & Forestry | 0 (0.0%) | 0 (0.0%) |
| Construction & Extraction | 30 (100.0%) | 0 (0.0%) |
| Installation, Maintenance & Repair | 60 (100.0%) | 0 (0.0%) |
| Total (Category) | 90 (100.0%) | 0 (0.0%) |
| Total (Overall) | 138 (62.7%) | 82 (37.3%) |
Production, Transportation and Moving Occupations
The most common Production, Transportation and Moving occupations in Buckhead Ridge are , and Material Moving (17 | 7.7%).
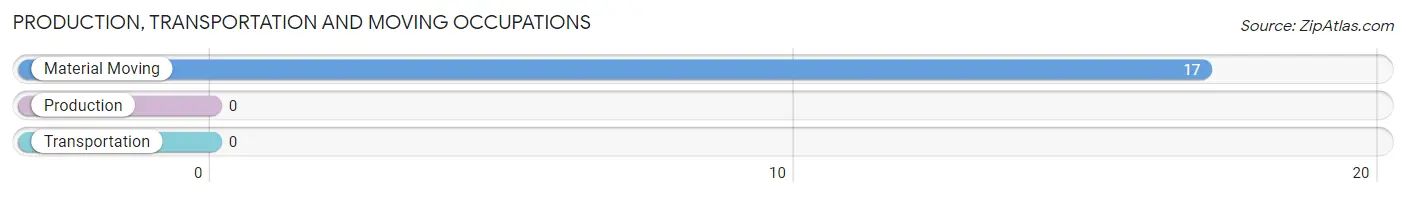
Production, Transportation and Moving Occupations by Sex
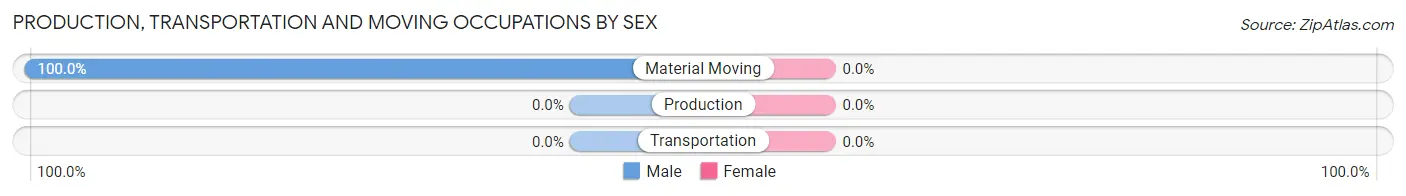
| Occupation | Male | Female |
| Production | 0 (0.0%) | 0 (0.0%) |
| Transportation | 0 (0.0%) | 0 (0.0%) |
| Material Moving | 17 (100.0%) | 0 (0.0%) |
| Total (Category) | 17 (100.0%) | 0 (0.0%) |
| Total (Overall) | 138 (62.7%) | 82 (37.3%) |
Employment Industries by Sex in Buckhead Ridge
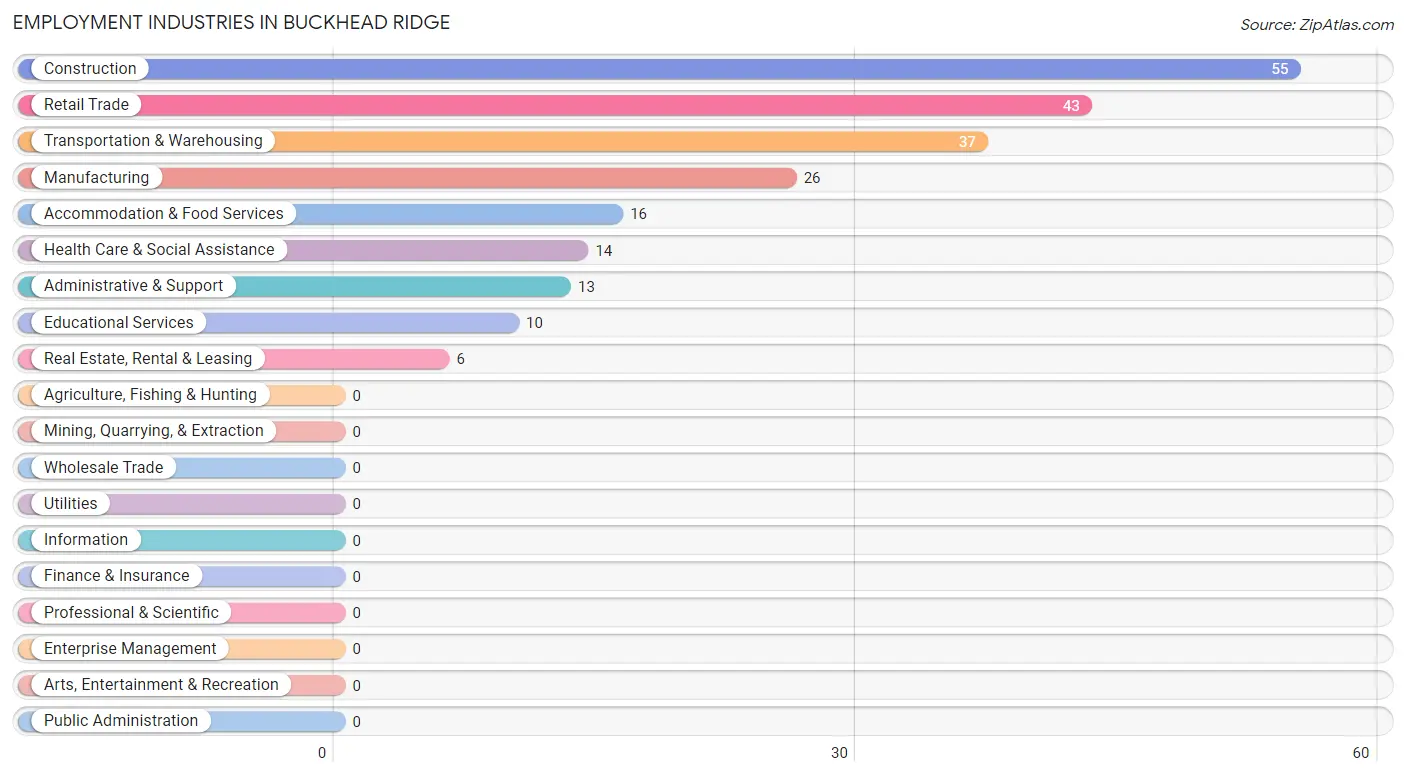
Employment Industries in Buckhead Ridge
The major employment industries in Buckhead Ridge include Construction (55 | 25.0%), Retail Trade (43 | 19.6%), Transportation & Warehousing (37 | 16.8%), Manufacturing (26 | 11.8%), and Accommodation & Food Services (16 | 7.3%).
Employment Industries by Sex in Buckhead Ridge
The Buckhead Ridge industries that see more men than women are Manufacturing (100.0%), Real Estate, Rental & Leasing (100.0%), and Accommodation & Food Services (100.0%), whereas the industries that tend to have a higher number of women are Educational Services (100.0%), Health Care & Social Assistance (100.0%), and Retail Trade (60.5%).
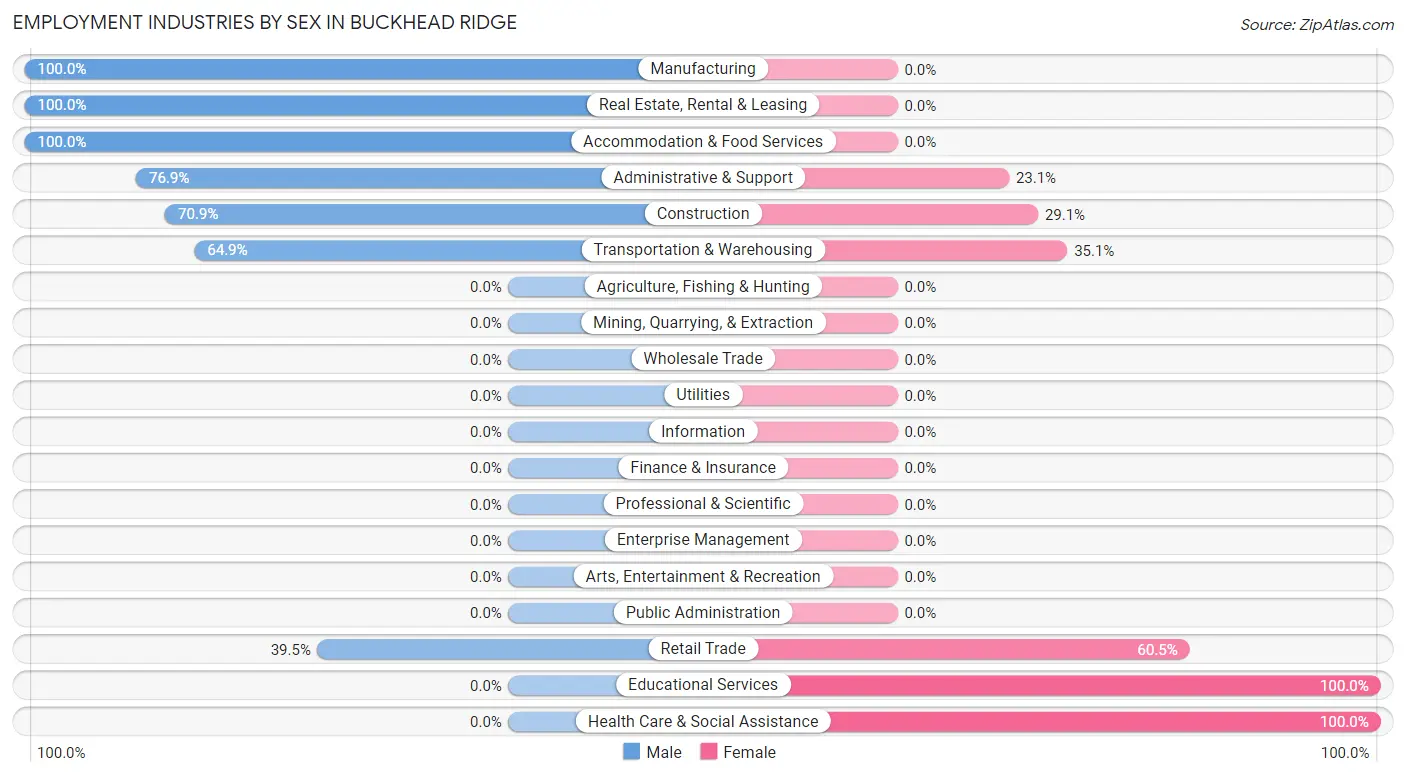
| Industry | Male | Female |
| Agriculture, Fishing & Hunting | 0 (0.0%) | 0 (0.0%) |
| Mining, Quarrying, & Extraction | 0 (0.0%) | 0 (0.0%) |
| Construction | 39 (70.9%) | 16 (29.1%) |
| Manufacturing | 26 (100.0%) | 0 (0.0%) |
| Wholesale Trade | 0 (0.0%) | 0 (0.0%) |
| Retail Trade | 17 (39.5%) | 26 (60.5%) |
| Transportation & Warehousing | 24 (64.9%) | 13 (35.1%) |
| Utilities | 0 (0.0%) | 0 (0.0%) |
| Information | 0 (0.0%) | 0 (0.0%) |
| Finance & Insurance | 0 (0.0%) | 0 (0.0%) |
| Real Estate, Rental & Leasing | 6 (100.0%) | 0 (0.0%) |
| Professional & Scientific | 0 (0.0%) | 0 (0.0%) |
| Enterprise Management | 0 (0.0%) | 0 (0.0%) |
| Administrative & Support | 10 (76.9%) | 3 (23.1%) |
| Educational Services | 0 (0.0%) | 10 (100.0%) |
| Health Care & Social Assistance | 0 (0.0%) | 14 (100.0%) |
| Arts, Entertainment & Recreation | 0 (0.0%) | 0 (0.0%) |
| Accommodation & Food Services | 16 (100.0%) | 0 (0.0%) |
| Public Administration | 0 (0.0%) | 0 (0.0%) |
| Total | 138 (62.7%) | 82 (37.3%) |
Education in Buckhead Ridge
School Enrollment in Buckhead Ridge
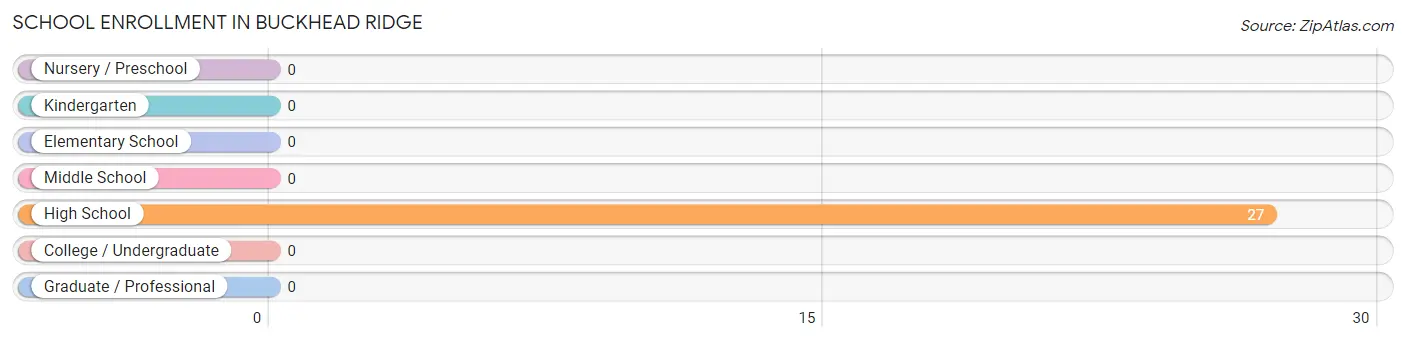
| School Level | # Students | % Students |
| Nursery / Preschool | 0 | 0.0% |
| Kindergarten | 0 | 0.0% |
| Elementary School | 0 | 0.0% |
| Middle School | 0 | 0.0% |
| High School | 27 | 100.0% |
| College / Undergraduate | 0 | 0.0% |
| Graduate / Professional | 0 | 0.0% |
| Total | 27 | 100.0% |
School Enrollment by Age by Funding Source in Buckhead Ridge
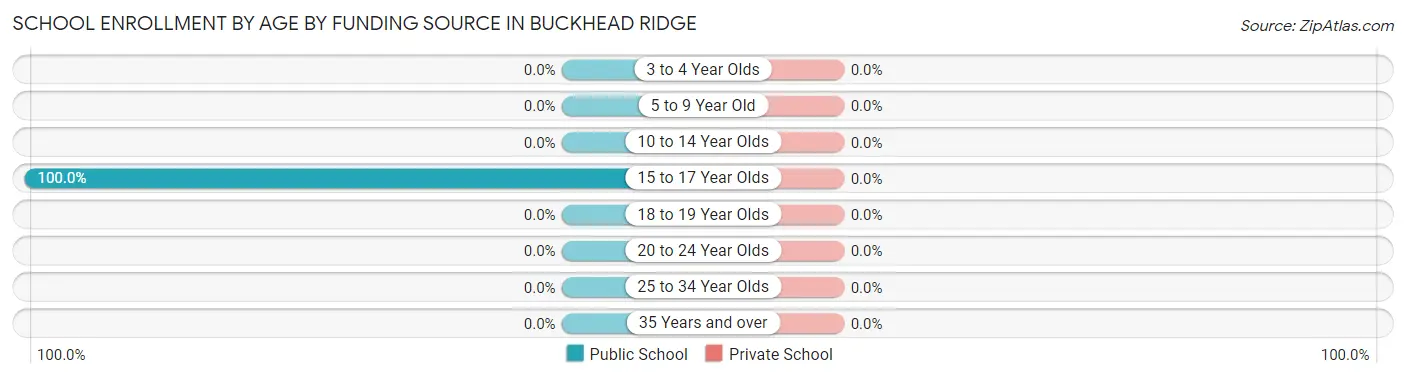
| Age Bracket | Public School | Private School |
| 3 to 4 Year Olds | 0 (0.0%) | 0 (0.0%) |
| 5 to 9 Year Old | 0 (0.0%) | 0 (0.0%) |
| 10 to 14 Year Olds | 0 (0.0%) | 0 (0.0%) |
| 15 to 17 Year Olds | 27 (100.0%) | 0 (0.0%) |
| 18 to 19 Year Olds | 0 (0.0%) | 0 (0.0%) |
| 20 to 24 Year Olds | 0 (0.0%) | 0 (0.0%) |
| 25 to 34 Year Olds | 0 (0.0%) | 0 (0.0%) |
| 35 Years and over | 0 (0.0%) | 0 (0.0%) |
| Total | 27 (100.0%) | 0 (0.0%) |
Educational Attainment by Field of Study in Buckhead Ridge
Education (10 | 29.4%), literature & languages (10 | 29.4%), social sciences (7 | 20.6%), and liberal arts & history (7 | 20.6%) are the most common fields of study among 34 individuals in Buckhead Ridge who have obtained a bachelor's degree or higher.
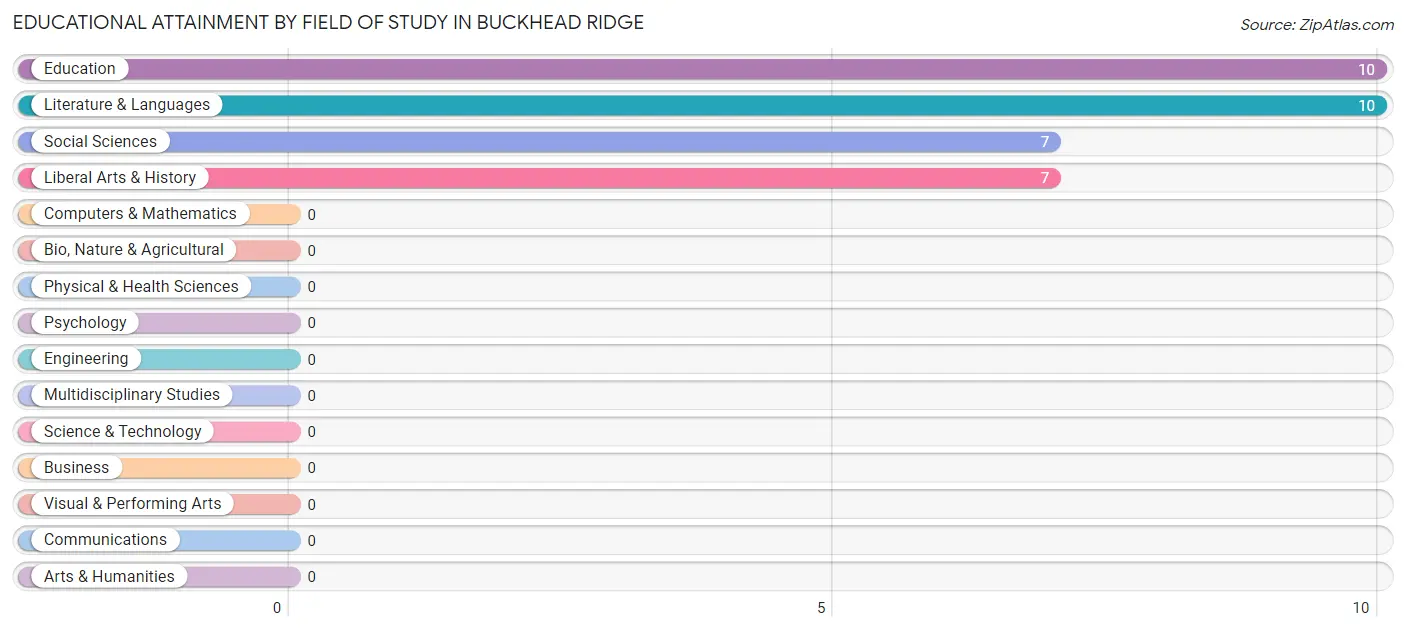
| Field of Study | # Graduates | % Graduates |
| Computers & Mathematics | 0 | 0.0% |
| Bio, Nature & Agricultural | 0 | 0.0% |
| Physical & Health Sciences | 0 | 0.0% |
| Psychology | 0 | 0.0% |
| Social Sciences | 7 | 20.6% |
| Engineering | 0 | 0.0% |
| Multidisciplinary Studies | 0 | 0.0% |
| Science & Technology | 0 | 0.0% |
| Business | 0 | 0.0% |
| Education | 10 | 29.4% |
| Literature & Languages | 10 | 29.4% |
| Liberal Arts & History | 7 | 20.6% |
| Visual & Performing Arts | 0 | 0.0% |
| Communications | 0 | 0.0% |
| Arts & Humanities | 0 | 0.0% |
| Total | 34 | 100.0% |
Transportation & Commute in Buckhead Ridge
Vehicle Availability by Sex in Buckhead Ridge
The most prevalent vehicle ownership categories in Buckhead Ridge are males with 2 vehicles (74, accounting for 64.3%) and females with 2 vehicles (50, making up 90.2%).
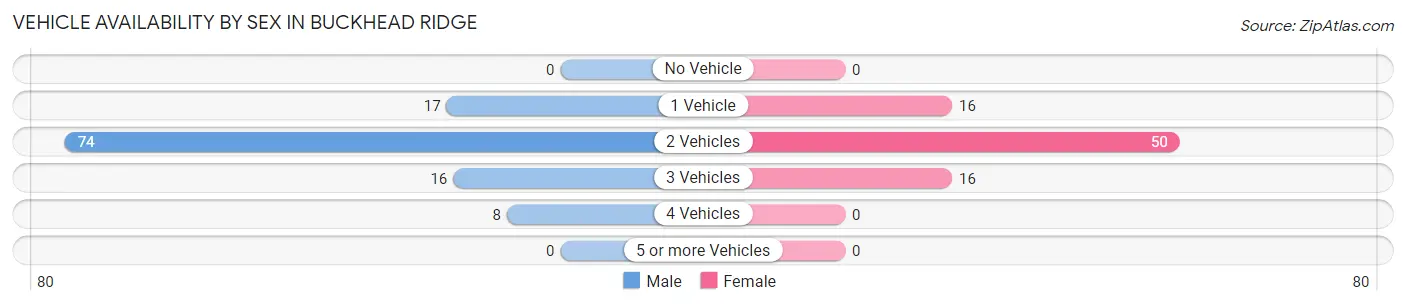
| Vehicles Available | Male | Female |
| No Vehicle | 0 (0.0%) | 0 (0.0%) |
| 1 Vehicle | 17 (14.8%) | 16 (19.5%) |
| 2 Vehicles | 74 (64.3%) | 50 (61.0%) |
| 3 Vehicles | 16 (13.9%) | 16 (19.5%) |
| 4 Vehicles | 8 (7.0%) | 0 (0.0%) |
| 5 or more Vehicles | 0 (0.0%) | 0 (0.0%) |
| Total | 115 (100.0%) | 82 (100.0%) |
Commute Time in Buckhead Ridge
The most frequently occuring commute durations in Buckhead Ridge are 5 to 9 minutes (40 commuters, 23.8%), 30 to 34 minutes (37 commuters, 22.0%), and 10 to 14 minutes (36 commuters, 21.4%).
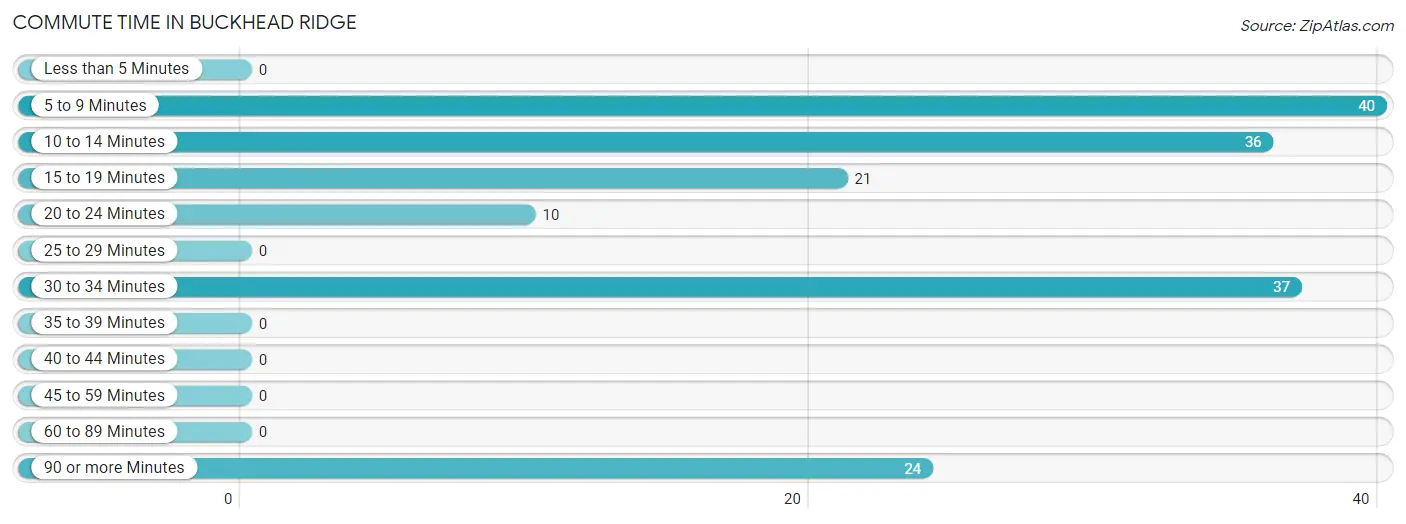
| Commute Time | # Commuters | % Commuters |
| Less than 5 Minutes | 0 | 0.0% |
| 5 to 9 Minutes | 40 | 23.8% |
| 10 to 14 Minutes | 36 | 21.4% |
| 15 to 19 Minutes | 21 | 12.5% |
| 20 to 24 Minutes | 10 | 5.9% |
| 25 to 29 Minutes | 0 | 0.0% |
| 30 to 34 Minutes | 37 | 22.0% |
| 35 to 39 Minutes | 0 | 0.0% |
| 40 to 44 Minutes | 0 | 0.0% |
| 45 to 59 Minutes | 0 | 0.0% |
| 60 to 89 Minutes | 0 | 0.0% |
| 90 or more Minutes | 24 | 14.3% |
Commute Time by Sex in Buckhead Ridge
The most common commute times in Buckhead Ridge are 30 to 34 minutes (37 commuters, 32.2%) for males and 5 to 9 minutes (40 commuters, 75.5%) for females.
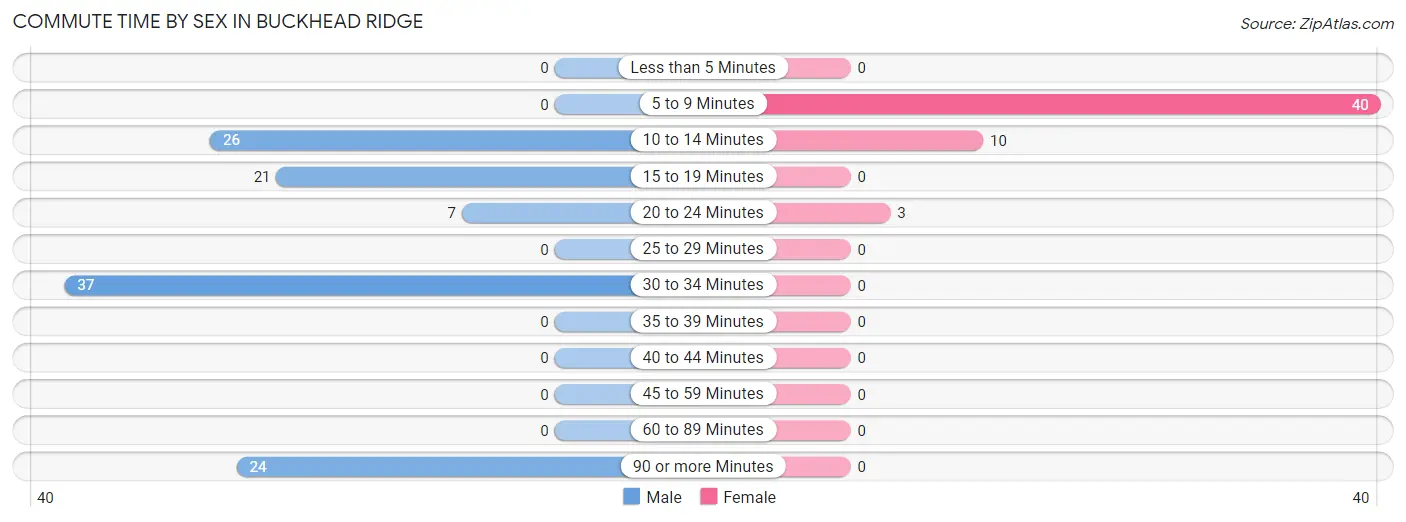
| Commute Time | Male | Female |
| Less than 5 Minutes | 0 (0.0%) | 0 (0.0%) |
| 5 to 9 Minutes | 0 (0.0%) | 40 (75.5%) |
| 10 to 14 Minutes | 26 (22.6%) | 10 (18.9%) |
| 15 to 19 Minutes | 21 (18.3%) | 0 (0.0%) |
| 20 to 24 Minutes | 7 (6.1%) | 3 (5.7%) |
| 25 to 29 Minutes | 0 (0.0%) | 0 (0.0%) |
| 30 to 34 Minutes | 37 (32.2%) | 0 (0.0%) |
| 35 to 39 Minutes | 0 (0.0%) | 0 (0.0%) |
| 40 to 44 Minutes | 0 (0.0%) | 0 (0.0%) |
| 45 to 59 Minutes | 0 (0.0%) | 0 (0.0%) |
| 60 to 89 Minutes | 0 (0.0%) | 0 (0.0%) |
| 90 or more Minutes | 24 (20.9%) | 0 (0.0%) |
Time of Departure to Work by Sex in Buckhead Ridge
The most frequent times of departure to work in Buckhead Ridge are 6:00 AM to 6:29 AM (45, 39.1%) for males and 6:30 AM to 6:59 AM (37, 69.8%) for females.
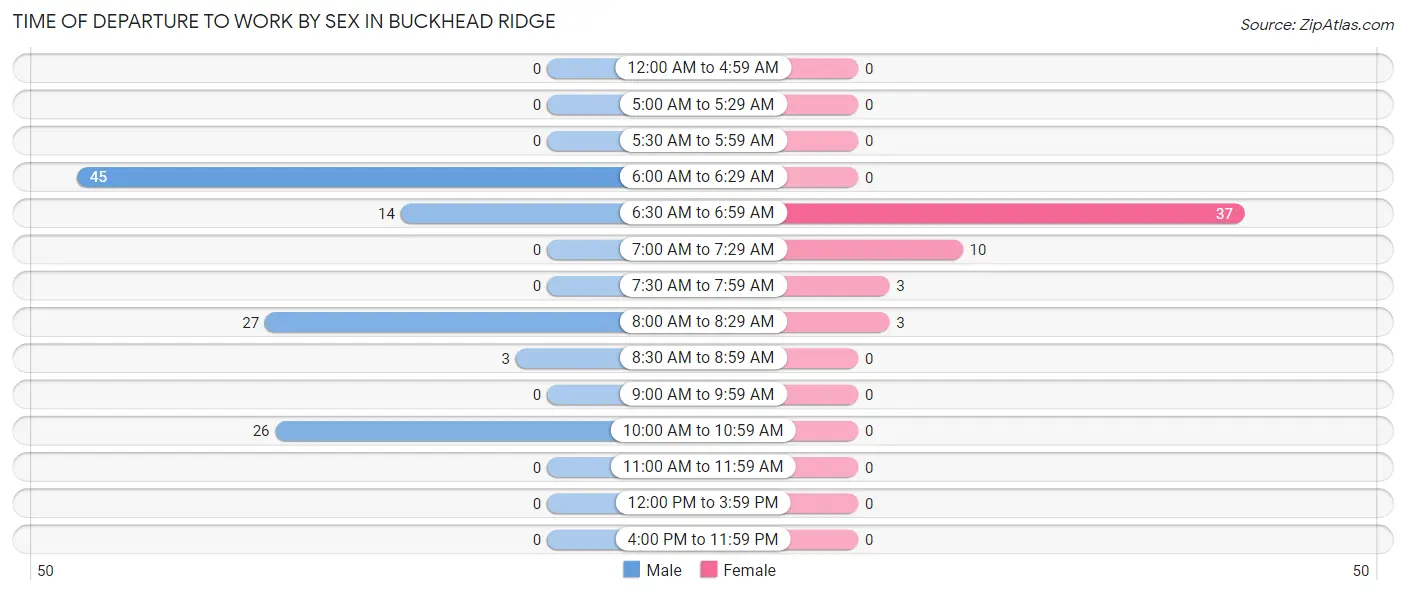
| Time of Departure | Male | Female |
| 12:00 AM to 4:59 AM | 0 (0.0%) | 0 (0.0%) |
| 5:00 AM to 5:29 AM | 0 (0.0%) | 0 (0.0%) |
| 5:30 AM to 5:59 AM | 0 (0.0%) | 0 (0.0%) |
| 6:00 AM to 6:29 AM | 45 (39.1%) | 0 (0.0%) |
| 6:30 AM to 6:59 AM | 14 (12.2%) | 37 (69.8%) |
| 7:00 AM to 7:29 AM | 0 (0.0%) | 10 (18.9%) |
| 7:30 AM to 7:59 AM | 0 (0.0%) | 3 (5.7%) |
| 8:00 AM to 8:29 AM | 27 (23.5%) | 3 (5.7%) |
| 8:30 AM to 8:59 AM | 3 (2.6%) | 0 (0.0%) |
| 9:00 AM to 9:59 AM | 0 (0.0%) | 0 (0.0%) |
| 10:00 AM to 10:59 AM | 26 (22.6%) | 0 (0.0%) |
| 11:00 AM to 11:59 AM | 0 (0.0%) | 0 (0.0%) |
| 12:00 PM to 3:59 PM | 0 (0.0%) | 0 (0.0%) |
| 4:00 PM to 11:59 PM | 0 (0.0%) | 0 (0.0%) |
| Total | 115 (100.0%) | 53 (100.0%) |
Housing Occupancy in Buckhead Ridge
Occupancy by Ownership in Buckhead Ridge
Of the total 535 dwellings in Buckhead Ridge, owner-occupied units account for 458 (85.6%), while renter-occupied units make up 77 (14.4%).
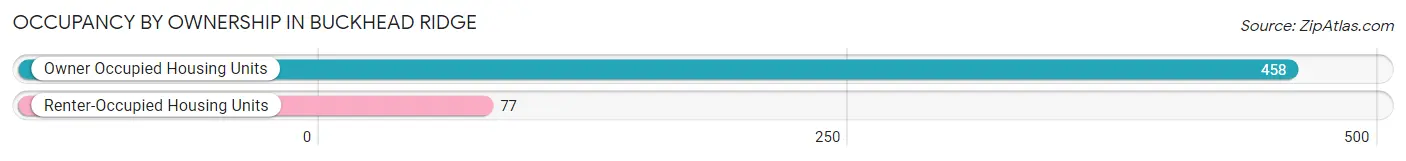
| Occupancy | # Housing Units | % Housing Units |
| Owner Occupied Housing Units | 458 | 85.6% |
| Renter-Occupied Housing Units | 77 | 14.4% |
| Total Occupied Housing Units | 535 | 100.0% |
Occupancy by Household Size in Buckhead Ridge
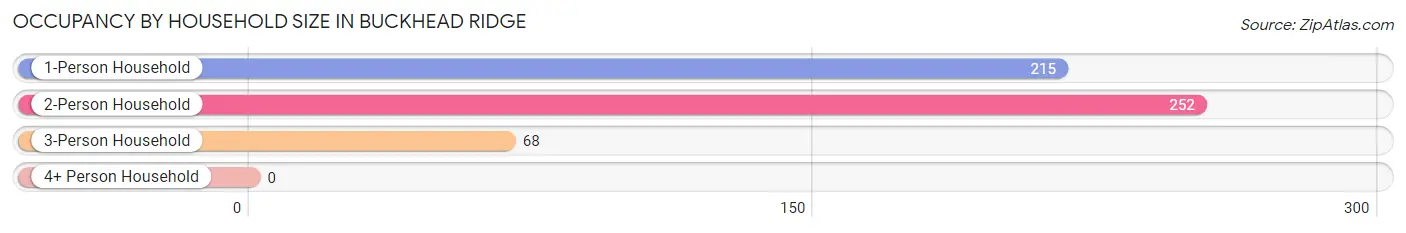
| Household Size | # Housing Units | % Housing Units |
| 1-Person Household | 215 | 40.2% |
| 2-Person Household | 252 | 47.1% |
| 3-Person Household | 68 | 12.7% |
| 4+ Person Household | 0 | 0.0% |
| Total Housing Units | 535 | 100.0% |
Occupancy by Ownership by Household Size in Buckhead Ridge
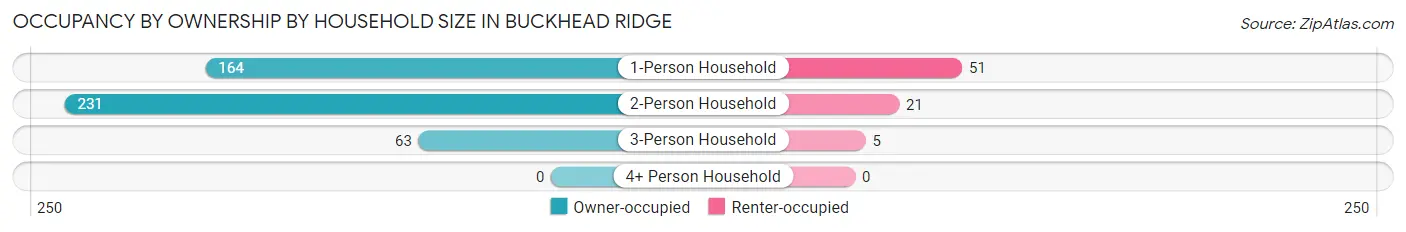
| Household Size | Owner-occupied | Renter-occupied |
| 1-Person Household | 164 (76.3%) | 51 (23.7%) |
| 2-Person Household | 231 (91.7%) | 21 (8.3%) |
| 3-Person Household | 63 (92.6%) | 5 (7.3%) |
| 4+ Person Household | 0 (0.0%) | 0 (0.0%) |
| Total Housing Units | 458 (85.6%) | 77 (14.4%) |
Occupancy by Educational Attainment in Buckhead Ridge
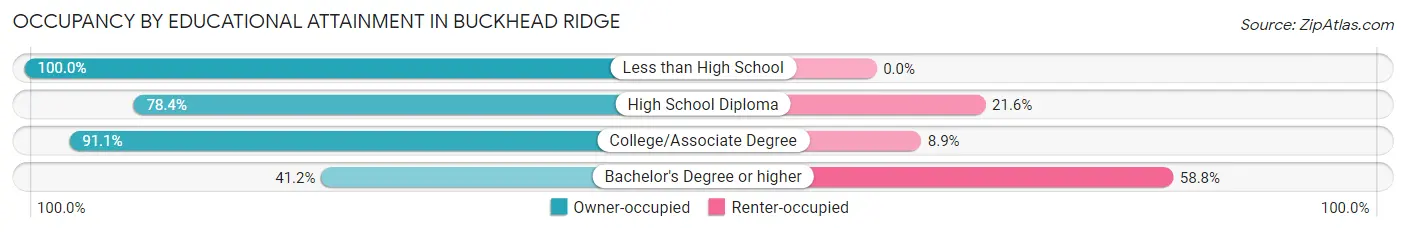
| Household Size | Owner-occupied | Renter-occupied |
| Less than High School | 68 (100.0%) | 0 (0.0%) |
| High School Diploma | 167 (78.4%) | 46 (21.6%) |
| College/Associate Degree | 216 (91.1%) | 21 (8.9%) |
| Bachelor's Degree or higher | 7 (41.2%) | 10 (58.8%) |
Occupancy by Age of Householder in Buckhead Ridge
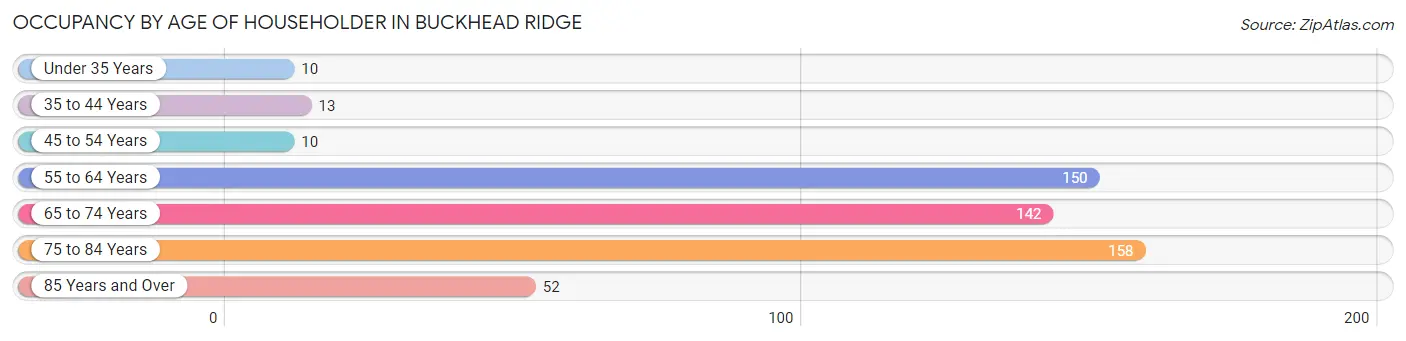
| Age Bracket | # Households | % Households |
| Under 35 Years | 10 | 1.9% |
| 35 to 44 Years | 13 | 2.4% |
| 45 to 54 Years | 10 | 1.9% |
| 55 to 64 Years | 150 | 28.0% |
| 65 to 74 Years | 142 | 26.5% |
| 75 to 84 Years | 158 | 29.5% |
| 85 Years and Over | 52 | 9.7% |
| Total | 535 | 100.0% |
Housing Finances in Buckhead Ridge
Median Income by Occupancy in Buckhead Ridge
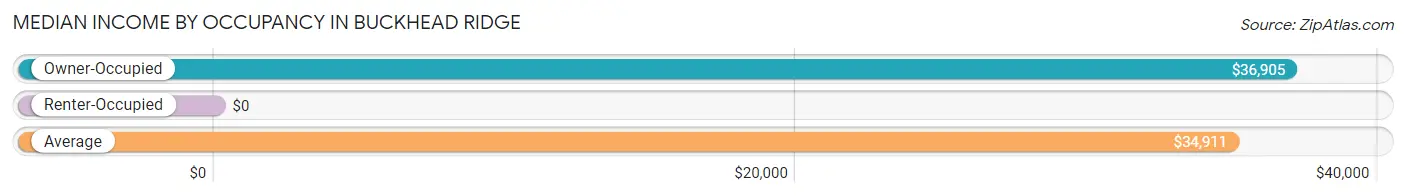
| Occupancy Type | # Households | Median Income |
| Owner-Occupied | 458 (85.6%) | $36,905 |
| Renter-Occupied | 77 (14.4%) | $0 |
| Average | 535 (100.0%) | $34,911 |
Occupancy by Householder Income Bracket in Buckhead Ridge
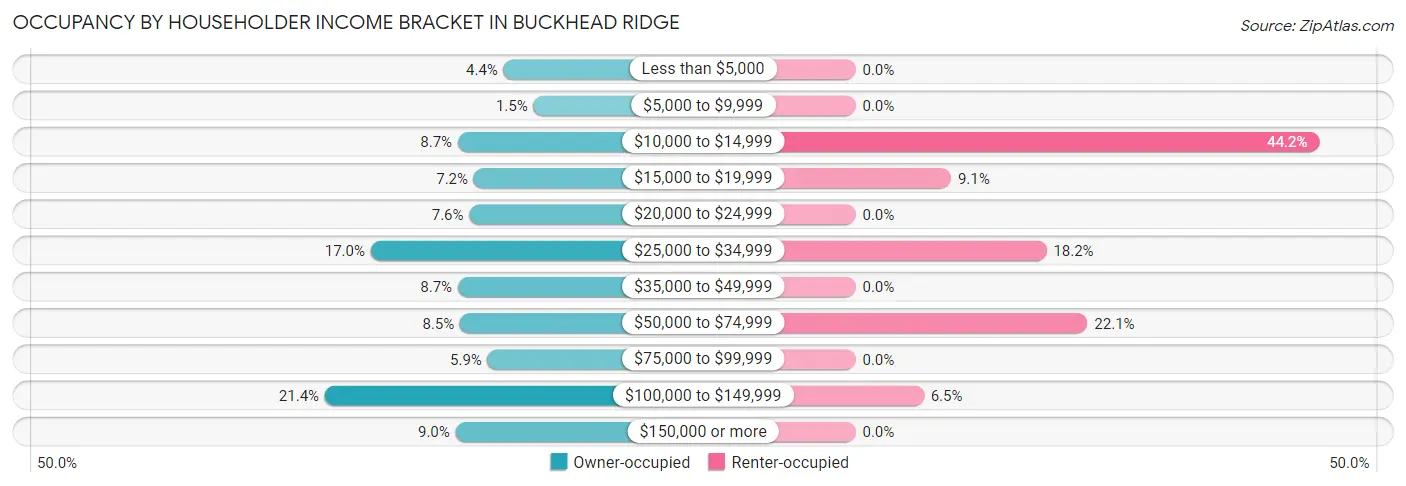
| Income Bracket | Owner-occupied | Renter-occupied |
| Less than $5,000 | 20 (4.4%) | 0 (0.0%) |
| $5,000 to $9,999 | 7 (1.5%) | 0 (0.0%) |
| $10,000 to $14,999 | 40 (8.7%) | 34 (44.2%) |
| $15,000 to $19,999 | 33 (7.2%) | 7 (9.1%) |
| $20,000 to $24,999 | 35 (7.6%) | 0 (0.0%) |
| $25,000 to $34,999 | 78 (17.0%) | 14 (18.2%) |
| $35,000 to $49,999 | 40 (8.7%) | 0 (0.0%) |
| $50,000 to $74,999 | 39 (8.5%) | 17 (22.1%) |
| $75,000 to $99,999 | 27 (5.9%) | 0 (0.0%) |
| $100,000 to $149,999 | 98 (21.4%) | 5 (6.5%) |
| $150,000 or more | 41 (8.9%) | 0 (0.0%) |
| Total | 458 (100.0%) | 77 (100.0%) |
Monthly Housing Cost Tiers in Buckhead Ridge
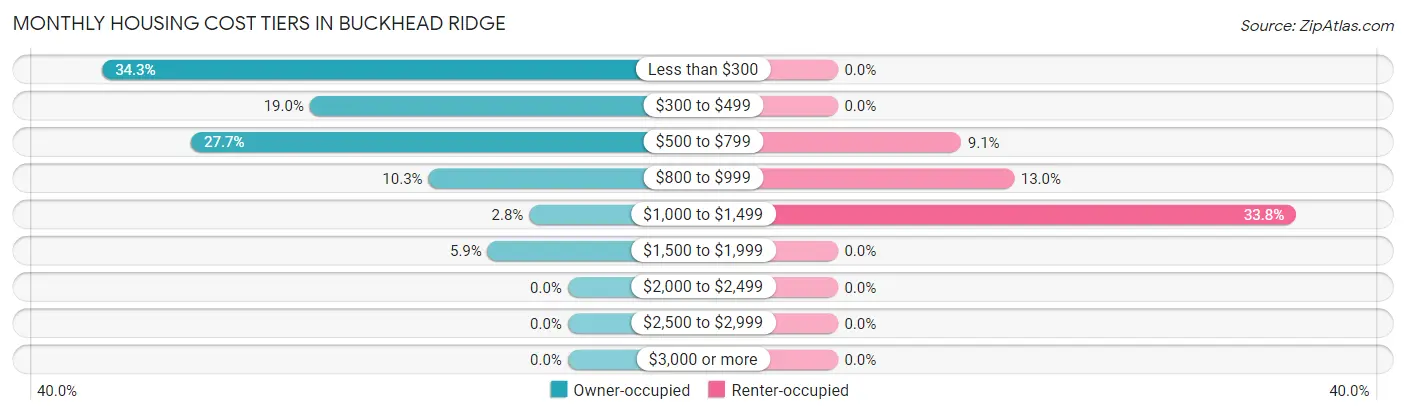
| Monthly Cost | Owner-occupied | Renter-occupied |
| Less than $300 | 157 (34.3%) | 0 (0.0%) |
| $300 to $499 | 87 (19.0%) | 0 (0.0%) |
| $500 to $799 | 127 (27.7%) | 7 (9.1%) |
| $800 to $999 | 47 (10.3%) | 10 (13.0%) |
| $1,000 to $1,499 | 13 (2.8%) | 26 (33.8%) |
| $1,500 to $1,999 | 27 (5.9%) | 0 (0.0%) |
| $2,000 to $2,499 | 0 (0.0%) | 0 (0.0%) |
| $2,500 to $2,999 | 0 (0.0%) | 0 (0.0%) |
| $3,000 or more | 0 (0.0%) | 0 (0.0%) |
| Total | 458 (100.0%) | 77 (100.0%) |
Physical Housing Characteristics in Buckhead Ridge
Housing Structures in Buckhead Ridge
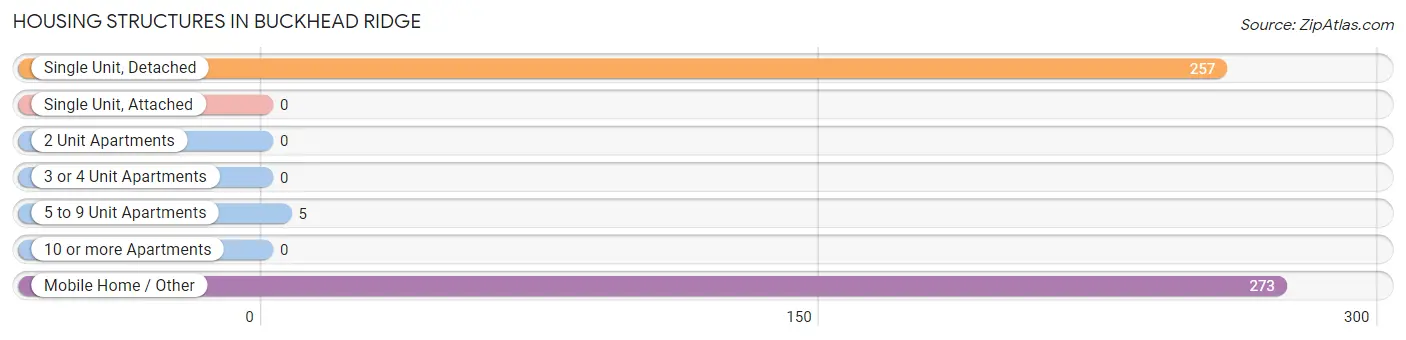
| Structure Type | # Housing Units | % Housing Units |
| Single Unit, Detached | 257 | 48.0% |
| Single Unit, Attached | 0 | 0.0% |
| 2 Unit Apartments | 0 | 0.0% |
| 3 or 4 Unit Apartments | 0 | 0.0% |
| 5 to 9 Unit Apartments | 5 | 0.9% |
| 10 or more Apartments | 0 | 0.0% |
| Mobile Home / Other | 273 | 51.0% |
| Total | 535 | 100.0% |
Housing Structures by Occupancy in Buckhead Ridge
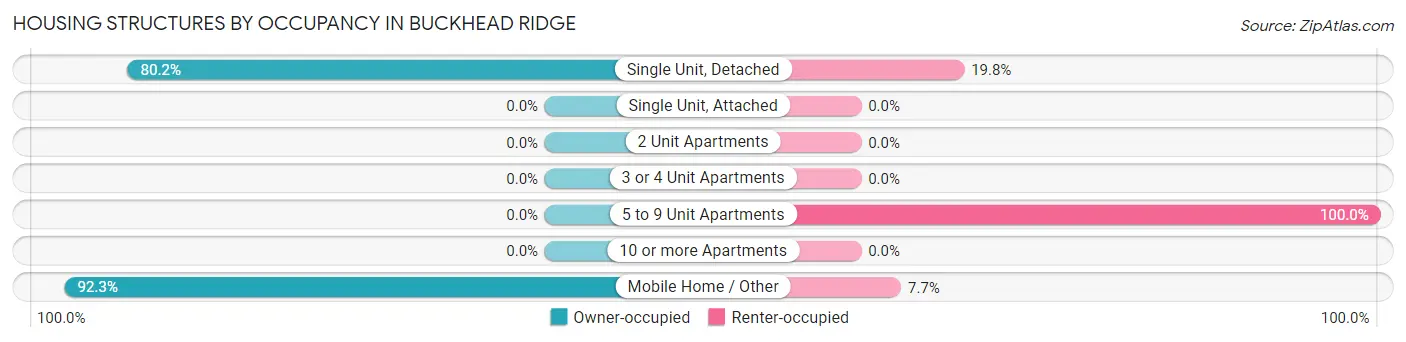
| Structure Type | Owner-occupied | Renter-occupied |
| Single Unit, Detached | 206 (80.2%) | 51 (19.8%) |
| Single Unit, Attached | 0 (0.0%) | 0 (0.0%) |
| 2 Unit Apartments | 0 (0.0%) | 0 (0.0%) |
| 3 or 4 Unit Apartments | 0 (0.0%) | 0 (0.0%) |
| 5 to 9 Unit Apartments | 0 (0.0%) | 5 (100.0%) |
| 10 or more Apartments | 0 (0.0%) | 0 (0.0%) |
| Mobile Home / Other | 252 (92.3%) | 21 (7.7%) |
| Total | 458 (85.6%) | 77 (14.4%) |
Housing Structures by Number of Rooms in Buckhead Ridge
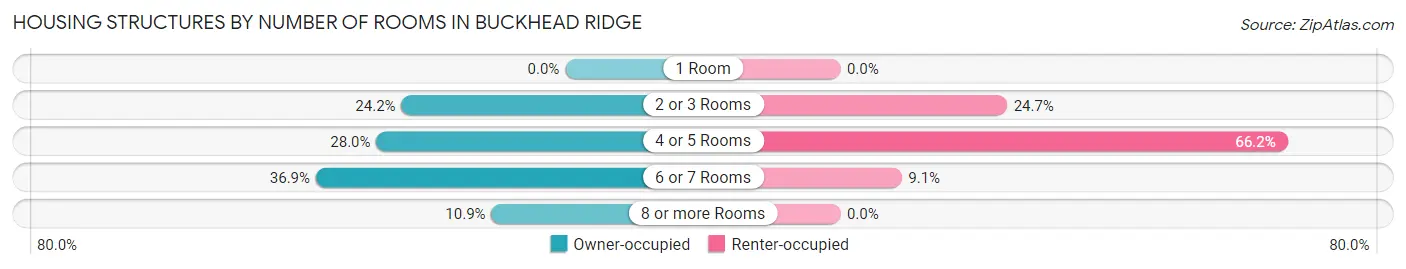
| Number of Rooms | Owner-occupied | Renter-occupied |
| 1 Room | 0 (0.0%) | 0 (0.0%) |
| 2 or 3 Rooms | 111 (24.2%) | 19 (24.7%) |
| 4 or 5 Rooms | 128 (28.0%) | 51 (66.2%) |
| 6 or 7 Rooms | 169 (36.9%) | 7 (9.1%) |
| 8 or more Rooms | 50 (10.9%) | 0 (0.0%) |
| Total | 458 (100.0%) | 77 (100.0%) |
Housing Structure by Heating Type in Buckhead Ridge
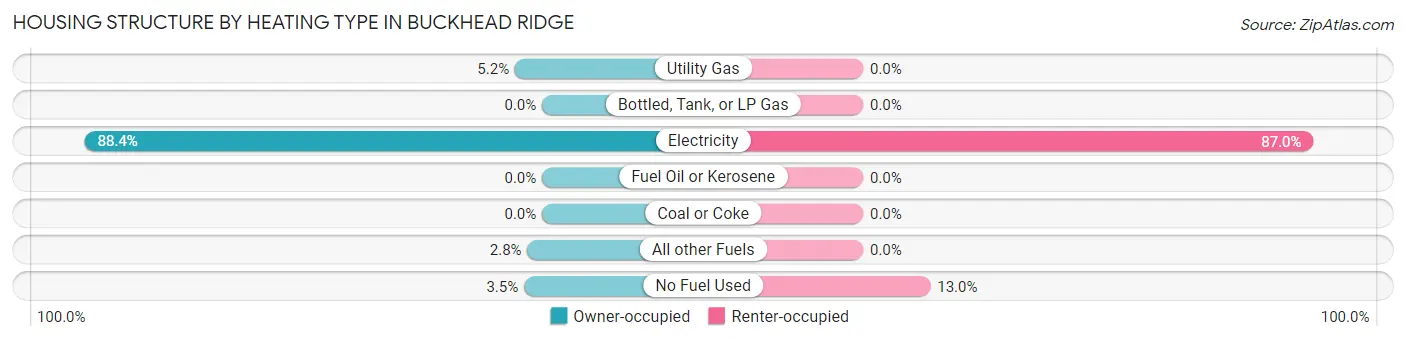
| Heating Type | Owner-occupied | Renter-occupied |
| Utility Gas | 24 (5.2%) | 0 (0.0%) |
| Bottled, Tank, or LP Gas | 0 (0.0%) | 0 (0.0%) |
| Electricity | 405 (88.4%) | 67 (87.0%) |
| Fuel Oil or Kerosene | 0 (0.0%) | 0 (0.0%) |
| Coal or Coke | 0 (0.0%) | 0 (0.0%) |
| All other Fuels | 13 (2.8%) | 0 (0.0%) |
| No Fuel Used | 16 (3.5%) | 10 (13.0%) |
| Total | 458 (100.0%) | 77 (100.0%) |
Household Vehicle Usage in Buckhead Ridge
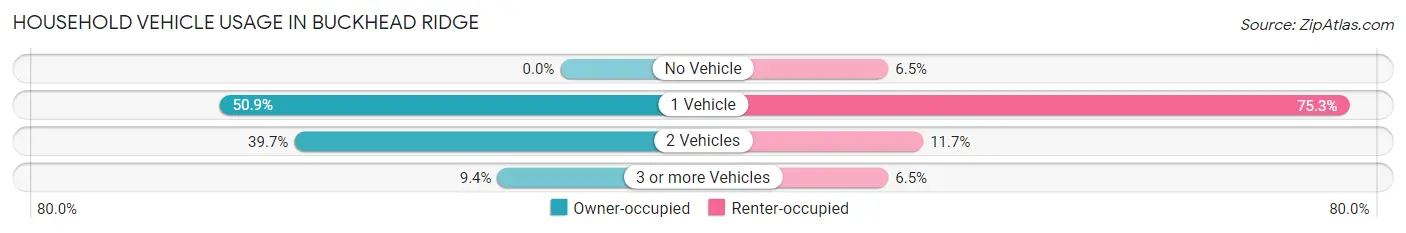
| Vehicles per Household | Owner-occupied | Renter-occupied |
| No Vehicle | 0 (0.0%) | 5 (6.5%) |
| 1 Vehicle | 233 (50.9%) | 58 (75.3%) |
| 2 Vehicles | 182 (39.7%) | 9 (11.7%) |
| 3 or more Vehicles | 43 (9.4%) | 5 (6.5%) |
| Total | 458 (100.0%) | 77 (100.0%) |
Real Estate & Mortgages in Buckhead Ridge
Real Estate and Mortgage Overview in Buckhead Ridge
| Characteristic | Without Mortgage | With Mortgage |
| Housing Units | 307 | 151 |
| Median Property Value | $104,500 | $153,400 |
| Median Household Income | $36,131 | $29 |
| Monthly Housing Costs | $297 | $0 |
| Real Estate Taxes | $867 | $0 |
Property Value by Mortgage Status in Buckhead Ridge
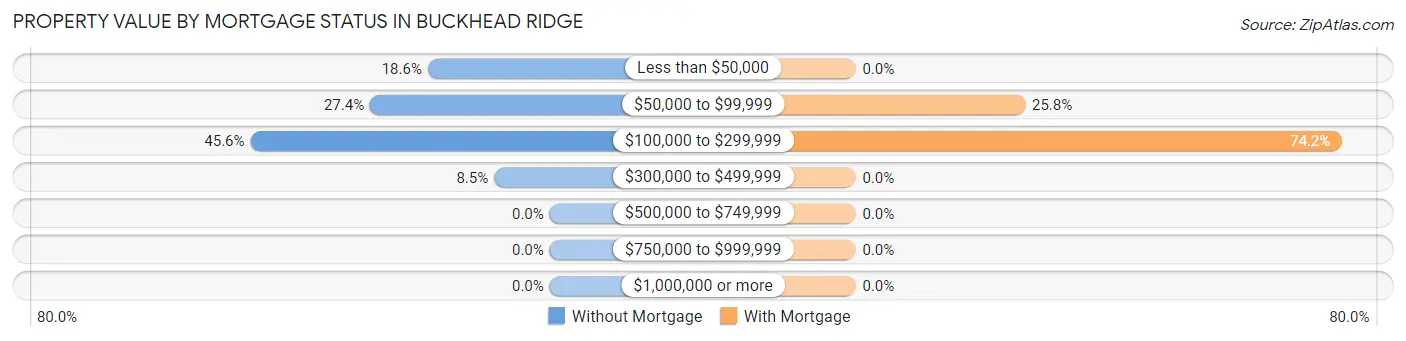
| Property Value | Without Mortgage | With Mortgage |
| Less than $50,000 | 57 (18.6%) | 0 (0.0%) |
| $50,000 to $99,999 | 84 (27.4%) | 39 (25.8%) |
| $100,000 to $299,999 | 140 (45.6%) | 112 (74.2%) |
| $300,000 to $499,999 | 26 (8.5%) | 0 (0.0%) |
| $500,000 to $749,999 | 0 (0.0%) | 0 (0.0%) |
| $750,000 to $999,999 | 0 (0.0%) | 0 (0.0%) |
| $1,000,000 or more | 0 (0.0%) | 0 (0.0%) |
| Total | 307 (100.0%) | 151 (100.0%) |
Household Income by Mortgage Status in Buckhead Ridge
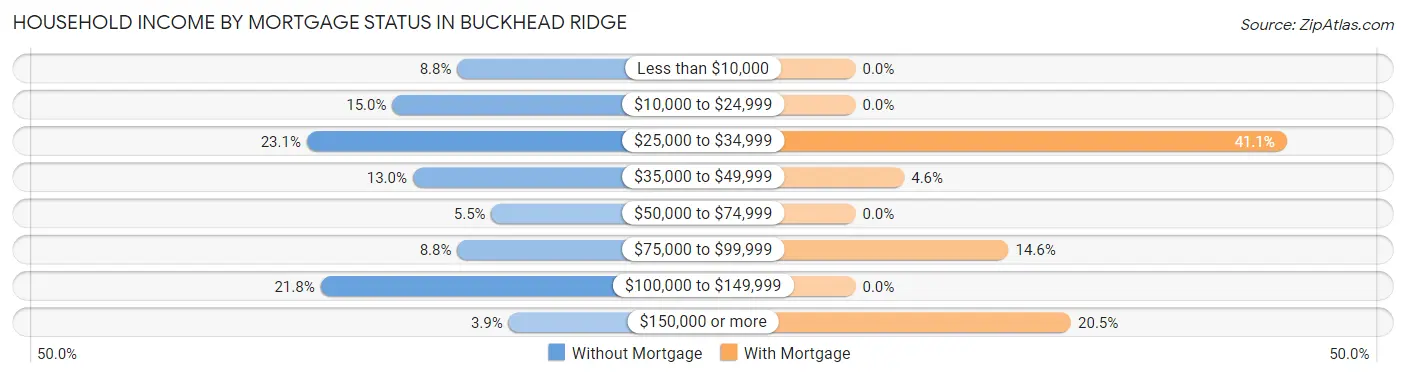
| Household Income | Without Mortgage | With Mortgage |
| Less than $10,000 | 27 (8.8%) | 0 (0.0%) |
| $10,000 to $24,999 | 46 (15.0%) | 0 (0.0%) |
| $25,000 to $34,999 | 71 (23.1%) | 62 (41.1%) |
| $35,000 to $49,999 | 40 (13.0%) | 7 (4.6%) |
| $50,000 to $74,999 | 17 (5.5%) | 0 (0.0%) |
| $75,000 to $99,999 | 27 (8.8%) | 22 (14.6%) |
| $100,000 to $149,999 | 67 (21.8%) | 0 (0.0%) |
| $150,000 or more | 12 (3.9%) | 31 (20.5%) |
| Total | 307 (100.0%) | 151 (100.0%) |
Property Value to Household Income Ratio in Buckhead Ridge
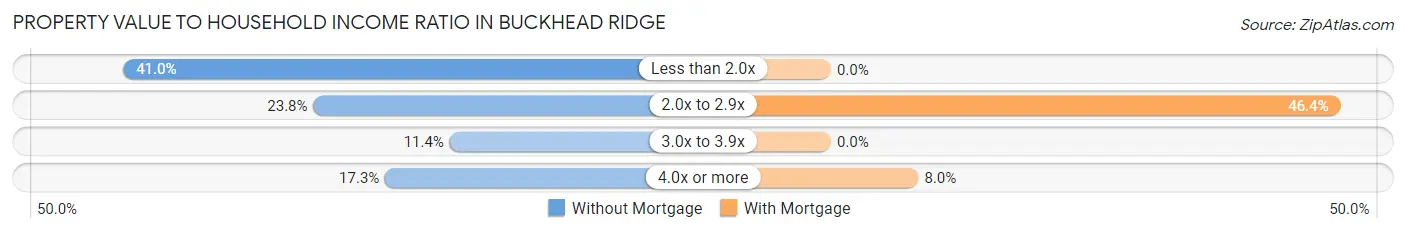
| Value-to-Income Ratio | Without Mortgage | With Mortgage |
| Less than 2.0x | 126 (41.0%) | 0 (0.0%) |
| 2.0x to 2.9x | 73 (23.8%) | 70 (46.4%) |
| 3.0x to 3.9x | 35 (11.4%) | 0 (0.0%) |
| 4.0x or more | 53 (17.3%) | 12 (8.0%) |
| Total | 307 (100.0%) | 151 (100.0%) |
Real Estate Taxes by Mortgage Status in Buckhead Ridge
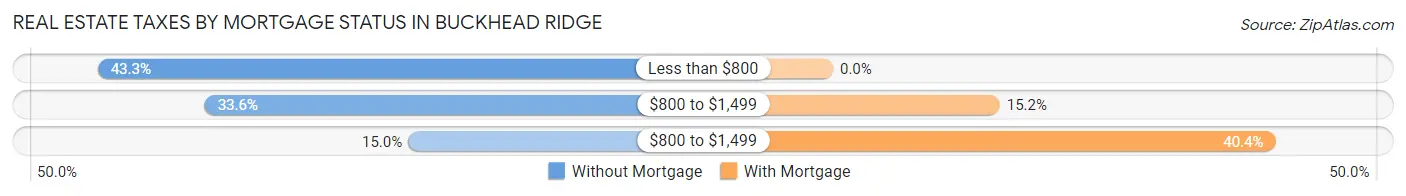
| Property Taxes | Without Mortgage | With Mortgage |
| Less than $800 | 133 (43.3%) | 0 (0.0%) |
| $800 to $1,499 | 103 (33.6%) | 23 (15.2%) |
| $800 to $1,499 | 46 (15.0%) | 61 (40.4%) |
| Total | 307 (100.0%) | 151 (100.0%) |
Health & Disability in Buckhead Ridge
Health Insurance Coverage by Age in Buckhead Ridge
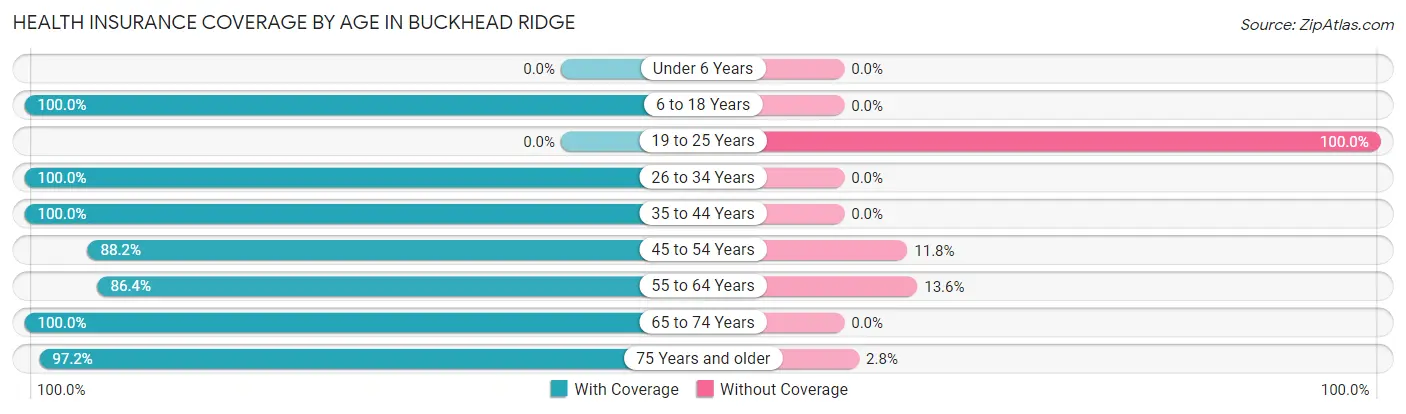
| Age Bracket | With Coverage | Without Coverage |
| Under 6 Years | 0 (0.0%) | 0 (0.0%) |
| 6 to 18 Years | 27 (100.0%) | 0 (0.0%) |
| 19 to 25 Years | 0 (0.0%) | 6 (100.0%) |
| 26 to 34 Years | 10 (100.0%) | 0 (0.0%) |
| 35 to 44 Years | 13 (100.0%) | 0 (0.0%) |
| 45 to 54 Years | 90 (88.2%) | 12 (11.8%) |
| 55 to 64 Years | 279 (86.4%) | 44 (13.6%) |
| 65 to 74 Years | 222 (100.0%) | 0 (0.0%) |
| 75 Years and older | 316 (97.2%) | 9 (2.8%) |
| Total | 957 (93.1%) | 71 (6.9%) |
Health Insurance Coverage by Citizenship Status in Buckhead Ridge
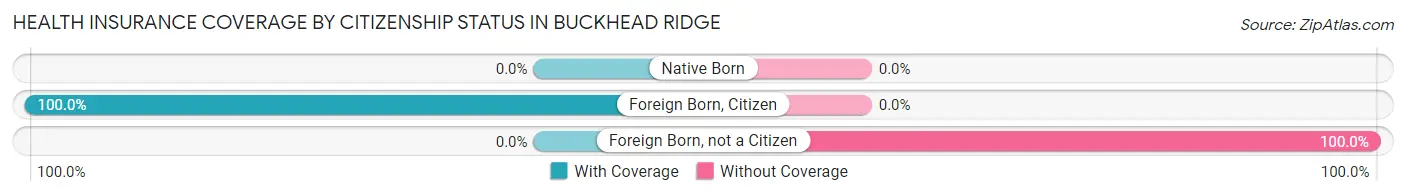
| Citizenship Status | With Coverage | Without Coverage |
| Native Born | 0 (0.0%) | 0 (0.0%) |
| Foreign Born, Citizen | 27 (100.0%) | 0 (0.0%) |
| Foreign Born, not a Citizen | 0 (0.0%) | 6 (100.0%) |
Health Insurance Coverage by Household Income in Buckhead Ridge
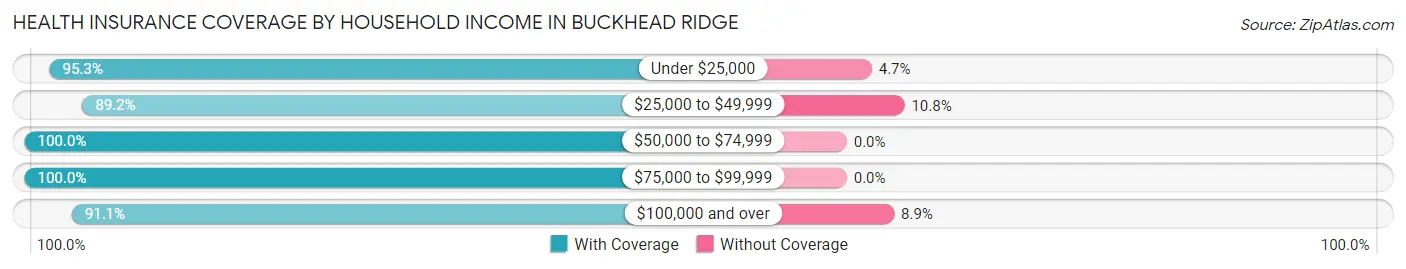
| Household Income | With Coverage | Without Coverage |
| Under $25,000 | 224 (95.3%) | 11 (4.7%) |
| $25,000 to $49,999 | 231 (89.2%) | 28 (10.8%) |
| $50,000 to $74,999 | 128 (100.0%) | 0 (0.0%) |
| $75,000 to $99,999 | 45 (100.0%) | 0 (0.0%) |
| $100,000 and over | 329 (91.1%) | 32 (8.9%) |
Public vs Private Health Insurance Coverage by Age in Buckhead Ridge
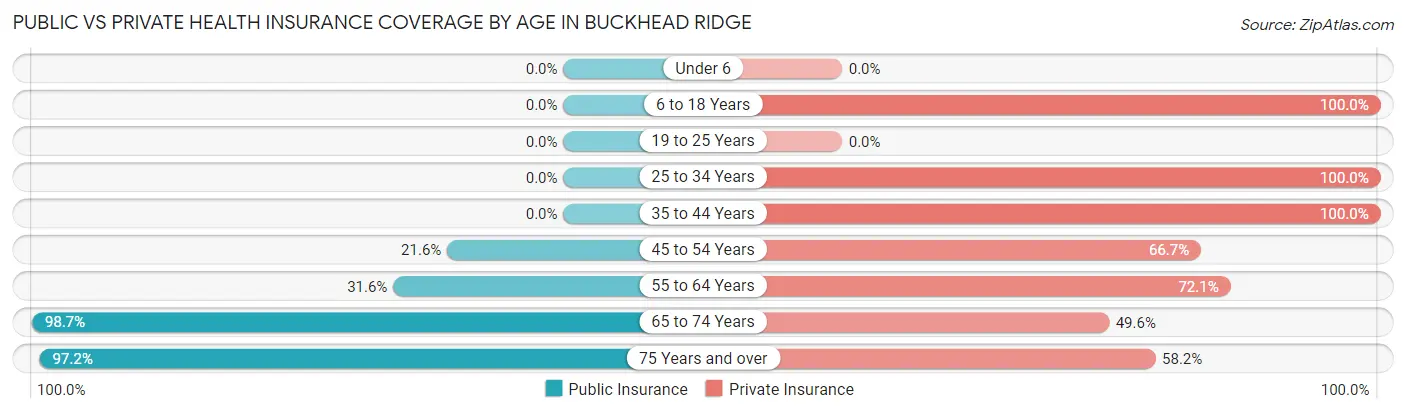
| Age Bracket | Public Insurance | Private Insurance |
| Under 6 | 0 (0.0%) | 0 (0.0%) |
| 6 to 18 Years | 0 (0.0%) | 27 (100.0%) |
| 19 to 25 Years | 0 (0.0%) | 0 (0.0%) |
| 25 to 34 Years | 0 (0.0%) | 10 (100.0%) |
| 35 to 44 Years | 0 (0.0%) | 13 (100.0%) |
| 45 to 54 Years | 22 (21.6%) | 68 (66.7%) |
| 55 to 64 Years | 102 (31.6%) | 233 (72.1%) |
| 65 to 74 Years | 219 (98.7%) | 110 (49.5%) |
| 75 Years and over | 316 (97.2%) | 189 (58.2%) |
| Total | 659 (64.1%) | 650 (63.2%) |
Disability Status by Sex by Age in Buckhead Ridge
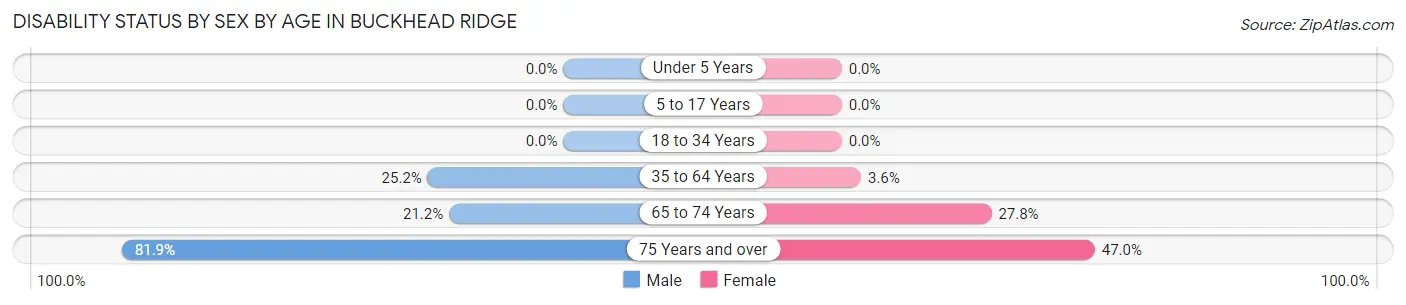
| Age Bracket | Male | Female |
| Under 5 Years | 0 (0.0%) | 0 (0.0%) |
| 5 to 17 Years | 0 (0.0%) | 0 (0.0%) |
| 18 to 34 Years | 0 (0.0%) | 0 (0.0%) |
| 35 to 64 Years | 68 (25.2%) | 6 (3.6%) |
| 65 to 74 Years | 28 (21.2%) | 25 (27.8%) |
| 75 Years and over | 118 (81.9%) | 85 (47.0%) |
Disability Class by Sex by Age in Buckhead Ridge
Disability Class: Hearing Difficulty
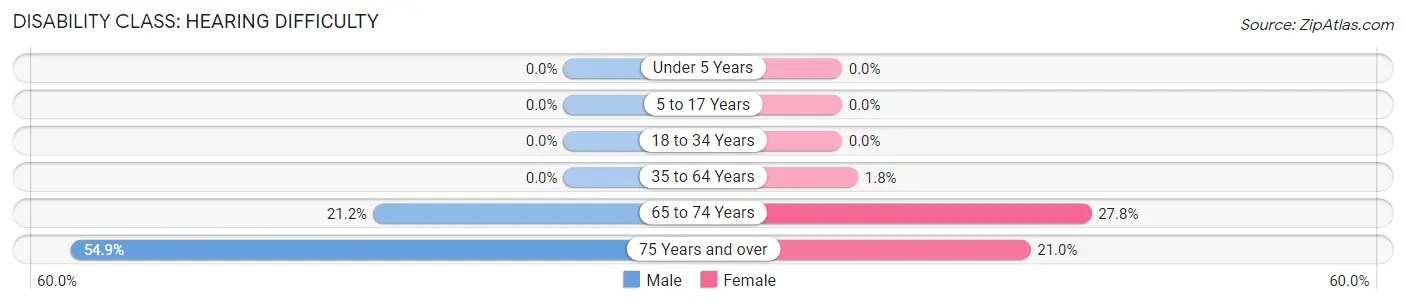
| Age Bracket | Male | Female |
| Under 5 Years | 0 (0.0%) | 0 (0.0%) |
| 5 to 17 Years | 0 (0.0%) | 0 (0.0%) |
| 18 to 34 Years | 0 (0.0%) | 0 (0.0%) |
| 35 to 64 Years | 0 (0.0%) | 3 (1.8%) |
| 65 to 74 Years | 28 (21.2%) | 25 (27.8%) |
| 75 Years and over | 79 (54.9%) | 38 (21.0%) |
Disability Class: Vision Difficulty
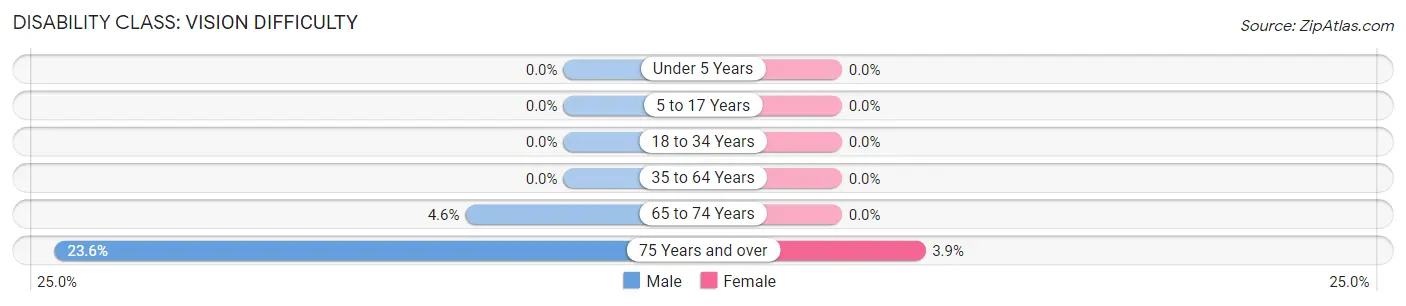
| Age Bracket | Male | Female |
| Under 5 Years | 0 (0.0%) | 0 (0.0%) |
| 5 to 17 Years | 0 (0.0%) | 0 (0.0%) |
| 18 to 34 Years | 0 (0.0%) | 0 (0.0%) |
| 35 to 64 Years | 0 (0.0%) | 0 (0.0%) |
| 65 to 74 Years | 6 (4.5%) | 0 (0.0%) |
| 75 Years and over | 34 (23.6%) | 7 (3.9%) |
Disability Class: Cognitive Difficulty
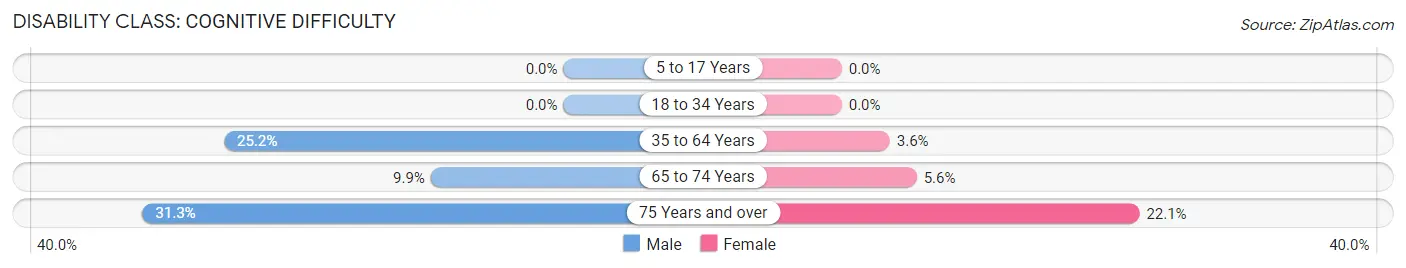
| Age Bracket | Male | Female |
| 5 to 17 Years | 0 (0.0%) | 0 (0.0%) |
| 18 to 34 Years | 0 (0.0%) | 0 (0.0%) |
| 35 to 64 Years | 68 (25.2%) | 6 (3.6%) |
| 65 to 74 Years | 13 (9.9%) | 5 (5.6%) |
| 75 Years and over | 45 (31.2%) | 40 (22.1%) |
Disability Class: Ambulatory Difficulty
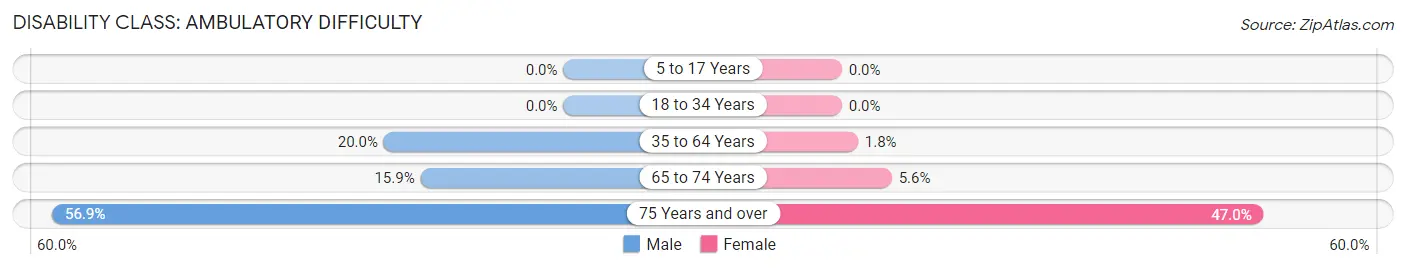
| Age Bracket | Male | Female |
| 5 to 17 Years | 0 (0.0%) | 0 (0.0%) |
| 18 to 34 Years | 0 (0.0%) | 0 (0.0%) |
| 35 to 64 Years | 54 (20.0%) | 3 (1.8%) |
| 65 to 74 Years | 21 (15.9%) | 5 (5.6%) |
| 75 Years and over | 82 (56.9%) | 85 (47.0%) |
Disability Class: Self-Care Difficulty
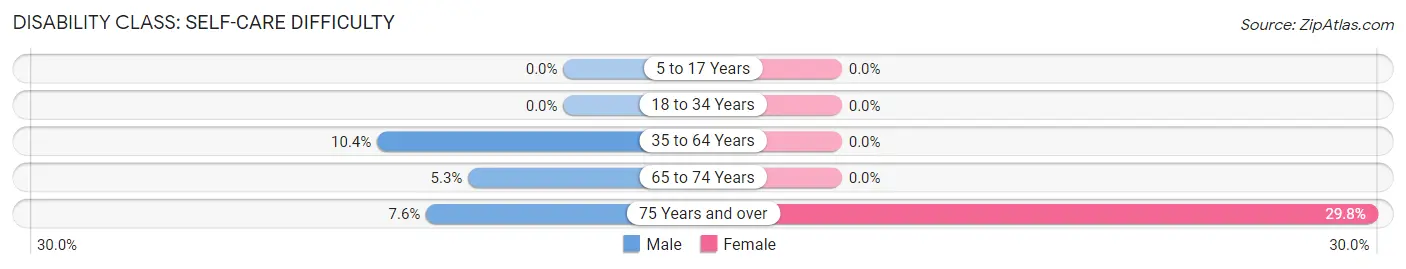
| Age Bracket | Male | Female |
| 5 to 17 Years | 0 (0.0%) | 0 (0.0%) |
| 18 to 34 Years | 0 (0.0%) | 0 (0.0%) |
| 35 to 64 Years | 28 (10.4%) | 0 (0.0%) |
| 65 to 74 Years | 7 (5.3%) | 0 (0.0%) |
| 75 Years and over | 11 (7.6%) | 54 (29.8%) |
Technology Access in Buckhead Ridge
Computing Device Access in Buckhead Ridge
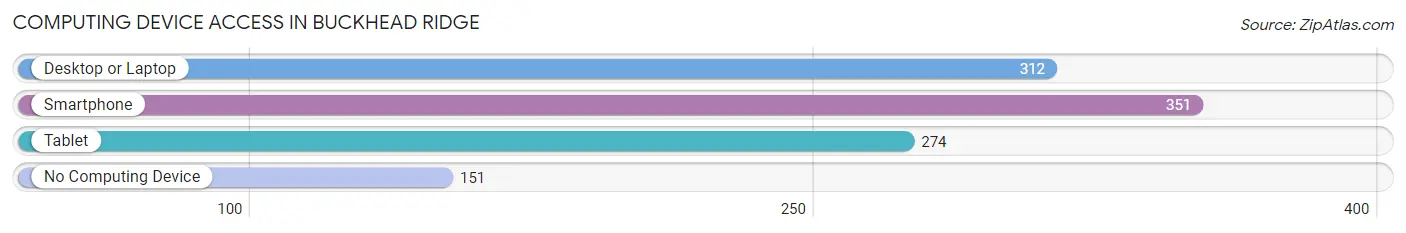
| Device Type | # Households | % Households |
| Desktop or Laptop | 312 | 58.3% |
| Smartphone | 351 | 65.6% |
| Tablet | 274 | 51.2% |
| No Computing Device | 151 | 28.2% |
| Total | 535 | 100.0% |
Internet Access in Buckhead Ridge
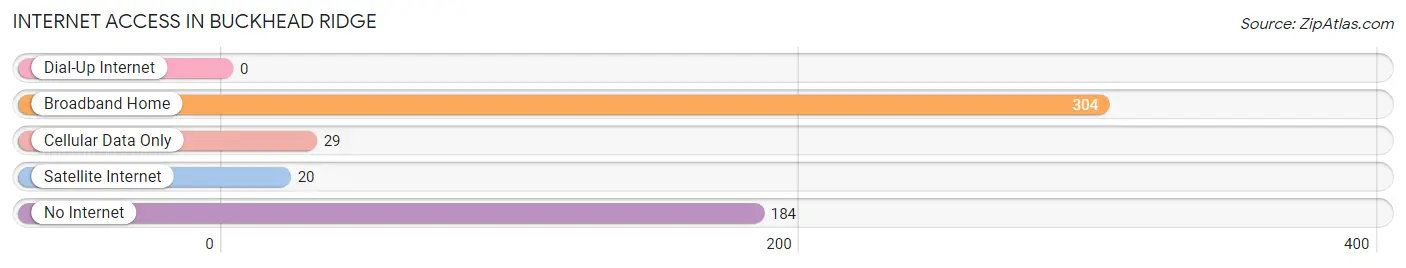
| Internet Type | # Households | % Households |
| Dial-Up Internet | 0 | 0.0% |
| Broadband Home | 304 | 56.8% |
| Cellular Data Only | 29 | 5.4% |
| Satellite Internet | 20 | 3.7% |
| No Internet | 184 | 34.4% |
| Total | 535 | 100.0% |
Buckhead Ridge Summary
Buckhead Ridge is a small unincorporated community located in Okeechobee County, Florida. It is situated on the northern shore of Lake Okeechobee, approximately 25 miles northwest of the county seat of Okeechobee. The community is part of the Okeechobee Micropolitan Statistical Area.
Geography
Buckhead Ridge is located at 27 25 N 80 54 W 27 4167 80 9000 The elevation is 11 feet 3 4 m
Buckhead Ridge is located on the northern shore of Lake Okeechobee, the second largest freshwater lake in the United States. The lake is approximately 730 square miles (1,890 km2) in size and is the largest lake in Florida. The lake is fed by the Kissimmee River, which flows from the Kissimmee Chain of Lakes in Osceola County to the south. The lake is also connected to the Caloosahatchee River to the west and the St. Lucie Canal to the east.
The community is located in the Central Florida Highlands region, which is characterized by rolling hills and sandy soils. The area is mostly rural, with some small towns and villages scattered throughout.
History
The area that is now Buckhead Ridge was originally inhabited by the Seminole Indians. The Seminoles were forced out of the area in the late 1800s by the U.S. government.
The first settlers in the area were cattle ranchers, who began arriving in the late 1800s. The first post office in the area was established in 1891.
The community was originally known as Buckhead, but the name was changed to Buckhead Ridge in the early 1900s. The name was changed to avoid confusion with another community in the area that was also called Buckhead.
Economy
The economy of Buckhead Ridge is largely based on agriculture and tourism. The area is home to several large cattle ranches, as well as several smaller farms that produce a variety of crops, including citrus, sugarcane, and vegetables.
The area is also a popular destination for fishing, boating, and other outdoor activities. The nearby Lake Okeechobee is a popular destination for anglers, and the area is home to several marinas and boat ramps.
Demographics
As of the 2010 census, the population of Buckhead Ridge was 1,845. The racial makeup of the community was 94.3% White, 2.2% African American, 0.3% Native American, 0.3% Asian, 0.1% Pacific Islander, 1.2% from other races, and 1.6% from two or more races. Hispanic or Latino of any race were 4.2% of the population.
The median household income in Buckhead Ridge was $31,250, and the median family income was $35,000. The per capita income was $14,845. About 17.2% of families and 20.2% of the population were below the poverty line, including 28.3% of those under age 18 and 11.3% of those age 65 or over.
Conclusion
Buckhead Ridge is a small unincorporated community located in Okeechobee County, Florida. It is situated on the northern shore of Lake Okeechobee, approximately 25 miles northwest of the county seat of Okeechobee. The community is part of the Okeechobee Micropolitan Statistical Area. The economy of Buckhead Ridge is largely based on agriculture and tourism. As of the 2010 census, the population of Buckhead Ridge was 1,845. The median household income in Buckhead Ridge was $31,250, and the median family income was $35,000. The per capita income was $14,845.
Common Questions
What is Per Capita Income in Buckhead Ridge?
Per Capita income in Buckhead Ridge is $33,383.
What is the Median Family Income in Buckhead Ridge?
Median Family Income in Buckhead Ridge is $62,679.
What is the Median Household income in Buckhead Ridge?
Median Household Income in Buckhead Ridge is $34,911.
What is Income or Wage Gap in Buckhead Ridge?
Income or Wage Gap in Buckhead Ridge is 30.2%.
Women in Buckhead Ridge earn 69.8 cents for every dollar earned by a man.
What is Family Income Deficit in Buckhead Ridge?
Family Income Deficit in Buckhead Ridge is $8,136.
Families that are below poverty line in Buckhead Ridge earn $8,136 less on average than the poverty threshold level.
What is Inequality or Gini Index in Buckhead Ridge?
Inequality or Gini Index in Buckhead Ridge is 0.47.
What is the Total Population of Buckhead Ridge?
Total Population of Buckhead Ridge is 1,028.
What is the Total Male Population of Buckhead Ridge?
Total Male Population of Buckhead Ridge is 583.
What is the Total Female Population of Buckhead Ridge?
Total Female Population of Buckhead Ridge is 445.
What is the Ratio of Males per 100 Females in Buckhead Ridge?
There are 131.01 Males per 100 Females in Buckhead Ridge.
What is the Ratio of Females per 100 Males in Buckhead Ridge?
There are 76.33 Females per 100 Males in Buckhead Ridge.
What is the Median Population Age in Buckhead Ridge?
Median Population Age in Buckhead Ridge is 65.8 Years.
What is the Average Family Size in Buckhead Ridge
Average Family Size in Buckhead Ridge is 2.5 People.
What is the Average Household Size in Buckhead Ridge
Average Household Size in Buckhead Ridge is 1.9 People.
How Large is the Labor Force in Buckhead Ridge?
There are 252 People in the Labor Forcein in Buckhead Ridge.
What is the Percentage of People in the Labor Force in Buckhead Ridge?
24.5% of People are in the Labor Force in Buckhead Ridge.
What is the Unemployment Rate in Buckhead Ridge?
Unemployment Rate in Buckhead Ridge is 12.7%.