Hudson, FL Map & Demographics
Hudson Map
Hudson Overview
$33,383
PER CAPITA INCOME
$71,152
AVG FAMILY INCOME
$45,752
AVG HOUSEHOLD INCOME
37.4%
WAGE / INCOME GAP [ % ]
62.6¢/ $1
WAGE / INCOME GAP [ $ ]
0.45
INEQUALITY / GINI INDEX
10,821
TOTAL POPULATION
5,447
MALE POPULATION
5,374
FEMALE POPULATION
101.36
MALES / 100 FEMALES
98.66
FEMALES / 100 MALES
62.9
MEDIAN AGE
2.5
AVG FAMILY SIZE
1.9
AVG HOUSEHOLD SIZE
3,763
LABOR FORCE [ PEOPLE ]
37.8%
PERCENT IN LABOR FORCE
6.0%
UNEMPLOYMENT RATE
Hudson Area Codes
Income in Hudson
Income Overview in Hudson
Per Capita Income in Hudson is $33,383, while median incomes of families and households are $71,152 and $45,752 respectively.
| Characteristic | Number | Measure |
| Per Capita Income | 10,821 | $33,383 |
| Median Family Income | 2,825 | $71,152 |
| Mean Family Income | 2,825 | $85,971 |
| Median Household Income | 5,602 | $45,752 |
| Mean Household Income | 5,602 | $61,943 |
| Income Deficit | 2,825 | $0 |
| Wage / Income Gap (%) | 10,821 | 37.43% |
| Wage / Income Gap ($) | 10,821 | 62.57¢ per $1 |
| Gini / Inequality Index | 10,821 | 0.45 |
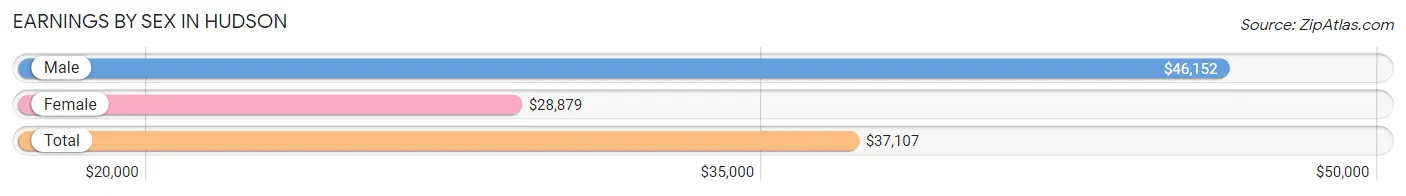
Earnings by Sex in Hudson
Average Earnings in Hudson are $37,107, $46,152 for men and $28,879 for women, a difference of 37.4%.
| Sex | Number | Average Earnings |
| Male | 1,897 (49.3%) | $46,152 |
| Female | 1,951 (50.7%) | $28,879 |
| Total | 3,848 (100.0%) | $37,107 |
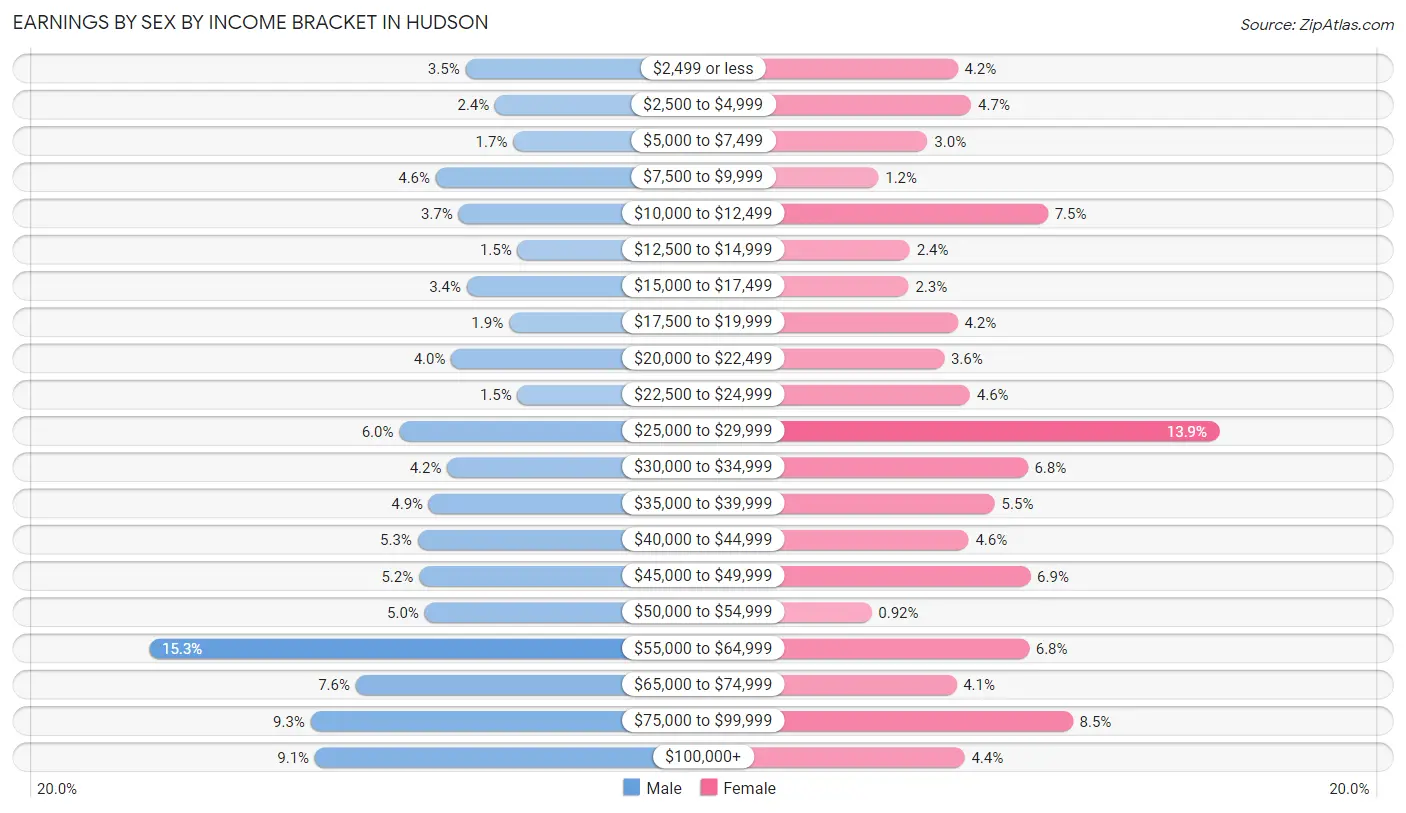
Earnings by Sex by Income Bracket in Hudson
The most common earnings brackets in Hudson are $55,000 to $64,999 for men (291 | 15.3%) and $25,000 to $29,999 for women (272 | 13.9%).
| Income | Male | Female |
| $2,499 or less | 66 (3.5%) | 81 (4.2%) |
| $2,500 to $4,999 | 45 (2.4%) | 91 (4.7%) |
| $5,000 to $7,499 | 32 (1.7%) | 59 (3.0%) |
| $7,500 to $9,999 | 87 (4.6%) | 23 (1.2%) |
| $10,000 to $12,499 | 71 (3.7%) | 147 (7.5%) |
| $12,500 to $14,999 | 29 (1.5%) | 46 (2.4%) |
| $15,000 to $17,499 | 65 (3.4%) | 45 (2.3%) |
| $17,500 to $19,999 | 35 (1.8%) | 81 (4.2%) |
| $20,000 to $22,499 | 76 (4.0%) | 71 (3.6%) |
| $22,500 to $24,999 | 29 (1.5%) | 90 (4.6%) |
| $25,000 to $29,999 | 113 (6.0%) | 272 (13.9%) |
| $30,000 to $34,999 | 79 (4.2%) | 132 (6.8%) |
| $35,000 to $39,999 | 92 (4.9%) | 108 (5.5%) |
| $40,000 to $44,999 | 100 (5.3%) | 89 (4.6%) |
| $45,000 to $49,999 | 99 (5.2%) | 134 (6.9%) |
| $50,000 to $54,999 | 95 (5.0%) | 18 (0.9%) |
| $55,000 to $64,999 | 291 (15.3%) | 133 (6.8%) |
| $65,000 to $74,999 | 144 (7.6%) | 80 (4.1%) |
| $75,000 to $99,999 | 176 (9.3%) | 165 (8.5%) |
| $100,000+ | 173 (9.1%) | 86 (4.4%) |
| Total | 1,897 (100.0%) | 1,951 (100.0%) |
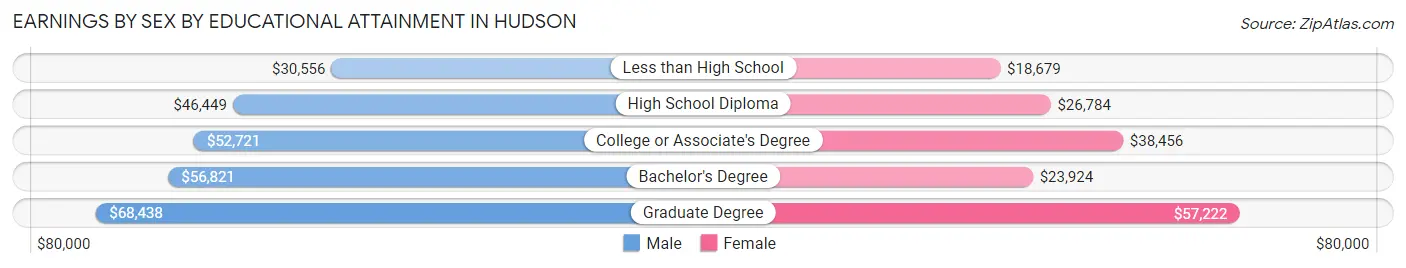
Earnings by Sex by Educational Attainment in Hudson
Average earnings in Hudson are $49,893 for men and $32,516 for women, a difference of 34.8%. Men with an educational attainment of graduate degree enjoy the highest average annual earnings of $68,438, while those with less than high school education earn the least with $30,556. Women with an educational attainment of graduate degree earn the most with the average annual earnings of $57,222, while those with less than high school education have the smallest earnings of $18,679.
| Educational Attainment | Male Income | Female Income |
| Less than High School | $30,556 | $18,679 |
| High School Diploma | $46,449 | $26,784 |
| College or Associate's Degree | $52,721 | $38,456 |
| Bachelor's Degree | $56,821 | $23,924 |
| Graduate Degree | $68,438 | $57,222 |
| Total | $49,893 | $32,516 |
Family Income in Hudson
Family Income Brackets in Hudson
According to the Hudson family income data, there are 672 families falling into the $50,000 to $74,999 income range, which is the most common income bracket and makes up 23.8% of all families. Conversely, the less than $10,000 income bracket is the least frequent group with only 45 families (1.6%) belonging to this category.
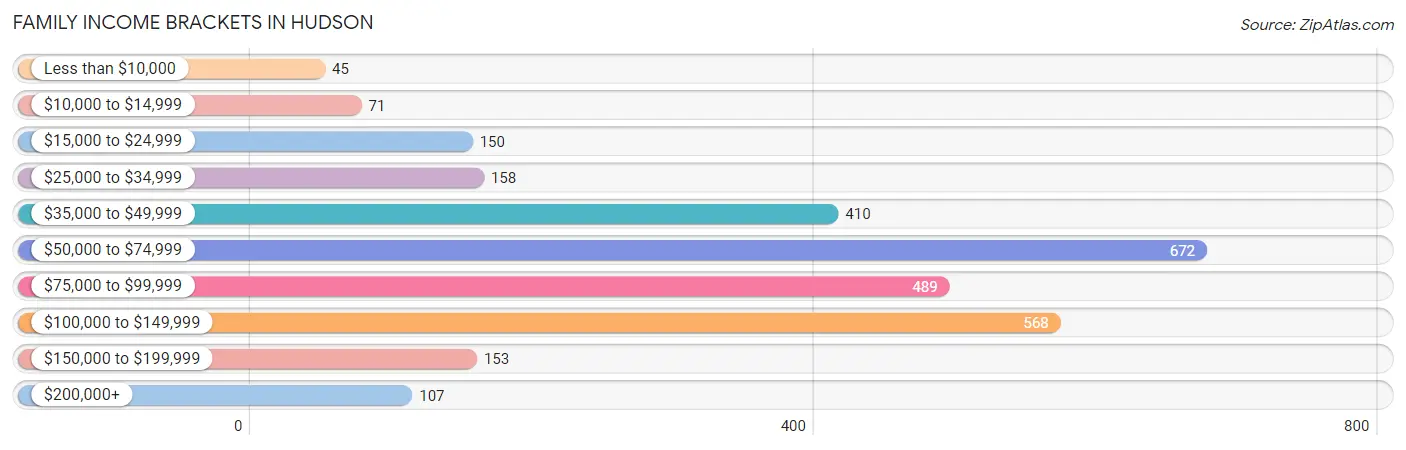
| Income Bracket | # Families | % Families |
| Less than $10,000 | 45 | 1.6% |
| $10,000 to $14,999 | 71 | 2.5% |
| $15,000 to $24,999 | 150 | 5.3% |
| $25,000 to $34,999 | 158 | 5.6% |
| $35,000 to $49,999 | 410 | 14.5% |
| $50,000 to $74,999 | 672 | 23.8% |
| $75,000 to $99,999 | 489 | 17.3% |
| $100,000 to $149,999 | 568 | 20.1% |
| $150,000 to $199,999 | 153 | 5.4% |
| $200,000+ | 107 | 3.8% |
Family Income by Famaliy Size in Hudson
5-person families (60 | 2.1%) account for the highest median family income in Hudson with $106,691 per family, while 2-person families (2,152 | 76.2%) have the highest median income of $33,060 per family member.
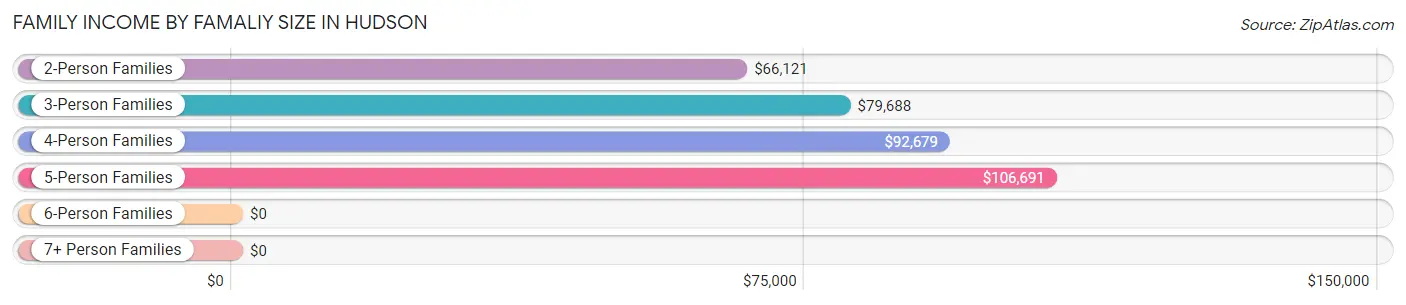
| Income Bracket | # Families | Median Income |
| 2-Person Families | 2,152 (76.2%) | $66,121 |
| 3-Person Families | 407 (14.4%) | $79,688 |
| 4-Person Families | 185 (6.6%) | $92,679 |
| 5-Person Families | 60 (2.1%) | $106,691 |
| 6-Person Families | 12 (0.4%) | $0 |
| 7+ Person Families | 9 (0.3%) | $0 |
| Total | 2,825 (100.0%) | $71,152 |
Family Income by Number of Earners in Hudson
The median family income in Hudson is $71,152, with families comprising 3+ earners (90) having the highest median family income of $130,278, while families with no earners (1,129) have the lowest median family income of $53,386, accounting for 3.2% and 40.0% of families, respectively.
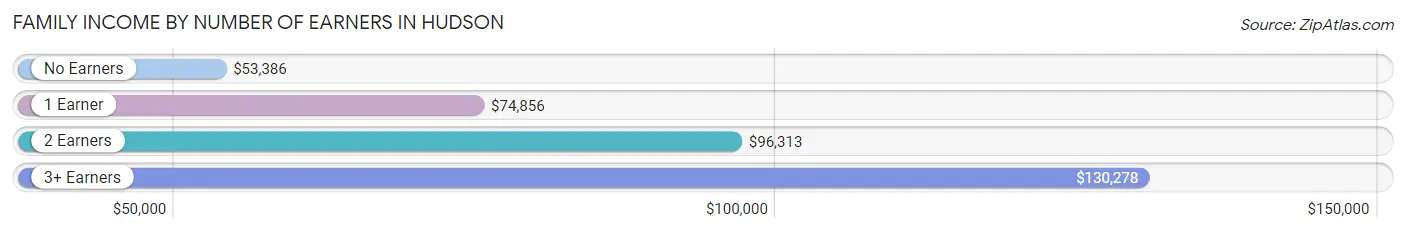
| Number of Earners | # Families | Median Income |
| No Earners | 1,129 (40.0%) | $53,386 |
| 1 Earner | 951 (33.7%) | $74,856 |
| 2 Earners | 655 (23.2%) | $96,313 |
| 3+ Earners | 90 (3.2%) | $130,278 |
| Total | 2,825 (100.0%) | $71,152 |
Household Income in Hudson
Household Income Brackets in Hudson
With 958 households falling in the category, the $50,000 to $74,999 income range is the most frequent in Hudson, accounting for 17.1% of all households. In contrast, only 118 households (2.1%) fall into the $200,000+ income bracket, making it the least populous group.
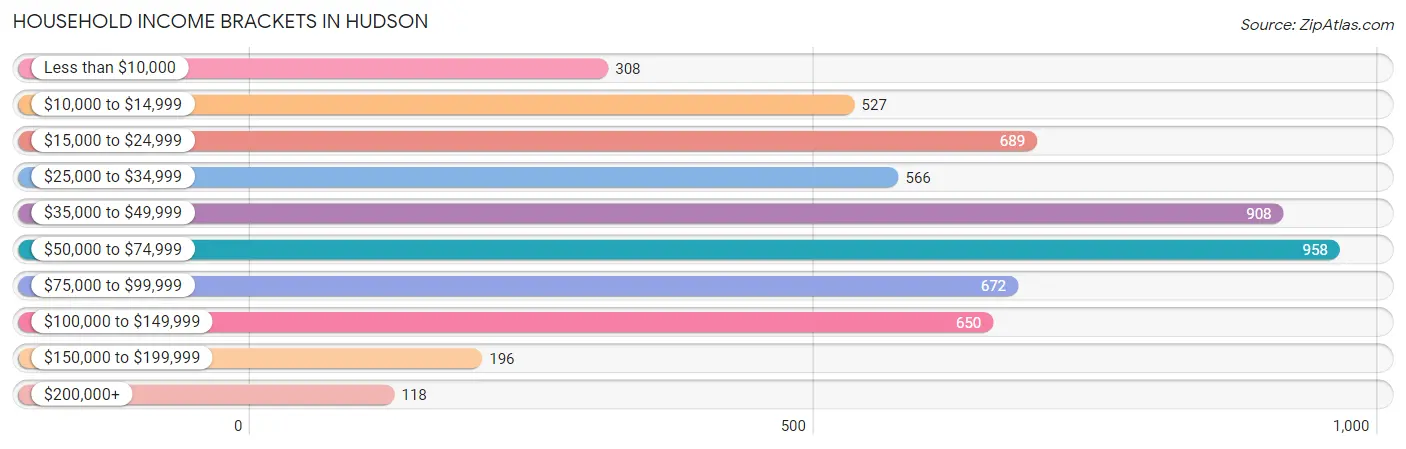
| Income Bracket | # Households | % Households |
| Less than $10,000 | 308 | 5.5% |
| $10,000 to $14,999 | 527 | 9.4% |
| $15,000 to $24,999 | 689 | 12.3% |
| $25,000 to $34,999 | 566 | 10.1% |
| $35,000 to $49,999 | 908 | 16.2% |
| $50,000 to $74,999 | 958 | 17.1% |
| $75,000 to $99,999 | 672 | 12.0% |
| $100,000 to $149,999 | 650 | 11.6% |
| $150,000 to $199,999 | 196 | 3.5% |
| $200,000+ | 118 | 2.1% |
Household Income by Householder Age in Hudson
The median household income in Hudson is $45,752, with the highest median household income of $68,348 found in the 25 to 44 years age bracket for the primary householder. A total of 553 households (9.9%) fall into this category. Meanwhile, the 15 to 24 years age bracket for the primary householder has the lowest median household income of $0, with 29 households (0.5%) in this group.
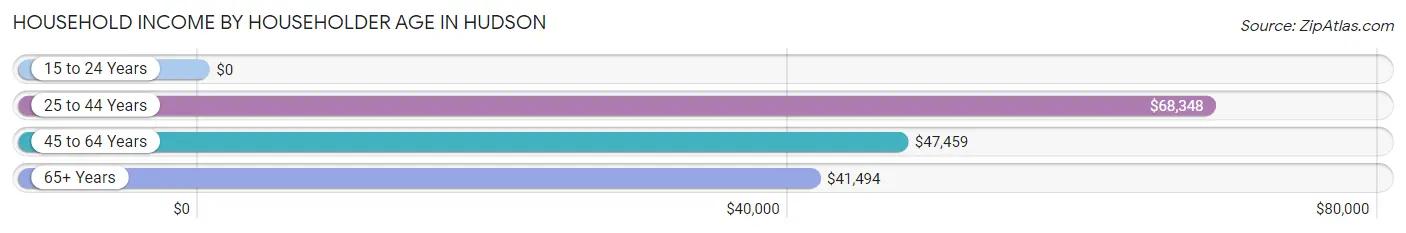
| Income Bracket | # Households | Median Income |
| 15 to 24 Years | 29 (0.5%) | $0 |
| 25 to 44 Years | 553 (9.9%) | $68,348 |
| 45 to 64 Years | 1,934 (34.5%) | $47,459 |
| 65+ Years | 3,086 (55.1%) | $41,494 |
| Total | 5,602 (100.0%) | $45,752 |
Poverty in Hudson
Income Below Poverty by Sex and Age in Hudson
With 14.2% poverty level for males and 14.9% for females among the residents of Hudson, 16 and 17 year old males and 18 to 24 year old females are the most vulnerable to poverty, with 18 males (45.0%) and 95 females (51.9%) in their respective age groups living below the poverty level.
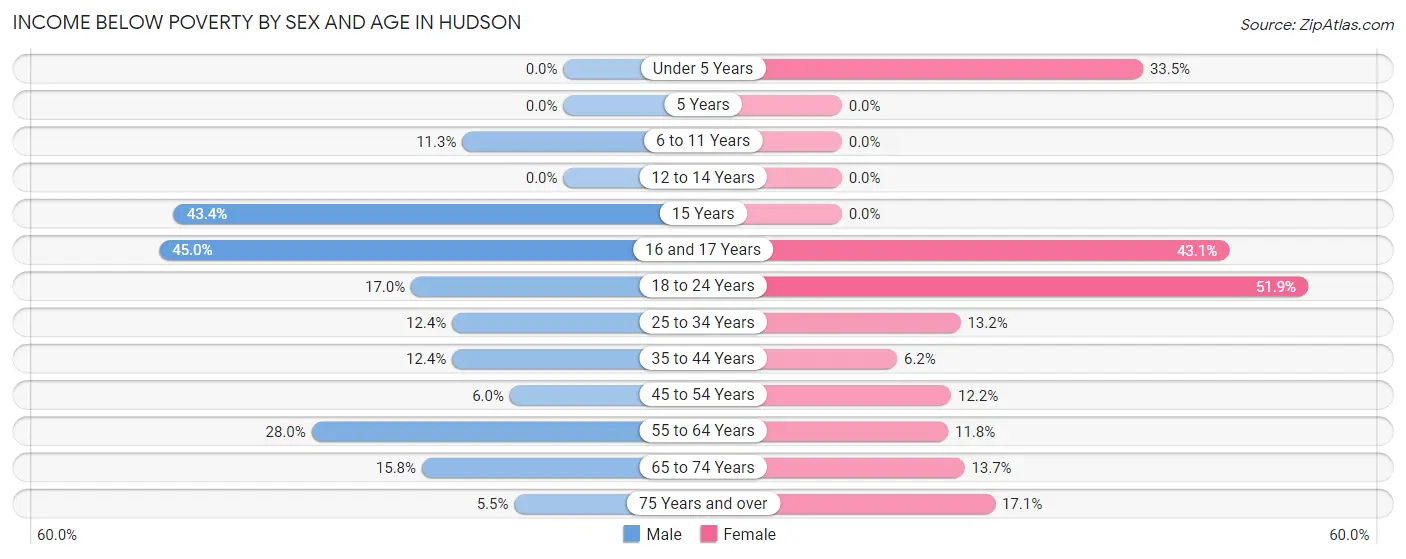
| Age Bracket | Male | Female |
| Under 5 Years | 0 (0.0%) | 55 (33.5%) |
| 5 Years | 0 (0.0%) | 0 (0.0%) |
| 6 to 11 Years | 25 (11.3%) | 0 (0.0%) |
| 12 to 14 Years | 0 (0.0%) | 0 (0.0%) |
| 15 Years | 36 (43.4%) | 0 (0.0%) |
| 16 and 17 Years | 18 (45.0%) | 22 (43.1%) |
| 18 to 24 Years | 29 (17.0%) | 95 (51.9%) |
| 25 to 34 Years | 32 (12.4%) | 30 (13.2%) |
| 35 to 44 Years | 45 (12.4%) | 26 (6.1%) |
| 45 to 54 Years | 34 (6.0%) | 91 (12.2%) |
| 55 to 64 Years | 281 (28.0%) | 115 (11.8%) |
| 65 to 74 Years | 189 (15.8%) | 178 (13.7%) |
| 75 Years and over | 64 (5.5%) | 166 (17.1%) |
| Total | 753 (14.2%) | 778 (14.9%) |
Income Above Poverty by Sex and Age in Hudson
According to the poverty statistics in Hudson, males aged under 5 years and females aged 6 to 11 years are the age groups that are most secure financially, with 100.0% of males and 100.0% of females in these age groups living above the poverty line.
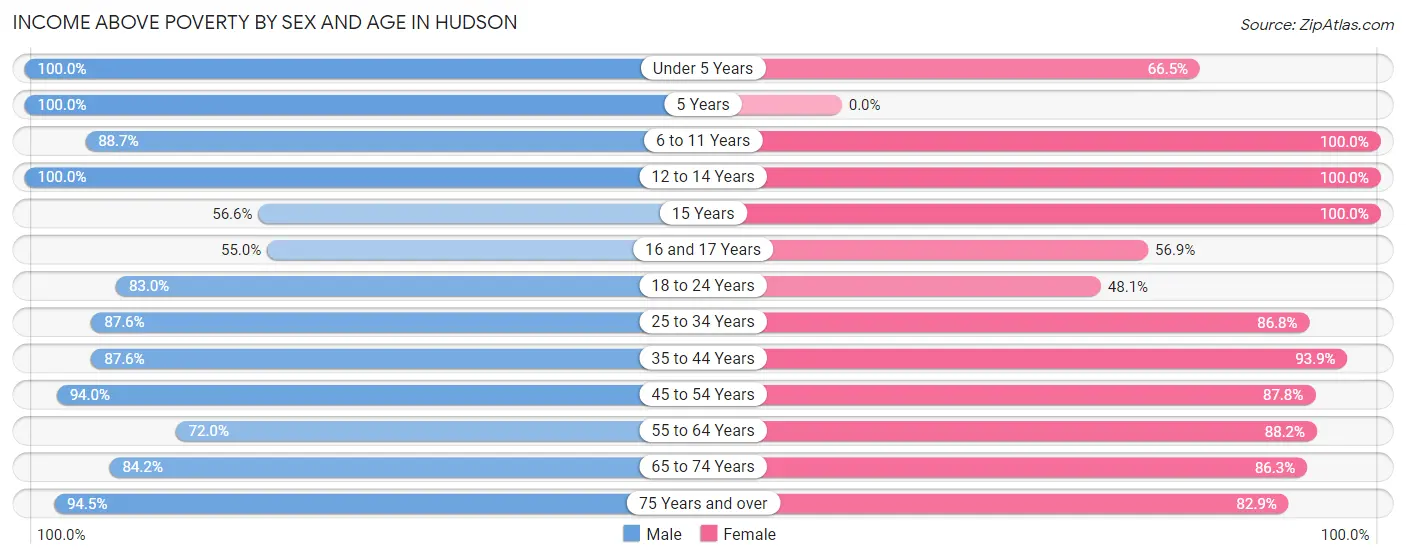
| Age Bracket | Male | Female |
| Under 5 Years | 102 (100.0%) | 109 (66.5%) |
| 5 Years | 55 (100.0%) | 0 (0.0%) |
| 6 to 11 Years | 197 (88.7%) | 94 (100.0%) |
| 12 to 14 Years | 62 (100.0%) | 58 (100.0%) |
| 15 Years | 47 (56.6%) | 27 (100.0%) |
| 16 and 17 Years | 22 (55.0%) | 29 (56.9%) |
| 18 to 24 Years | 142 (83.0%) | 88 (48.1%) |
| 25 to 34 Years | 226 (87.6%) | 197 (86.8%) |
| 35 to 44 Years | 318 (87.6%) | 397 (93.9%) |
| 45 to 54 Years | 536 (94.0%) | 657 (87.8%) |
| 55 to 64 Years | 721 (72.0%) | 857 (88.2%) |
| 65 to 74 Years | 1,010 (84.2%) | 1,125 (86.3%) |
| 75 Years and over | 1,108 (94.5%) | 807 (82.9%) |
| Total | 4,546 (85.8%) | 4,445 (85.1%) |
Income Below Poverty Among Married-Couple Families in Hudson
The poverty statistics for married-couple families in Hudson show that 3.3% or 77 of the total 2,350 families live below the poverty line. Families with 1 or 2 children have the highest poverty rate of 9.1%, comprising of 23 families. On the other hand, families with 3 or 4 children have the lowest poverty rate of 0.0%, which includes 0 families.
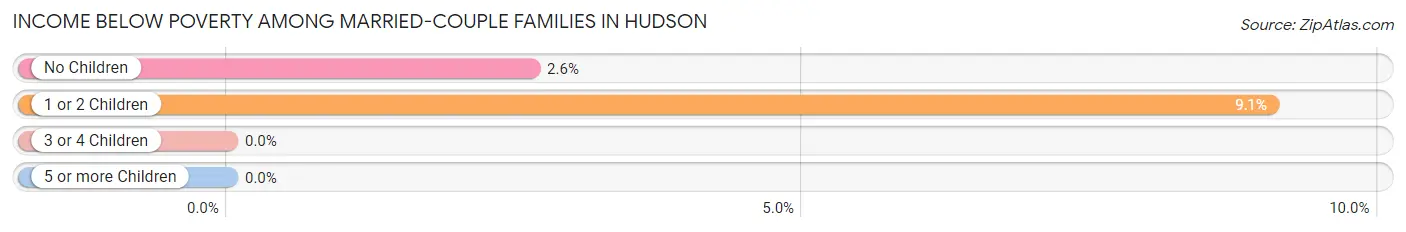
| Children | Above Poverty | Below Poverty |
| No Children | 2,003 (97.4%) | 54 (2.6%) |
| 1 or 2 Children | 231 (90.9%) | 23 (9.1%) |
| 3 or 4 Children | 39 (100.0%) | 0 (0.0%) |
| 5 or more Children | 0 (0.0%) | 0 (0.0%) |
| Total | 2,273 (96.7%) | 77 (3.3%) |
Income Below Poverty Among Single-Parent Households in Hudson
According to the poverty data in Hudson, 2.6% or 5 single-father households and 21.2% or 60 single-mother households are living below the poverty line. Among single-father households, those with no children have the highest poverty rate, with 5 households (4.7%) experiencing poverty. Likewise, among single-mother households, those with 1 or 2 children have the highest poverty rate, with 60 households (38.7%) falling below the poverty line.
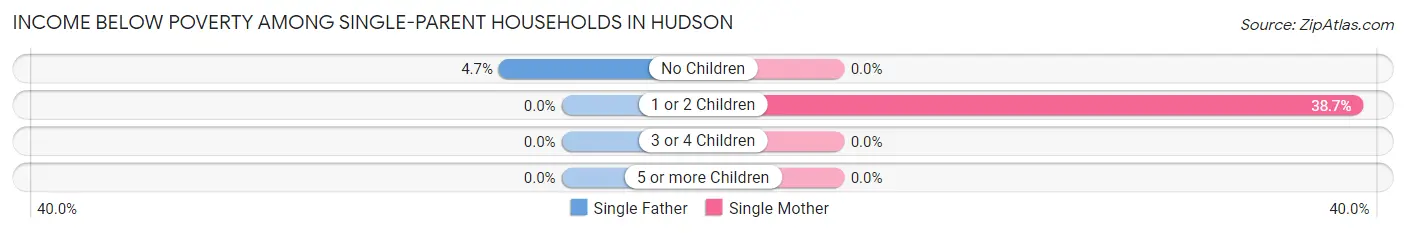
| Children | Single Father | Single Mother |
| No Children | 5 (4.7%) | 0 (0.0%) |
| 1 or 2 Children | 0 (0.0%) | 60 (38.7%) |
| 3 or 4 Children | 0 (0.0%) | 0 (0.0%) |
| 5 or more Children | 0 (0.0%) | 0 (0.0%) |
| Total | 5 (2.6%) | 60 (21.2%) |
Income Below Poverty Among Married-Couple vs Single-Parent Households in Hudson
The poverty data for Hudson shows that 77 of the married-couple family households (3.3%) and 65 of the single-parent households (13.7%) are living below the poverty level. Within the married-couple family households, those with 1 or 2 children have the highest poverty rate, with 23 households (9.1%) falling below the poverty line. Among the single-parent households, those with 1 or 2 children have the highest poverty rate, with 60 household (25.0%) living below poverty.
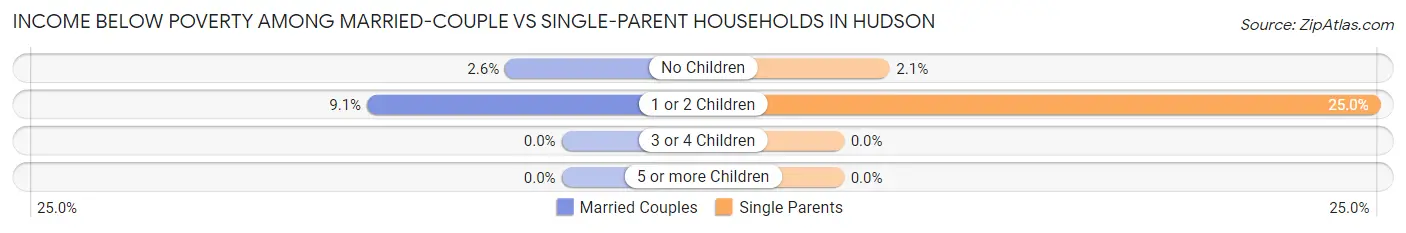
| Children | Married-Couple Families | Single-Parent Households |
| No Children | 54 (2.6%) | 5 (2.1%) |
| 1 or 2 Children | 23 (9.1%) | 60 (25.0%) |
| 3 or 4 Children | 0 (0.0%) | 0 (0.0%) |
| 5 or more Children | 0 (0.0%) | 0 (0.0%) |
| Total | 77 (3.3%) | 65 (13.7%) |
Race in Hudson
The most populous races in Hudson are White / Caucasian (9,996 | 92.4%), Hispanic or Latino (495 | 4.6%), and Two or more Races (443 | 4.1%).
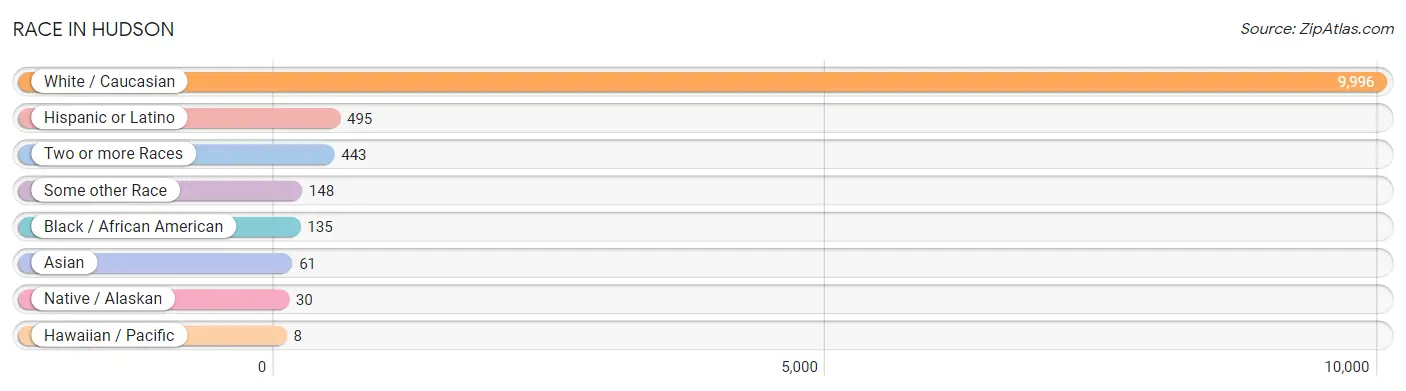
| Race | # Population | % Population |
| Asian | 61 | 0.6% |
| Black / African American | 135 | 1.3% |
| Hawaiian / Pacific | 8 | 0.1% |
| Hispanic or Latino | 495 | 4.6% |
| Native / Alaskan | 30 | 0.3% |
| White / Caucasian | 9,996 | 92.4% |
| Two or more Races | 443 | 4.1% |
| Some other Race | 148 | 1.4% |
| Total | 10,821 | 100.0% |
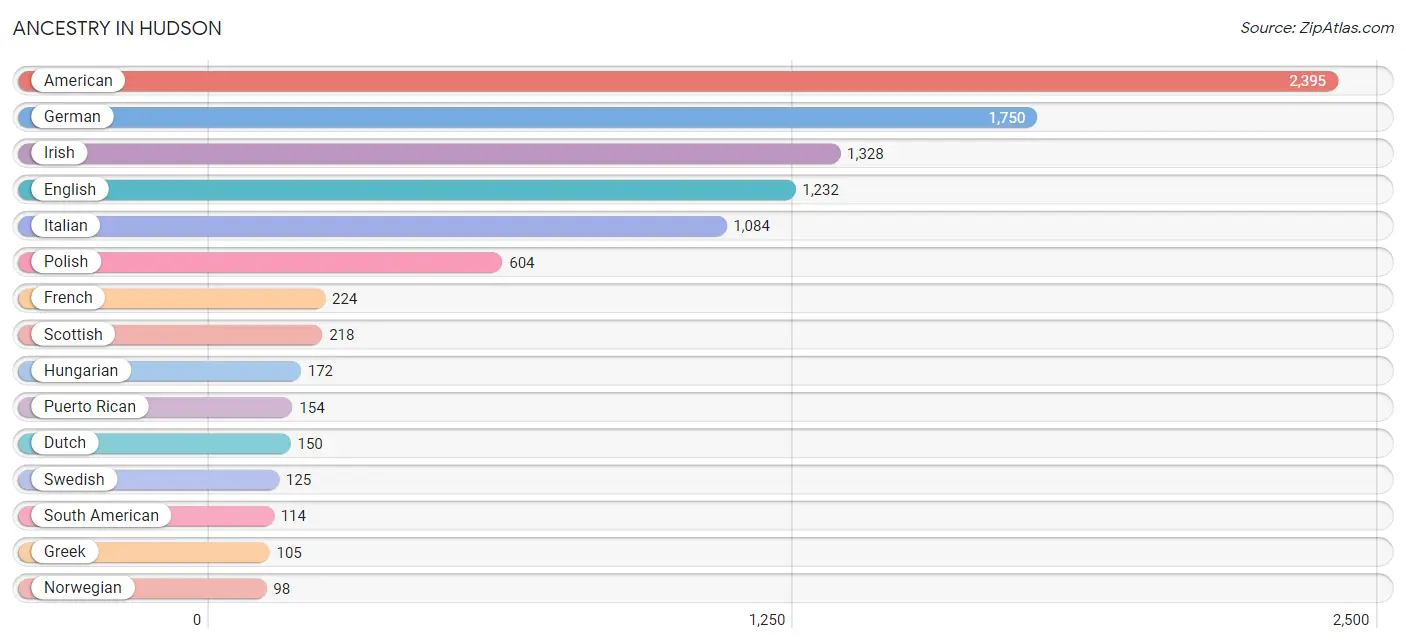
Ancestry in Hudson
The most populous ancestries reported in Hudson are American (2,395 | 22.1%), German (1,750 | 16.2%), Irish (1,328 | 12.3%), English (1,232 | 11.4%), and Italian (1,084 | 10.0%), together accounting for 72.0% of all Hudson residents.
| Ancestry | # Population | % Population |
| American | 2,395 | 22.1% |
| Armenian | 7 | 0.1% |
| Australian | 8 | 0.1% |
| Austrian | 12 | 0.1% |
| Blackfeet | 16 | 0.2% |
| British | 25 | 0.2% |
| Canadian | 86 | 0.8% |
| Central American | 6 | 0.1% |
| Cherokee | 46 | 0.4% |
| Choctaw | 4 | 0.0% |
| Colombian | 25 | 0.2% |
| Cuban | 82 | 0.8% |
| Czech | 26 | 0.2% |
| Czechoslovakian | 18 | 0.2% |
| Delaware | 4 | 0.0% |
| Dutch | 150 | 1.4% |
| Ecuadorian | 80 | 0.7% |
| English | 1,232 | 11.4% |
| European | 83 | 0.8% |
| Finnish | 60 | 0.5% |
| French | 224 | 2.1% |
| French American Indian | 13 | 0.1% |
| French Canadian | 62 | 0.6% |
| German | 1,750 | 16.2% |
| Greek | 105 | 1.0% |
| Guamanian / Chamorro | 2 | 0.0% |
| Hungarian | 172 | 1.6% |
| Indian (Asian) | 9 | 0.1% |
| Irish | 1,328 | 12.3% |
| Iroquois | 12 | 0.1% |
| Italian | 1,084 | 10.0% |
| Jamaican | 28 | 0.3% |
| Korean | 45 | 0.4% |
| Lithuanian | 20 | 0.2% |
| Macedonian | 20 | 0.2% |
| Maltese | 9 | 0.1% |
| Mexican | 95 | 0.9% |
| Native Hawaiian | 6 | 0.1% |
| Northern European | 7 | 0.1% |
| Norwegian | 98 | 0.9% |
| Osage | 4 | 0.0% |
| Panamanian | 6 | 0.1% |
| Peruvian | 9 | 0.1% |
| Polish | 604 | 5.6% |
| Portuguese | 65 | 0.6% |
| Puerto Rican | 154 | 1.4% |
| Russian | 49 | 0.4% |
| Scotch-Irish | 81 | 0.7% |
| Scottish | 218 | 2.0% |
| Sioux | 4 | 0.0% |
| Slavic | 16 | 0.2% |
| Slovak | 17 | 0.2% |
| Slovene | 11 | 0.1% |
| South American | 114 | 1.1% |
| Spaniard | 20 | 0.2% |
| Spanish | 22 | 0.2% |
| Sri Lankan | 17 | 0.2% |
| Swedish | 125 | 1.2% |
| Swiss | 36 | 0.3% |
| Ukrainian | 26 | 0.2% |
| Vietnamese | 2 | 0.0% |
| Welsh | 80 | 0.7% | View All 62 Rows |
Immigrants in Hudson
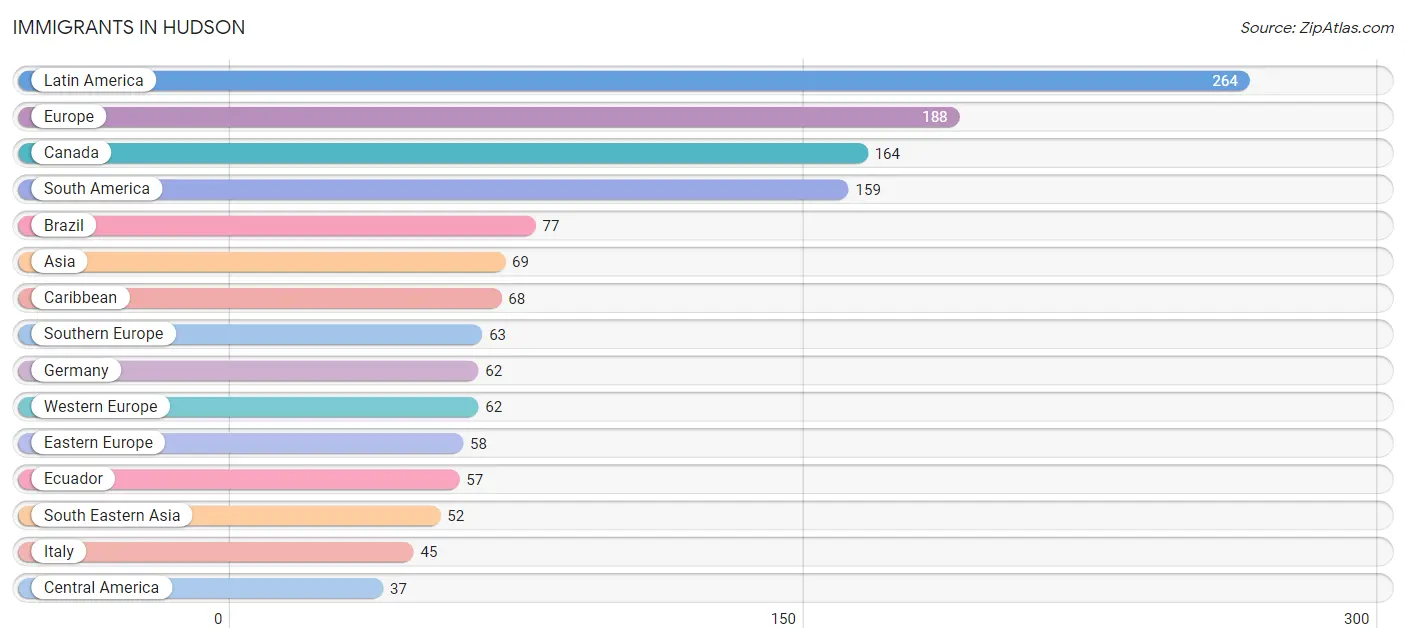
The most numerous immigrant groups reported in Hudson came from Latin America (264 | 2.4%), Europe (188 | 1.7%), Canada (164 | 1.5%), South America (159 | 1.5%), and Brazil (77 | 0.7%), together accounting for 7.9% of all Hudson residents.
| Immigration Origin | # Population | % Population |
| Asia | 69 | 0.6% |
| Brazil | 77 | 0.7% |
| Canada | 164 | 1.5% |
| Caribbean | 68 | 0.6% |
| Central America | 37 | 0.3% |
| Colombia | 25 | 0.2% |
| Cuba | 37 | 0.3% |
| Eastern Europe | 58 | 0.5% |
| Ecuador | 57 | 0.5% |
| England | 5 | 0.1% |
| Europe | 188 | 1.7% |
| Germany | 62 | 0.6% |
| Italy | 45 | 0.4% |
| Jamaica | 31 | 0.3% |
| Latin America | 264 | 2.4% |
| Mexico | 31 | 0.3% |
| North Macedonia | 20 | 0.2% |
| Northern Europe | 5 | 0.1% |
| Panama | 6 | 0.1% |
| Philippines | 35 | 0.3% |
| Poland | 16 | 0.2% |
| Russia | 22 | 0.2% |
| South America | 159 | 1.5% |
| South Eastern Asia | 52 | 0.5% |
| Southern Europe | 63 | 0.6% |
| Spain | 9 | 0.1% |
| Turkey | 10 | 0.1% |
| Vietnam | 17 | 0.2% |
| Western Asia | 17 | 0.2% |
| Western Europe | 62 | 0.6% | View All 30 Rows |
Sex and Age in Hudson
Sex and Age in Hudson
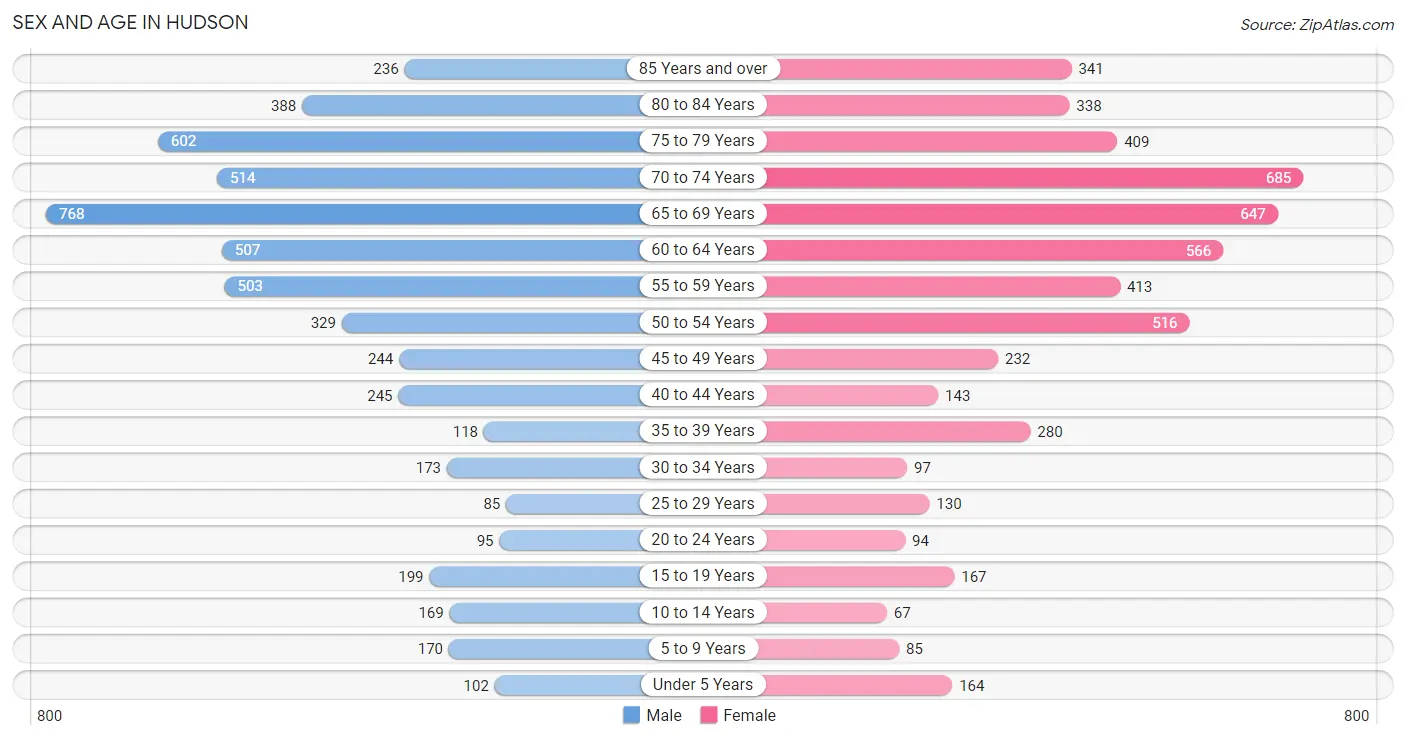
The most populous age groups in Hudson are 65 to 69 Years (768 | 14.1%) for men and 70 to 74 Years (685 | 12.8%) for women.
| Age Bracket | Male | Female |
| Under 5 Years | 102 (1.9%) | 164 (3.0%) |
| 5 to 9 Years | 170 (3.1%) | 85 (1.6%) |
| 10 to 14 Years | 169 (3.1%) | 67 (1.3%) |
| 15 to 19 Years | 199 (3.6%) | 167 (3.1%) |
| 20 to 24 Years | 95 (1.7%) | 94 (1.8%) |
| 25 to 29 Years | 85 (1.6%) | 130 (2.4%) |
| 30 to 34 Years | 173 (3.2%) | 97 (1.8%) |
| 35 to 39 Years | 118 (2.2%) | 280 (5.2%) |
| 40 to 44 Years | 245 (4.5%) | 143 (2.7%) |
| 45 to 49 Years | 244 (4.5%) | 232 (4.3%) |
| 50 to 54 Years | 329 (6.0%) | 516 (9.6%) |
| 55 to 59 Years | 503 (9.2%) | 413 (7.7%) |
| 60 to 64 Years | 507 (9.3%) | 566 (10.5%) |
| 65 to 69 Years | 768 (14.1%) | 647 (12.0%) |
| 70 to 74 Years | 514 (9.4%) | 685 (12.8%) |
| 75 to 79 Years | 602 (11.1%) | 409 (7.6%) |
| 80 to 84 Years | 388 (7.1%) | 338 (6.3%) |
| 85 Years and over | 236 (4.3%) | 341 (6.4%) |
| Total | 5,447 (100.0%) | 5,374 (100.0%) |
Families and Households in Hudson
Median Family Size in Hudson
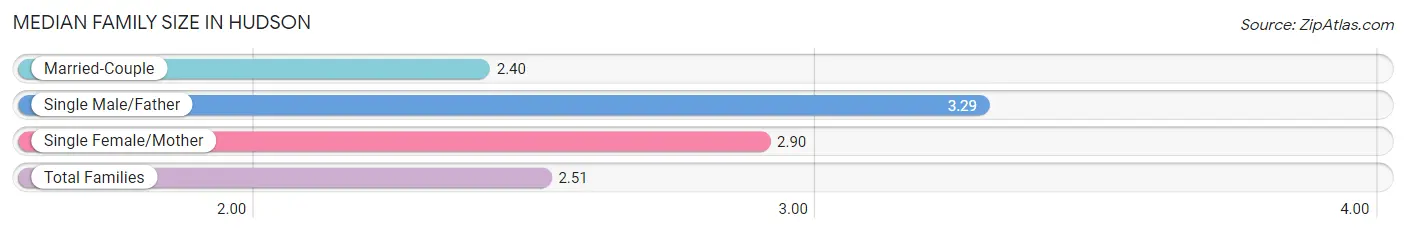
The median family size in Hudson is 2.51 persons per family, with single male/father families (192 | 6.8%) accounting for the largest median family size of 3.29 persons per family. On the other hand, married-couple families (2,350 | 83.2%) represent the smallest median family size with 2.40 persons per family.
| Family Type | # Families | Family Size |
| Married-Couple | 2,350 (83.2%) | 2.40 |
| Single Male/Father | 192 (6.8%) | 3.29 |
| Single Female/Mother | 283 (10.0%) | 2.90 |
| Total Families | 2,825 (100.0%) | 2.51 |
Median Household Size in Hudson
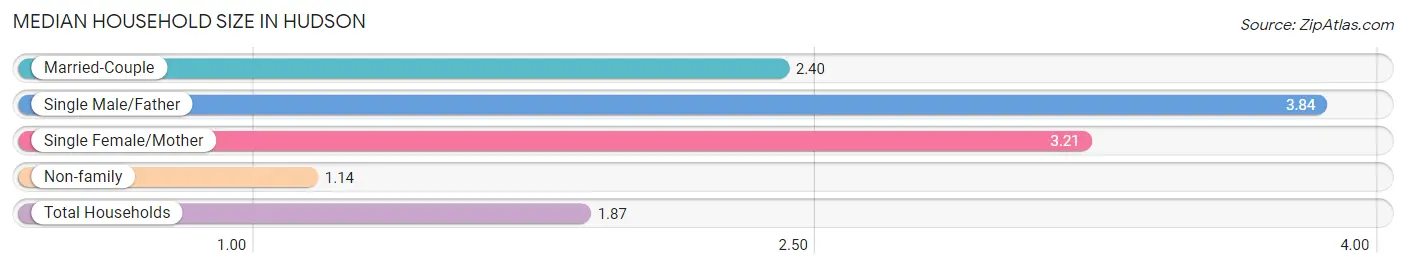
The median household size in Hudson is 1.87 persons per household, with single male/father households (192 | 3.4%) accounting for the largest median household size of 3.84 persons per household. non-family households (2,777 | 49.6%) represent the smallest median household size with 1.14 persons per household.
| Household Type | # Households | Household Size |
| Married-Couple | 2,350 (41.9%) | 2.40 |
| Single Male/Father | 192 (3.4%) | 3.84 |
| Single Female/Mother | 283 (5.1%) | 3.21 |
| Non-family | 2,777 (49.6%) | 1.14 |
| Total Households | 5,602 (100.0%) | 1.87 |
Household Size by Marriage Status in Hudson
Out of a total of 5,602 households in Hudson, 2,825 (50.4%) are family households, while 2,777 (49.6%) are nonfamily households. The most numerous type of family households are 2-person households, comprising 2,038, and the most common type of nonfamily households are 1-person households, comprising 2,428.
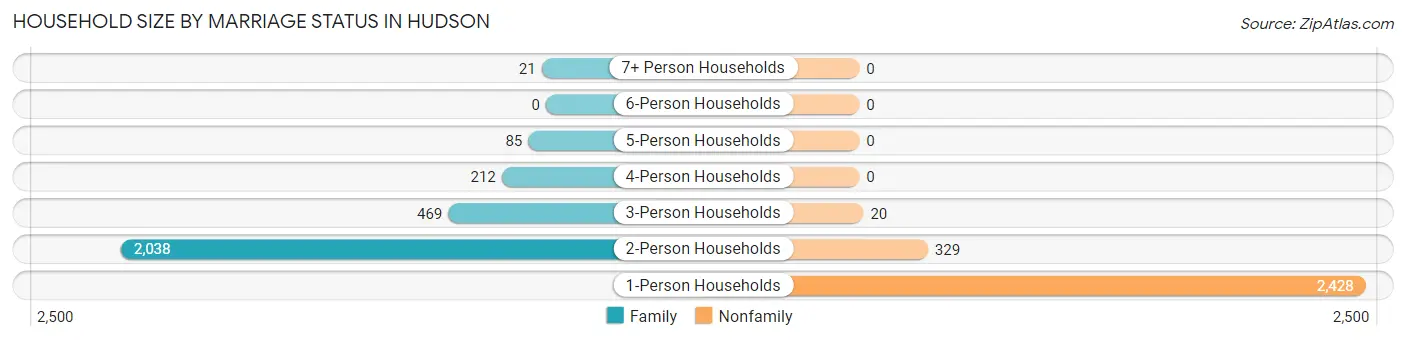
| Household Size | Family Households | Nonfamily Households |
| 1-Person Households | - | 2,428 (43.3%) |
| 2-Person Households | 2,038 (36.4%) | 329 (5.9%) |
| 3-Person Households | 469 (8.4%) | 20 (0.4%) |
| 4-Person Households | 212 (3.8%) | 0 (0.0%) |
| 5-Person Households | 85 (1.5%) | 0 (0.0%) |
| 6-Person Households | 0 (0.0%) | 0 (0.0%) |
| 7+ Person Households | 21 (0.4%) | 0 (0.0%) |
| Total | 2,825 (50.4%) | 2,777 (49.6%) |
Female Fertility in Hudson
Fertility by Age in Hudson
Average fertility rate in Hudson is 6.0 births per 1,000 women. Women in the age bracket of 20 to 34 years have the highest fertility rate with 22.0 births per 1,000 women. Women in the age bracket of 20 to 34 years acount for 100.0% of all women with births.
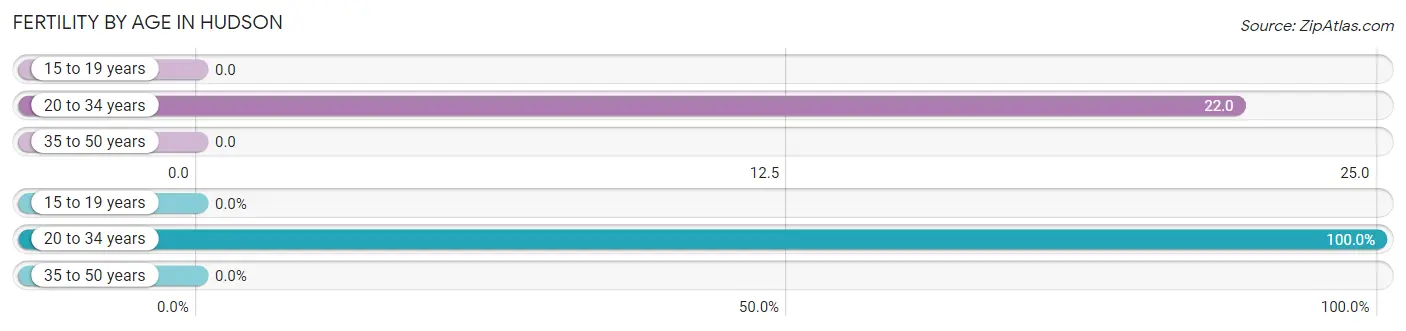
| Age Bracket | Women with Births | Births / 1,000 Women |
| 15 to 19 years | 0 (0.0%) | 0.0 |
| 20 to 34 years | 7 (100.0%) | 22.0 |
| 35 to 50 years | 0 (0.0%) | 0.0 |
| Total | 7 (100.0%) | 6.0 |
Fertility by Age by Marriage Status in Hudson
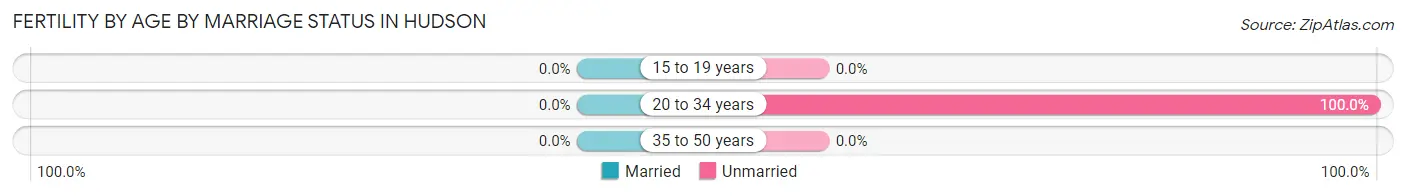
| Age Bracket | Married | Unmarried |
| 15 to 19 years | 0 (0.0%) | 0 (0.0%) |
| 20 to 34 years | 0 (0.0%) | 7 (100.0%) |
| 35 to 50 years | 0 (0.0%) | 0 (0.0%) |
| Total | 0 (0.0%) | 7 (100.0%) |
Fertility by Education in Hudson
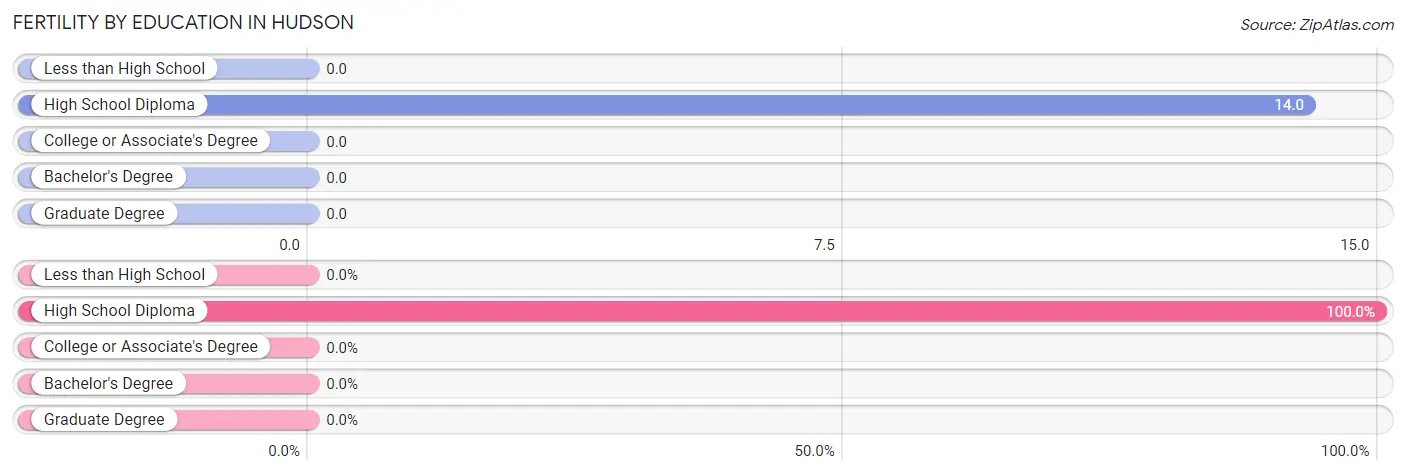
| Educational Attainment | Women with Births | Births / 1,000 Women |
| Less than High School | 0 (0.0%) | 0.0 |
| High School Diploma | 7 (100.0%) | 14.0 |
| College or Associate's Degree | 0 (0.0%) | 0.0 |
| Bachelor's Degree | 0 (0.0%) | 0.0 |
| Graduate Degree | 0 (0.0%) | 0.0 |
| Total | 7 (100.0%) | 6.0 |
Fertility by Education by Marriage Status in Hudson
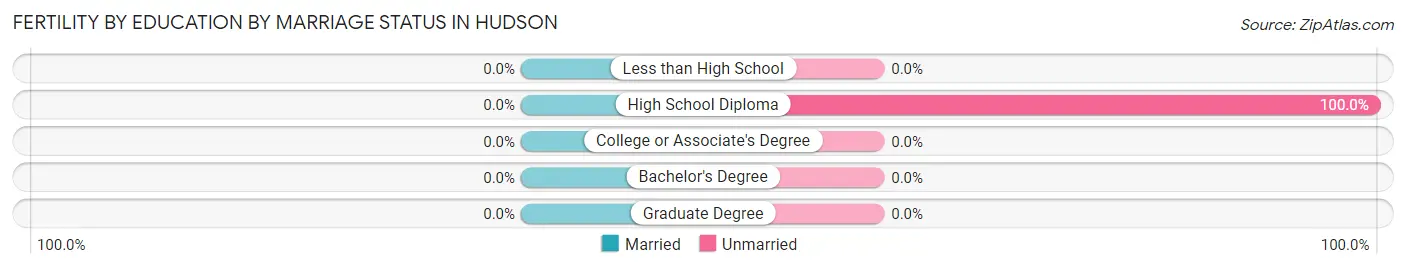
| Educational Attainment | Married | Unmarried |
| Less than High School | 0 (0.0%) | 0 (0.0%) |
| High School Diploma | 0 (0.0%) | 7 (100.0%) |
| College or Associate's Degree | 0 (0.0%) | 0 (0.0%) |
| Bachelor's Degree | 0 (0.0%) | 0 (0.0%) |
| Graduate Degree | 0 (0.0%) | 0 (0.0%) |
| Total | 0 (0.0%) | 7 (100.0%) |
Employment Characteristics in Hudson
Employment by Class of Employer in Hudson
Among the 3,445 employed individuals in Hudson, private company employees (2,431 | 70.6%), self-employed (incorporated) (287 | 8.3%), and local government employees (191 | 5.5%) make up the most common classes of employment.
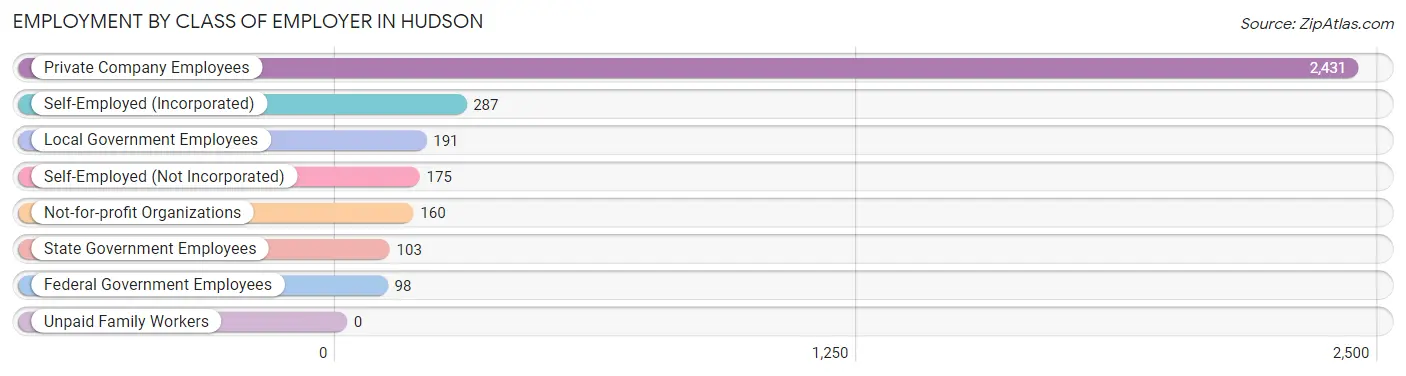
| Employer Class | # Employees | % Employees |
| Private Company Employees | 2,431 | 70.6% |
| Self-Employed (Incorporated) | 287 | 8.3% |
| Self-Employed (Not Incorporated) | 175 | 5.1% |
| Not-for-profit Organizations | 160 | 4.6% |
| Local Government Employees | 191 | 5.5% |
| State Government Employees | 103 | 3.0% |
| Federal Government Employees | 98 | 2.8% |
| Unpaid Family Workers | 0 | 0.0% |
| Total | 3,445 | 100.0% |
Employment Status by Age in Hudson
According to the labor force statistics for Hudson, out of the total population over 16 years of age (9,954), 37.8% or 3,763 individuals are in the labor force, with 6.0% or 226 of them unemployed. The age group with the highest labor force participation rate is 25 to 29 years, with 87.0% or 187 individuals in the labor force. Within the labor force, the 20 to 24 years age range has the highest percentage of unemployed individuals, with 50.6% or 78 of them being unemployed.
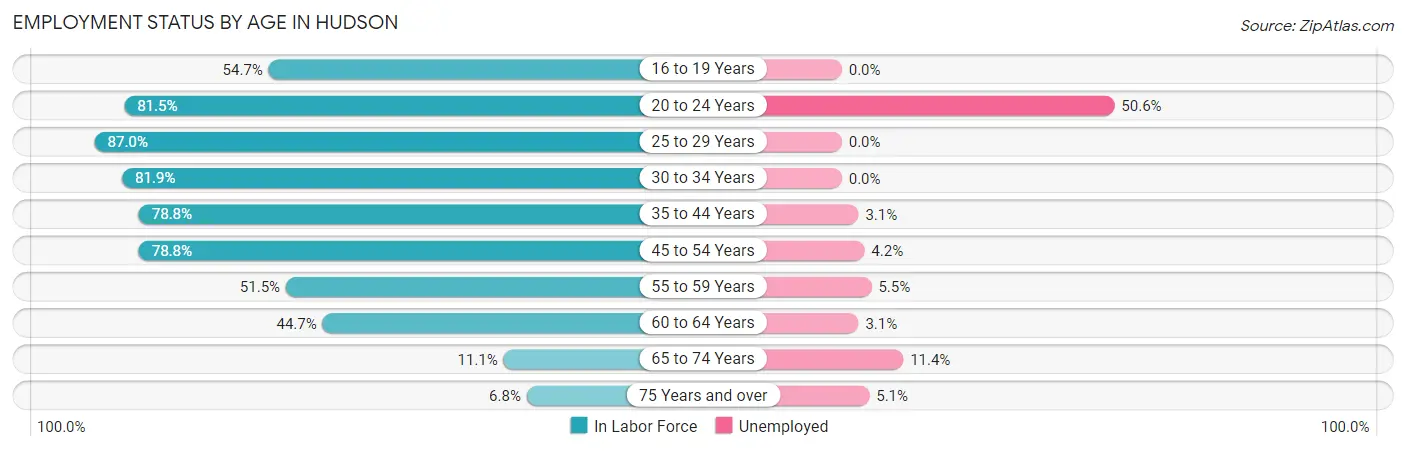
| Age Bracket | In Labor Force | Unemployed |
| 16 to 19 Years | 140 (54.7%) | 0 (0.0%) |
| 20 to 24 Years | 154 (81.5%) | 78 (50.6%) |
| 25 to 29 Years | 187 (87.0%) | 0 (0.0%) |
| 30 to 34 Years | 221 (81.9%) | 0 (0.0%) |
| 35 to 44 Years | 619 (78.8%) | 19 (3.1%) |
| 45 to 54 Years | 1,041 (78.8%) | 44 (4.2%) |
| 55 to 59 Years | 472 (51.5%) | 26 (5.5%) |
| 60 to 64 Years | 480 (44.7%) | 15 (3.1%) |
| 65 to 74 Years | 290 (11.1%) | 33 (11.4%) |
| 75 Years and over | 157 (6.8%) | 8 (5.1%) |
| Total | 3,763 (37.8%) | 226 (6.0%) |
Employment Status by Educational Attainment in Hudson
According to labor force statistics for Hudson, 65.9% of individuals (3,019) out of the total population between 25 and 64 years of age (4,581) are in the labor force, with 3.5% or 106 of them being unemployed. The group with the highest labor force participation rate are those with the educational attainment of college / associate degree, with 73.8% or 995 individuals in the labor force. Within the labor force, individuals with less than high school education have the highest percentage of unemployment, with 9.2% or 20 of them being unemployed.
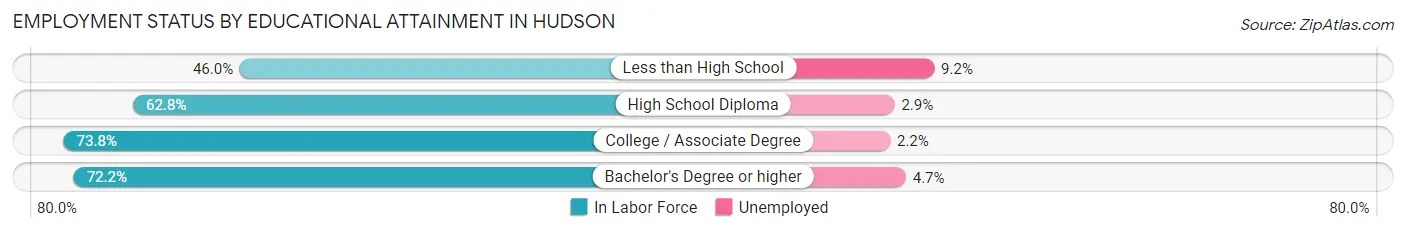
| Educational Attainment | In Labor Force | Unemployed |
| Less than High School | 217 (46.0%) | 43 (9.2%) |
| High School Diploma | 1,239 (62.8%) | 57 (2.9%) |
| College / Associate Degree | 995 (73.8%) | 30 (2.2%) |
| Bachelor's Degree or higher | 569 (72.2%) | 37 (4.7%) |
| Total | 3,019 (65.9%) | 160 (3.5%) |
Employment Occupations by Sex in Hudson
Management, Business, Science and Arts Occupations
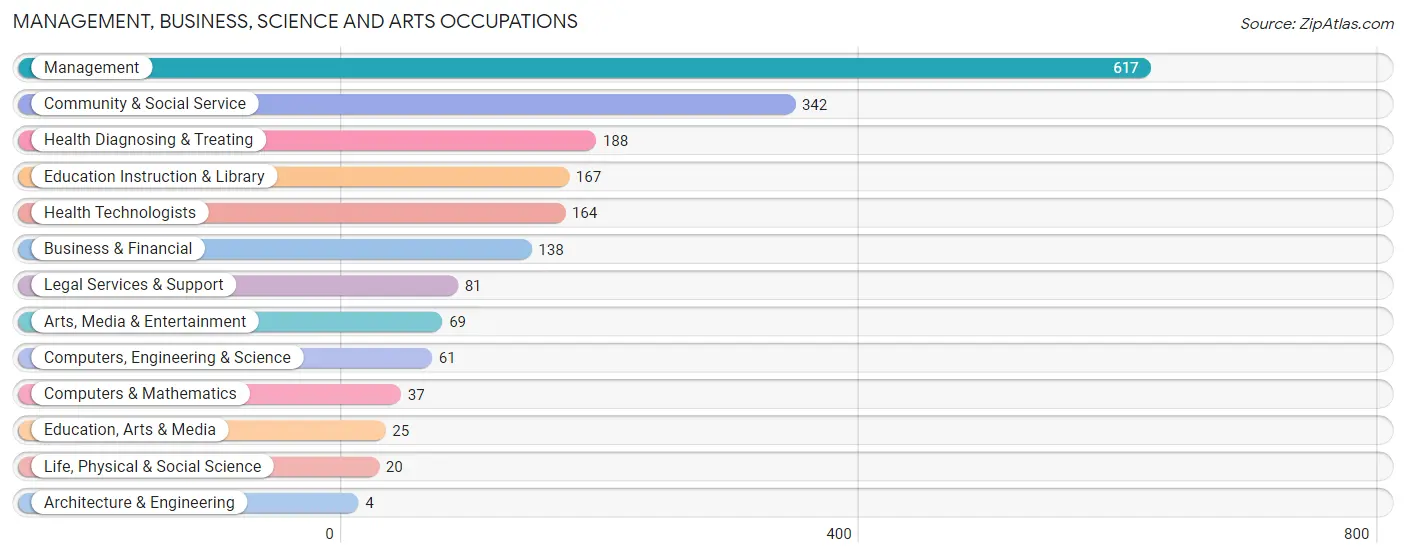
The most common Management, Business, Science and Arts occupations in Hudson are Management (617 | 17.6%), Community & Social Service (342 | 9.8%), Health Diagnosing & Treating (188 | 5.4%), Education Instruction & Library (167 | 4.8%), and Health Technologists (164 | 4.7%).
Management, Business, Science and Arts Occupations by Sex
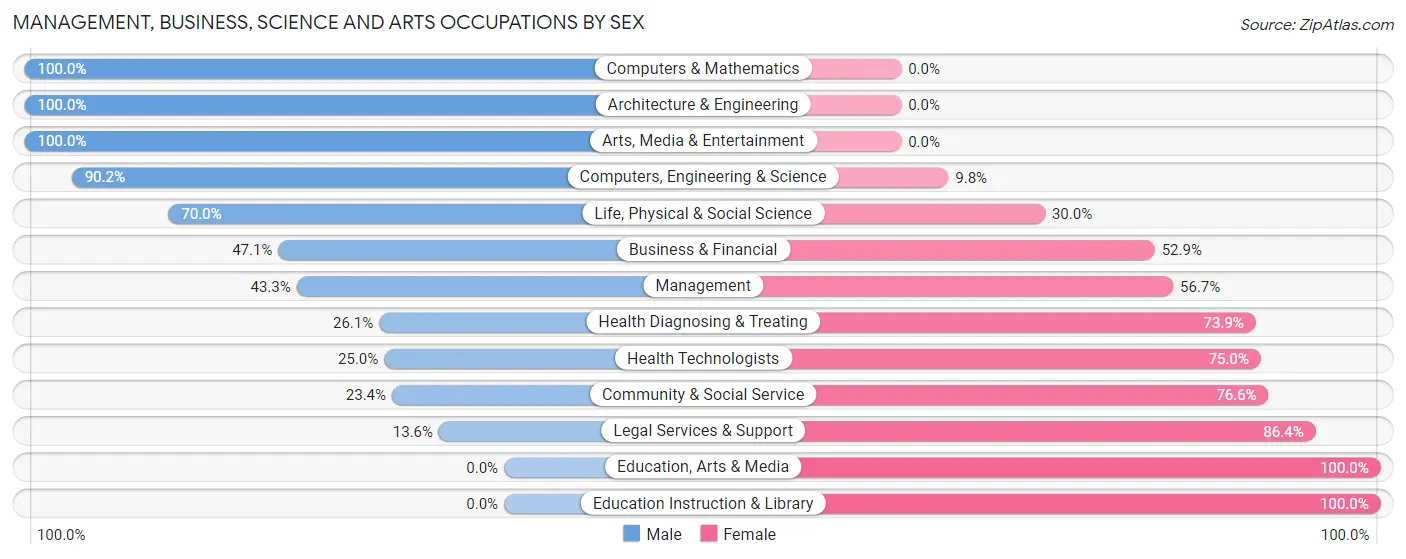
Within the Management, Business, Science and Arts occupations in Hudson, the most male-oriented occupations are Computers & Mathematics (100.0%), Architecture & Engineering (100.0%), and Arts, Media & Entertainment (100.0%), while the most female-oriented occupations are Education, Arts & Media (100.0%), Education Instruction & Library (100.0%), and Legal Services & Support (86.4%).
| Occupation | Male | Female |
| Management | 267 (43.3%) | 350 (56.7%) |
| Business & Financial | 65 (47.1%) | 73 (52.9%) |
| Computers, Engineering & Science | 55 (90.2%) | 6 (9.8%) |
| Computers & Mathematics | 37 (100.0%) | 0 (0.0%) |
| Architecture & Engineering | 4 (100.0%) | 0 (0.0%) |
| Life, Physical & Social Science | 14 (70.0%) | 6 (30.0%) |
| Community & Social Service | 80 (23.4%) | 262 (76.6%) |
| Education, Arts & Media | 0 (0.0%) | 25 (100.0%) |
| Legal Services & Support | 11 (13.6%) | 70 (86.4%) |
| Education Instruction & Library | 0 (0.0%) | 167 (100.0%) |
| Arts, Media & Entertainment | 69 (100.0%) | 0 (0.0%) |
| Health Diagnosing & Treating | 49 (26.1%) | 139 (73.9%) |
| Health Technologists | 41 (25.0%) | 123 (75.0%) |
| Total (Category) | 516 (38.3%) | 830 (61.7%) |
| Total (Overall) | 1,736 (49.5%) | 1,768 (50.5%) |
Services Occupations
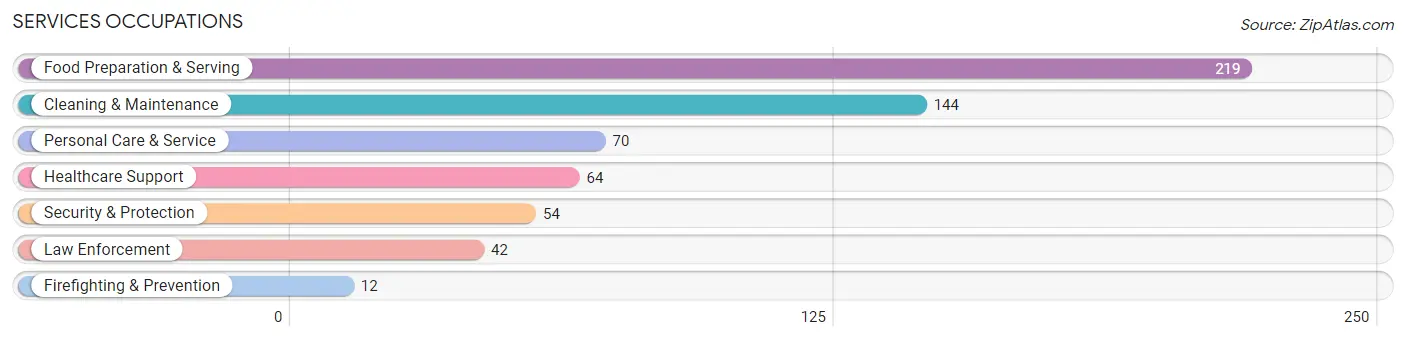
The most common Services occupations in Hudson are Food Preparation & Serving (219 | 6.2%), Cleaning & Maintenance (144 | 4.1%), Personal Care & Service (70 | 2.0%), Healthcare Support (64 | 1.8%), and Security & Protection (54 | 1.5%).
Services Occupations by Sex
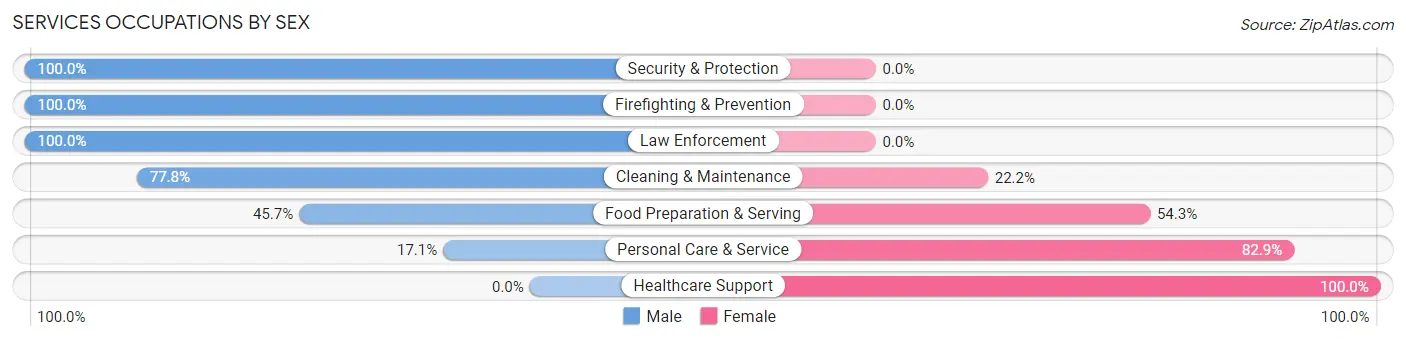
Within the Services occupations in Hudson, the most male-oriented occupations are Security & Protection (100.0%), Firefighting & Prevention (100.0%), and Law Enforcement (100.0%), while the most female-oriented occupations are Healthcare Support (100.0%), Personal Care & Service (82.9%), and Food Preparation & Serving (54.3%).
| Occupation | Male | Female |
| Healthcare Support | 0 (0.0%) | 64 (100.0%) |
| Security & Protection | 54 (100.0%) | 0 (0.0%) |
| Firefighting & Prevention | 12 (100.0%) | 0 (0.0%) |
| Law Enforcement | 42 (100.0%) | 0 (0.0%) |
| Food Preparation & Serving | 100 (45.7%) | 119 (54.3%) |
| Cleaning & Maintenance | 112 (77.8%) | 32 (22.2%) |
| Personal Care & Service | 12 (17.1%) | 58 (82.9%) |
| Total (Category) | 278 (50.4%) | 273 (49.5%) |
| Total (Overall) | 1,736 (49.5%) | 1,768 (50.5%) |
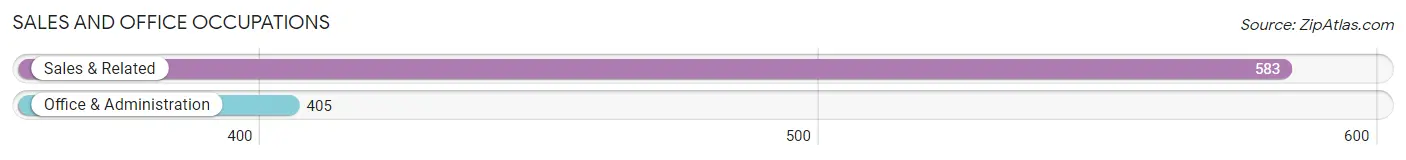
Sales and Office Occupations
The most common Sales and Office occupations in Hudson are Sales & Related (583 | 16.6%), and Office & Administration (405 | 11.6%).
Sales and Office Occupations by Sex
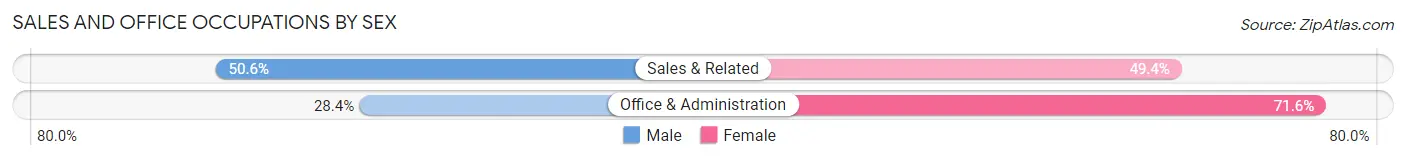
| Occupation | Male | Female |
| Sales & Related | 295 (50.6%) | 288 (49.4%) |
| Office & Administration | 115 (28.4%) | 290 (71.6%) |
| Total (Category) | 410 (41.5%) | 578 (58.5%) |
| Total (Overall) | 1,736 (49.5%) | 1,768 (50.5%) |
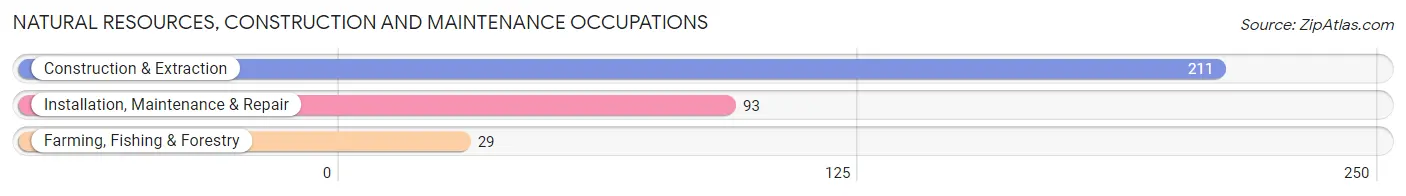
Natural Resources, Construction and Maintenance Occupations
The most common Natural Resources, Construction and Maintenance occupations in Hudson are Construction & Extraction (211 | 6.0%), Installation, Maintenance & Repair (93 | 2.6%), and Farming, Fishing & Forestry (29 | 0.8%).
Natural Resources, Construction and Maintenance Occupations by Sex
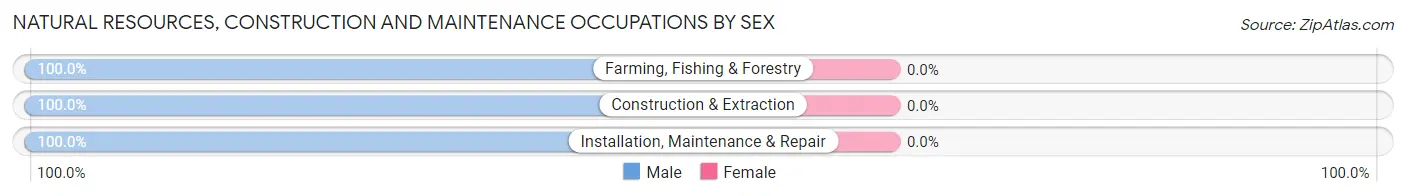
| Occupation | Male | Female |
| Farming, Fishing & Forestry | 29 (100.0%) | 0 (0.0%) |
| Construction & Extraction | 211 (100.0%) | 0 (0.0%) |
| Installation, Maintenance & Repair | 93 (100.0%) | 0 (0.0%) |
| Total (Category) | 333 (100.0%) | 0 (0.0%) |
| Total (Overall) | 1,736 (49.5%) | 1,768 (50.5%) |
Production, Transportation and Moving Occupations
The most common Production, Transportation and Moving occupations in Hudson are Transportation (152 | 4.3%), Material Moving (72 | 2.1%), and Production (62 | 1.8%).
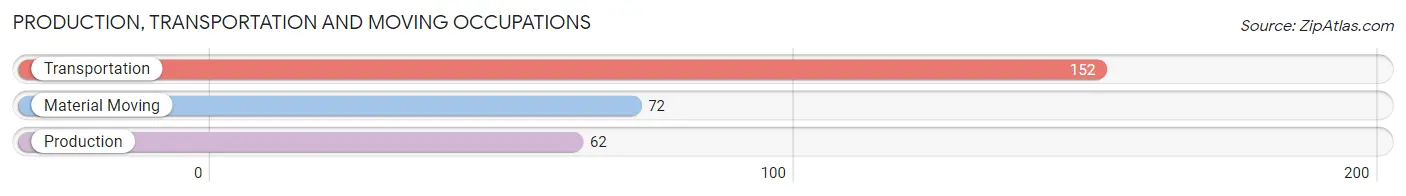
Production, Transportation and Moving Occupations by Sex
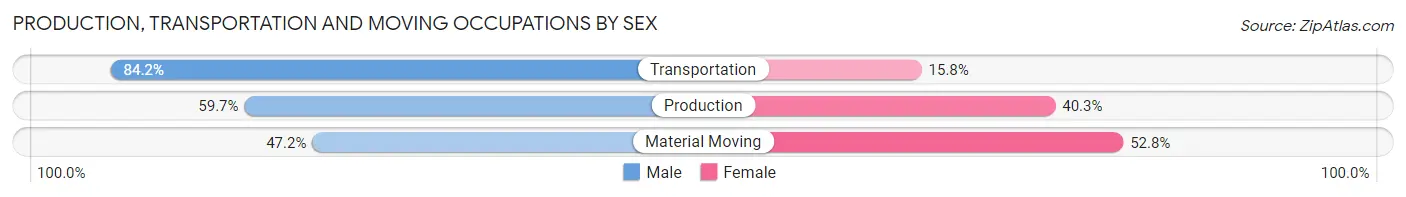
| Occupation | Male | Female |
| Production | 37 (59.7%) | 25 (40.3%) |
| Transportation | 128 (84.2%) | 24 (15.8%) |
| Material Moving | 34 (47.2%) | 38 (52.8%) |
| Total (Category) | 199 (69.6%) | 87 (30.4%) |
| Total (Overall) | 1,736 (49.5%) | 1,768 (50.5%) |
Employment Industries by Sex in Hudson
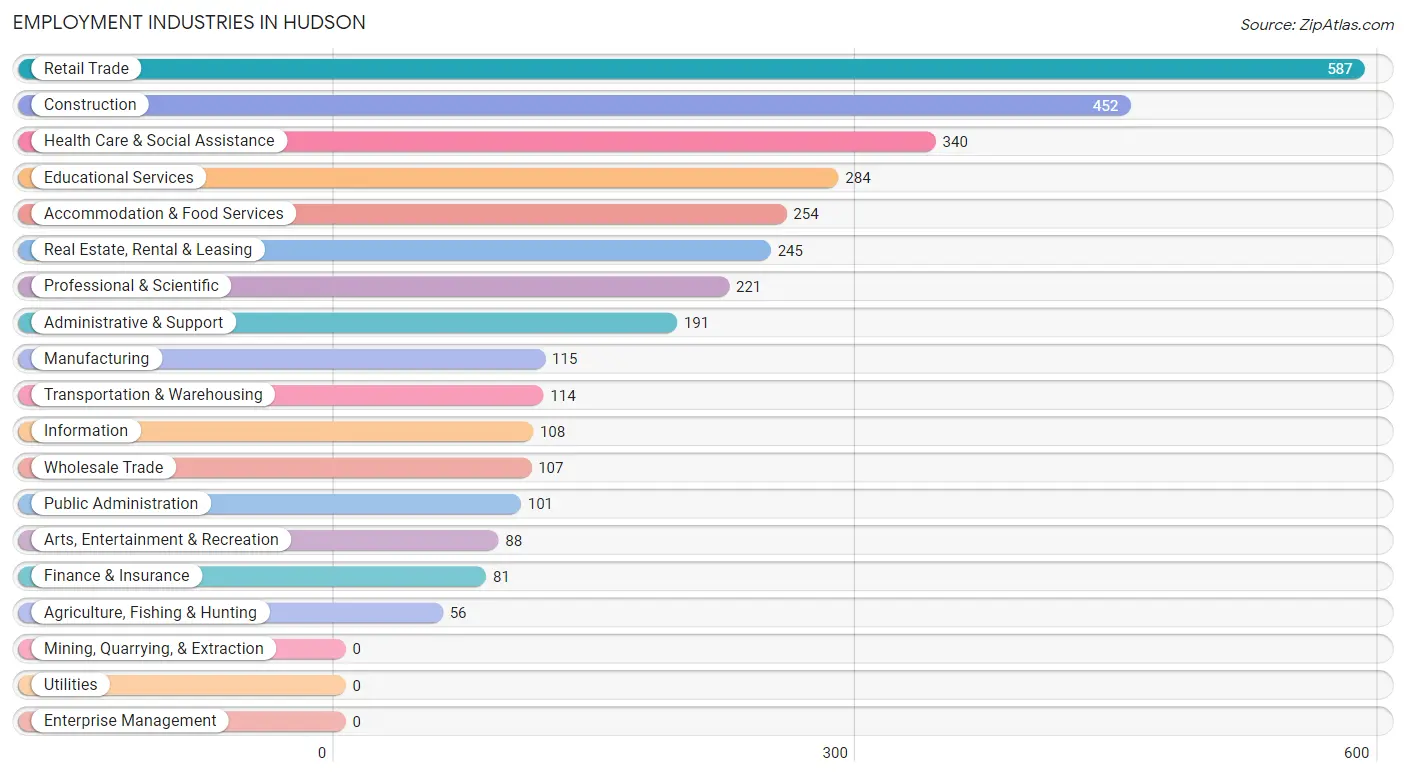
Employment Industries in Hudson
The major employment industries in Hudson include Retail Trade (587 | 16.8%), Construction (452 | 12.9%), Health Care & Social Assistance (340 | 9.7%), Educational Services (284 | 8.1%), and Accommodation & Food Services (254 | 7.2%).
Employment Industries by Sex in Hudson
The Hudson industries that see more men than women are Transportation & Warehousing (93.0%), Agriculture, Fishing & Hunting (80.4%), and Manufacturing (80.0%), whereas the industries that tend to have a higher number of women are Finance & Insurance (100.0%), Educational Services (95.4%), and Health Care & Social Assistance (82.4%).
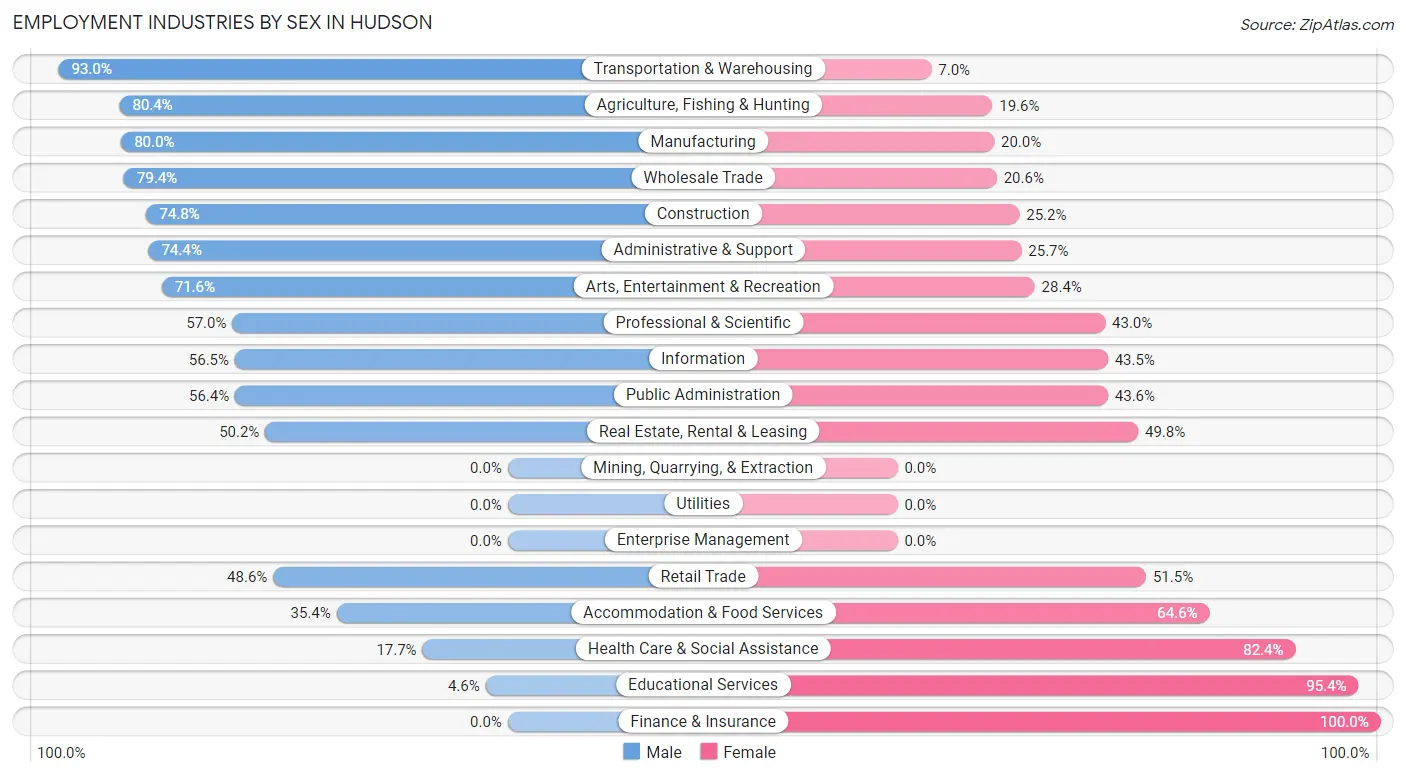
| Industry | Male | Female |
| Agriculture, Fishing & Hunting | 45 (80.4%) | 11 (19.6%) |
| Mining, Quarrying, & Extraction | 0 (0.0%) | 0 (0.0%) |
| Construction | 338 (74.8%) | 114 (25.2%) |
| Manufacturing | 92 (80.0%) | 23 (20.0%) |
| Wholesale Trade | 85 (79.4%) | 22 (20.6%) |
| Retail Trade | 285 (48.5%) | 302 (51.4%) |
| Transportation & Warehousing | 106 (93.0%) | 8 (7.0%) |
| Utilities | 0 (0.0%) | 0 (0.0%) |
| Information | 61 (56.5%) | 47 (43.5%) |
| Finance & Insurance | 0 (0.0%) | 81 (100.0%) |
| Real Estate, Rental & Leasing | 123 (50.2%) | 122 (49.8%) |
| Professional & Scientific | 126 (57.0%) | 95 (43.0%) |
| Enterprise Management | 0 (0.0%) | 0 (0.0%) |
| Administrative & Support | 142 (74.4%) | 49 (25.7%) |
| Educational Services | 13 (4.6%) | 271 (95.4%) |
| Health Care & Social Assistance | 60 (17.6%) | 280 (82.4%) |
| Arts, Entertainment & Recreation | 63 (71.6%) | 25 (28.4%) |
| Accommodation & Food Services | 90 (35.4%) | 164 (64.6%) |
| Public Administration | 57 (56.4%) | 44 (43.6%) |
| Total | 1,736 (49.5%) | 1,768 (50.5%) |
Education in Hudson
School Enrollment in Hudson
The most common levels of schooling among the 923 students in Hudson are high school (241 | 26.1%), elementary school (193 | 20.9%), and college / undergraduate (187 | 20.3%).
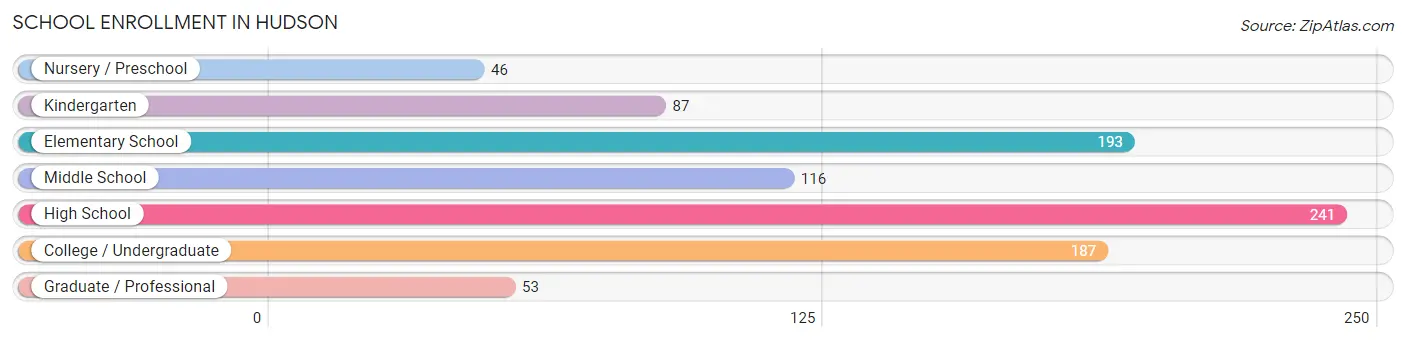
| School Level | # Students | % Students |
| Nursery / Preschool | 46 | 5.0% |
| Kindergarten | 87 | 9.4% |
| Elementary School | 193 | 20.9% |
| Middle School | 116 | 12.6% |
| High School | 241 | 26.1% |
| College / Undergraduate | 187 | 20.3% |
| Graduate / Professional | 53 | 5.7% |
| Total | 923 | 100.0% |
School Enrollment by Age by Funding Source in Hudson
Out of a total of 923 students who are enrolled in schools in Hudson, 138 (15.0%) attend a private institution, while the remaining 785 (85.0%) are enrolled in public schools. The age group of 3 to 4 year olds has the highest likelihood of being enrolled in private schools, with 29 (44.6% in the age bracket) enrolled. Conversely, the age group of 15 to 17 year olds has the lowest likelihood of being enrolled in a private school, with 162 (100.0% in the age bracket) attending a public institution.
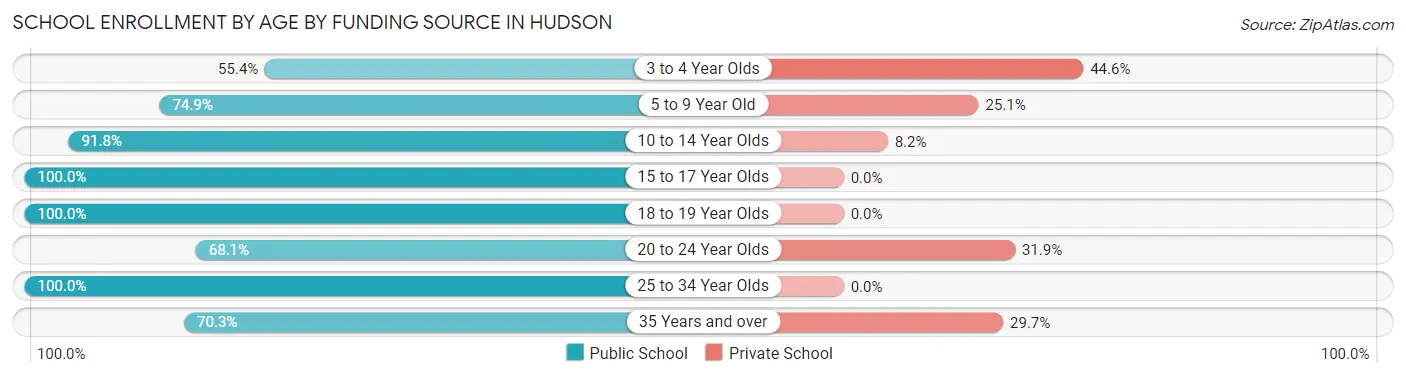
| Age Bracket | Public School | Private School |
| 3 to 4 Year Olds | 36 (55.4%) | 29 (44.6%) |
| 5 to 9 Year Old | 143 (74.9%) | 48 (25.1%) |
| 10 to 14 Year Olds | 179 (91.8%) | 16 (8.2%) |
| 15 to 17 Year Olds | 162 (100.0%) | 0 (0.0%) |
| 18 to 19 Year Olds | 117 (100.0%) | 0 (0.0%) |
| 20 to 24 Year Olds | 32 (68.1%) | 15 (31.9%) |
| 25 to 34 Year Olds | 45 (100.0%) | 0 (0.0%) |
| 35 Years and over | 71 (70.3%) | 30 (29.7%) |
| Total | 785 (85.0%) | 138 (15.0%) |
Educational Attainment by Field of Study in Hudson
Business (389 | 22.2%), education (345 | 19.7%), science & technology (273 | 15.6%), arts & humanities (138 | 7.9%), and psychology (113 | 6.4%) are the most common fields of study among 1,755 individuals in Hudson who have obtained a bachelor's degree or higher.
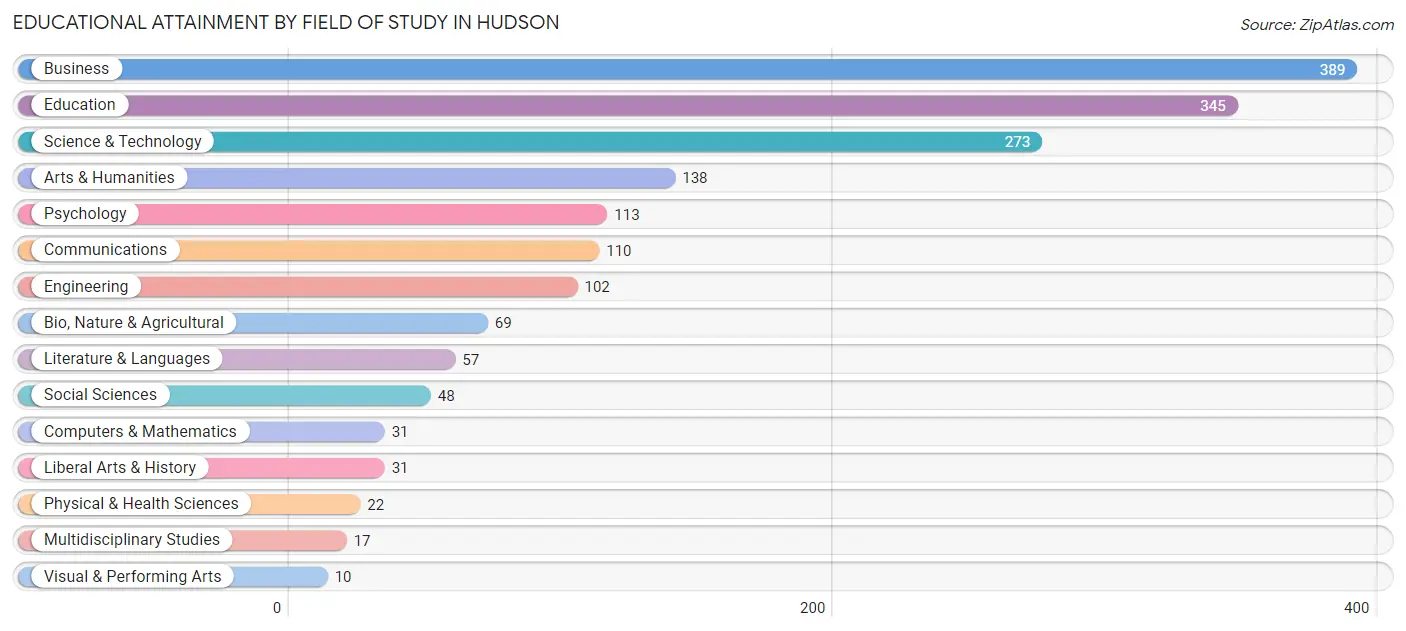
| Field of Study | # Graduates | % Graduates |
| Computers & Mathematics | 31 | 1.8% |
| Bio, Nature & Agricultural | 69 | 3.9% |
| Physical & Health Sciences | 22 | 1.3% |
| Psychology | 113 | 6.4% |
| Social Sciences | 48 | 2.7% |
| Engineering | 102 | 5.8% |
| Multidisciplinary Studies | 17 | 1.0% |
| Science & Technology | 273 | 15.6% |
| Business | 389 | 22.2% |
| Education | 345 | 19.7% |
| Literature & Languages | 57 | 3.3% |
| Liberal Arts & History | 31 | 1.8% |
| Visual & Performing Arts | 10 | 0.6% |
| Communications | 110 | 6.3% |
| Arts & Humanities | 138 | 7.9% |
| Total | 1,755 | 100.0% |
Transportation & Commute in Hudson
Vehicle Availability by Sex in Hudson
The most prevalent vehicle ownership categories in Hudson are males with 2 vehicles (862, accounting for 50.7%) and females with 2 vehicles (858, making up 50.0%).
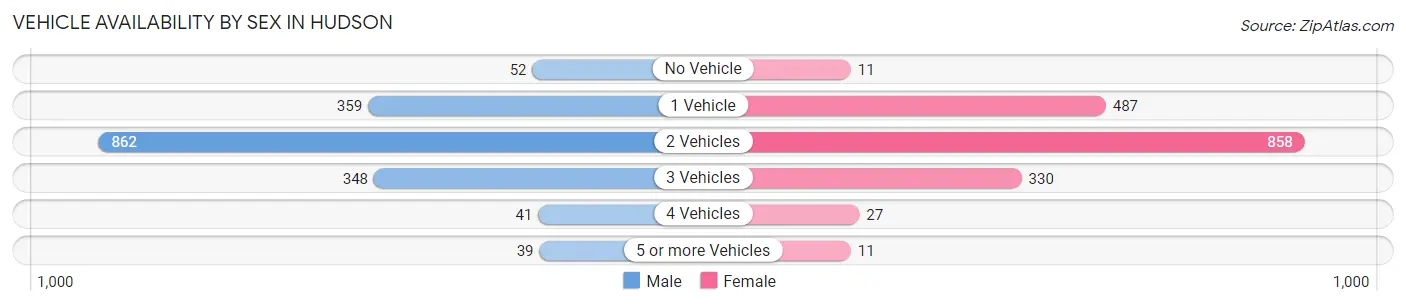
| Vehicles Available | Male | Female |
| No Vehicle | 52 (3.1%) | 11 (0.6%) |
| 1 Vehicle | 359 (21.1%) | 487 (28.2%) |
| 2 Vehicles | 862 (50.7%) | 858 (49.8%) |
| 3 Vehicles | 348 (20.5%) | 330 (19.1%) |
| 4 Vehicles | 41 (2.4%) | 27 (1.6%) |
| 5 or more Vehicles | 39 (2.3%) | 11 (0.6%) |
| Total | 1,701 (100.0%) | 1,724 (100.0%) |
Commute Time in Hudson
The most frequently occuring commute durations in Hudson are 15 to 19 minutes (454 commuters, 15.1%), 60 to 89 minutes (371 commuters, 12.3%), and 45 to 59 minutes (346 commuters, 11.5%).
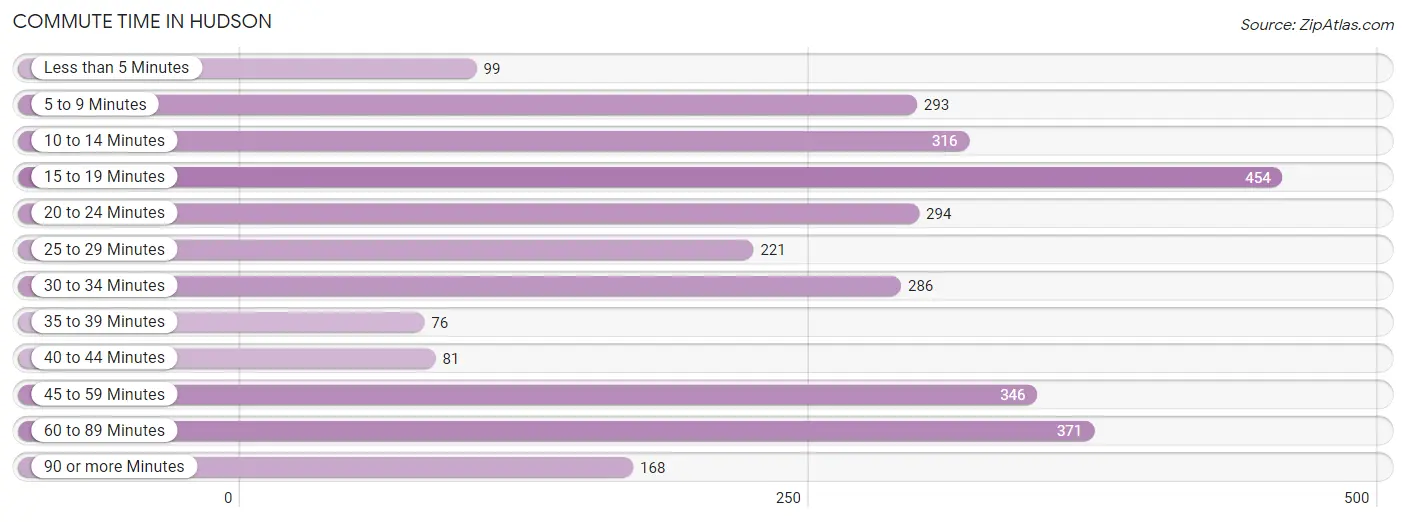
| Commute Time | # Commuters | % Commuters |
| Less than 5 Minutes | 99 | 3.3% |
| 5 to 9 Minutes | 293 | 9.8% |
| 10 to 14 Minutes | 316 | 10.5% |
| 15 to 19 Minutes | 454 | 15.1% |
| 20 to 24 Minutes | 294 | 9.8% |
| 25 to 29 Minutes | 221 | 7.3% |
| 30 to 34 Minutes | 286 | 9.5% |
| 35 to 39 Minutes | 76 | 2.5% |
| 40 to 44 Minutes | 81 | 2.7% |
| 45 to 59 Minutes | 346 | 11.5% |
| 60 to 89 Minutes | 371 | 12.3% |
| 90 or more Minutes | 168 | 5.6% |
Commute Time by Sex in Hudson
The most common commute times in Hudson are 15 to 19 minutes (232 commuters, 15.9%) for males and 60 to 89 minutes (225 commuters, 14.5%) for females.
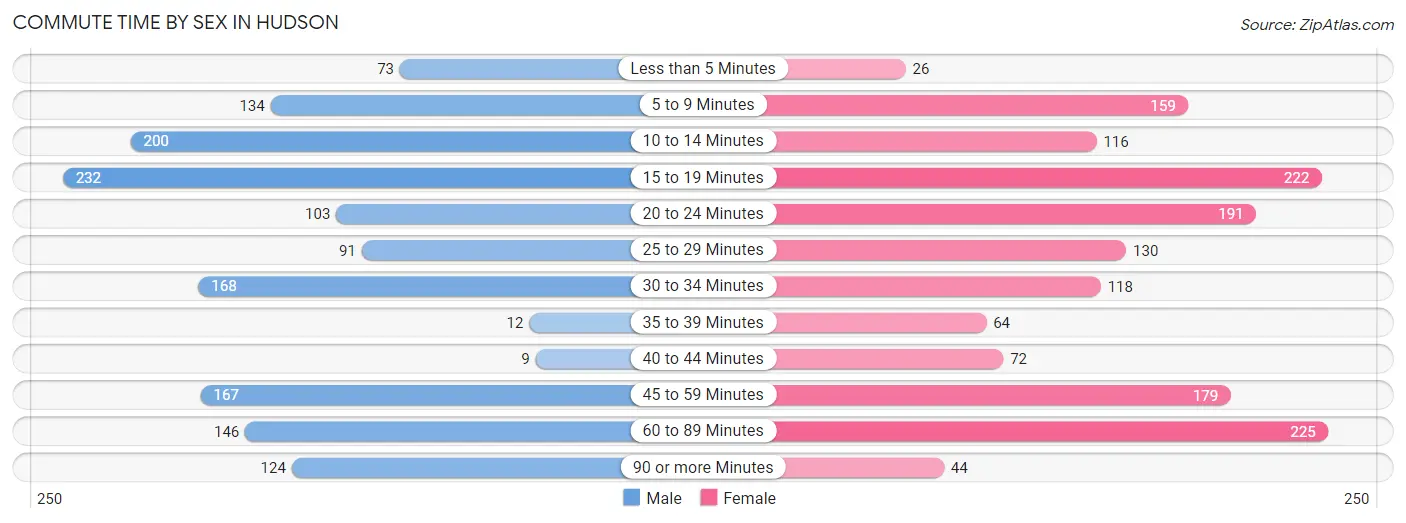
| Commute Time | Male | Female |
| Less than 5 Minutes | 73 (5.0%) | 26 (1.7%) |
| 5 to 9 Minutes | 134 (9.2%) | 159 (10.3%) |
| 10 to 14 Minutes | 200 (13.7%) | 116 (7.5%) |
| 15 to 19 Minutes | 232 (15.9%) | 222 (14.4%) |
| 20 to 24 Minutes | 103 (7.1%) | 191 (12.3%) |
| 25 to 29 Minutes | 91 (6.2%) | 130 (8.4%) |
| 30 to 34 Minutes | 168 (11.5%) | 118 (7.6%) |
| 35 to 39 Minutes | 12 (0.8%) | 64 (4.1%) |
| 40 to 44 Minutes | 9 (0.6%) | 72 (4.7%) |
| 45 to 59 Minutes | 167 (11.5%) | 179 (11.6%) |
| 60 to 89 Minutes | 146 (10.0%) | 225 (14.5%) |
| 90 or more Minutes | 124 (8.5%) | 44 (2.9%) |
Time of Departure to Work by Sex in Hudson
The most frequent times of departure to work in Hudson are 6:30 AM to 6:59 AM (255, 17.5%) for males and 8:00 AM to 8:29 AM (227, 14.7%) for females.
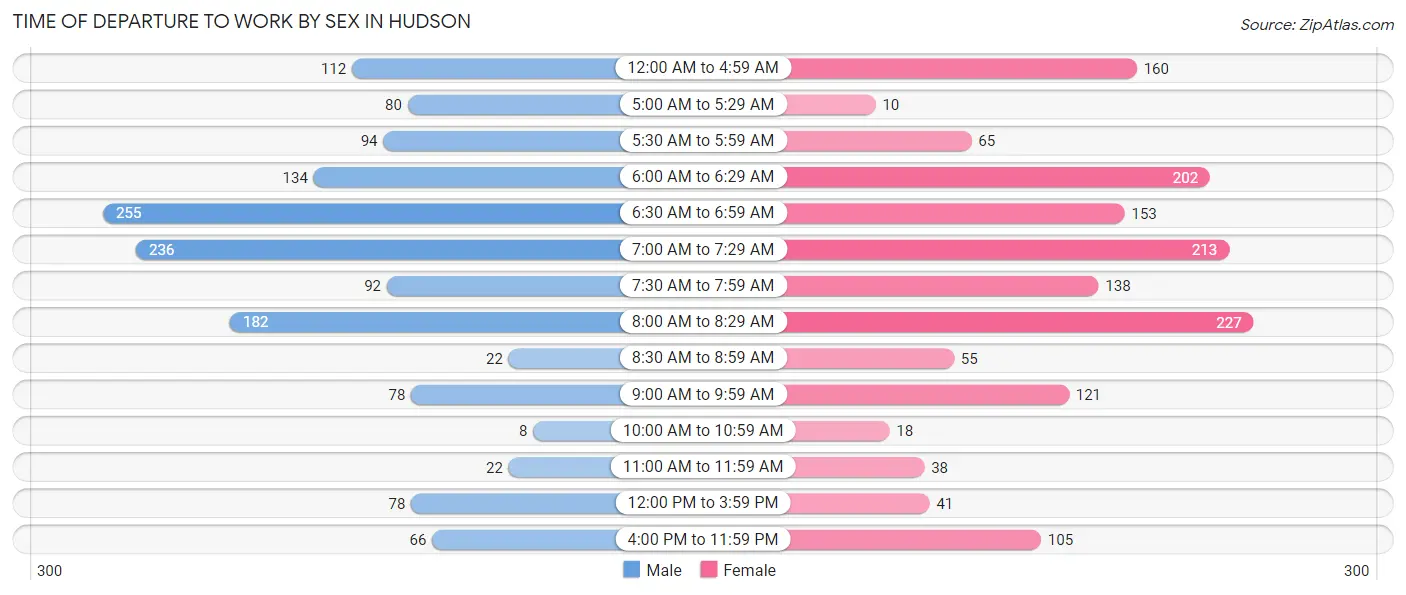
| Time of Departure | Male | Female |
| 12:00 AM to 4:59 AM | 112 (7.7%) | 160 (10.3%) |
| 5:00 AM to 5:29 AM | 80 (5.5%) | 10 (0.6%) |
| 5:30 AM to 5:59 AM | 94 (6.4%) | 65 (4.2%) |
| 6:00 AM to 6:29 AM | 134 (9.2%) | 202 (13.1%) |
| 6:30 AM to 6:59 AM | 255 (17.5%) | 153 (9.9%) |
| 7:00 AM to 7:29 AM | 236 (16.2%) | 213 (13.8%) |
| 7:30 AM to 7:59 AM | 92 (6.3%) | 138 (8.9%) |
| 8:00 AM to 8:29 AM | 182 (12.5%) | 227 (14.7%) |
| 8:30 AM to 8:59 AM | 22 (1.5%) | 55 (3.6%) |
| 9:00 AM to 9:59 AM | 78 (5.3%) | 121 (7.8%) |
| 10:00 AM to 10:59 AM | 8 (0.5%) | 18 (1.2%) |
| 11:00 AM to 11:59 AM | 22 (1.5%) | 38 (2.5%) |
| 12:00 PM to 3:59 PM | 78 (5.3%) | 41 (2.6%) |
| 4:00 PM to 11:59 PM | 66 (4.5%) | 105 (6.8%) |
| Total | 1,459 (100.0%) | 1,546 (100.0%) |
Housing Occupancy in Hudson
Occupancy by Ownership in Hudson
Of the total 5,602 dwellings in Hudson, owner-occupied units account for 4,207 (75.1%), while renter-occupied units make up 1,395 (24.9%).
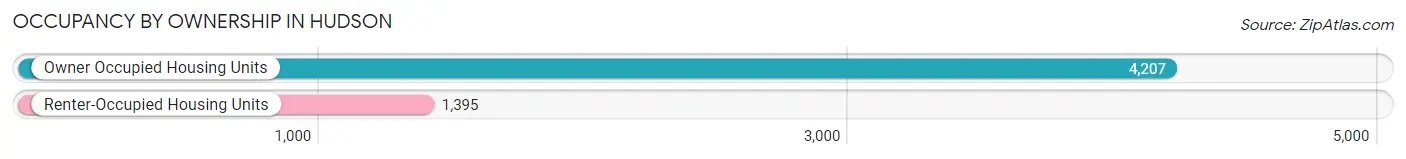
| Occupancy | # Housing Units | % Housing Units |
| Owner Occupied Housing Units | 4,207 | 75.1% |
| Renter-Occupied Housing Units | 1,395 | 24.9% |
| Total Occupied Housing Units | 5,602 | 100.0% |
Occupancy by Household Size in Hudson
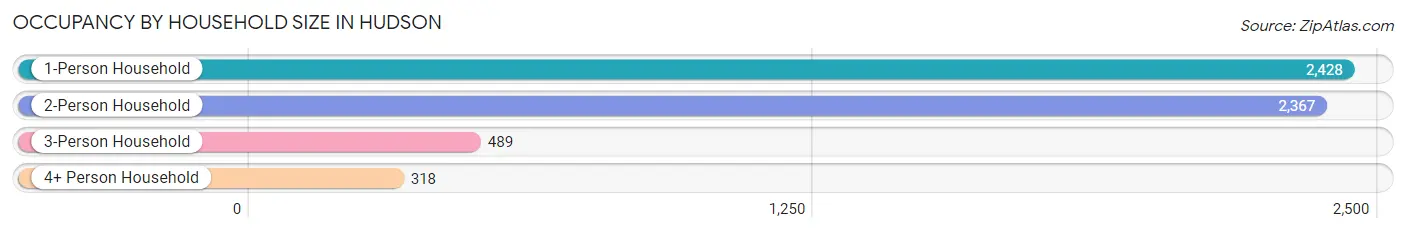
| Household Size | # Housing Units | % Housing Units |
| 1-Person Household | 2,428 | 43.3% |
| 2-Person Household | 2,367 | 42.2% |
| 3-Person Household | 489 | 8.7% |
| 4+ Person Household | 318 | 5.7% |
| Total Housing Units | 5,602 | 100.0% |
Occupancy by Ownership by Household Size in Hudson
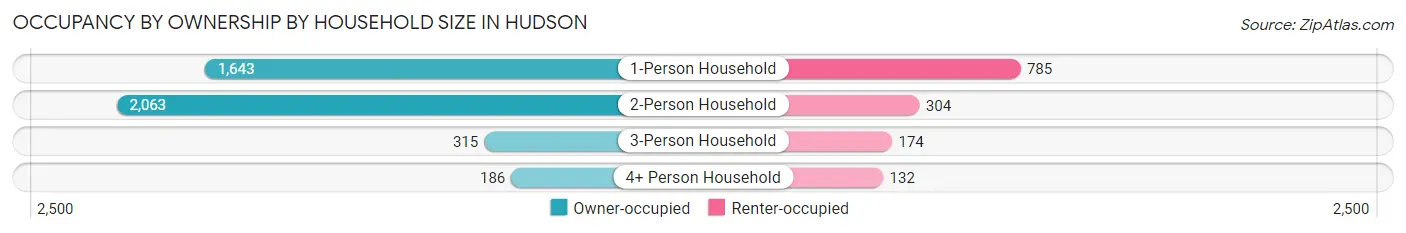
| Household Size | Owner-occupied | Renter-occupied |
| 1-Person Household | 1,643 (67.7%) | 785 (32.3%) |
| 2-Person Household | 2,063 (87.2%) | 304 (12.8%) |
| 3-Person Household | 315 (64.4%) | 174 (35.6%) |
| 4+ Person Household | 186 (58.5%) | 132 (41.5%) |
| Total Housing Units | 4,207 (75.1%) | 1,395 (24.9%) |
Occupancy by Educational Attainment in Hudson
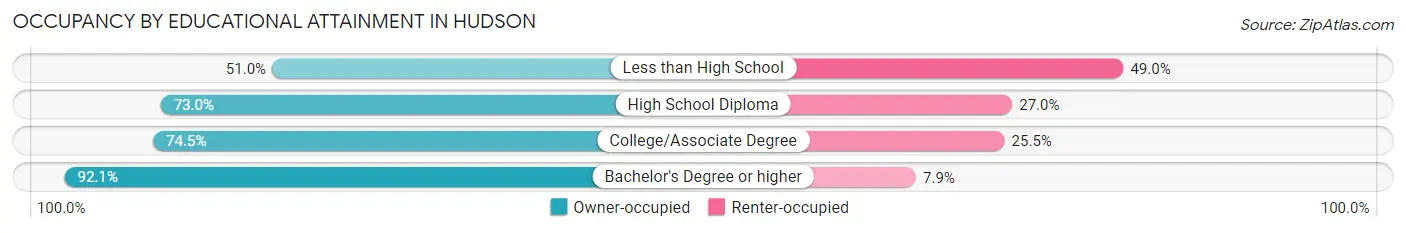
| Household Size | Owner-occupied | Renter-occupied |
| Less than High School | 262 (51.0%) | 252 (49.0%) |
| High School Diploma | 1,685 (73.0%) | 623 (27.0%) |
| College/Associate Degree | 1,272 (74.5%) | 435 (25.5%) |
| Bachelor's Degree or higher | 988 (92.1%) | 85 (7.9%) |
Occupancy by Age of Householder in Hudson
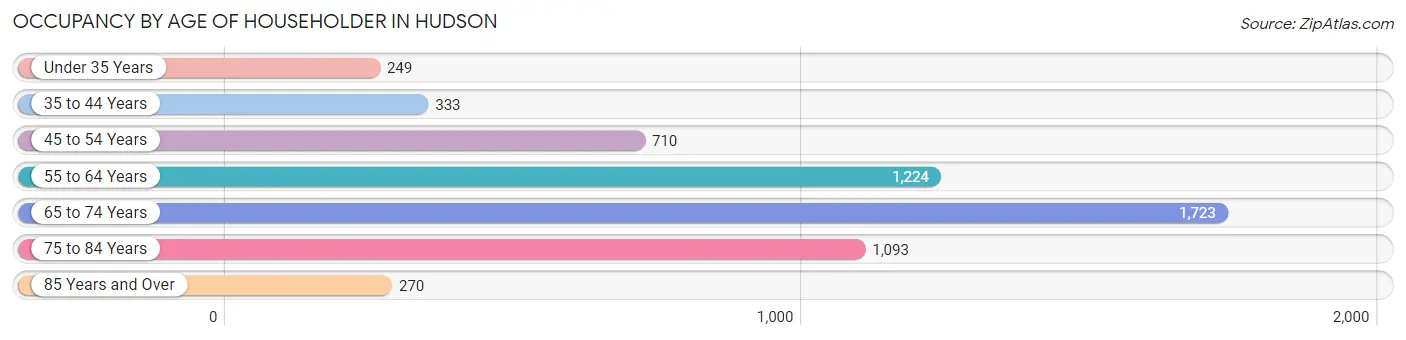
| Age Bracket | # Households | % Households |
| Under 35 Years | 249 | 4.4% |
| 35 to 44 Years | 333 | 5.9% |
| 45 to 54 Years | 710 | 12.7% |
| 55 to 64 Years | 1,224 | 21.8% |
| 65 to 74 Years | 1,723 | 30.8% |
| 75 to 84 Years | 1,093 | 19.5% |
| 85 Years and Over | 270 | 4.8% |
| Total | 5,602 | 100.0% |
Housing Finances in Hudson
Median Income by Occupancy in Hudson
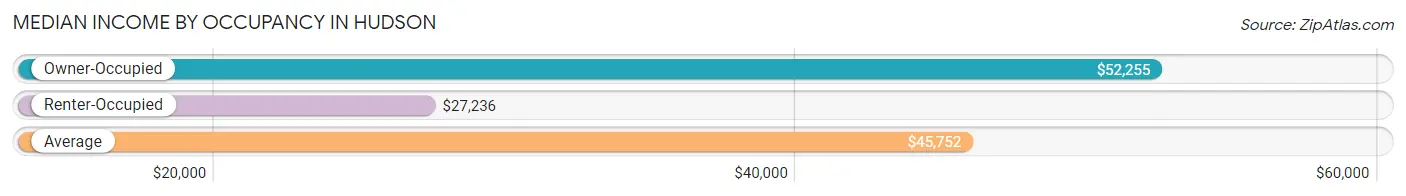
| Occupancy Type | # Households | Median Income |
| Owner-Occupied | 4,207 (75.1%) | $52,255 |
| Renter-Occupied | 1,395 (24.9%) | $27,236 |
| Average | 5,602 (100.0%) | $45,752 |
Occupancy by Householder Income Bracket in Hudson
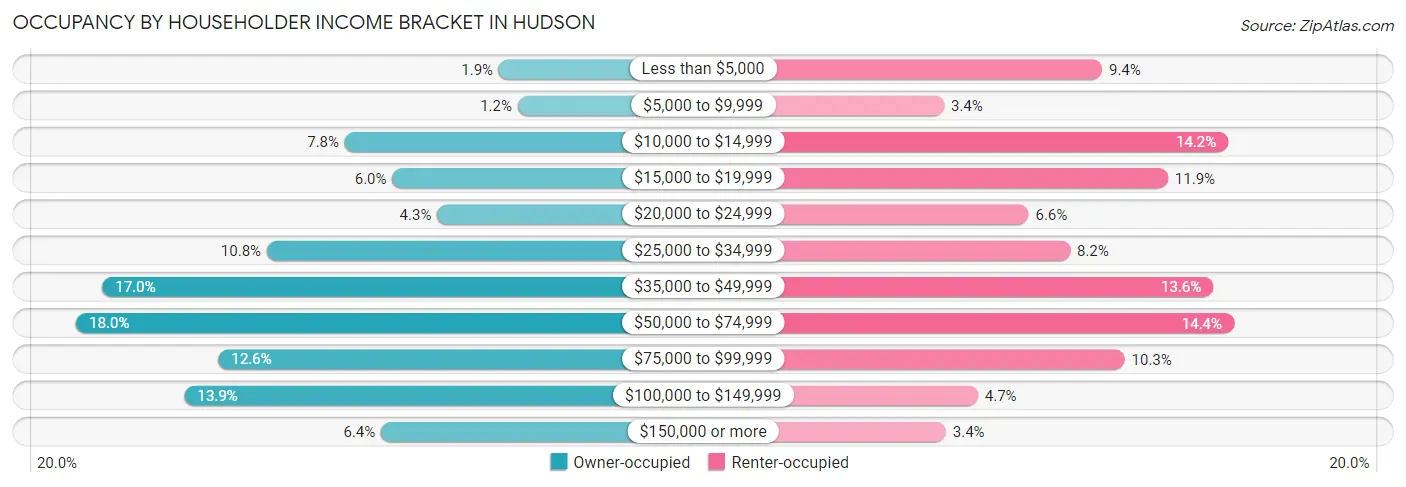
| Income Bracket | Owner-occupied | Renter-occupied |
| Less than $5,000 | 81 (1.9%) | 131 (9.4%) |
| $5,000 to $9,999 | 51 (1.2%) | 47 (3.4%) |
| $10,000 to $14,999 | 328 (7.8%) | 198 (14.2%) |
| $15,000 to $19,999 | 252 (6.0%) | 166 (11.9%) |
| $20,000 to $24,999 | 180 (4.3%) | 92 (6.6%) |
| $25,000 to $34,999 | 453 (10.8%) | 114 (8.2%) |
| $35,000 to $49,999 | 717 (17.0%) | 190 (13.6%) |
| $50,000 to $74,999 | 759 (18.0%) | 201 (14.4%) |
| $75,000 to $99,999 | 531 (12.6%) | 143 (10.2%) |
| $100,000 to $149,999 | 585 (13.9%) | 65 (4.7%) |
| $150,000 or more | 270 (6.4%) | 48 (3.4%) |
| Total | 4,207 (100.0%) | 1,395 (100.0%) |
Monthly Housing Cost Tiers in Hudson
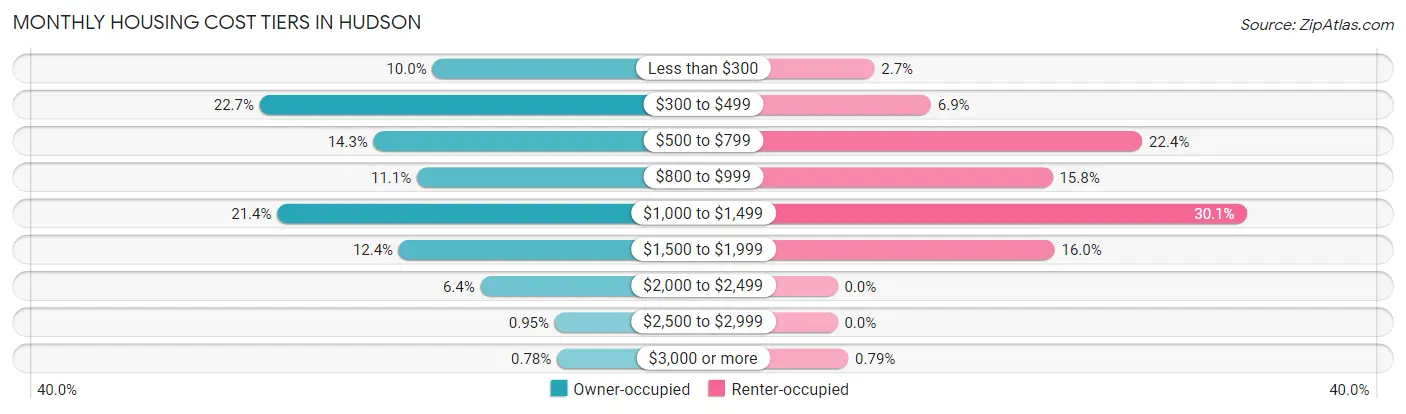
| Monthly Cost | Owner-occupied | Renter-occupied |
| Less than $300 | 419 (10.0%) | 38 (2.7%) |
| $300 to $499 | 954 (22.7%) | 96 (6.9%) |
| $500 to $799 | 601 (14.3%) | 313 (22.4%) |
| $800 to $999 | 467 (11.1%) | 221 (15.8%) |
| $1,000 to $1,499 | 900 (21.4%) | 420 (30.1%) |
| $1,500 to $1,999 | 523 (12.4%) | 223 (16.0%) |
| $2,000 to $2,499 | 270 (6.4%) | 0 (0.0%) |
| $2,500 to $2,999 | 40 (0.9%) | 0 (0.0%) |
| $3,000 or more | 33 (0.8%) | 11 (0.8%) |
| Total | 4,207 (100.0%) | 1,395 (100.0%) |
Physical Housing Characteristics in Hudson
Housing Structures in Hudson
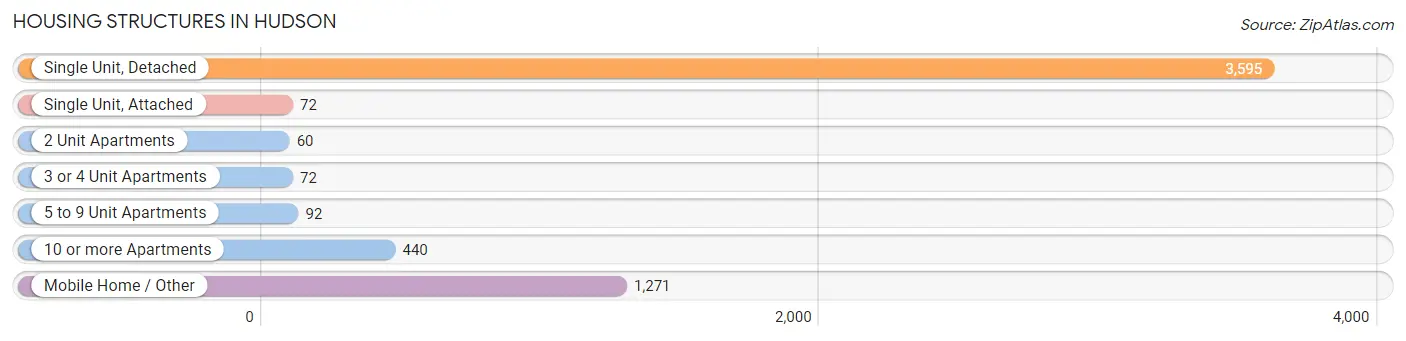
| Structure Type | # Housing Units | % Housing Units |
| Single Unit, Detached | 3,595 | 64.2% |
| Single Unit, Attached | 72 | 1.3% |
| 2 Unit Apartments | 60 | 1.1% |
| 3 or 4 Unit Apartments | 72 | 1.3% |
| 5 to 9 Unit Apartments | 92 | 1.6% |
| 10 or more Apartments | 440 | 7.9% |
| Mobile Home / Other | 1,271 | 22.7% |
| Total | 5,602 | 100.0% |
Housing Structures by Occupancy in Hudson
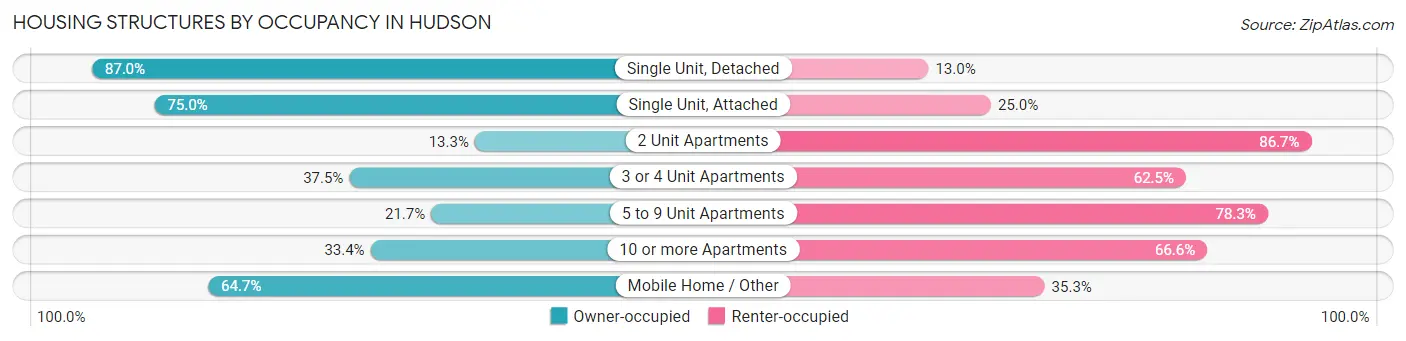
| Structure Type | Owner-occupied | Renter-occupied |
| Single Unit, Detached | 3,129 (87.0%) | 466 (13.0%) |
| Single Unit, Attached | 54 (75.0%) | 18 (25.0%) |
| 2 Unit Apartments | 8 (13.3%) | 52 (86.7%) |
| 3 or 4 Unit Apartments | 27 (37.5%) | 45 (62.5%) |
| 5 to 9 Unit Apartments | 20 (21.7%) | 72 (78.3%) |
| 10 or more Apartments | 147 (33.4%) | 293 (66.6%) |
| Mobile Home / Other | 822 (64.7%) | 449 (35.3%) |
| Total | 4,207 (75.1%) | 1,395 (24.9%) |
Housing Structures by Number of Rooms in Hudson
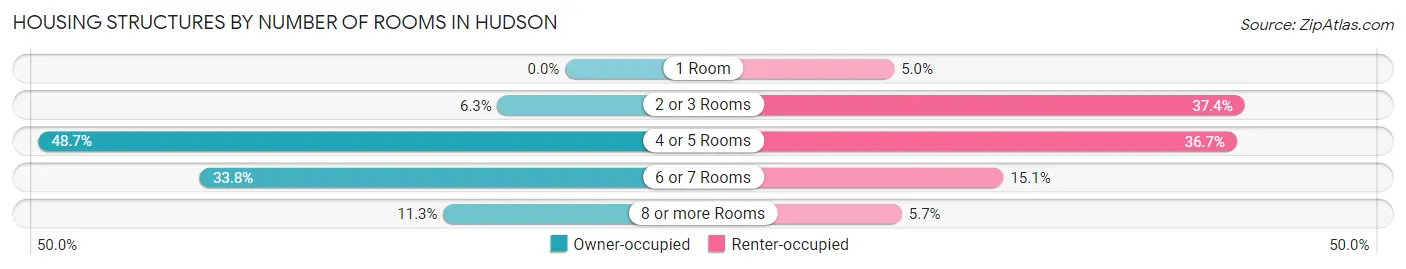
| Number of Rooms | Owner-occupied | Renter-occupied |
| 1 Room | 0 (0.0%) | 70 (5.0%) |
| 2 or 3 Rooms | 263 (6.2%) | 522 (37.4%) |
| 4 or 5 Rooms | 2,049 (48.7%) | 512 (36.7%) |
| 6 or 7 Rooms | 1,421 (33.8%) | 211 (15.1%) |
| 8 or more Rooms | 474 (11.3%) | 80 (5.7%) |
| Total | 4,207 (100.0%) | 1,395 (100.0%) |
Housing Structure by Heating Type in Hudson
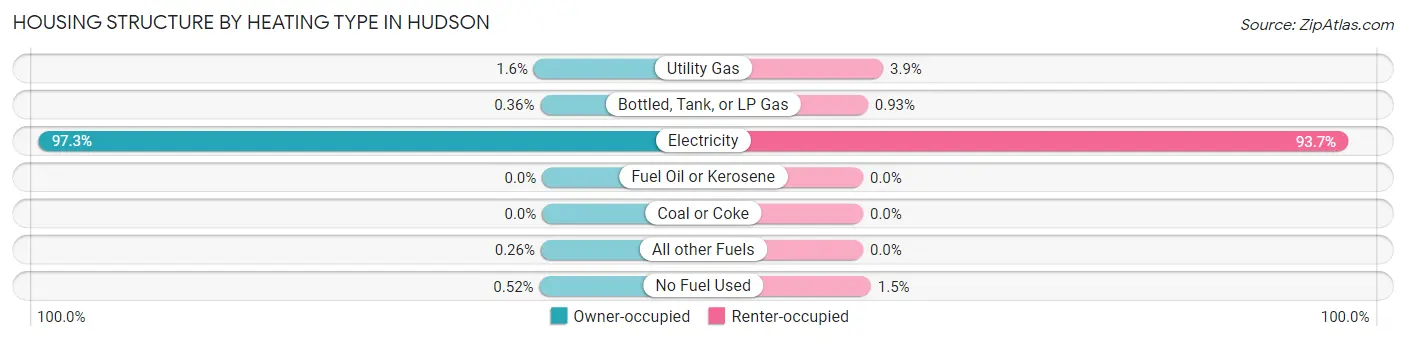
| Heating Type | Owner-occupied | Renter-occupied |
| Utility Gas | 67 (1.6%) | 54 (3.9%) |
| Bottled, Tank, or LP Gas | 15 (0.4%) | 13 (0.9%) |
| Electricity | 4,092 (97.3%) | 1,307 (93.7%) |
| Fuel Oil or Kerosene | 0 (0.0%) | 0 (0.0%) |
| Coal or Coke | 0 (0.0%) | 0 (0.0%) |
| All other Fuels | 11 (0.3%) | 0 (0.0%) |
| No Fuel Used | 22 (0.5%) | 21 (1.5%) |
| Total | 4,207 (100.0%) | 1,395 (100.0%) |
Household Vehicle Usage in Hudson
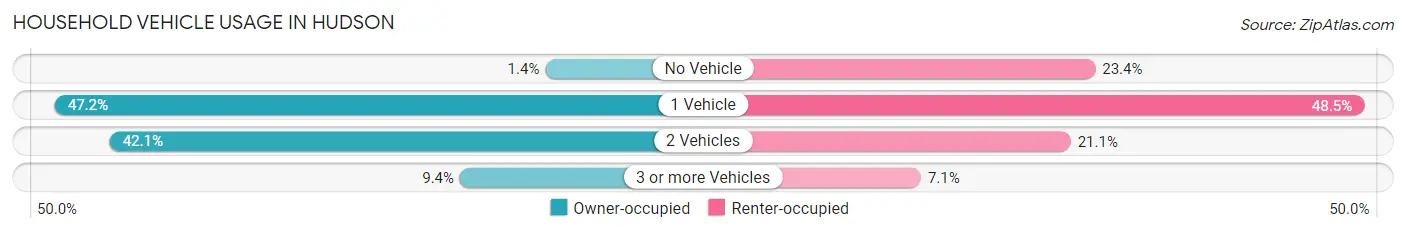
| Vehicles per Household | Owner-occupied | Renter-occupied |
| No Vehicle | 59 (1.4%) | 326 (23.4%) |
| 1 Vehicle | 1,985 (47.2%) | 676 (48.5%) |
| 2 Vehicles | 1,769 (42.0%) | 294 (21.1%) |
| 3 or more Vehicles | 394 (9.4%) | 99 (7.1%) |
| Total | 4,207 (100.0%) | 1,395 (100.0%) |
Real Estate & Mortgages in Hudson
Real Estate and Mortgage Overview in Hudson
| Characteristic | Without Mortgage | With Mortgage |
| Housing Units | 2,371 | 1,836 |
| Median Property Value | $171,200 | $241,800 |
| Median Household Income | $43,869 | $174 |
| Monthly Housing Costs | $467 | $33 |
| Real Estate Taxes | $1,243 | $103 |
Property Value by Mortgage Status in Hudson
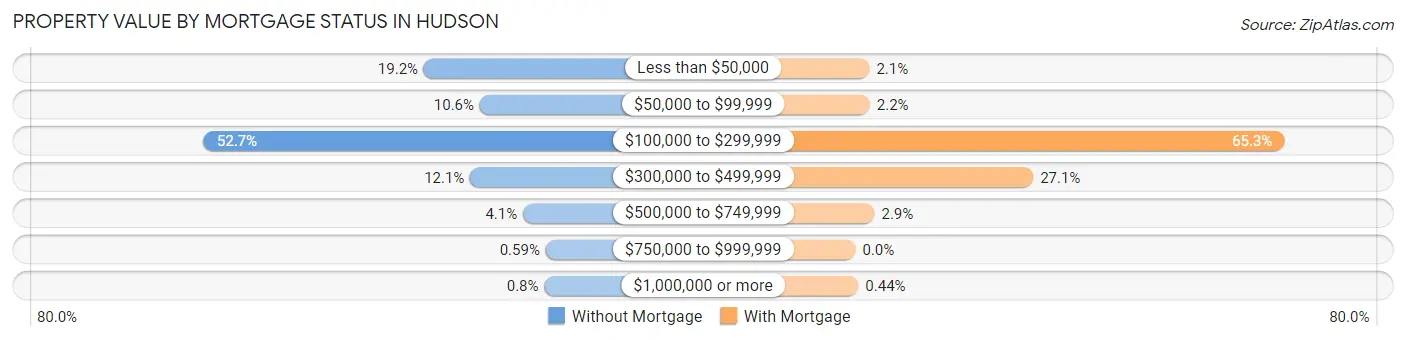
| Property Value | Without Mortgage | With Mortgage |
| Less than $50,000 | 454 (19.2%) | 39 (2.1%) |
| $50,000 to $99,999 | 252 (10.6%) | 40 (2.2%) |
| $100,000 to $299,999 | 1,249 (52.7%) | 1,199 (65.3%) |
| $300,000 to $499,999 | 287 (12.1%) | 497 (27.1%) |
| $500,000 to $749,999 | 96 (4.1%) | 53 (2.9%) |
| $750,000 to $999,999 | 14 (0.6%) | 0 (0.0%) |
| $1,000,000 or more | 19 (0.8%) | 8 (0.4%) |
| Total | 2,371 (100.0%) | 1,836 (100.0%) |
Household Income by Mortgage Status in Hudson
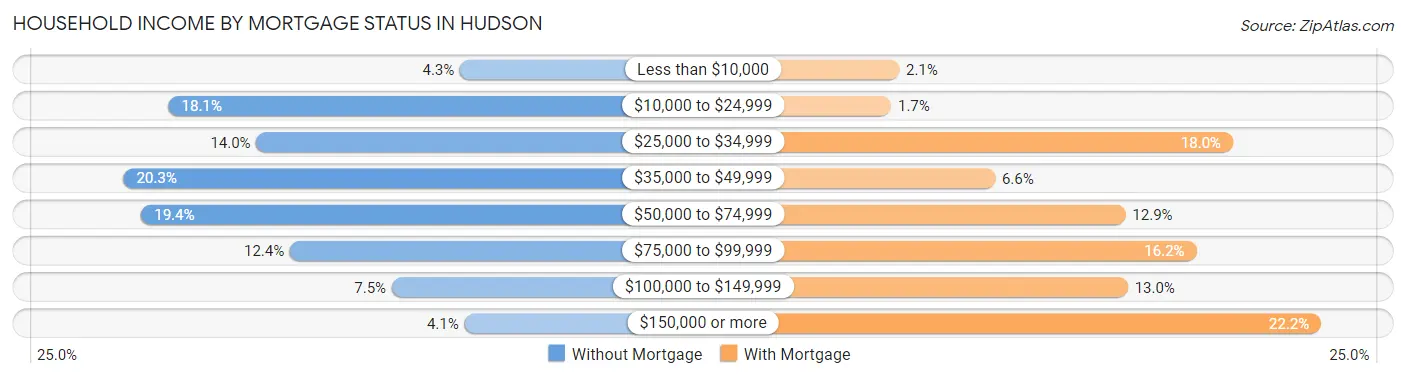
| Household Income | Without Mortgage | With Mortgage |
| Less than $10,000 | 101 (4.3%) | 38 (2.1%) |
| $10,000 to $24,999 | 430 (18.1%) | 31 (1.7%) |
| $25,000 to $34,999 | 331 (14.0%) | 330 (18.0%) |
| $35,000 to $49,999 | 481 (20.3%) | 122 (6.6%) |
| $50,000 to $74,999 | 461 (19.4%) | 236 (12.9%) |
| $75,000 to $99,999 | 293 (12.4%) | 298 (16.2%) |
| $100,000 to $149,999 | 178 (7.5%) | 238 (13.0%) |
| $150,000 or more | 96 (4.1%) | 407 (22.2%) |
| Total | 2,371 (100.0%) | 1,836 (100.0%) |
Property Value to Household Income Ratio in Hudson
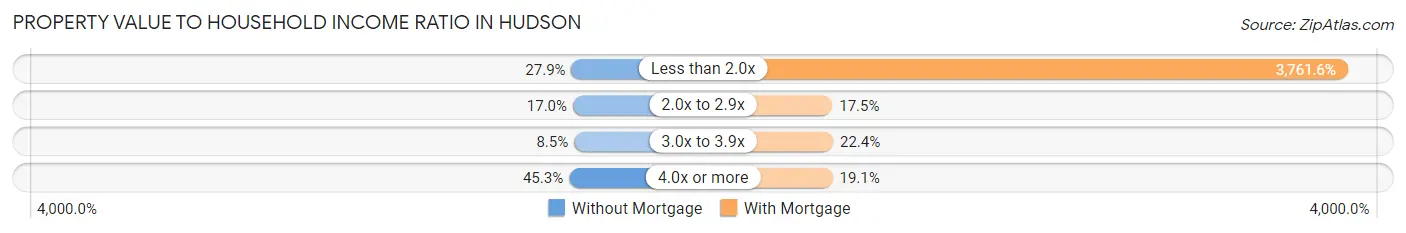
| Value-to-Income Ratio | Without Mortgage | With Mortgage |
| Less than 2.0x | 662 (27.9%) | 69,063 (3,761.6%) |
| 2.0x to 2.9x | 404 (17.0%) | 321 (17.5%) |
| 3.0x to 3.9x | 201 (8.5%) | 412 (22.4%) |
| 4.0x or more | 1,075 (45.3%) | 350 (19.1%) |
| Total | 2,371 (100.0%) | 1,836 (100.0%) |
Real Estate Taxes by Mortgage Status in Hudson
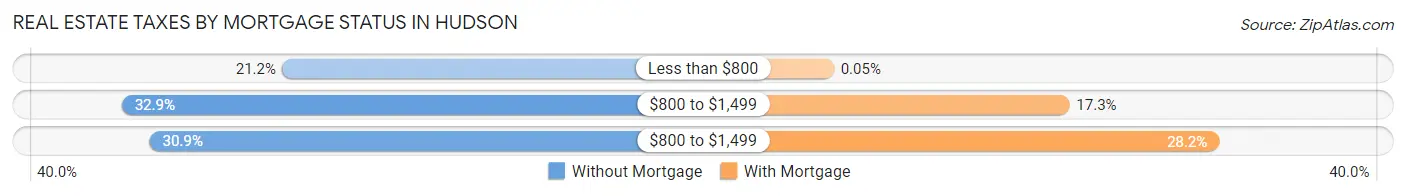
| Property Taxes | Without Mortgage | With Mortgage |
| Less than $800 | 503 (21.2%) | 1 (0.1%) |
| $800 to $1,499 | 780 (32.9%) | 317 (17.3%) |
| $800 to $1,499 | 732 (30.9%) | 518 (28.2%) |
| Total | 2,371 (100.0%) | 1,836 (100.0%) |
Health & Disability in Hudson
Health Insurance Coverage by Age in Hudson
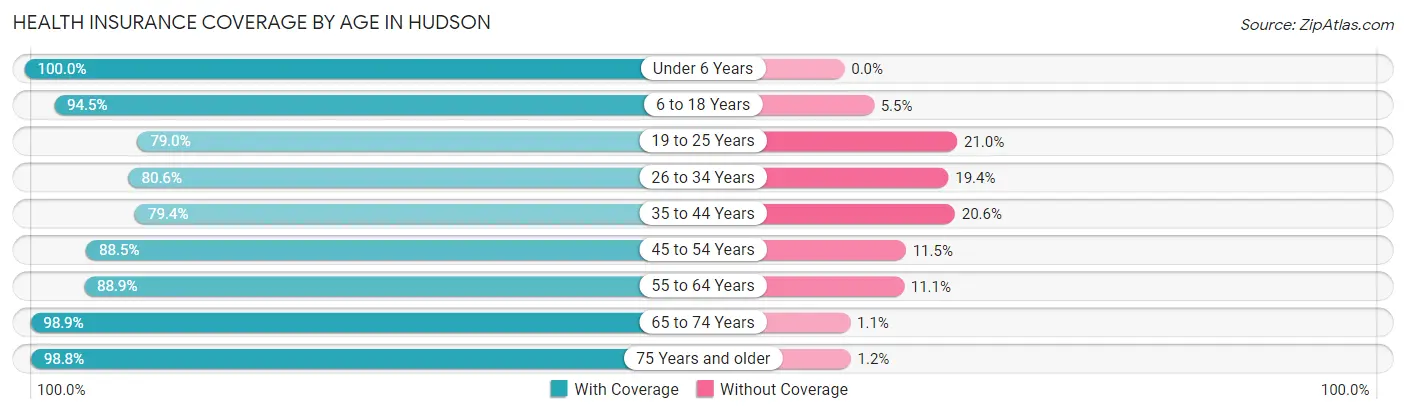
| Age Bracket | With Coverage | Without Coverage |
| Under 6 Years | 321 (100.0%) | 0 (0.0%) |
| 6 to 18 Years | 654 (94.5%) | 38 (5.5%) |
| 19 to 25 Years | 278 (79.0%) | 74 (21.0%) |
| 26 to 34 Years | 320 (80.6%) | 77 (19.4%) |
| 35 to 44 Years | 624 (79.4%) | 162 (20.6%) |
| 45 to 54 Years | 1,167 (88.5%) | 151 (11.5%) |
| 55 to 64 Years | 1,755 (88.9%) | 219 (11.1%) |
| 65 to 74 Years | 2,475 (98.9%) | 27 (1.1%) |
| 75 Years and older | 2,120 (98.8%) | 25 (1.2%) |
| Total | 9,714 (92.6%) | 773 (7.4%) |
Health Insurance Coverage by Citizenship Status in Hudson
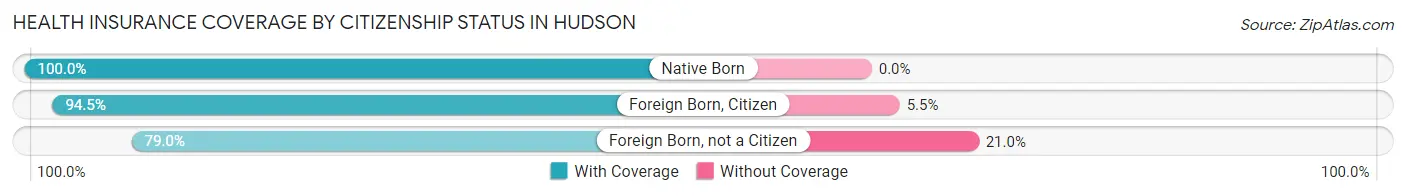
| Citizenship Status | With Coverage | Without Coverage |
| Native Born | 321 (100.0%) | 0 (0.0%) |
| Foreign Born, Citizen | 654 (94.5%) | 38 (5.5%) |
| Foreign Born, not a Citizen | 278 (79.0%) | 74 (21.0%) |
Health Insurance Coverage by Household Income in Hudson
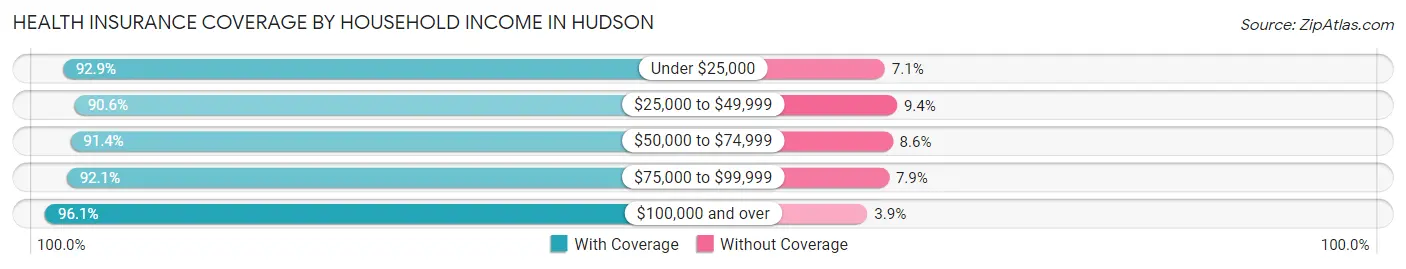
| Household Income | With Coverage | Without Coverage |
| Under $25,000 | 1,912 (92.9%) | 147 (7.1%) |
| $25,000 to $49,999 | 2,005 (90.6%) | 208 (9.4%) |
| $50,000 to $74,999 | 1,937 (91.4%) | 182 (8.6%) |
| $75,000 to $99,999 | 1,376 (92.1%) | 118 (7.9%) |
| $100,000 and over | 2,443 (96.1%) | 98 (3.9%) |
Public vs Private Health Insurance Coverage by Age in Hudson
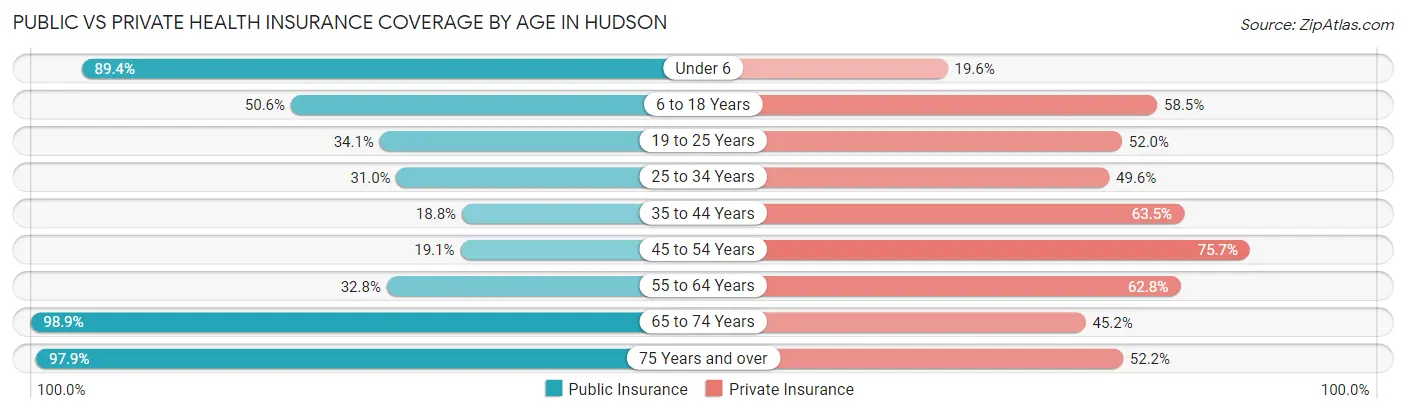
| Age Bracket | Public Insurance | Private Insurance |
| Under 6 | 287 (89.4%) | 63 (19.6%) |
| 6 to 18 Years | 350 (50.6%) | 405 (58.5%) |
| 19 to 25 Years | 120 (34.1%) | 183 (52.0%) |
| 25 to 34 Years | 123 (31.0%) | 197 (49.6%) |
| 35 to 44 Years | 148 (18.8%) | 499 (63.5%) |
| 45 to 54 Years | 252 (19.1%) | 998 (75.7%) |
| 55 to 64 Years | 647 (32.8%) | 1,239 (62.8%) |
| 65 to 74 Years | 2,475 (98.9%) | 1,132 (45.2%) |
| 75 Years and over | 2,099 (97.9%) | 1,119 (52.2%) |
| Total | 6,501 (62.0%) | 5,835 (55.6%) |
Disability Status by Sex by Age in Hudson
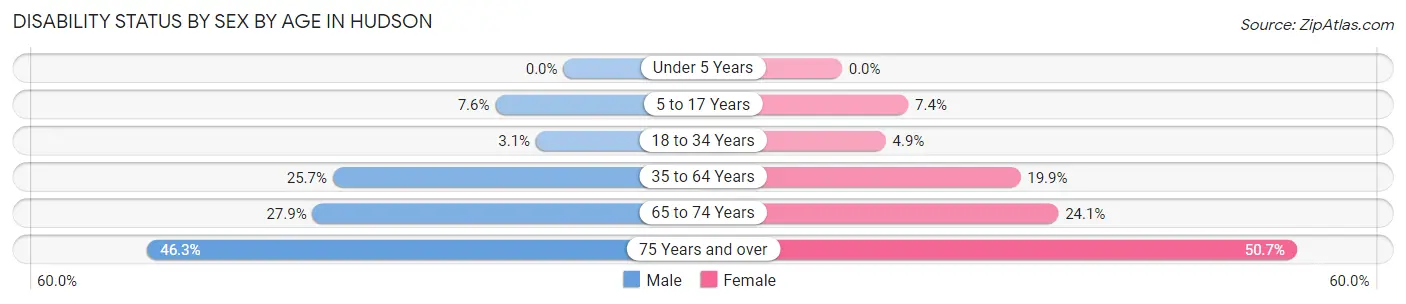
| Age Bracket | Male | Female |
| Under 5 Years | 0 (0.0%) | 0 (0.0%) |
| 5 to 17 Years | 35 (7.6%) | 17 (7.4%) |
| 18 to 34 Years | 12 (3.0%) | 20 (4.9%) |
| 35 to 64 Years | 497 (25.7%) | 426 (19.9%) |
| 65 to 74 Years | 335 (27.9%) | 314 (24.1%) |
| 75 Years and over | 543 (46.3%) | 493 (50.7%) |
Disability Class by Sex by Age in Hudson
Disability Class: Hearing Difficulty
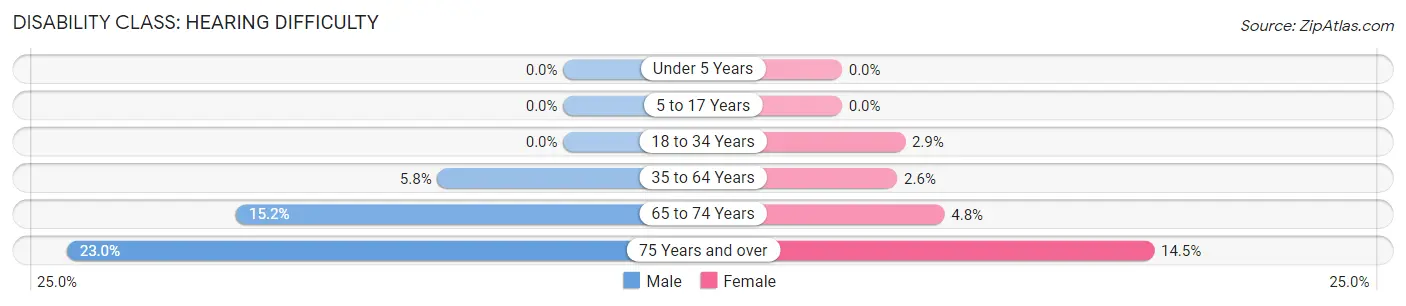
| Age Bracket | Male | Female |
| Under 5 Years | 0 (0.0%) | 0 (0.0%) |
| 5 to 17 Years | 0 (0.0%) | 0 (0.0%) |
| 18 to 34 Years | 0 (0.0%) | 12 (2.9%) |
| 35 to 64 Years | 113 (5.8%) | 55 (2.6%) |
| 65 to 74 Years | 182 (15.2%) | 62 (4.8%) |
| 75 Years and over | 270 (23.0%) | 141 (14.5%) |
Disability Class: Vision Difficulty
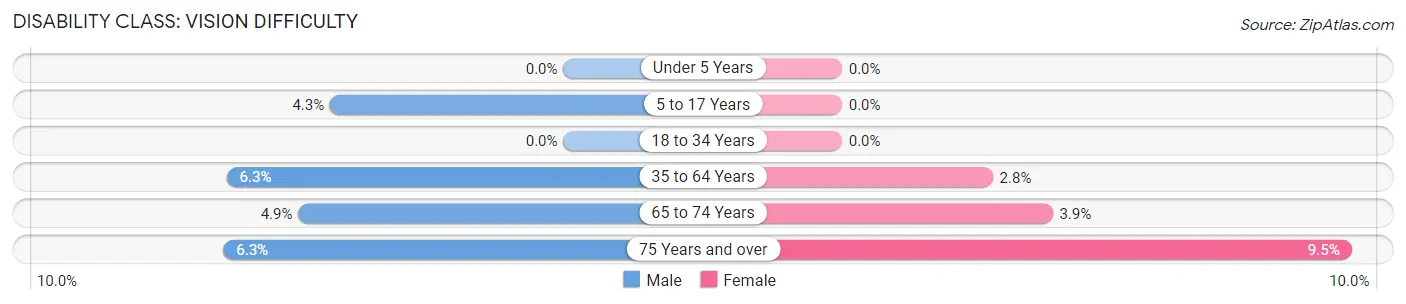
| Age Bracket | Male | Female |
| Under 5 Years | 0 (0.0%) | 0 (0.0%) |
| 5 to 17 Years | 20 (4.3%) | 0 (0.0%) |
| 18 to 34 Years | 0 (0.0%) | 0 (0.0%) |
| 35 to 64 Years | 121 (6.2%) | 60 (2.8%) |
| 65 to 74 Years | 59 (4.9%) | 51 (3.9%) |
| 75 Years and over | 74 (6.3%) | 92 (9.5%) |
Disability Class: Cognitive Difficulty
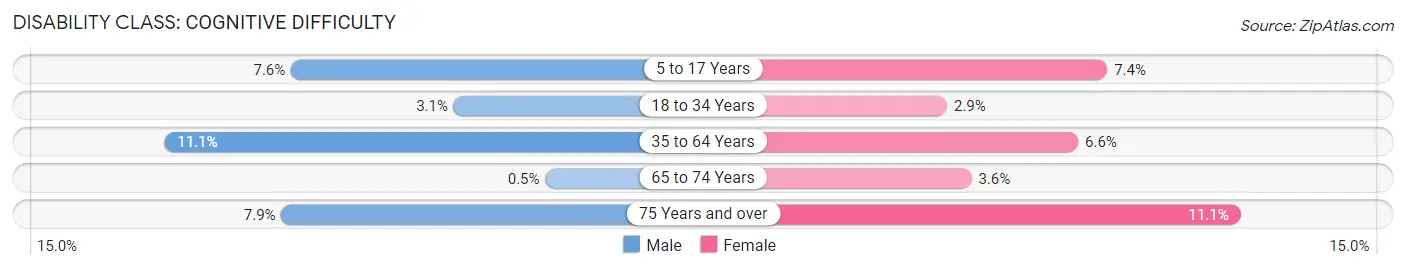
| Age Bracket | Male | Female |
| 5 to 17 Years | 35 (7.6%) | 17 (7.4%) |
| 18 to 34 Years | 12 (3.0%) | 12 (2.9%) |
| 35 to 64 Years | 215 (11.1%) | 141 (6.6%) |
| 65 to 74 Years | 6 (0.5%) | 47 (3.6%) |
| 75 Years and over | 92 (7.9%) | 108 (11.1%) |
Disability Class: Ambulatory Difficulty
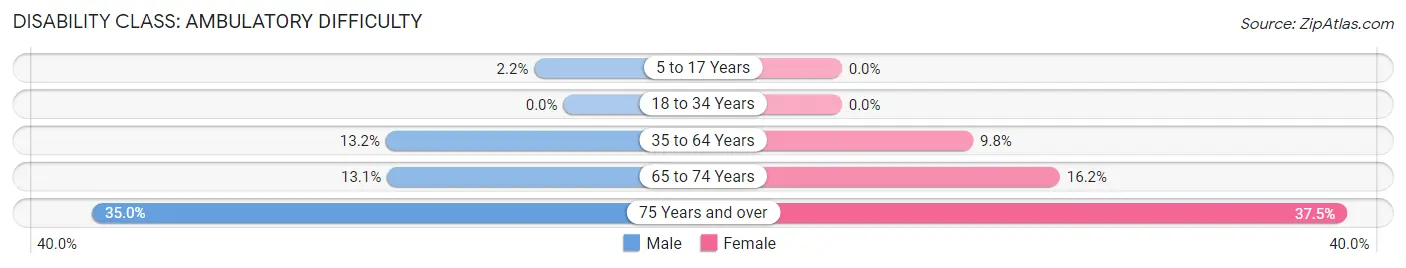
| Age Bracket | Male | Female |
| 5 to 17 Years | 10 (2.2%) | 0 (0.0%) |
| 18 to 34 Years | 0 (0.0%) | 0 (0.0%) |
| 35 to 64 Years | 255 (13.2%) | 209 (9.8%) |
| 65 to 74 Years | 157 (13.1%) | 211 (16.2%) |
| 75 Years and over | 410 (35.0%) | 365 (37.5%) |
Disability Class: Self-Care Difficulty
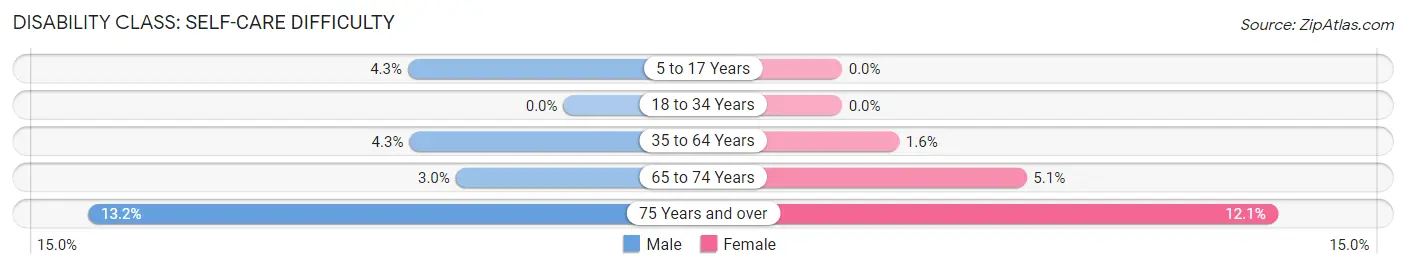
| Age Bracket | Male | Female |
| 5 to 17 Years | 20 (4.3%) | 0 (0.0%) |
| 18 to 34 Years | 0 (0.0%) | 0 (0.0%) |
| 35 to 64 Years | 83 (4.3%) | 34 (1.6%) |
| 65 to 74 Years | 36 (3.0%) | 67 (5.1%) |
| 75 Years and over | 155 (13.2%) | 118 (12.1%) |
Technology Access in Hudson
Computing Device Access in Hudson
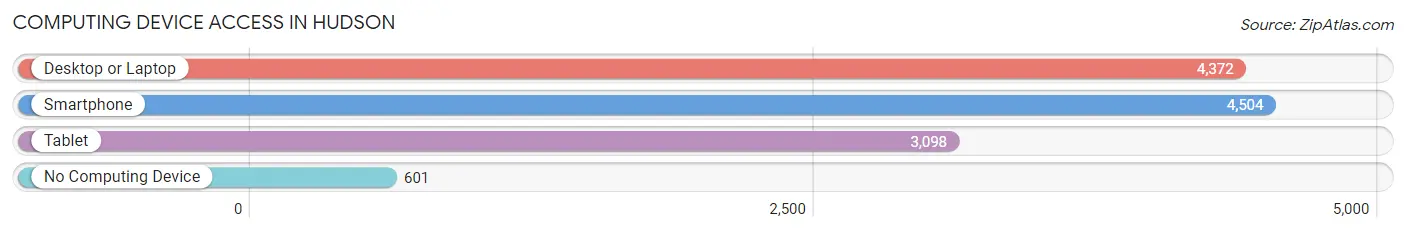
| Device Type | # Households | % Households |
| Desktop or Laptop | 4,372 | 78.0% |
| Smartphone | 4,504 | 80.4% |
| Tablet | 3,098 | 55.3% |
| No Computing Device | 601 | 10.7% |
| Total | 5,602 | 100.0% |
Internet Access in Hudson
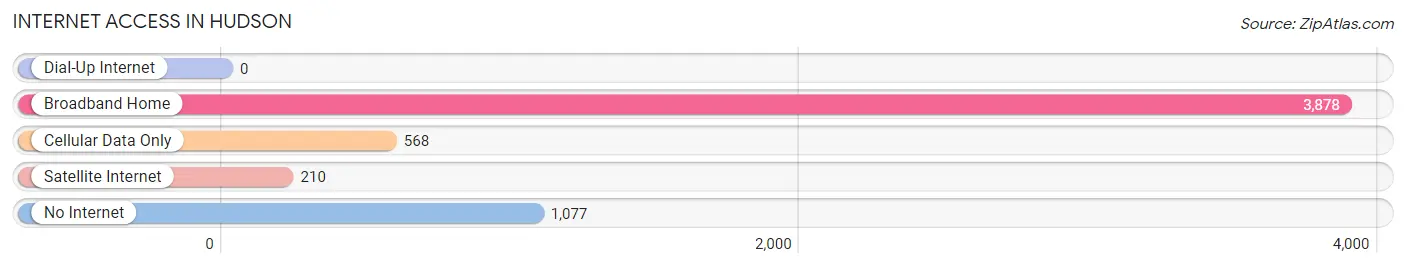
| Internet Type | # Households | % Households |
| Dial-Up Internet | 0 | 0.0% |
| Broadband Home | 3,878 | 69.2% |
| Cellular Data Only | 568 | 10.1% |
| Satellite Internet | 210 | 3.7% |
| No Internet | 1,077 | 19.2% |
| Total | 5,602 | 100.0% |
Hudson Summary
Hudson, Florida is a census-designated place located in Pasco County, Florida. It is located on the Gulf of Mexico, approximately 25 miles north of Tampa. The population of Hudson was estimated to be 13,769 in 2019.
History
Hudson was originally known as Hudson Beach, and was founded in 1883 by Captain Hudson. The area was originally a fishing village, and the first post office was established in 1884. In the early 1900s, the area began to grow as a resort destination, and the first hotel was built in 1912.
In the 1950s, the area began to develop as a residential community, and the population began to grow. In the 1960s, the area was incorporated as the Town of Hudson, and the first mayor was elected in 1965. The town was later annexed by Pasco County in 1975.
Geography
Hudson is located in Pasco County, Florida, on the Gulf of Mexico. It is located approximately 25 miles north of Tampa. The area is mostly flat, with some low hills in the northern part of the town. The average elevation is 10 feet above sea level.
The climate in Hudson is classified as humid subtropical, with hot, humid summers and mild winters. The average temperature in the summer is around 90°F, and the average temperature in the winter is around 60°F.
Economy
Hudson’s economy is largely based on tourism and retail. The area is home to several resorts and hotels, as well as a variety of restaurants and shops. The town is also home to several marinas, which provide access to the Gulf of Mexico.
The town is also home to several manufacturing and industrial businesses, including a paper mill and a chemical plant. The town is also home to several medical facilities, including a hospital and several clinics.
Demographics
As of 2019, the population of Hudson was estimated to be 13,769. The population is largely white (83.3%), with smaller percentages of African American (7.3%), Hispanic (5.7%), and Asian (2.7%) residents. The median household income is $50,945, and the median home value is $179,400.
The town is served by the Pasco County School District, which includes several elementary, middle, and high schools. The town is also home to several private schools, including a Catholic school and a Montessori school.
Conclusion
Hudson, Florida is a census-designated place located in Pasco County, Florida. It is located on the Gulf of Mexico, approximately 25 miles north of Tampa. The population of Hudson was estimated to be 13,769 in 2019. The town was originally founded in 1883 as a fishing village, and has since grown into a resort destination and residential community. The economy of Hudson is largely based on tourism and retail, as well as manufacturing and industrial businesses. The population is largely white, with smaller percentages of African American, Hispanic, and Asian residents. The town is served by the Pasco County School District, and is home to several private schools.
Common Questions
What is Per Capita Income in Hudson?
Per Capita income in Hudson is $33,383.
What is the Median Family Income in Hudson?
Median Family Income in Hudson is $71,152.
What is the Median Household income in Hudson?
Median Household Income in Hudson is $45,752.
What is Income or Wage Gap in Hudson?
Income or Wage Gap in Hudson is 37.4%.
Women in Hudson earn 62.6 cents for every dollar earned by a man.
What is Inequality or Gini Index in Hudson?
Inequality or Gini Index in Hudson is 0.45.
What is the Total Population of Hudson?
Total Population of Hudson is 10,821.
What is the Total Male Population of Hudson?
Total Male Population of Hudson is 5,447.
What is the Total Female Population of Hudson?
Total Female Population of Hudson is 5,374.
What is the Ratio of Males per 100 Females in Hudson?
There are 101.36 Males per 100 Females in Hudson.
What is the Ratio of Females per 100 Males in Hudson?
There are 98.66 Females per 100 Males in Hudson.
What is the Median Population Age in Hudson?
Median Population Age in Hudson is 62.9 Years.
What is the Average Family Size in Hudson
Average Family Size in Hudson is 2.5 People.
What is the Average Household Size in Hudson
Average Household Size in Hudson is 1.9 People.
How Large is the Labor Force in Hudson?
There are 3,763 People in the Labor Forcein in Hudson.
What is the Percentage of People in the Labor Force in Hudson?
37.8% of People are in the Labor Force in Hudson.
What is the Unemployment Rate in Hudson?
Unemployment Rate in Hudson is 6.0%.