Port LaBelle, FL Map & Demographics
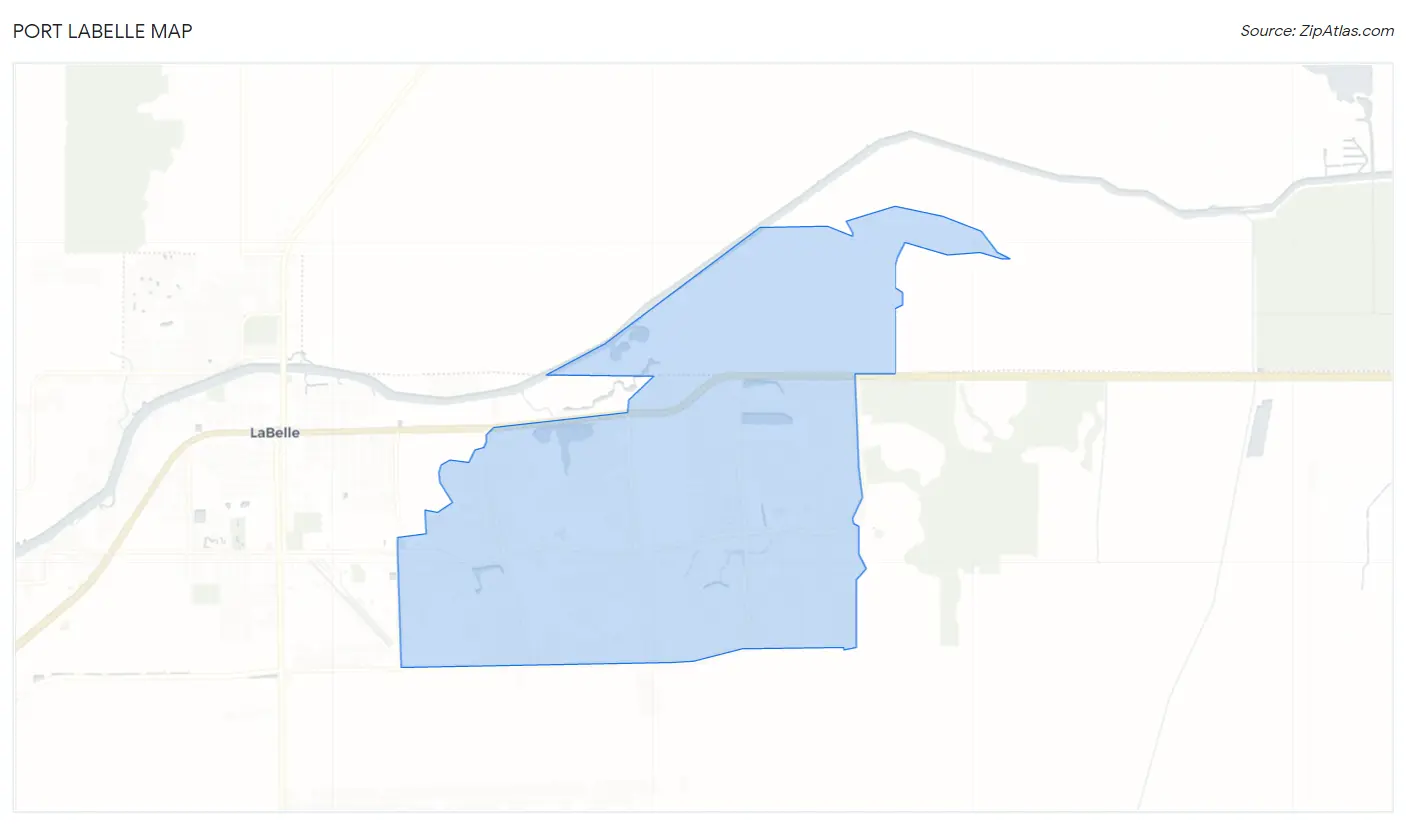
Port LaBelle Map
Port LaBelle Overview
$29,569
PER CAPITA INCOME
$46,535
AVG FAMILY INCOME
$40,250
AVG HOUSEHOLD INCOME
33.6%
WAGE / INCOME GAP [ % ]
66.4¢/ $1
WAGE / INCOME GAP [ $ ]
0.46
INEQUALITY / GINI INDEX
5,858
TOTAL POPULATION
3,278
MALE POPULATION
2,580
FEMALE POPULATION
127.05
MALES / 100 FEMALES
78.71
FEMALES / 100 MALES
31.0
MEDIAN AGE
3.3
AVG FAMILY SIZE
2.7
AVG HOUSEHOLD SIZE
3,377
LABOR FORCE [ PEOPLE ]
74.1%
PERCENT IN LABOR FORCE
7.9%
UNEMPLOYMENT RATE
Income in Port LaBelle
Income Overview in Port LaBelle
Per Capita Income in Port LaBelle is $29,569, while median incomes of families and households are $46,535 and $40,250 respectively.
| Characteristic | Number | Measure |
| Per Capita Income | 5,858 | $29,569 |
| Median Family Income | 1,430 | $46,535 |
| Mean Family Income | 1,430 | $80,043 |
| Median Household Income | 2,203 | $40,250 |
| Mean Household Income | 2,203 | $70,511 |
| Income Deficit | 1,430 | $0 |
| Wage / Income Gap (%) | 5,858 | 33.63% |
| Wage / Income Gap ($) | 5,858 | 66.37¢ per $1 |
| Gini / Inequality Index | 5,858 | 0.46 |
Earnings by Sex in Port LaBelle
Average Earnings in Port LaBelle are $34,320, $37,161 for men and $24,663 for women, a difference of 33.6%.
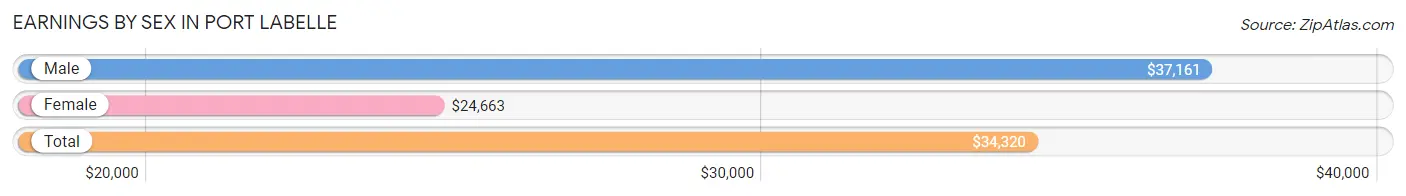
| Sex | Number | Average Earnings |
| Male | 2,002 (60.7%) | $37,161 |
| Female | 1,299 (39.4%) | $24,663 |
| Total | 3,301 (100.0%) | $34,320 |
Earnings by Sex by Income Bracket in Port LaBelle
The most common earnings brackets in Port LaBelle are $35,000 to $39,999 for men (377 | 18.8%) and $30,000 to $34,999 for women (278 | 21.4%).
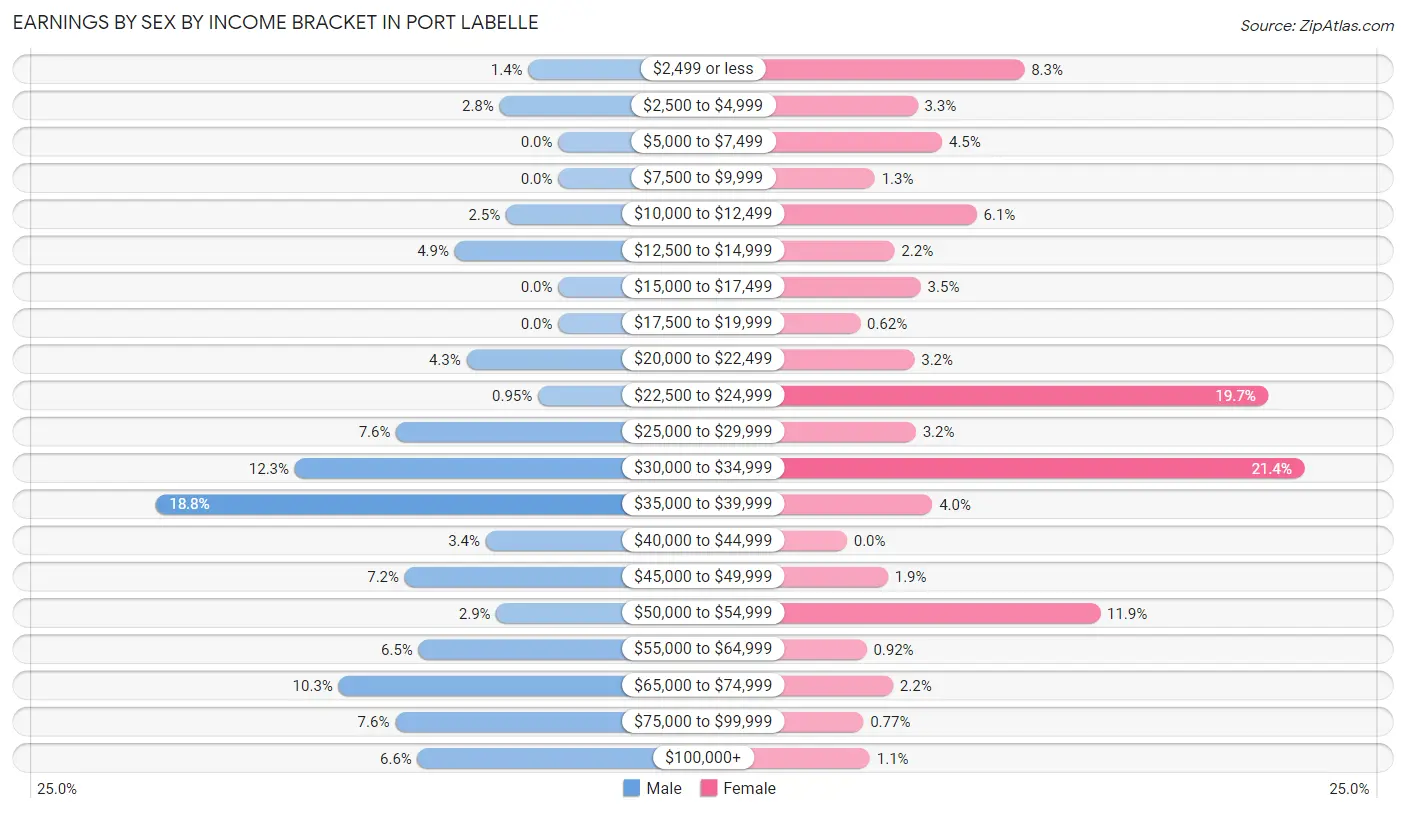
| Income | Male | Female |
| $2,499 or less | 28 (1.4%) | 108 (8.3%) |
| $2,500 to $4,999 | 55 (2.8%) | 43 (3.3%) |
| $5,000 to $7,499 | 0 (0.0%) | 58 (4.5%) |
| $7,500 to $9,999 | 0 (0.0%) | 17 (1.3%) |
| $10,000 to $12,499 | 49 (2.5%) | 79 (6.1%) |
| $12,500 to $14,999 | 97 (4.9%) | 29 (2.2%) |
| $15,000 to $17,499 | 0 (0.0%) | 45 (3.5%) |
| $17,500 to $19,999 | 0 (0.0%) | 8 (0.6%) |
| $20,000 to $22,499 | 86 (4.3%) | 41 (3.2%) |
| $22,500 to $24,999 | 19 (0.9%) | 256 (19.7%) |
| $25,000 to $29,999 | 152 (7.6%) | 42 (3.2%) |
| $30,000 to $34,999 | 247 (12.3%) | 278 (21.4%) |
| $35,000 to $39,999 | 377 (18.8%) | 52 (4.0%) |
| $40,000 to $44,999 | 68 (3.4%) | 0 (0.0%) |
| $45,000 to $49,999 | 144 (7.2%) | 25 (1.9%) |
| $50,000 to $54,999 | 58 (2.9%) | 154 (11.9%) |
| $55,000 to $64,999 | 131 (6.5%) | 12 (0.9%) |
| $65,000 to $74,999 | 206 (10.3%) | 28 (2.2%) |
| $75,000 to $99,999 | 153 (7.6%) | 10 (0.8%) |
| $100,000+ | 132 (6.6%) | 14 (1.1%) |
| Total | 2,002 (100.0%) | 1,299 (100.0%) |
Earnings by Sex by Educational Attainment in Port LaBelle
Average earnings in Port LaBelle are $38,545 for men and $26,637 for women, a difference of 30.9%. Men with an educational attainment of college or associate's degree enjoy the highest average annual earnings of $68,172, while those with less than high school education earn the least with $36,105. Women with an educational attainment of bachelor's degree earn the most with the average annual earnings of $49,100, while those with less than high school education have the smallest earnings of $20,945.
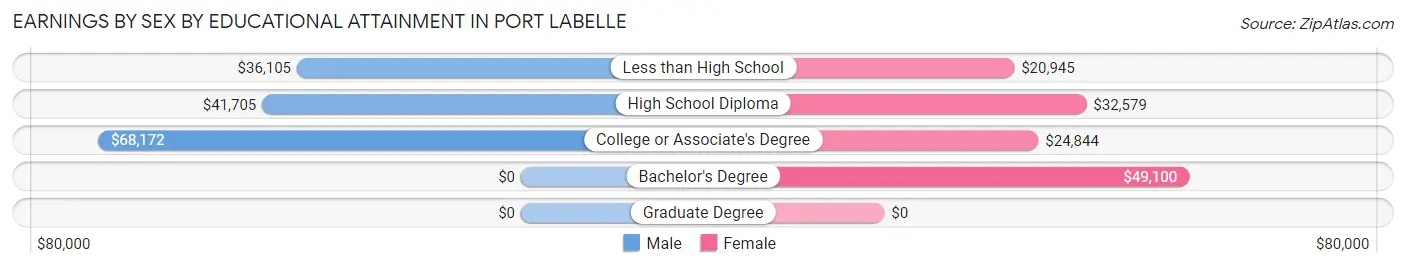
| Educational Attainment | Male Income | Female Income |
| Less than High School | $36,105 | $20,945 |
| High School Diploma | $41,705 | $32,579 |
| College or Associate's Degree | $68,172 | $24,844 |
| Bachelor's Degree | - | - |
| Graduate Degree | - | - |
| Total | $38,545 | $26,637 |
Family Income in Port LaBelle
Family Income Brackets in Port LaBelle
According to the Port LaBelle family income data, there are 358 families falling into the $35,000 to $49,999 income range, which is the most common income bracket and makes up 25.0% of all families.
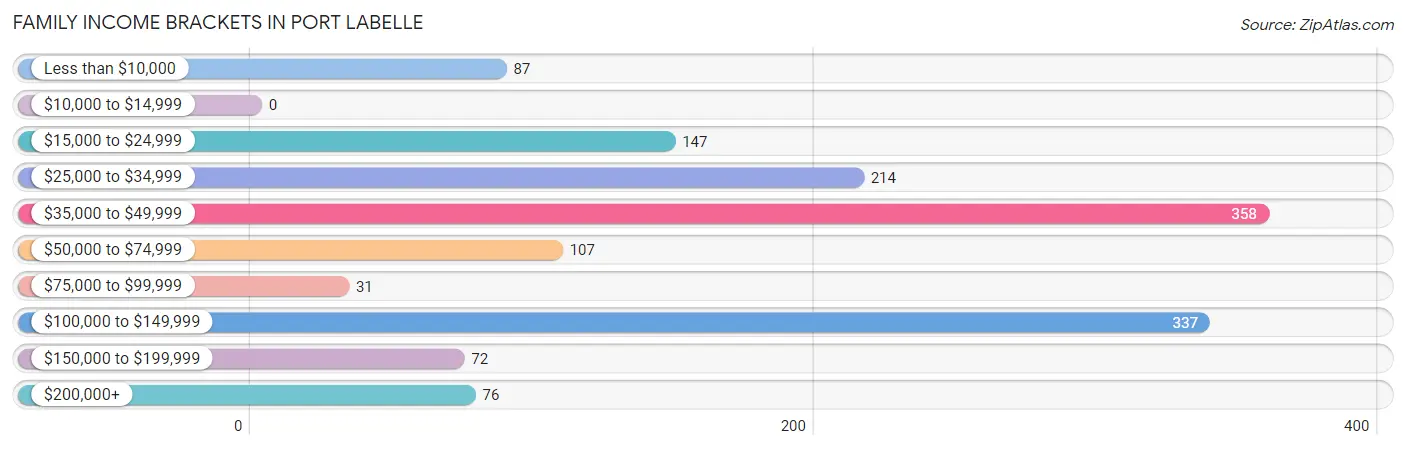
| Income Bracket | # Families | % Families |
| Less than $10,000 | 87 | 6.1% |
| $10,000 to $14,999 | 0 | 0.0% |
| $15,000 to $24,999 | 147 | 10.3% |
| $25,000 to $34,999 | 214 | 15.0% |
| $35,000 to $49,999 | 358 | 25.0% |
| $50,000 to $74,999 | 107 | 7.5% |
| $75,000 to $99,999 | 31 | 2.2% |
| $100,000 to $149,999 | 337 | 23.6% |
| $150,000 to $199,999 | 72 | 5.0% |
| $200,000+ | 76 | 5.3% |
Family Income by Famaliy Size in Port LaBelle
2-person families (540 | 37.8%) account for the highest median family income in Port LaBelle with $60,955 per family, while 2-person families (540 | 37.8%) have the highest median income of $30,478 per family member.
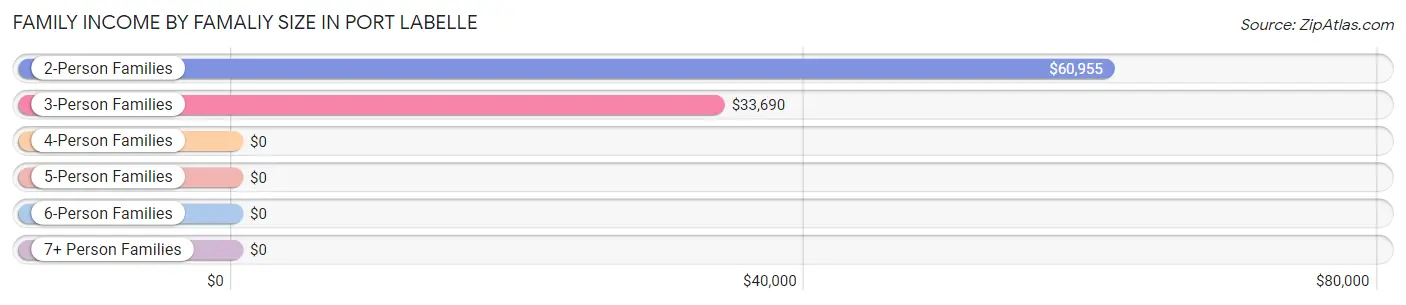
| Income Bracket | # Families | Median Income |
| 2-Person Families | 540 (37.8%) | $60,955 |
| 3-Person Families | 413 (28.9%) | $33,690 |
| 4-Person Families | 336 (23.5%) | $0 |
| 5-Person Families | 91 (6.4%) | $0 |
| 6-Person Families | 50 (3.5%) | $0 |
| 7+ Person Families | 0 (0.0%) | $0 |
| Total | 1,430 (100.0%) | $46,535 |
Family Income by Number of Earners in Port LaBelle
The median family income in Port LaBelle is $46,535, with families comprising 3+ earners (62) having the highest median family income of $130,446, while families with no earners (213) have the lowest median family income of $23,628, accounting for 4.3% and 14.9% of families, respectively.
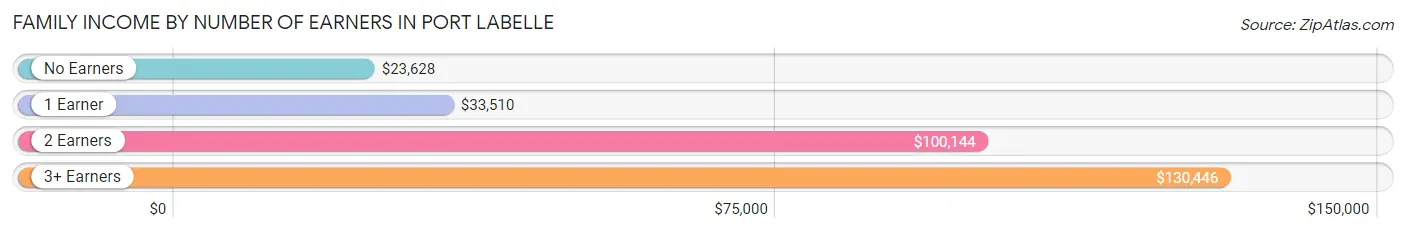
| Number of Earners | # Families | Median Income |
| No Earners | 213 (14.9%) | $23,628 |
| 1 Earner | 394 (27.6%) | $33,510 |
| 2 Earners | 761 (53.2%) | $100,144 |
| 3+ Earners | 62 (4.3%) | $130,446 |
| Total | 1,430 (100.0%) | $46,535 |
Household Income in Port LaBelle
Household Income Brackets in Port LaBelle
With 729 households falling in the category, the $35,000 to $49,999 income range is the most frequent in Port LaBelle, accounting for 33.1% of all households. In contrast, only 66 households (3.0%) fall into the $10,000 to $14,999 income bracket, making it the least populous group.
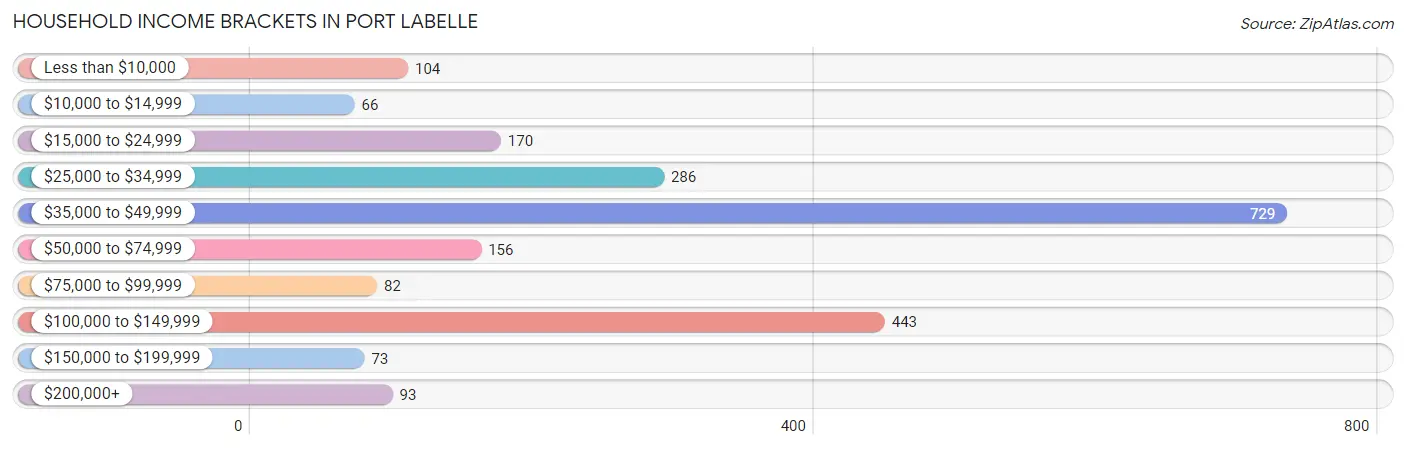
| Income Bracket | # Households | % Households |
| Less than $10,000 | 104 | 4.7% |
| $10,000 to $14,999 | 66 | 3.0% |
| $15,000 to $24,999 | 170 | 7.7% |
| $25,000 to $34,999 | 286 | 13.0% |
| $35,000 to $49,999 | 729 | 33.1% |
| $50,000 to $74,999 | 156 | 7.1% |
| $75,000 to $99,999 | 82 | 3.7% |
| $100,000 to $149,999 | 443 | 20.1% |
| $150,000 to $199,999 | 73 | 3.3% |
| $200,000+ | 93 | 4.2% |
Household Income by Householder Age in Port LaBelle
The median household income in Port LaBelle is $40,250, with the highest median household income of $47,483 found in the 15 to 24 years age bracket for the primary householder. A total of 143 households (6.5%) fall into this category. Meanwhile, the 65+ years age bracket for the primary householder has the lowest median household income of $24,006, with 282 households (12.8%) in this group.
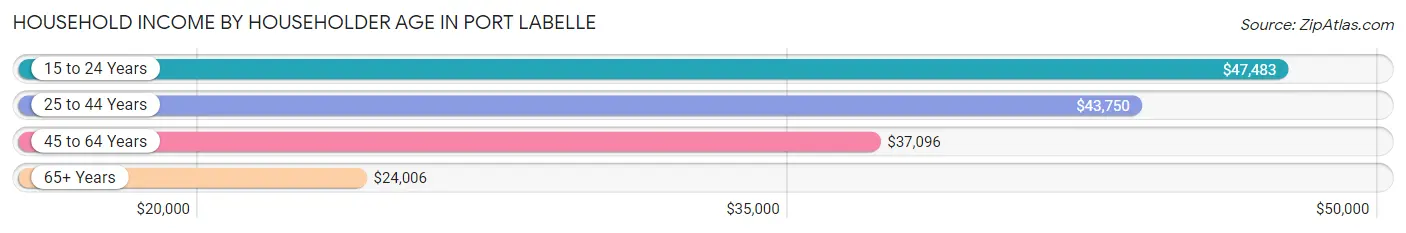
| Income Bracket | # Households | Median Income |
| 15 to 24 Years | 143 (6.5%) | $47,483 |
| 25 to 44 Years | 878 (39.9%) | $43,750 |
| 45 to 64 Years | 900 (40.8%) | $37,096 |
| 65+ Years | 282 (12.8%) | $24,006 |
| Total | 2,203 (100.0%) | $40,250 |
Poverty in Port LaBelle
Income Below Poverty by Sex and Age in Port LaBelle
With 6.6% poverty level for males and 18.6% for females among the residents of Port LaBelle, 65 to 74 year old males and 6 to 11 year old females are the most vulnerable to poverty, with 22 males (22.2%) and 173 females (47.8%) in their respective age groups living below the poverty level.
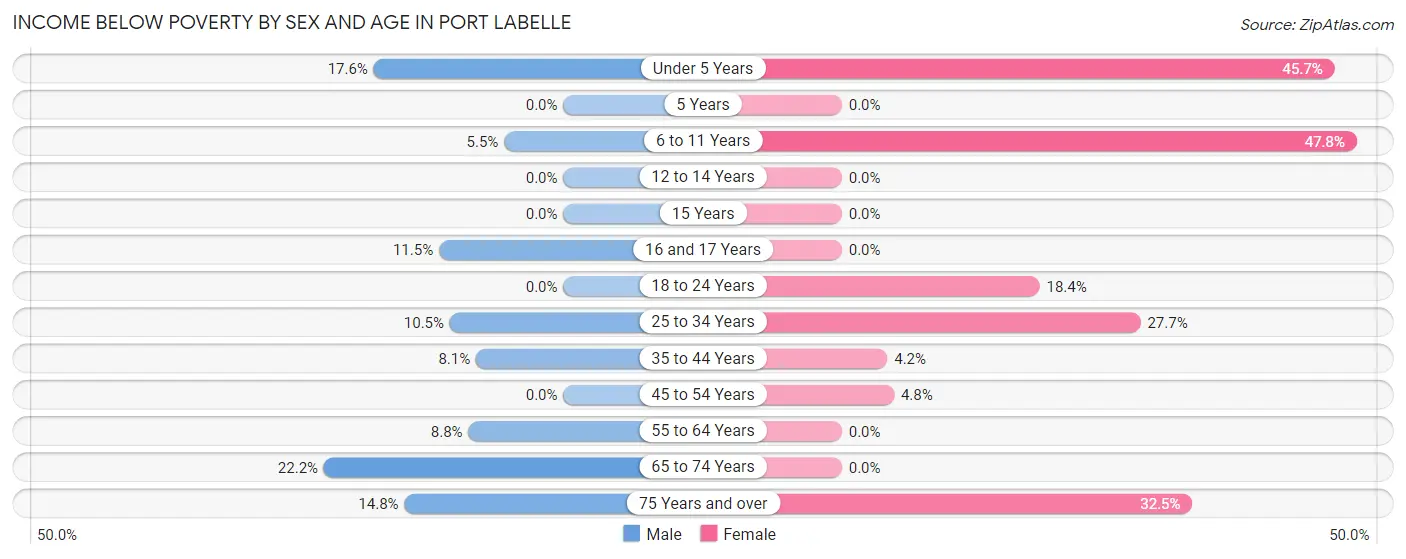
| Age Bracket | Male | Female |
| Under 5 Years | 47 (17.6%) | 59 (45.7%) |
| 5 Years | 0 (0.0%) | 0 (0.0%) |
| 6 to 11 Years | 5 (5.5%) | 173 (47.8%) |
| 12 to 14 Years | 0 (0.0%) | 0 (0.0%) |
| 15 Years | 0 (0.0%) | 0 (0.0%) |
| 16 and 17 Years | 15 (11.5%) | 0 (0.0%) |
| 18 to 24 Years | 0 (0.0%) | 29 (18.3%) |
| 25 to 34 Years | 54 (10.5%) | 163 (27.7%) |
| 35 to 44 Years | 37 (8.1%) | 17 (4.2%) |
| 45 to 54 Years | 0 (0.0%) | 12 (4.8%) |
| 55 to 64 Years | 17 (8.8%) | 0 (0.0%) |
| 65 to 74 Years | 22 (22.2%) | 0 (0.0%) |
| 75 Years and over | 18 (14.7%) | 27 (32.5%) |
| Total | 215 (6.6%) | 480 (18.6%) |
Income Above Poverty by Sex and Age in Port LaBelle
According to the poverty statistics in Port LaBelle, males aged 5 years and females aged 12 to 14 years are the age groups that are most secure financially, with 100.0% of males and 100.0% of females in these age groups living above the poverty line.
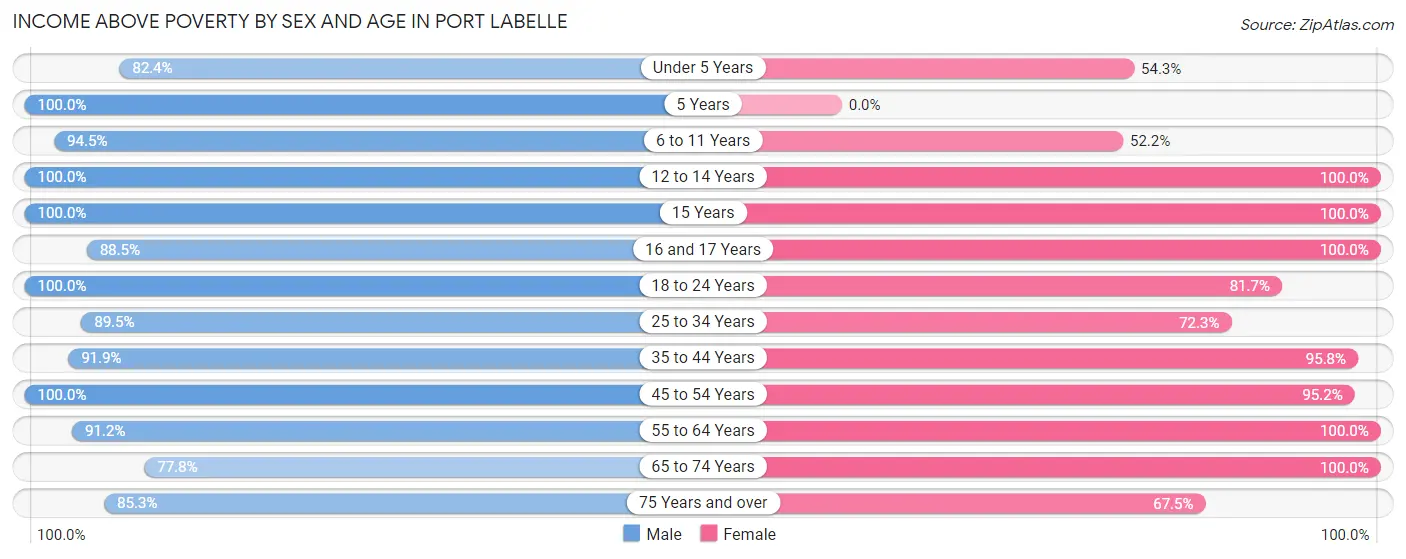
| Age Bracket | Male | Female |
| Under 5 Years | 220 (82.4%) | 70 (54.3%) |
| 5 Years | 42 (100.0%) | 0 (0.0%) |
| 6 to 11 Years | 86 (94.5%) | 189 (52.2%) |
| 12 to 14 Years | 172 (100.0%) | 129 (100.0%) |
| 15 Years | 87 (100.0%) | 22 (100.0%) |
| 16 and 17 Years | 115 (88.5%) | 109 (100.0%) |
| 18 to 24 Years | 460 (100.0%) | 129 (81.7%) |
| 25 to 34 Years | 459 (89.5%) | 425 (72.3%) |
| 35 to 44 Years | 420 (91.9%) | 386 (95.8%) |
| 45 to 54 Years | 645 (100.0%) | 236 (95.2%) |
| 55 to 64 Years | 176 (91.2%) | 240 (100.0%) |
| 65 to 74 Years | 77 (77.8%) | 109 (100.0%) |
| 75 Years and over | 104 (85.3%) | 56 (67.5%) |
| Total | 3,063 (93.4%) | 2,100 (81.4%) |
Income Below Poverty Among Married-Couple Families in Port LaBelle
The poverty statistics for married-couple families in Port LaBelle show that 3.8% or 38 of the total 997 families live below the poverty line. Families with 3 or 4 children have the highest poverty rate of 37.2%, comprising of 38 families. On the other hand, families with no children have the lowest poverty rate of 0.0%, which includes 0 families.
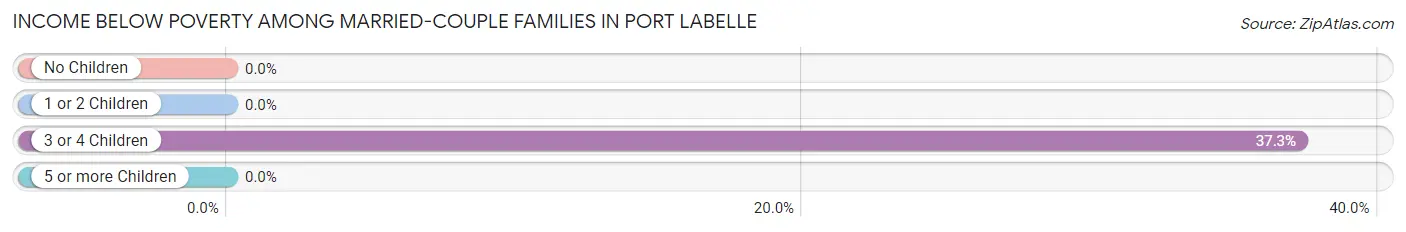
| Children | Above Poverty | Below Poverty |
| No Children | 584 (100.0%) | 0 (0.0%) |
| 1 or 2 Children | 311 (100.0%) | 0 (0.0%) |
| 3 or 4 Children | 64 (62.7%) | 38 (37.2%) |
| 5 or more Children | 0 (0.0%) | 0 (0.0%) |
| Total | 959 (96.2%) | 38 (3.8%) |
Income Below Poverty Among Single-Parent Households in Port LaBelle
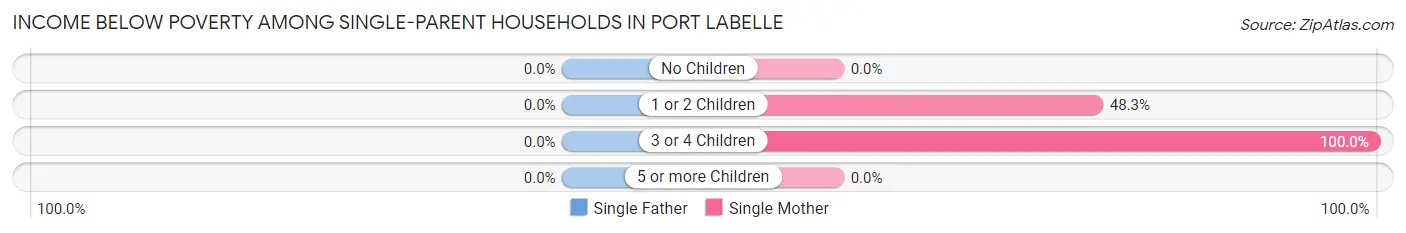
| Children | Single Father | Single Mother |
| No Children | 0 (0.0%) | 0 (0.0%) |
| 1 or 2 Children | 0 (0.0%) | 126 (48.3%) |
| 3 or 4 Children | 0 (0.0%) | 11 (100.0%) |
| 5 or more Children | 0 (0.0%) | 0 (0.0%) |
| Total | 0 (0.0%) | 137 (50.4%) |
Income Below Poverty Among Married-Couple vs Single-Parent Households in Port LaBelle
The poverty data for Port LaBelle shows that 38 of the married-couple family households (3.8%) and 137 of the single-parent households (31.6%) are living below the poverty level. Within the married-couple family households, those with 3 or 4 children have the highest poverty rate, with 38 households (37.2%) falling below the poverty line. Among the single-parent households, those with 3 or 4 children have the highest poverty rate, with 11 household (100.0%) living below poverty.
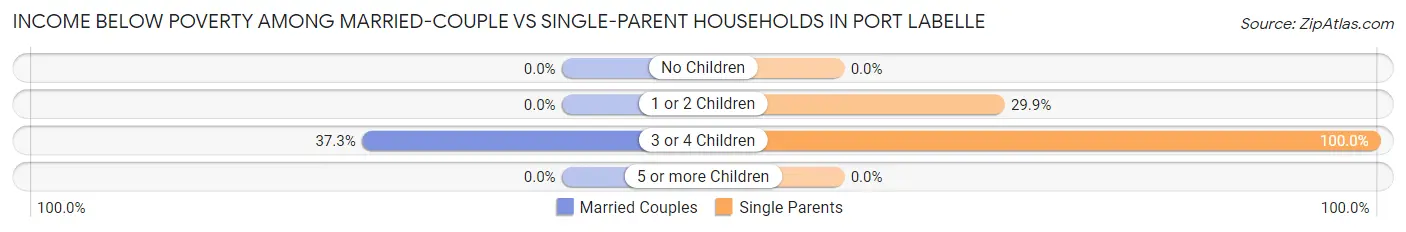
| Children | Married-Couple Families | Single-Parent Households |
| No Children | 0 (0.0%) | 0 (0.0%) |
| 1 or 2 Children | 0 (0.0%) | 126 (29.9%) |
| 3 or 4 Children | 38 (37.2%) | 11 (100.0%) |
| 5 or more Children | 0 (0.0%) | 0 (0.0%) |
| Total | 38 (3.8%) | 137 (31.6%) |
Race in Port LaBelle
The most populous races in Port LaBelle are Hispanic or Latino (4,166 | 71.1%), White / Caucasian (3,472 | 59.3%), and Two or more Races (1,497 | 25.6%).
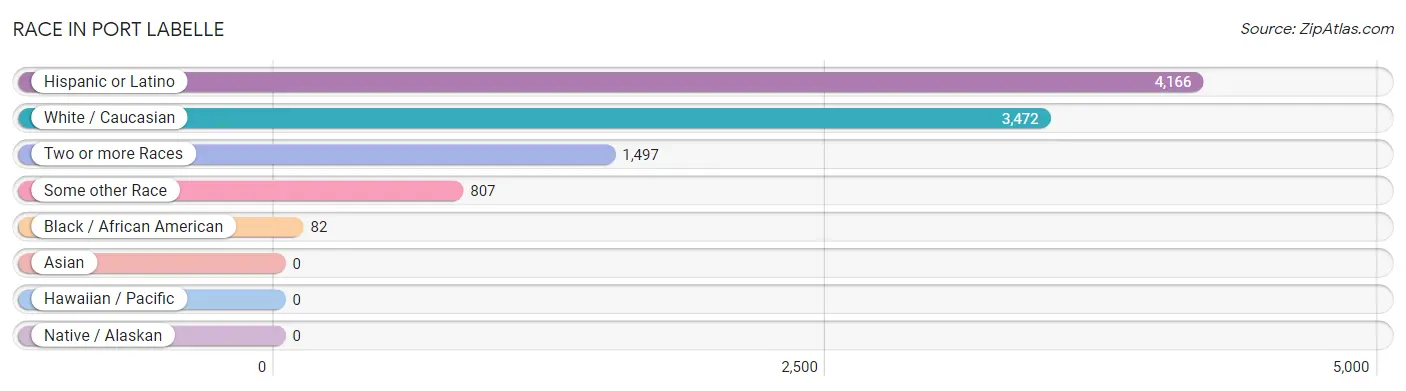
| Race | # Population | % Population |
| Asian | 0 | 0.0% |
| Black / African American | 82 | 1.4% |
| Hawaiian / Pacific | 0 | 0.0% |
| Hispanic or Latino | 4,166 | 71.1% |
| Native / Alaskan | 0 | 0.0% |
| White / Caucasian | 3,472 | 59.3% |
| Two or more Races | 1,497 | 25.6% |
| Some other Race | 807 | 13.8% |
| Total | 5,858 | 100.0% |
Ancestry in Port LaBelle
The most populous ancestries reported in Port LaBelle are Mexican (2,749 | 46.9%), Puerto Rican (401 | 6.9%), Cuban (316 | 5.4%), Italian (297 | 5.1%), and German (279 | 4.8%), together accounting for 69.0% of all Port LaBelle residents.
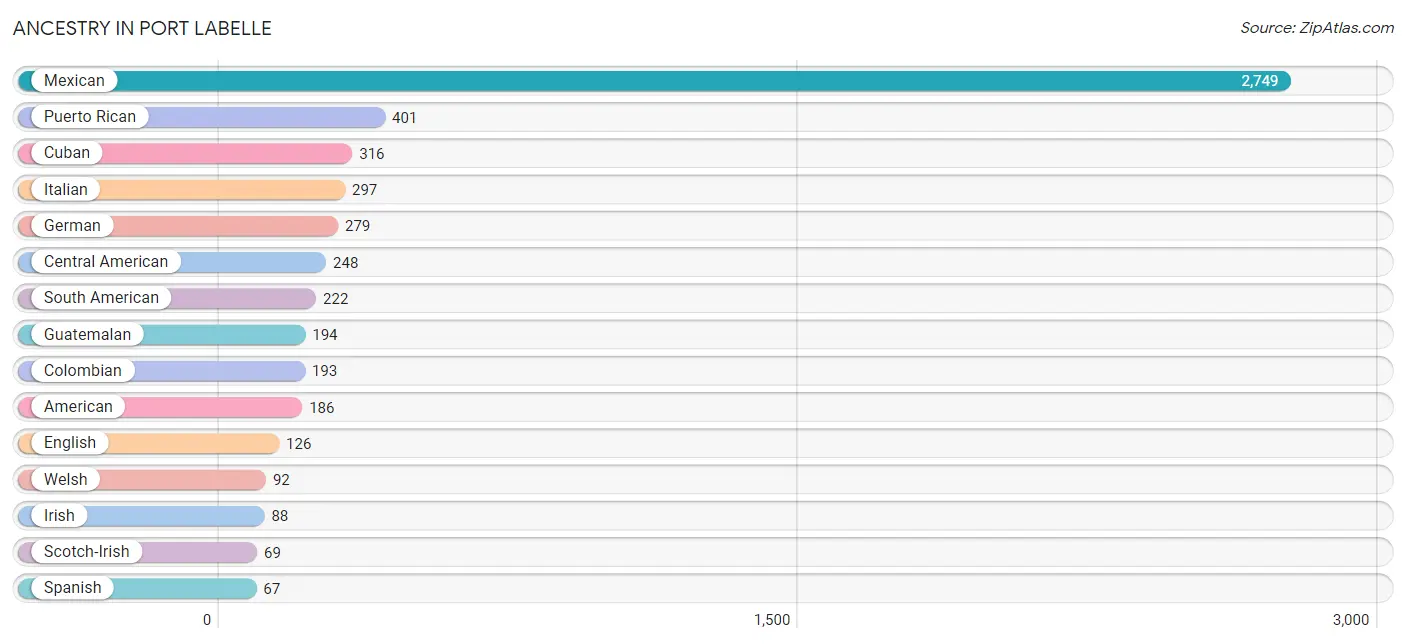
| Ancestry | # Population | % Population |
| American | 186 | 3.2% |
| British | 35 | 0.6% |
| Bulgarian | 21 | 0.4% |
| Central American | 248 | 4.2% |
| Colombian | 193 | 3.3% |
| Cuban | 316 | 5.4% |
| Dutch | 23 | 0.4% |
| English | 126 | 2.1% |
| French | 35 | 0.6% |
| German | 279 | 4.8% |
| Guatemalan | 194 | 3.3% |
| Indian (Asian) | 37 | 0.6% |
| Irish | 88 | 1.5% |
| Italian | 297 | 5.1% |
| Jamaican | 40 | 0.7% |
| Mexican | 2,749 | 46.9% |
| Nicaraguan | 54 | 0.9% |
| Peruvian | 29 | 0.5% |
| Polish | 28 | 0.5% |
| Puerto Rican | 401 | 6.9% |
| Scotch-Irish | 69 | 1.2% |
| Scottish | 11 | 0.2% |
| South American | 222 | 3.8% |
| Spaniard | 21 | 0.4% |
| Spanish | 67 | 1.1% |
| Swiss | 44 | 0.7% |
| Welsh | 92 | 1.6% | View All 27 Rows |
Immigrants in Port LaBelle
The most numerous immigrant groups reported in Port LaBelle came from Latin America (2,418 | 41.3%), Central America (1,907 | 32.6%), Mexico (1,724 | 29.4%), Caribbean (310 | 5.3%), and Cuba (233 | 4.0%), together accounting for 112.5% of all Port LaBelle residents.
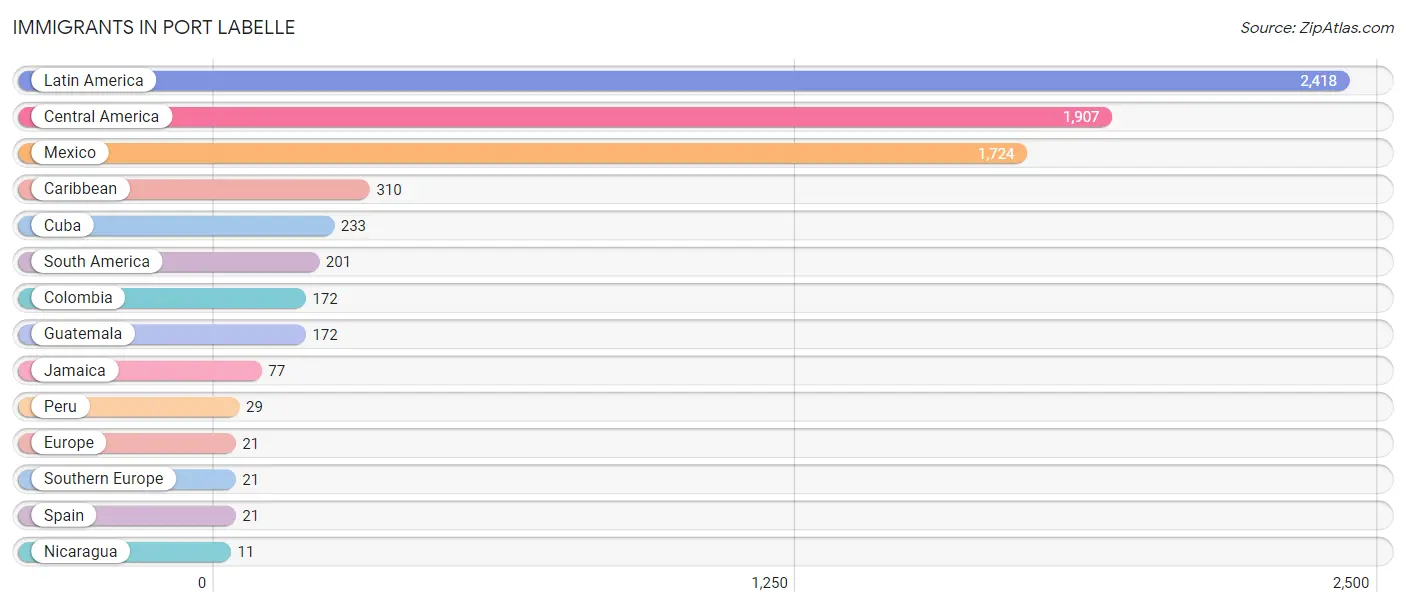
| Immigration Origin | # Population | % Population |
| Caribbean | 310 | 5.3% |
| Central America | 1,907 | 32.6% |
| Colombia | 172 | 2.9% |
| Cuba | 233 | 4.0% |
| Europe | 21 | 0.4% |
| Guatemala | 172 | 2.9% |
| Jamaica | 77 | 1.3% |
| Latin America | 2,418 | 41.3% |
| Mexico | 1,724 | 29.4% |
| Nicaragua | 11 | 0.2% |
| Peru | 29 | 0.5% |
| South America | 201 | 3.4% |
| Southern Europe | 21 | 0.4% |
| Spain | 21 | 0.4% | View All 14 Rows |
Sex and Age in Port LaBelle
Sex and Age in Port LaBelle
The most populous age groups in Port LaBelle are 50 to 54 Years (426 | 13.0%) for men and 25 to 29 Years (419 | 16.2%) for women.
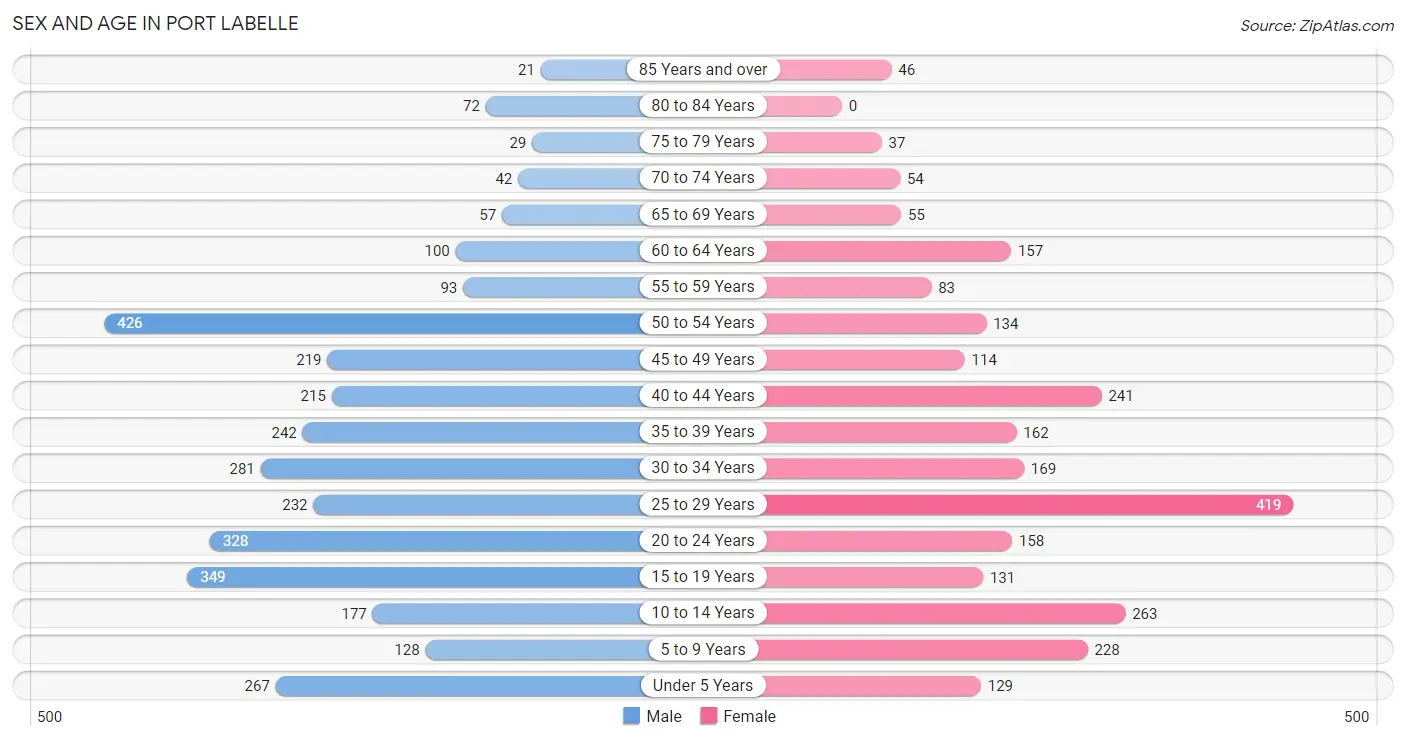
| Age Bracket | Male | Female |
| Under 5 Years | 267 (8.2%) | 129 (5.0%) |
| 5 to 9 Years | 128 (3.9%) | 228 (8.8%) |
| 10 to 14 Years | 177 (5.4%) | 263 (10.2%) |
| 15 to 19 Years | 349 (10.6%) | 131 (5.1%) |
| 20 to 24 Years | 328 (10.0%) | 158 (6.1%) |
| 25 to 29 Years | 232 (7.1%) | 419 (16.2%) |
| 30 to 34 Years | 281 (8.6%) | 169 (6.6%) |
| 35 to 39 Years | 242 (7.4%) | 162 (6.3%) |
| 40 to 44 Years | 215 (6.6%) | 241 (9.3%) |
| 45 to 49 Years | 219 (6.7%) | 114 (4.4%) |
| 50 to 54 Years | 426 (13.0%) | 134 (5.2%) |
| 55 to 59 Years | 93 (2.8%) | 83 (3.2%) |
| 60 to 64 Years | 100 (3.0%) | 157 (6.1%) |
| 65 to 69 Years | 57 (1.7%) | 55 (2.1%) |
| 70 to 74 Years | 42 (1.3%) | 54 (2.1%) |
| 75 to 79 Years | 29 (0.9%) | 37 (1.4%) |
| 80 to 84 Years | 72 (2.2%) | 0 (0.0%) |
| 85 Years and over | 21 (0.6%) | 46 (1.8%) |
| Total | 3,278 (100.0%) | 2,580 (100.0%) |
Families and Households in Port LaBelle
Median Family Size in Port LaBelle
The median family size in Port LaBelle is 3.27 persons per family, with married-couple families (997 | 69.7%) accounting for the largest median family size of 3.37 persons per family. On the other hand, single male/father families (161 | 11.3%) represent the smallest median family size with 2.89 persons per family.
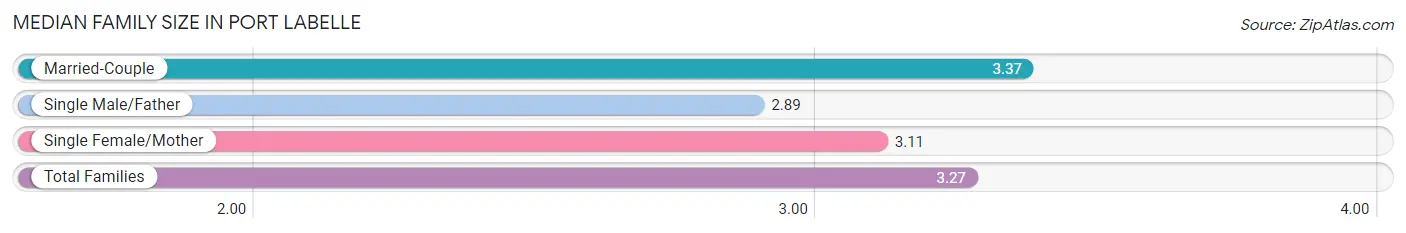
| Family Type | # Families | Family Size |
| Married-Couple | 997 (69.7%) | 3.37 |
| Single Male/Father | 161 (11.3%) | 2.89 |
| Single Female/Mother | 272 (19.0%) | 3.11 |
| Total Families | 1,430 (100.0%) | 3.27 |
Median Household Size in Port LaBelle
The median household size in Port LaBelle is 2.66 persons per household, with single female/mother households (272 | 12.3%) accounting for the largest median household size of 3.68 persons per household. non-family households (773 | 35.1%) represent the smallest median household size with 1.14 persons per household.
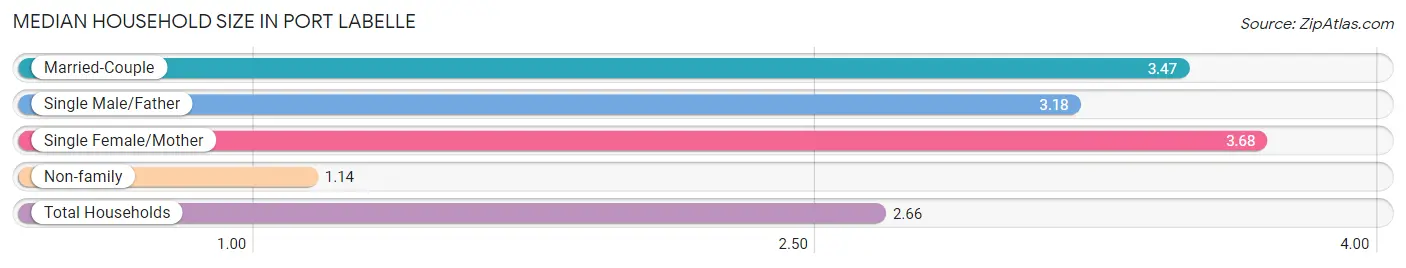
| Household Type | # Households | Household Size |
| Married-Couple | 997 (45.3%) | 3.47 |
| Single Male/Father | 161 (7.3%) | 3.18 |
| Single Female/Mother | 272 (12.3%) | 3.68 |
| Non-family | 773 (35.1%) | 1.14 |
| Total Households | 2,203 (100.0%) | 2.66 |
Household Size by Marriage Status in Port LaBelle
Out of a total of 2,203 households in Port LaBelle, 1,430 (64.9%) are family households, while 773 (35.1%) are nonfamily households. The most numerous type of family households are 2-person households, comprising 519, and the most common type of nonfamily households are 1-person households, comprising 676.
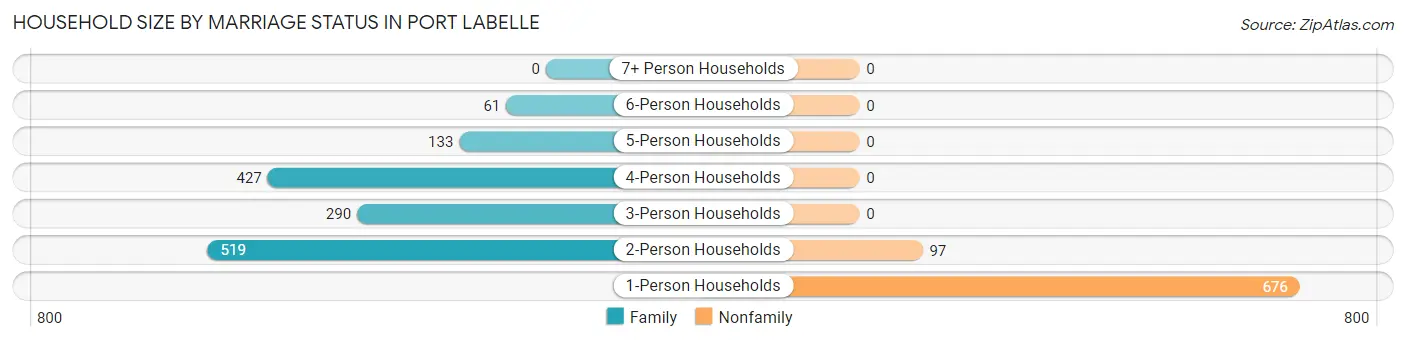
| Household Size | Family Households | Nonfamily Households |
| 1-Person Households | - | 676 (30.7%) |
| 2-Person Households | 519 (23.6%) | 97 (4.4%) |
| 3-Person Households | 290 (13.2%) | 0 (0.0%) |
| 4-Person Households | 427 (19.4%) | 0 (0.0%) |
| 5-Person Households | 133 (6.0%) | 0 (0.0%) |
| 6-Person Households | 61 (2.8%) | 0 (0.0%) |
| 7+ Person Households | 0 (0.0%) | 0 (0.0%) |
| Total | 1,430 (64.9%) | 773 (35.1%) |
Female Fertility in Port LaBelle
Fertility by Age in Port LaBelle
Average fertility rate in Port LaBelle is 65.0 births per 1,000 women. Women in the age bracket of 15 to 19 years have the highest fertility rate with 122.0 births per 1,000 women. Women in the age bracket of 20 to 34 years acount for 82.4% of all women with births.
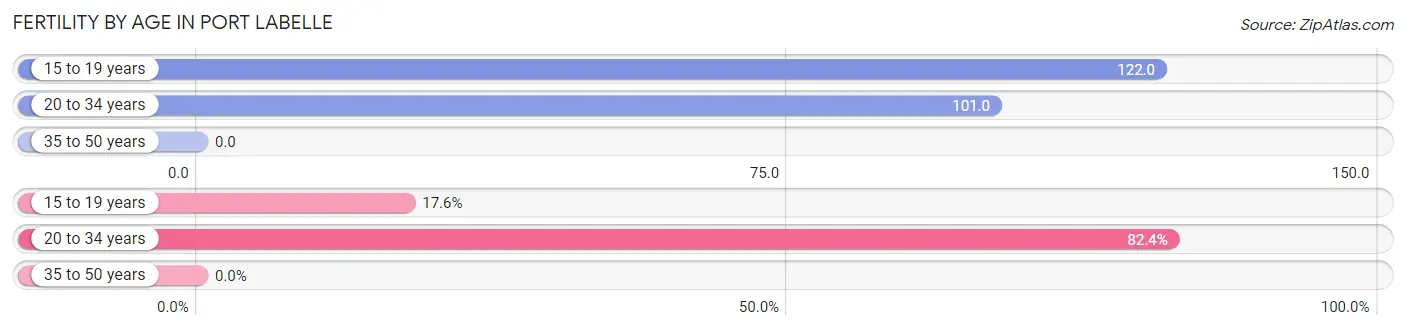
| Age Bracket | Women with Births | Births / 1,000 Women |
| 15 to 19 years | 16 (17.6%) | 122.0 |
| 20 to 34 years | 75 (82.4%) | 101.0 |
| 35 to 50 years | 0 (0.0%) | 0.0 |
| Total | 91 (100.0%) | 65.0 |
Fertility by Age by Marriage Status in Port LaBelle
31.9% of women with births (91) in Port LaBelle are married. The highest percentage of unmarried women with births falls into 20 to 34 years age bracket with 82.7% of them unmarried at the time of birth, while the lowest percentage of unmarried women with births belong to 15 to 19 years age bracket with 0.0% of them unmarried.
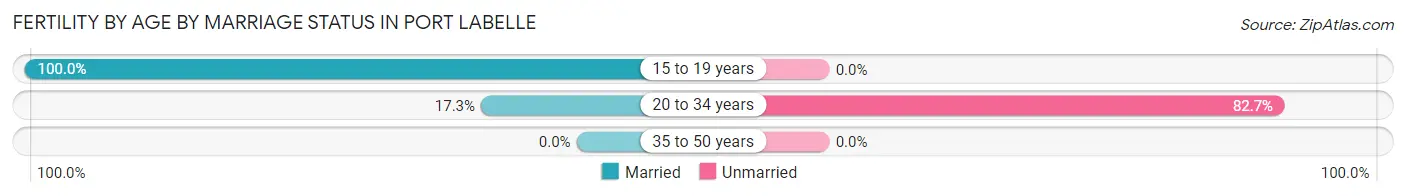
| Age Bracket | Married | Unmarried |
| 15 to 19 years | 16 (100.0%) | 0 (0.0%) |
| 20 to 34 years | 13 (17.3%) | 62 (82.7%) |
| 35 to 50 years | 0 (0.0%) | 0 (0.0%) |
| Total | 29 (31.9%) | 62 (68.1%) |
Fertility by Education in Port LaBelle
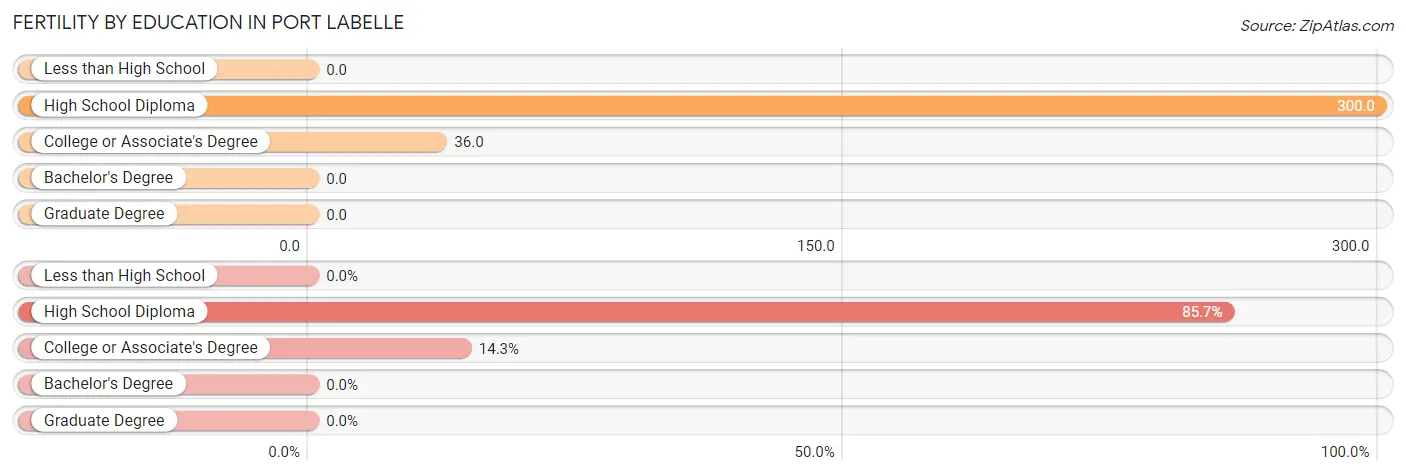
| Educational Attainment | Women with Births | Births / 1,000 Women |
| Less than High School | 0 (0.0%) | 0.0 |
| High School Diploma | 78 (85.7%) | 300.0 |
| College or Associate's Degree | 13 (14.3%) | 36.0 |
| Bachelor's Degree | 0 (0.0%) | 0.0 |
| Graduate Degree | 0 (0.0%) | 0.0 |
| Total | 91 (100.0%) | 65.0 |
Fertility by Education by Marriage Status in Port LaBelle
68.1% of women with births in Port LaBelle are unmarried. Women with the educational attainment of college or associate's degree are most likely to be married with 100.0% of them married at childbirth, while women with the educational attainment of high school diploma are least likely to be married with 79.5% of them unmarried at childbirth.
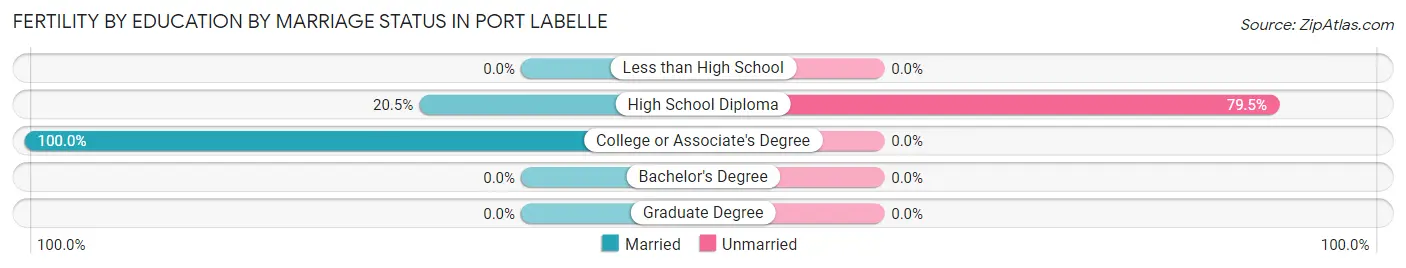
| Educational Attainment | Married | Unmarried |
| Less than High School | 0 (0.0%) | 0 (0.0%) |
| High School Diploma | 16 (20.5%) | 62 (79.5%) |
| College or Associate's Degree | 13 (100.0%) | 0 (0.0%) |
| Bachelor's Degree | 0 (0.0%) | 0 (0.0%) |
| Graduate Degree | 0 (0.0%) | 0 (0.0%) |
| Total | 29 (31.9%) | 62 (68.1%) |
Employment Characteristics in Port LaBelle
Employment by Class of Employer in Port LaBelle
Among the 3,044 employed individuals in Port LaBelle, private company employees (2,004 | 65.8%), not-for-profit organizations (456 | 15.0%), and self-employed (not incorporated) (204 | 6.7%) make up the most common classes of employment.
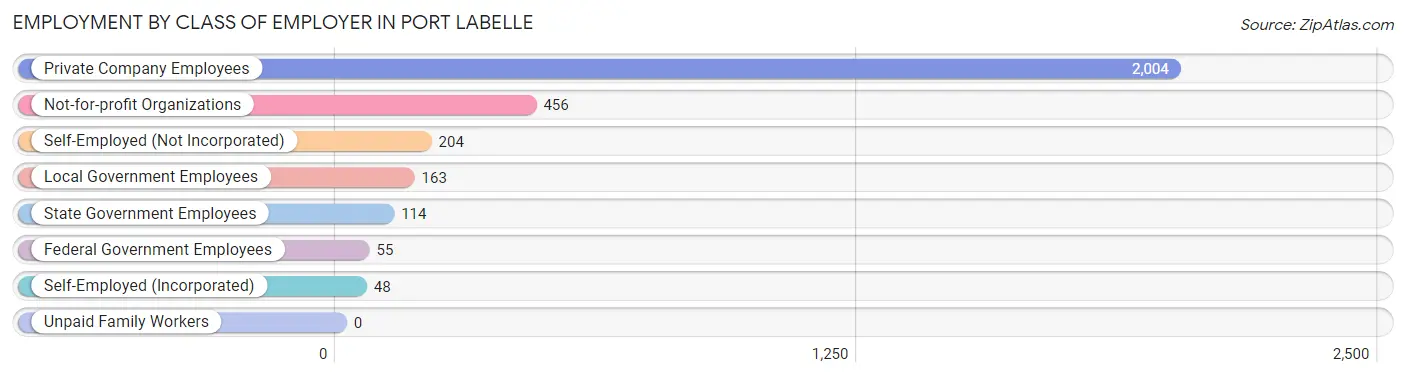
| Employer Class | # Employees | % Employees |
| Private Company Employees | 2,004 | 65.8% |
| Self-Employed (Incorporated) | 48 | 1.6% |
| Self-Employed (Not Incorporated) | 204 | 6.7% |
| Not-for-profit Organizations | 456 | 15.0% |
| Local Government Employees | 163 | 5.3% |
| State Government Employees | 114 | 3.7% |
| Federal Government Employees | 55 | 1.8% |
| Unpaid Family Workers | 0 | 0.0% |
| Total | 3,044 | 100.0% |
Employment Status by Age in Port LaBelle
According to the labor force statistics for Port LaBelle, out of the total population over 16 years of age (4,557), 74.1% or 3,377 individuals are in the labor force, with 7.9% or 267 of them unemployed. The age group with the highest labor force participation rate is 35 to 44 years, with 89.1% or 766 individuals in the labor force. Within the labor force, the 16 to 19 years age range has the highest percentage of unemployed individuals, with 70.7% or 162 of them being unemployed.
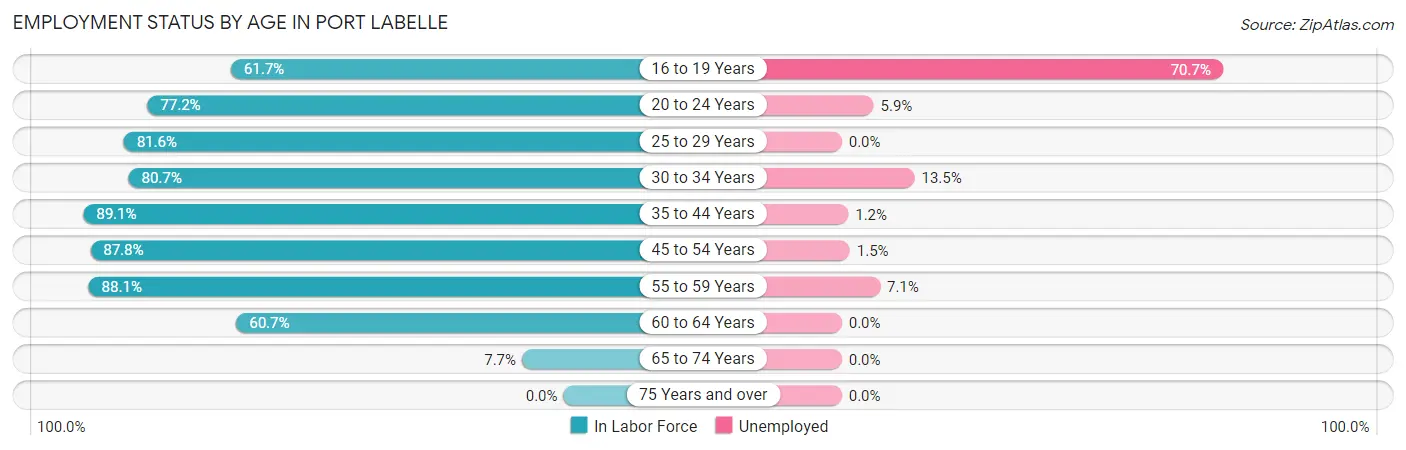
| Age Bracket | In Labor Force | Unemployed |
| 16 to 19 Years | 229 (61.7%) | 162 (70.7%) |
| 20 to 24 Years | 375 (77.2%) | 22 (5.9%) |
| 25 to 29 Years | 531 (81.6%) | 0 (0.0%) |
| 30 to 34 Years | 363 (80.7%) | 49 (13.5%) |
| 35 to 44 Years | 766 (89.1%) | 9 (1.2%) |
| 45 to 54 Years | 784 (87.8%) | 12 (1.5%) |
| 55 to 59 Years | 155 (88.1%) | 11 (7.1%) |
| 60 to 64 Years | 156 (60.7%) | 0 (0.0%) |
| 65 to 74 Years | 16 (7.7%) | 0 (0.0%) |
| 75 Years and over | 0 (0.0%) | 0 (0.0%) |
| Total | 3,377 (74.1%) | 267 (7.9%) |
Employment Status by Educational Attainment in Port LaBelle
According to labor force statistics for Port LaBelle, 83.8% of individuals (2,755) out of the total population between 25 and 64 years of age (3,287) are in the labor force, with 2.9% or 80 of them being unemployed. The group with the highest labor force participation rate are those with the educational attainment of less than high school, with 93.0% or 1,015 individuals in the labor force. Within the labor force, individuals with less than high school education have the highest percentage of unemployment, with 4.8% or 49 of them being unemployed.
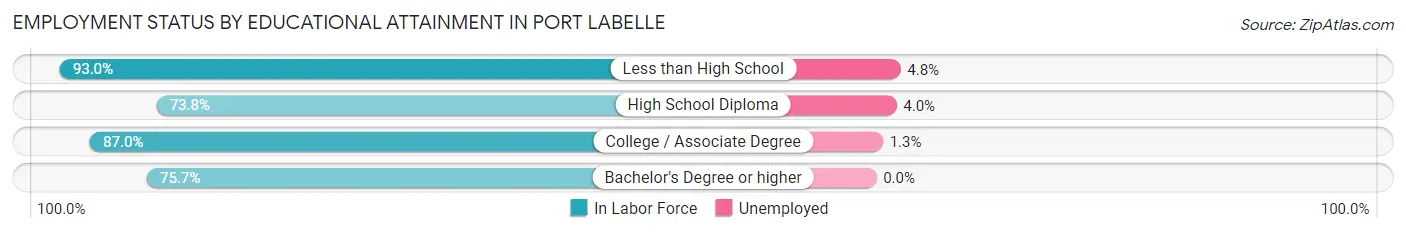
| Educational Attainment | In Labor Force | Unemployed |
| Less than High School | 1,015 (93.0%) | 52 (4.8%) |
| High School Diploma | 569 (73.8%) | 31 (4.0%) |
| College / Associate Degree | 713 (87.0%) | 11 (1.3%) |
| Bachelor's Degree or higher | 458 (75.7%) | 0 (0.0%) |
| Total | 2,755 (83.8%) | 95 (2.9%) |
Employment Occupations by Sex in Port LaBelle
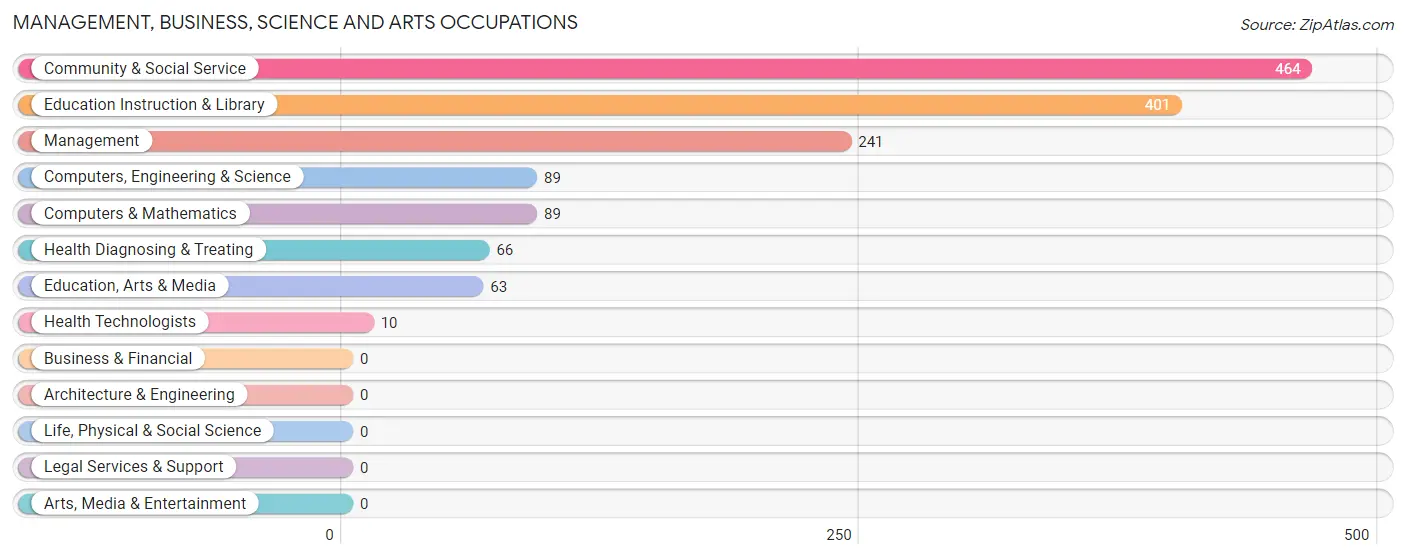
Management, Business, Science and Arts Occupations
The most common Management, Business, Science and Arts occupations in Port LaBelle are Community & Social Service (464 | 14.9%), Education Instruction & Library (401 | 12.9%), Management (241 | 7.7%), Computers, Engineering & Science (89 | 2.9%), and Computers & Mathematics (89 | 2.9%).
Management, Business, Science and Arts Occupations by Sex
Within the Management, Business, Science and Arts occupations in Port LaBelle, the most male-oriented occupations are Computers, Engineering & Science (100.0%), Computers & Mathematics (100.0%), and Education, Arts & Media (100.0%), while the most female-oriented occupations are Education Instruction & Library (100.0%), Health Technologists (100.0%), and Community & Social Service (86.4%).
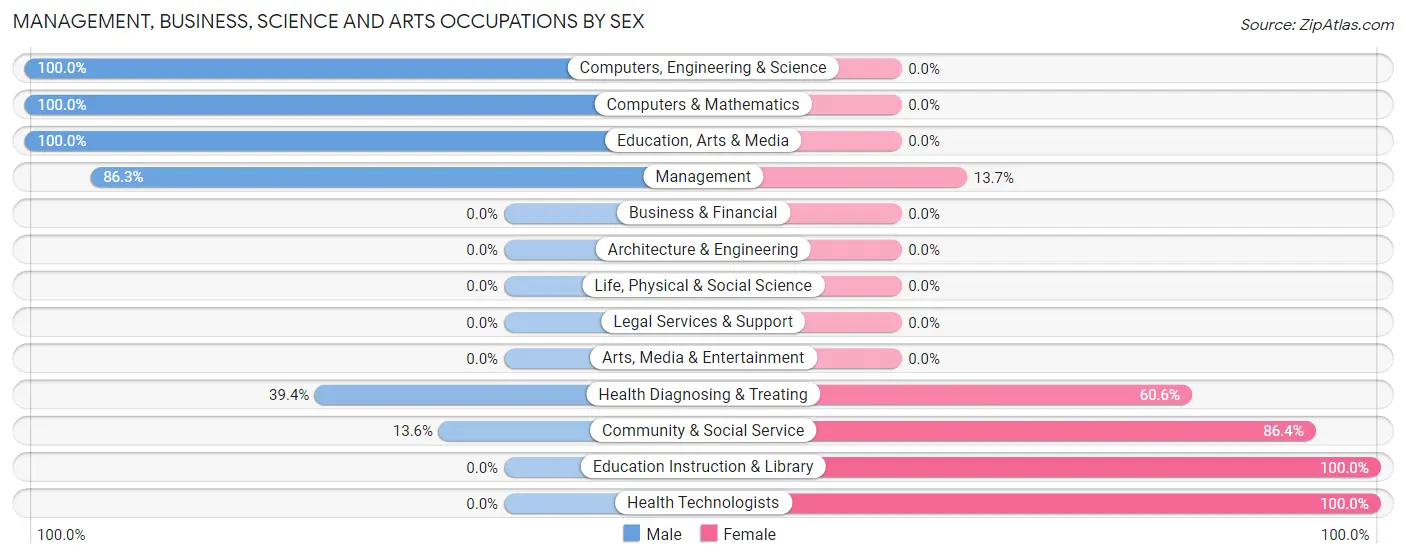
| Occupation | Male | Female |
| Management | 208 (86.3%) | 33 (13.7%) |
| Business & Financial | 0 (0.0%) | 0 (0.0%) |
| Computers, Engineering & Science | 89 (100.0%) | 0 (0.0%) |
| Computers & Mathematics | 89 (100.0%) | 0 (0.0%) |
| Architecture & Engineering | 0 (0.0%) | 0 (0.0%) |
| Life, Physical & Social Science | 0 (0.0%) | 0 (0.0%) |
| Community & Social Service | 63 (13.6%) | 401 (86.4%) |
| Education, Arts & Media | 63 (100.0%) | 0 (0.0%) |
| Legal Services & Support | 0 (0.0%) | 0 (0.0%) |
| Education Instruction & Library | 0 (0.0%) | 401 (100.0%) |
| Arts, Media & Entertainment | 0 (0.0%) | 0 (0.0%) |
| Health Diagnosing & Treating | 26 (39.4%) | 40 (60.6%) |
| Health Technologists | 0 (0.0%) | 10 (100.0%) |
| Total (Category) | 386 (44.9%) | 474 (55.1%) |
| Total (Overall) | 1,922 (61.8%) | 1,188 (38.2%) |
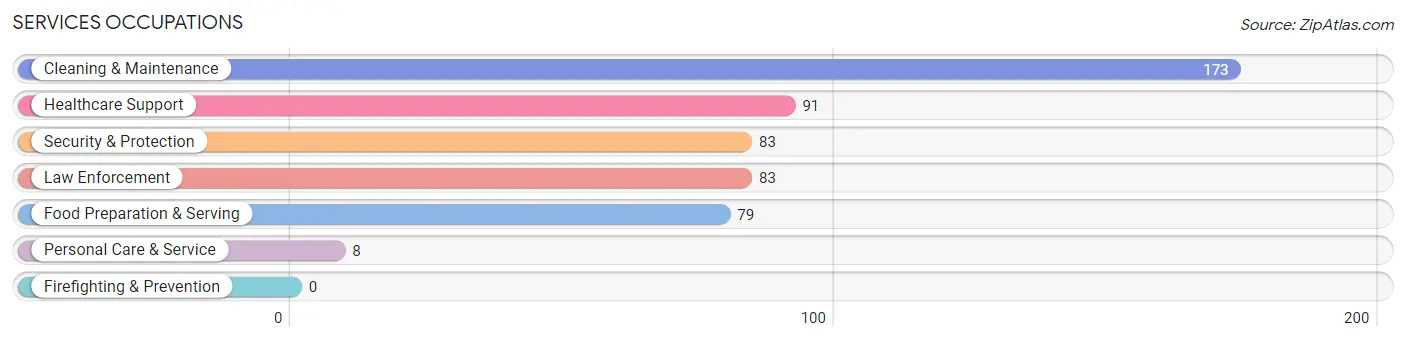
Services Occupations
The most common Services occupations in Port LaBelle are Cleaning & Maintenance (173 | 5.6%), Healthcare Support (91 | 2.9%), Security & Protection (83 | 2.7%), Law Enforcement (83 | 2.7%), and Food Preparation & Serving (79 | 2.5%).
Services Occupations by Sex
Within the Services occupations in Port LaBelle, the most male-oriented occupations are Security & Protection (100.0%), Law Enforcement (100.0%), and Food Preparation & Serving (45.6%), while the most female-oriented occupations are Healthcare Support (100.0%), Personal Care & Service (100.0%), and Cleaning & Maintenance (54.9%).
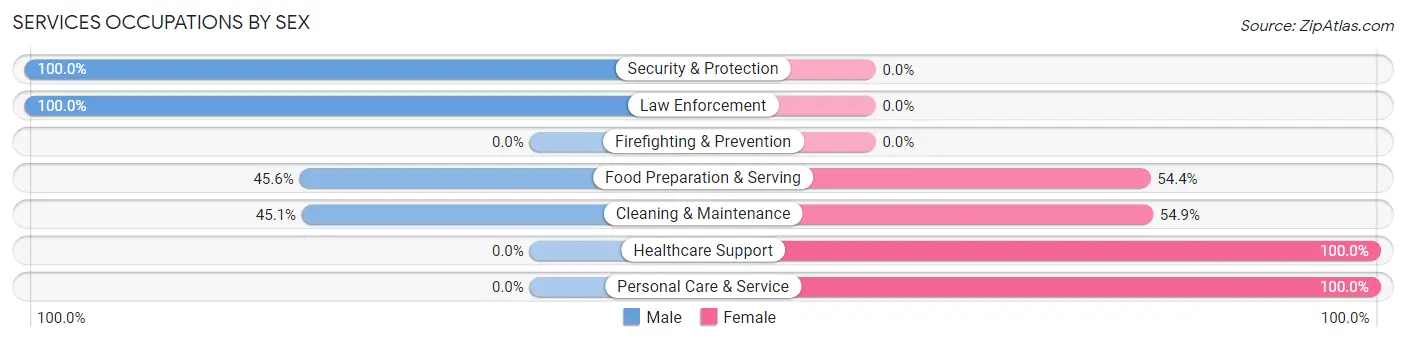
| Occupation | Male | Female |
| Healthcare Support | 0 (0.0%) | 91 (100.0%) |
| Security & Protection | 83 (100.0%) | 0 (0.0%) |
| Firefighting & Prevention | 0 (0.0%) | 0 (0.0%) |
| Law Enforcement | 83 (100.0%) | 0 (0.0%) |
| Food Preparation & Serving | 36 (45.6%) | 43 (54.4%) |
| Cleaning & Maintenance | 78 (45.1%) | 95 (54.9%) |
| Personal Care & Service | 0 (0.0%) | 8 (100.0%) |
| Total (Category) | 197 (45.4%) | 237 (54.6%) |
| Total (Overall) | 1,922 (61.8%) | 1,188 (38.2%) |
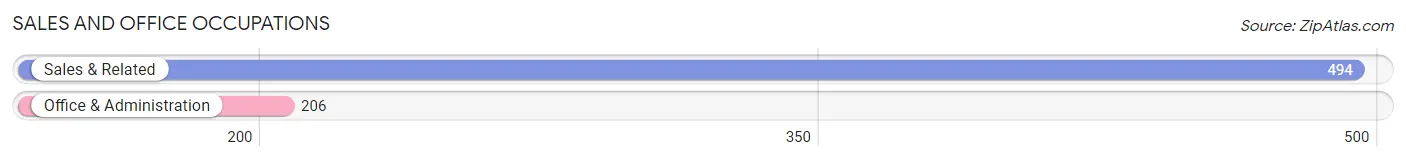
Sales and Office Occupations
The most common Sales and Office occupations in Port LaBelle are Sales & Related (494 | 15.9%), and Office & Administration (206 | 6.6%).
Sales and Office Occupations by Sex
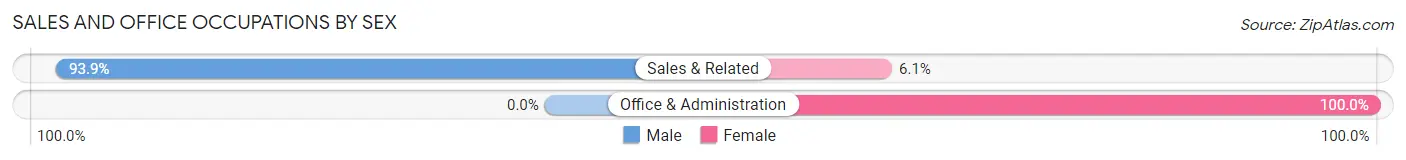
| Occupation | Male | Female |
| Sales & Related | 464 (93.9%) | 30 (6.1%) |
| Office & Administration | 0 (0.0%) | 206 (100.0%) |
| Total (Category) | 464 (66.3%) | 236 (33.7%) |
| Total (Overall) | 1,922 (61.8%) | 1,188 (38.2%) |
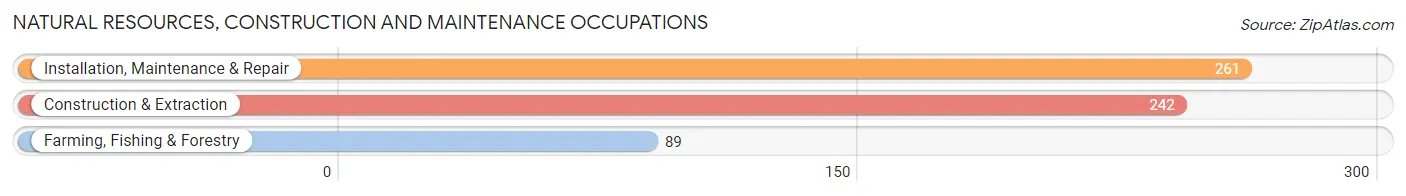
Natural Resources, Construction and Maintenance Occupations
The most common Natural Resources, Construction and Maintenance occupations in Port LaBelle are Installation, Maintenance & Repair (261 | 8.4%), Construction & Extraction (242 | 7.8%), and Farming, Fishing & Forestry (89 | 2.9%).
Natural Resources, Construction and Maintenance Occupations by Sex
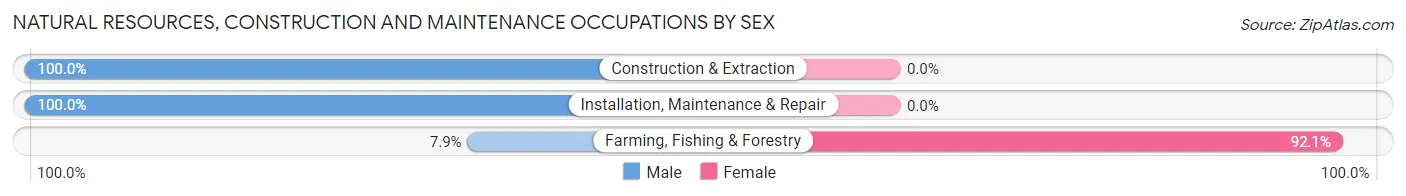
| Occupation | Male | Female |
| Farming, Fishing & Forestry | 7 (7.9%) | 82 (92.1%) |
| Construction & Extraction | 242 (100.0%) | 0 (0.0%) |
| Installation, Maintenance & Repair | 261 (100.0%) | 0 (0.0%) |
| Total (Category) | 510 (86.2%) | 82 (13.9%) |
| Total (Overall) | 1,922 (61.8%) | 1,188 (38.2%) |
Production, Transportation and Moving Occupations
The most common Production, Transportation and Moving occupations in Port LaBelle are Transportation (234 | 7.5%), Production (181 | 5.8%), and Material Moving (109 | 3.5%).
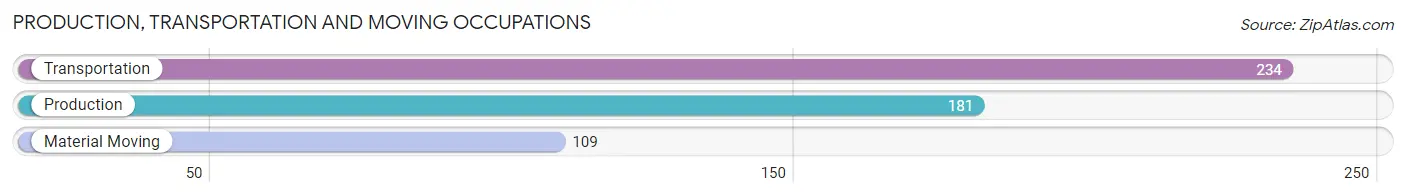
Production, Transportation and Moving Occupations by Sex
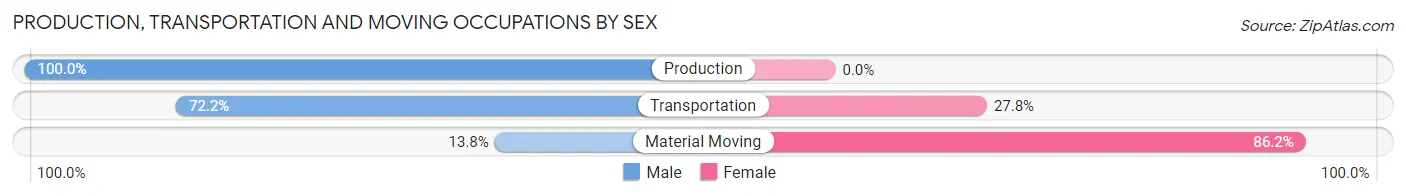
| Occupation | Male | Female |
| Production | 181 (100.0%) | 0 (0.0%) |
| Transportation | 169 (72.2%) | 65 (27.8%) |
| Material Moving | 15 (13.8%) | 94 (86.2%) |
| Total (Category) | 365 (69.7%) | 159 (30.3%) |
| Total (Overall) | 1,922 (61.8%) | 1,188 (38.2%) |
Employment Industries by Sex in Port LaBelle
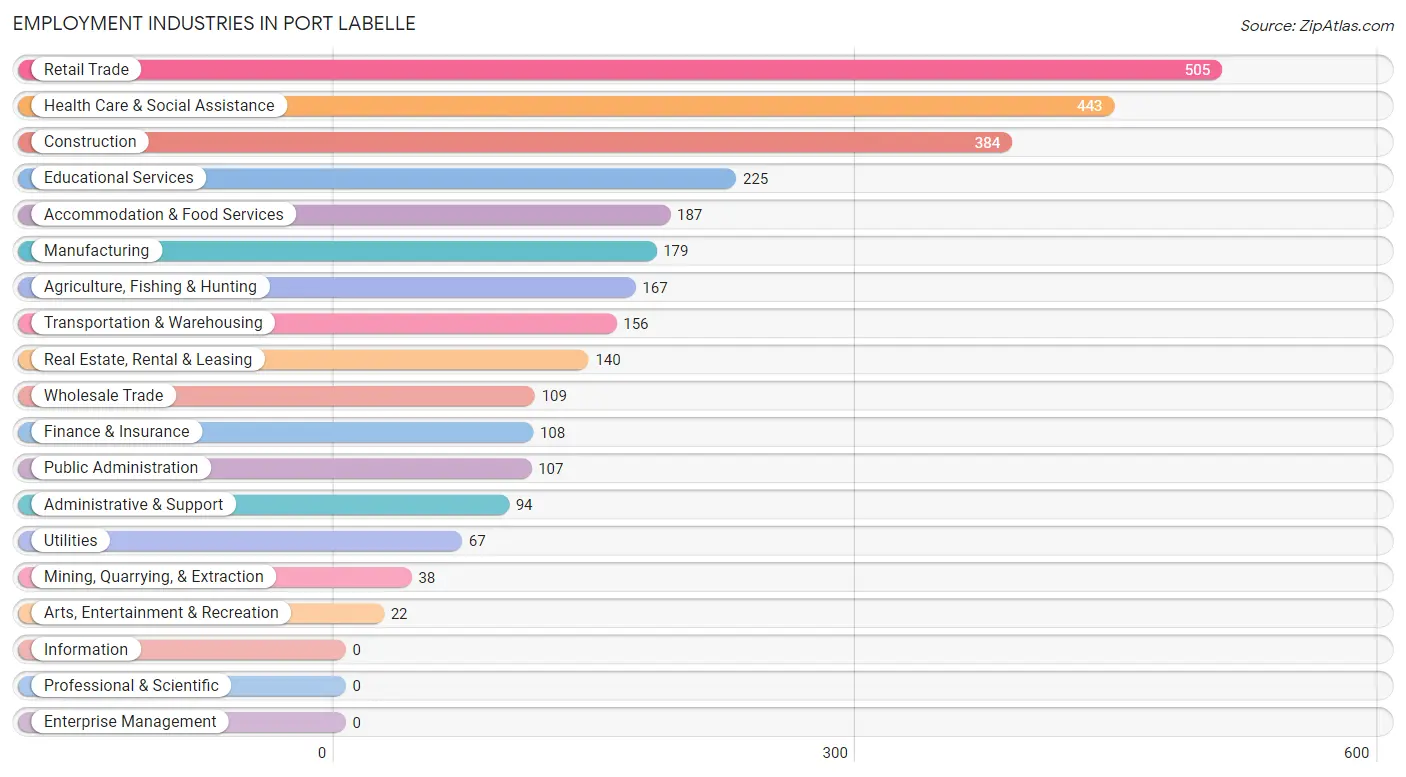
Employment Industries in Port LaBelle
The major employment industries in Port LaBelle include Retail Trade (505 | 16.2%), Health Care & Social Assistance (443 | 14.2%), Construction (384 | 12.3%), Educational Services (225 | 7.2%), and Accommodation & Food Services (187 | 6.0%).
Employment Industries by Sex in Port LaBelle
The Port LaBelle industries that see more men than women are Mining, Quarrying, & Extraction (100.0%), Construction (100.0%), and Manufacturing (100.0%), whereas the industries that tend to have a higher number of women are Finance & Insurance (100.0%), Health Care & Social Assistance (94.1%), and Educational Services (88.0%).
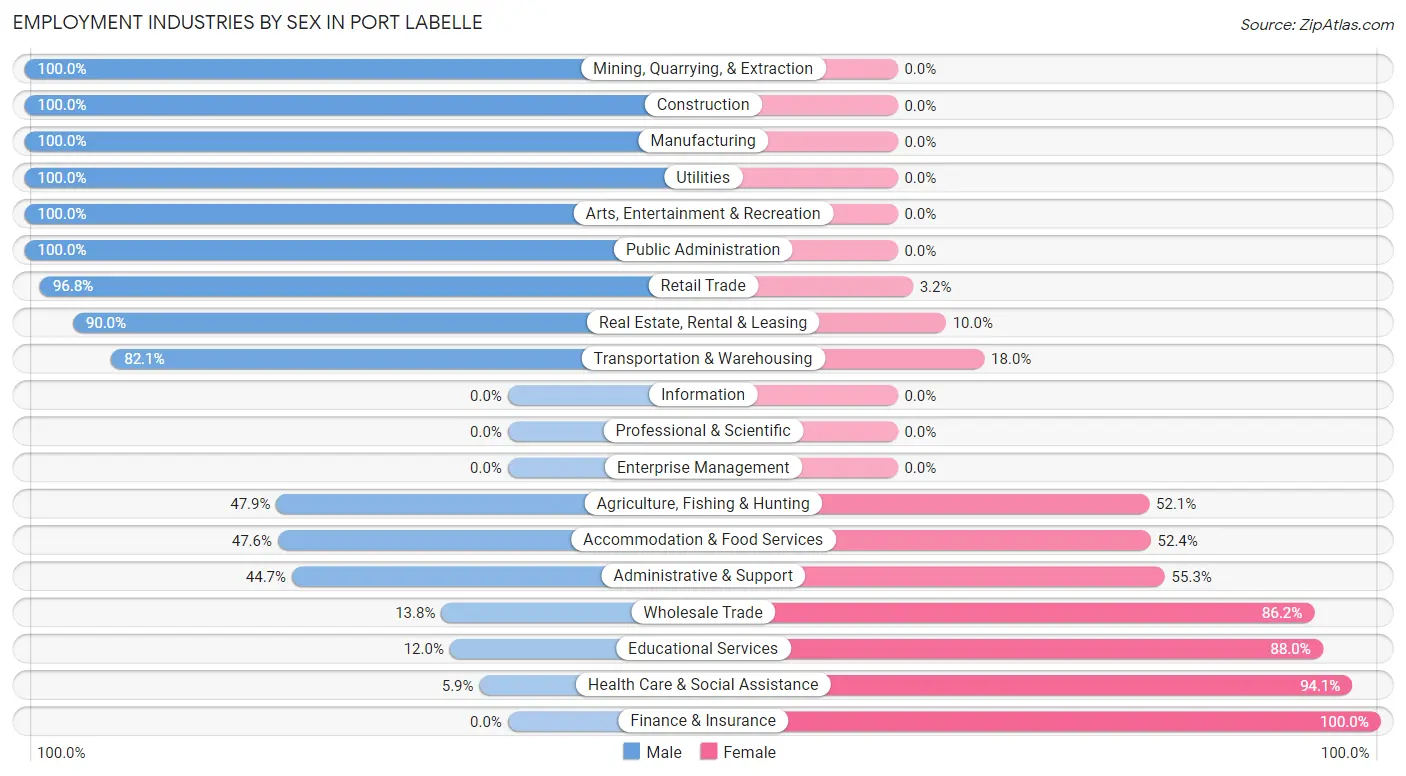
| Industry | Male | Female |
| Agriculture, Fishing & Hunting | 80 (47.9%) | 87 (52.1%) |
| Mining, Quarrying, & Extraction | 38 (100.0%) | 0 (0.0%) |
| Construction | 384 (100.0%) | 0 (0.0%) |
| Manufacturing | 179 (100.0%) | 0 (0.0%) |
| Wholesale Trade | 15 (13.8%) | 94 (86.2%) |
| Retail Trade | 489 (96.8%) | 16 (3.2%) |
| Transportation & Warehousing | 128 (82.1%) | 28 (17.9%) |
| Utilities | 67 (100.0%) | 0 (0.0%) |
| Information | 0 (0.0%) | 0 (0.0%) |
| Finance & Insurance | 0 (0.0%) | 108 (100.0%) |
| Real Estate, Rental & Leasing | 126 (90.0%) | 14 (10.0%) |
| Professional & Scientific | 0 (0.0%) | 0 (0.0%) |
| Enterprise Management | 0 (0.0%) | 0 (0.0%) |
| Administrative & Support | 42 (44.7%) | 52 (55.3%) |
| Educational Services | 27 (12.0%) | 198 (88.0%) |
| Health Care & Social Assistance | 26 (5.9%) | 417 (94.1%) |
| Arts, Entertainment & Recreation | 22 (100.0%) | 0 (0.0%) |
| Accommodation & Food Services | 89 (47.6%) | 98 (52.4%) |
| Public Administration | 107 (100.0%) | 0 (0.0%) |
| Total | 1,922 (61.8%) | 1,188 (38.2%) |
Education in Port LaBelle
School Enrollment in Port LaBelle
The most common levels of schooling among the 1,452 students in Port LaBelle are high school (428 | 29.5%), middle school (382 | 26.3%), and elementary school (350 | 24.1%).
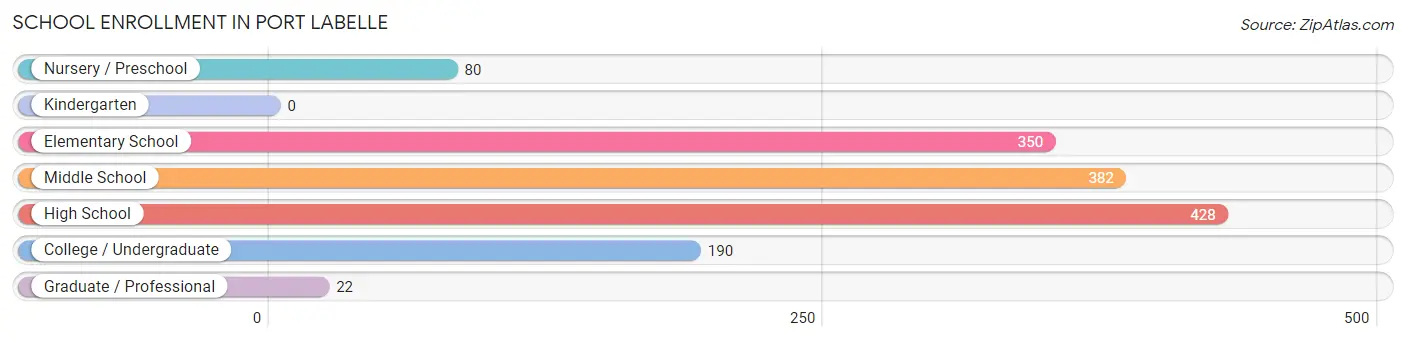
| School Level | # Students | % Students |
| Nursery / Preschool | 80 | 5.5% |
| Kindergarten | 0 | 0.0% |
| Elementary School | 350 | 24.1% |
| Middle School | 382 | 26.3% |
| High School | 428 | 29.5% |
| College / Undergraduate | 190 | 13.1% |
| Graduate / Professional | 22 | 1.5% |
| Total | 1,452 | 100.0% |
School Enrollment by Age by Funding Source in Port LaBelle
Out of a total of 1,452 students who are enrolled in schools in Port LaBelle, 93 (6.4%) attend a private institution, while the remaining 1,359 (93.6%) are enrolled in public schools. The age group of 3 to 4 year olds has the highest likelihood of being enrolled in private schools, with 14 (36.8% in the age bracket) enrolled. Conversely, the age group of 15 to 17 year olds has the lowest likelihood of being enrolled in a private school, with 348 (100.0% in the age bracket) attending a public institution.
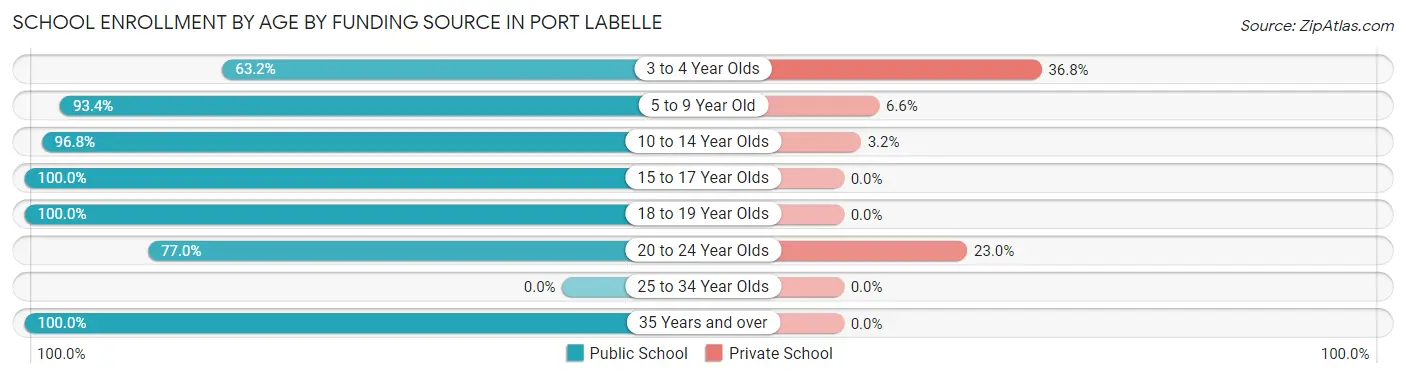
| Age Bracket | Public School | Private School |
| 3 to 4 Year Olds | 24 (63.2%) | 14 (36.8%) |
| 5 to 9 Year Old | 312 (93.4%) | 22 (6.6%) |
| 10 to 14 Year Olds | 426 (96.8%) | 14 (3.2%) |
| 15 to 17 Year Olds | 348 (100.0%) | 0 (0.0%) |
| 18 to 19 Year Olds | 96 (100.0%) | 0 (0.0%) |
| 20 to 24 Year Olds | 144 (77.0%) | 43 (23.0%) |
| 25 to 34 Year Olds | 0 (0.0%) | 0 (0.0%) |
| 35 Years and over | 9 (100.0%) | 0 (0.0%) |
| Total | 1,359 (93.6%) | 93 (6.4%) |
Educational Attainment by Field of Study in Port LaBelle
Education (207 | 28.0%), psychology (172 | 23.2%), computers & mathematics (76 | 10.3%), bio, nature & agricultural (70 | 9.5%), and business (54 | 7.3%) are the most common fields of study among 740 individuals in Port LaBelle who have obtained a bachelor's degree or higher.
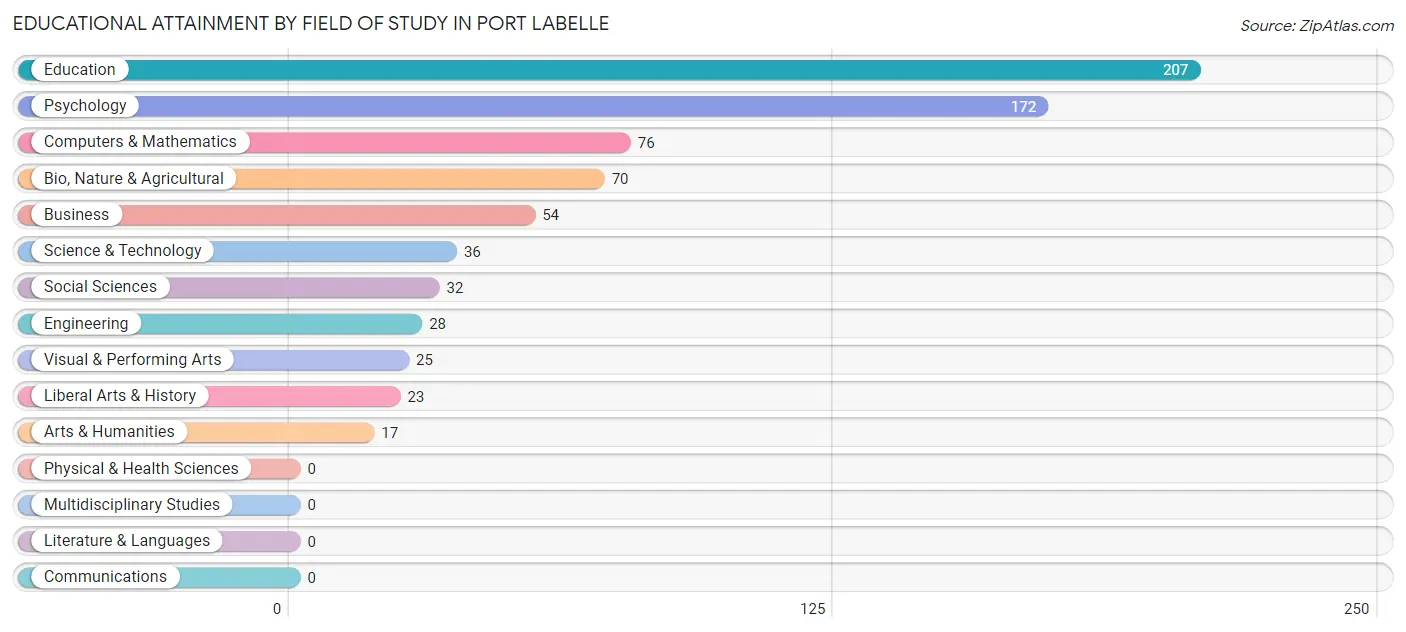
| Field of Study | # Graduates | % Graduates |
| Computers & Mathematics | 76 | 10.3% |
| Bio, Nature & Agricultural | 70 | 9.5% |
| Physical & Health Sciences | 0 | 0.0% |
| Psychology | 172 | 23.2% |
| Social Sciences | 32 | 4.3% |
| Engineering | 28 | 3.8% |
| Multidisciplinary Studies | 0 | 0.0% |
| Science & Technology | 36 | 4.9% |
| Business | 54 | 7.3% |
| Education | 207 | 28.0% |
| Literature & Languages | 0 | 0.0% |
| Liberal Arts & History | 23 | 3.1% |
| Visual & Performing Arts | 25 | 3.4% |
| Communications | 0 | 0.0% |
| Arts & Humanities | 17 | 2.3% |
| Total | 740 | 100.0% |
Transportation & Commute in Port LaBelle
Vehicle Availability by Sex in Port LaBelle
The most prevalent vehicle ownership categories in Port LaBelle are males with 2 vehicles (698, accounting for 36.3%) and females with 2 vehicles (371, making up 62.2%).
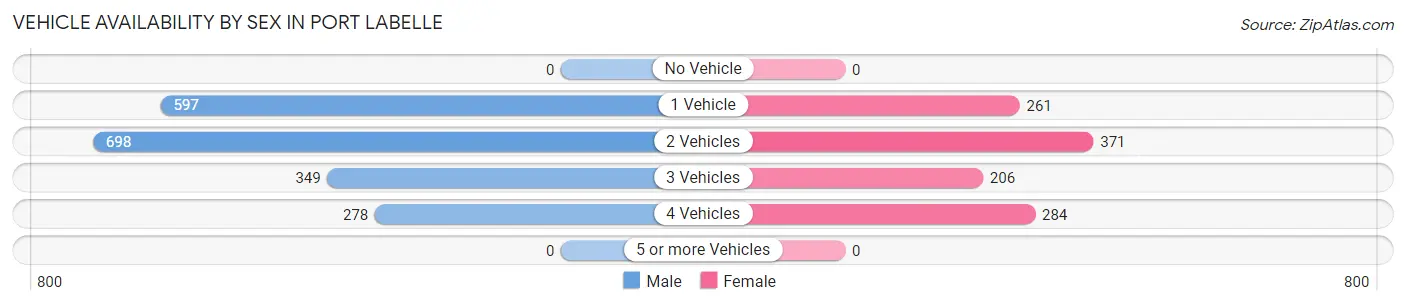
| Vehicles Available | Male | Female |
| No Vehicle | 0 (0.0%) | 0 (0.0%) |
| 1 Vehicle | 597 (31.1%) | 261 (23.3%) |
| 2 Vehicles | 698 (36.3%) | 371 (33.1%) |
| 3 Vehicles | 349 (18.2%) | 206 (18.4%) |
| 4 Vehicles | 278 (14.5%) | 284 (25.3%) |
| 5 or more Vehicles | 0 (0.0%) | 0 (0.0%) |
| Total | 1,922 (100.0%) | 1,122 (100.0%) |
Commute Time in Port LaBelle
The most frequently occuring commute durations in Port LaBelle are 5 to 9 minutes (462 commuters, 15.8%), 10 to 14 minutes (386 commuters, 13.2%), and 25 to 29 minutes (379 commuters, 12.9%).
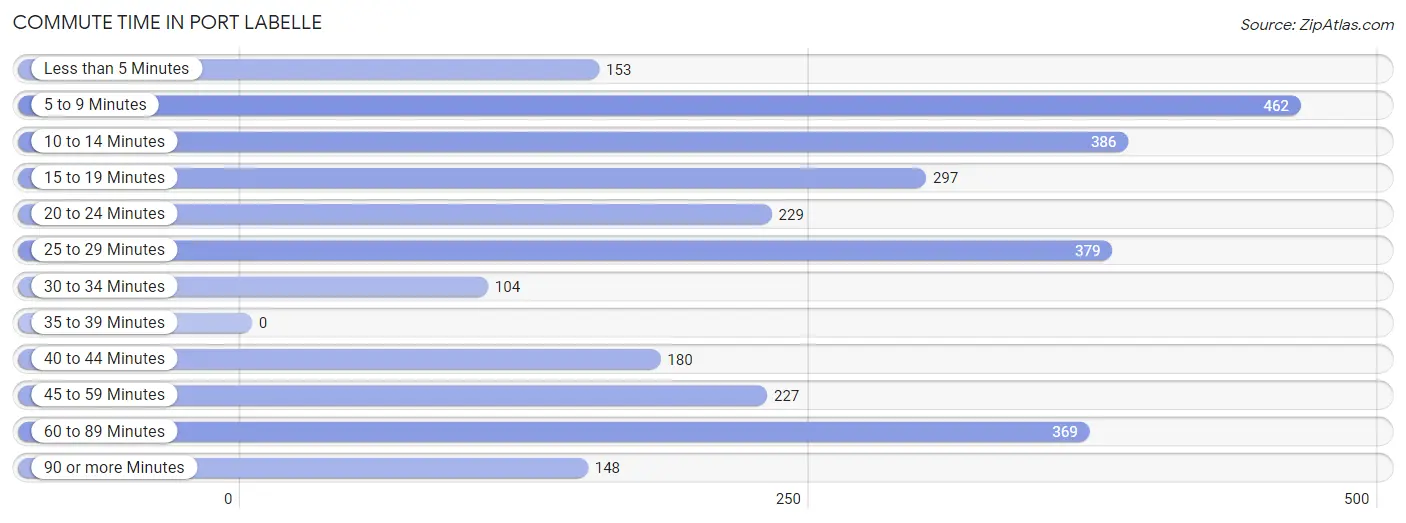
| Commute Time | # Commuters | % Commuters |
| Less than 5 Minutes | 153 | 5.2% |
| 5 to 9 Minutes | 462 | 15.8% |
| 10 to 14 Minutes | 386 | 13.2% |
| 15 to 19 Minutes | 297 | 10.1% |
| 20 to 24 Minutes | 229 | 7.8% |
| 25 to 29 Minutes | 379 | 12.9% |
| 30 to 34 Minutes | 104 | 3.5% |
| 35 to 39 Minutes | 0 | 0.0% |
| 40 to 44 Minutes | 180 | 6.1% |
| 45 to 59 Minutes | 227 | 7.7% |
| 60 to 89 Minutes | 369 | 12.6% |
| 90 or more Minutes | 148 | 5.0% |
Commute Time by Sex in Port LaBelle
The most common commute times in Port LaBelle are 60 to 89 minutes (359 commuters, 19.7%) for males and 10 to 14 minutes (360 commuters, 32.5%) for females.
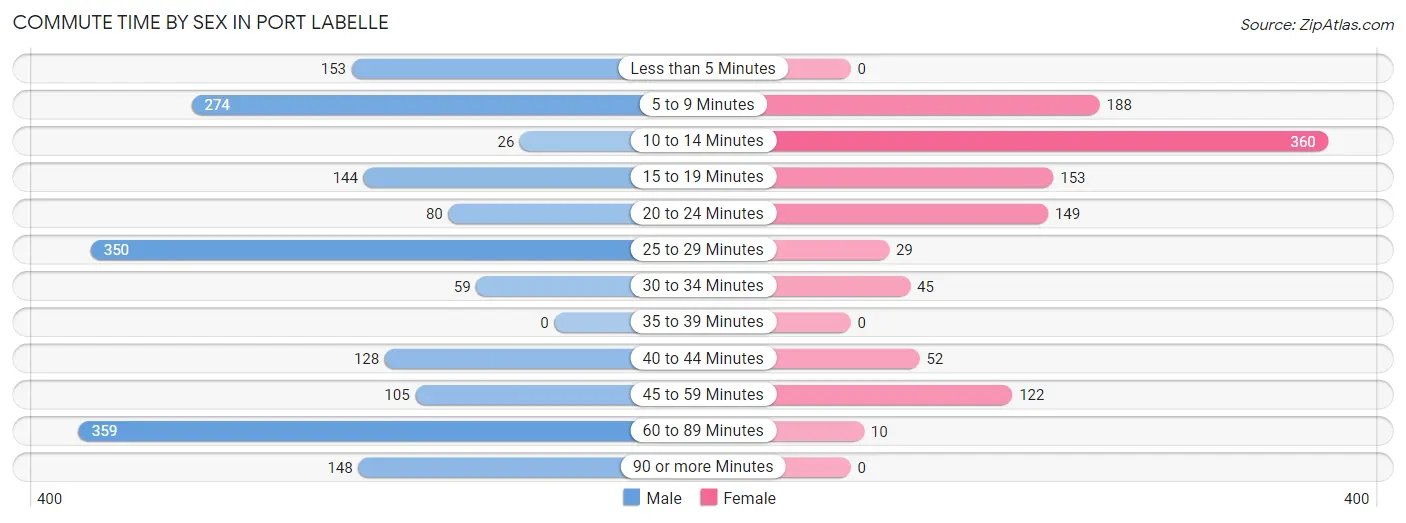
| Commute Time | Male | Female |
| Less than 5 Minutes | 153 (8.4%) | 0 (0.0%) |
| 5 to 9 Minutes | 274 (15.0%) | 188 (17.0%) |
| 10 to 14 Minutes | 26 (1.4%) | 360 (32.5%) |
| 15 to 19 Minutes | 144 (7.9%) | 153 (13.8%) |
| 20 to 24 Minutes | 80 (4.4%) | 149 (13.5%) |
| 25 to 29 Minutes | 350 (19.2%) | 29 (2.6%) |
| 30 to 34 Minutes | 59 (3.2%) | 45 (4.1%) |
| 35 to 39 Minutes | 0 (0.0%) | 0 (0.0%) |
| 40 to 44 Minutes | 128 (7.0%) | 52 (4.7%) |
| 45 to 59 Minutes | 105 (5.8%) | 122 (11.0%) |
| 60 to 89 Minutes | 359 (19.7%) | 10 (0.9%) |
| 90 or more Minutes | 148 (8.1%) | 0 (0.0%) |
Time of Departure to Work by Sex in Port LaBelle
The most frequent times of departure to work in Port LaBelle are 6:00 AM to 6:29 AM (783, 42.9%) for males and 8:00 AM to 8:29 AM (304, 27.4%) for females.
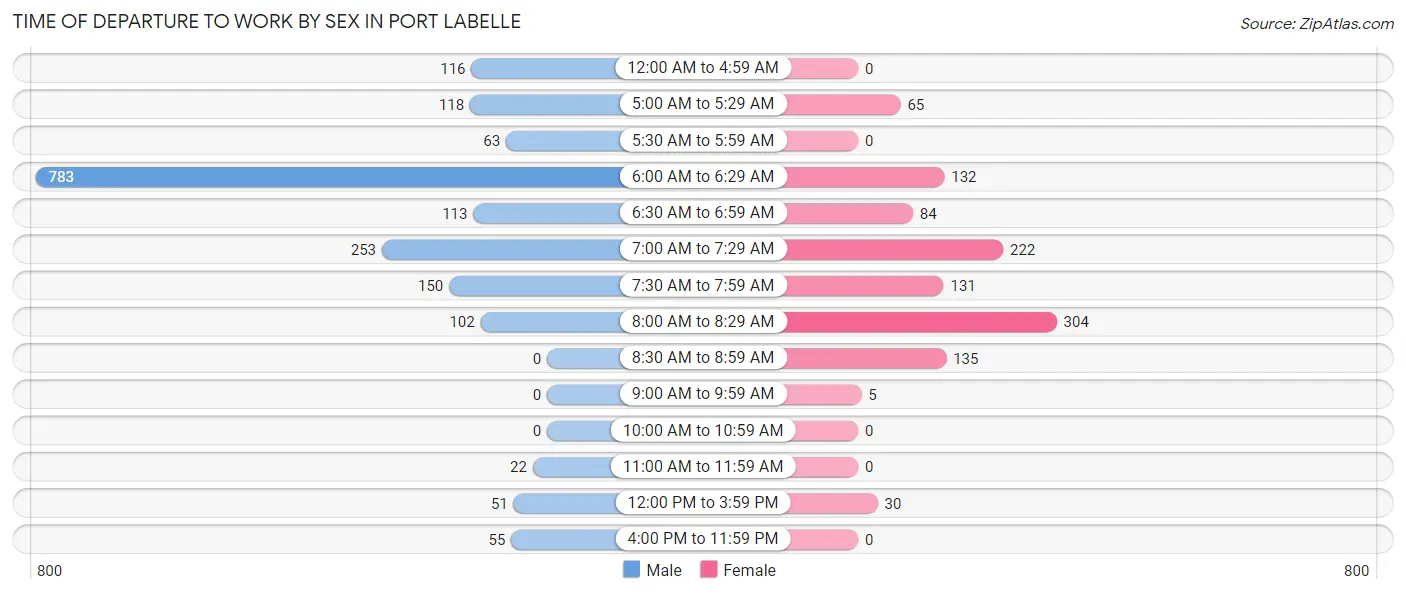
| Time of Departure | Male | Female |
| 12:00 AM to 4:59 AM | 116 (6.4%) | 0 (0.0%) |
| 5:00 AM to 5:29 AM | 118 (6.5%) | 65 (5.9%) |
| 5:30 AM to 5:59 AM | 63 (3.5%) | 0 (0.0%) |
| 6:00 AM to 6:29 AM | 783 (42.9%) | 132 (11.9%) |
| 6:30 AM to 6:59 AM | 113 (6.2%) | 84 (7.6%) |
| 7:00 AM to 7:29 AM | 253 (13.9%) | 222 (20.0%) |
| 7:30 AM to 7:59 AM | 150 (8.2%) | 131 (11.8%) |
| 8:00 AM to 8:29 AM | 102 (5.6%) | 304 (27.4%) |
| 8:30 AM to 8:59 AM | 0 (0.0%) | 135 (12.2%) |
| 9:00 AM to 9:59 AM | 0 (0.0%) | 5 (0.4%) |
| 10:00 AM to 10:59 AM | 0 (0.0%) | 0 (0.0%) |
| 11:00 AM to 11:59 AM | 22 (1.2%) | 0 (0.0%) |
| 12:00 PM to 3:59 PM | 51 (2.8%) | 30 (2.7%) |
| 4:00 PM to 11:59 PM | 55 (3.0%) | 0 (0.0%) |
| Total | 1,826 (100.0%) | 1,108 (100.0%) |
Housing Occupancy in Port LaBelle
Occupancy by Ownership in Port LaBelle
Of the total 2,203 dwellings in Port LaBelle, owner-occupied units account for 1,565 (71.0%), while renter-occupied units make up 638 (29.0%).
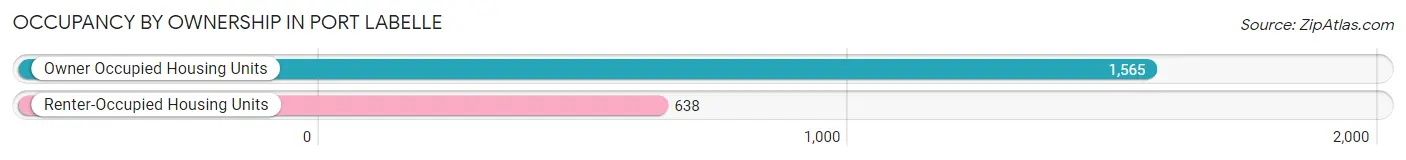
| Occupancy | # Housing Units | % Housing Units |
| Owner Occupied Housing Units | 1,565 | 71.0% |
| Renter-Occupied Housing Units | 638 | 29.0% |
| Total Occupied Housing Units | 2,203 | 100.0% |
Occupancy by Household Size in Port LaBelle
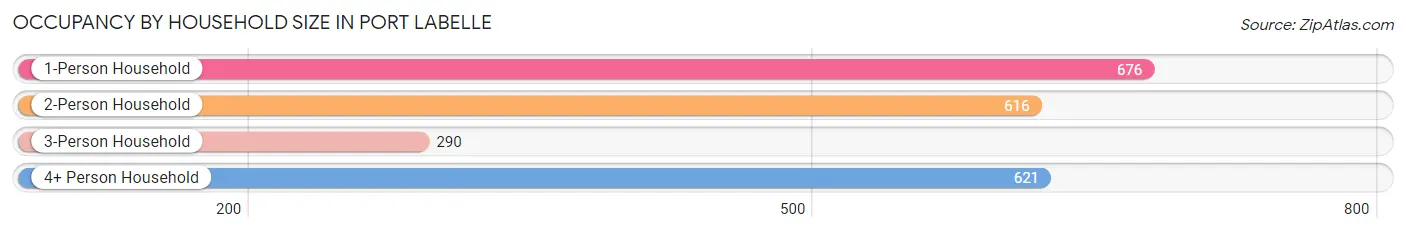
| Household Size | # Housing Units | % Housing Units |
| 1-Person Household | 676 | 30.7% |
| 2-Person Household | 616 | 28.0% |
| 3-Person Household | 290 | 13.2% |
| 4+ Person Household | 621 | 28.2% |
| Total Housing Units | 2,203 | 100.0% |
Occupancy by Ownership by Household Size in Port LaBelle
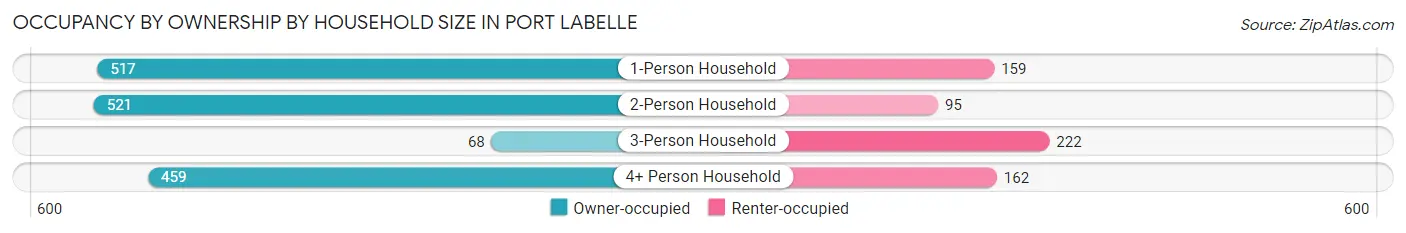
| Household Size | Owner-occupied | Renter-occupied |
| 1-Person Household | 517 (76.5%) | 159 (23.5%) |
| 2-Person Household | 521 (84.6%) | 95 (15.4%) |
| 3-Person Household | 68 (23.4%) | 222 (76.5%) |
| 4+ Person Household | 459 (73.9%) | 162 (26.1%) |
| Total Housing Units | 1,565 (71.0%) | 638 (29.0%) |
Occupancy by Educational Attainment in Port LaBelle
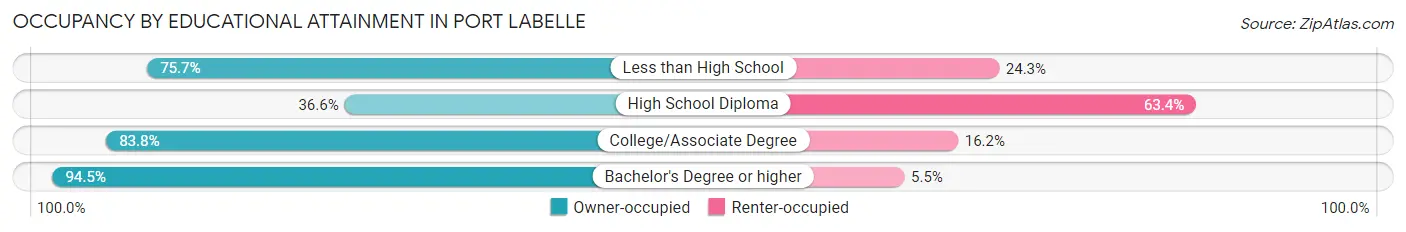
| Household Size | Owner-occupied | Renter-occupied |
| Less than High School | 501 (75.7%) | 161 (24.3%) |
| High School Diploma | 203 (36.6%) | 352 (63.4%) |
| College/Associate Degree | 554 (83.8%) | 107 (16.2%) |
| Bachelor's Degree or higher | 307 (94.5%) | 18 (5.5%) |
Occupancy by Age of Householder in Port LaBelle
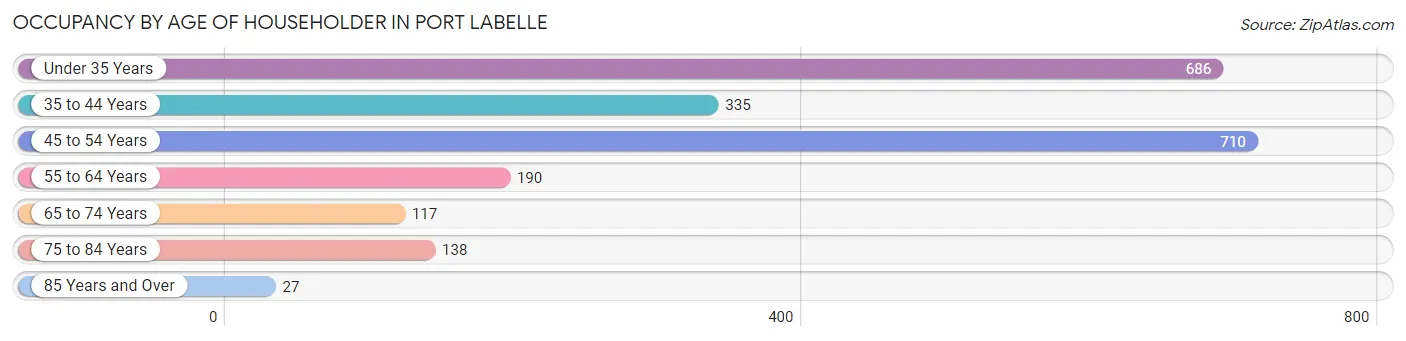
| Age Bracket | # Households | % Households |
| Under 35 Years | 686 | 31.1% |
| 35 to 44 Years | 335 | 15.2% |
| 45 to 54 Years | 710 | 32.2% |
| 55 to 64 Years | 190 | 8.6% |
| 65 to 74 Years | 117 | 5.3% |
| 75 to 84 Years | 138 | 6.3% |
| 85 Years and Over | 27 | 1.2% |
| Total | 2,203 | 100.0% |
Housing Finances in Port LaBelle
Median Income by Occupancy in Port LaBelle
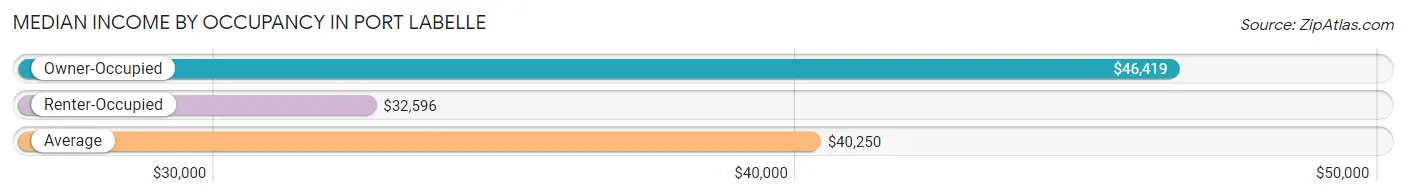
| Occupancy Type | # Households | Median Income |
| Owner-Occupied | 1,565 (71.0%) | $46,419 |
| Renter-Occupied | 638 (29.0%) | $32,596 |
| Average | 2,203 (100.0%) | $40,250 |
Occupancy by Householder Income Bracket in Port LaBelle
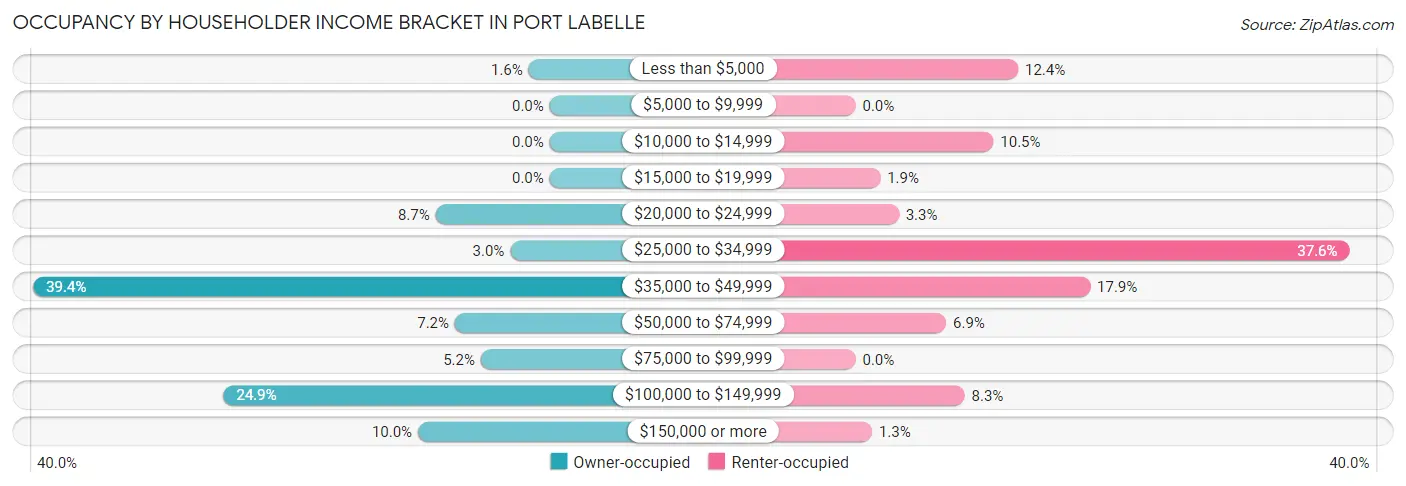
| Income Bracket | Owner-occupied | Renter-occupied |
| Less than $5,000 | 25 (1.6%) | 79 (12.4%) |
| $5,000 to $9,999 | 0 (0.0%) | 0 (0.0%) |
| $10,000 to $14,999 | 0 (0.0%) | 67 (10.5%) |
| $15,000 to $19,999 | 0 (0.0%) | 12 (1.9%) |
| $20,000 to $24,999 | 136 (8.7%) | 21 (3.3%) |
| $25,000 to $34,999 | 47 (3.0%) | 240 (37.6%) |
| $35,000 to $49,999 | 616 (39.4%) | 114 (17.9%) |
| $50,000 to $74,999 | 113 (7.2%) | 44 (6.9%) |
| $75,000 to $99,999 | 82 (5.2%) | 0 (0.0%) |
| $100,000 to $149,999 | 389 (24.9%) | 53 (8.3%) |
| $150,000 or more | 157 (10.0%) | 8 (1.3%) |
| Total | 1,565 (100.0%) | 638 (100.0%) |
Monthly Housing Cost Tiers in Port LaBelle
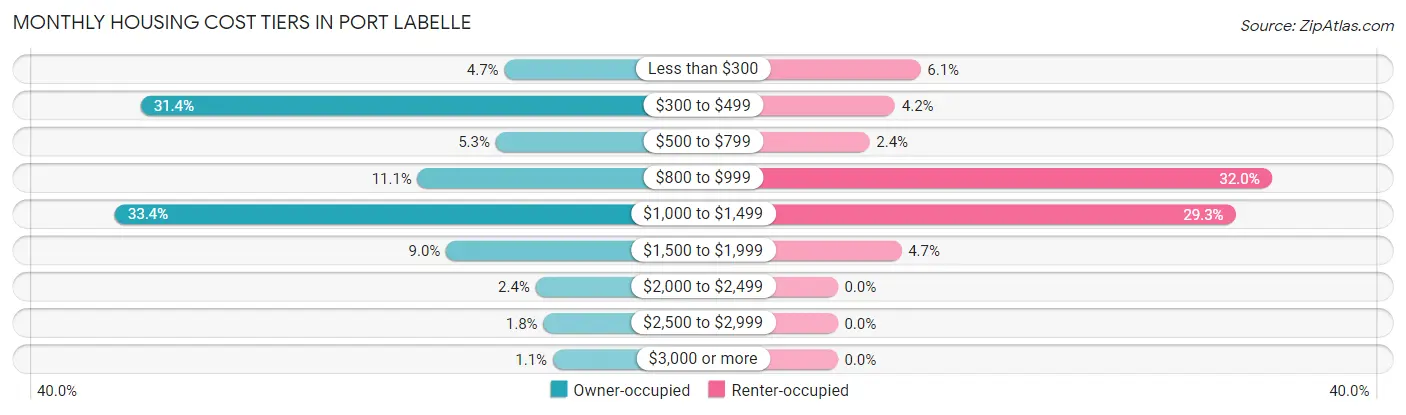
| Monthly Cost | Owner-occupied | Renter-occupied |
| Less than $300 | 73 (4.7%) | 39 (6.1%) |
| $300 to $499 | 492 (31.4%) | 27 (4.2%) |
| $500 to $799 | 83 (5.3%) | 15 (2.4%) |
| $800 to $999 | 173 (11.1%) | 204 (32.0%) |
| $1,000 to $1,499 | 522 (33.4%) | 187 (29.3%) |
| $1,500 to $1,999 | 140 (8.9%) | 30 (4.7%) |
| $2,000 to $2,499 | 37 (2.4%) | 0 (0.0%) |
| $2,500 to $2,999 | 28 (1.8%) | 0 (0.0%) |
| $3,000 or more | 17 (1.1%) | 0 (0.0%) |
| Total | 1,565 (100.0%) | 638 (100.0%) |
Physical Housing Characteristics in Port LaBelle
Housing Structures in Port LaBelle
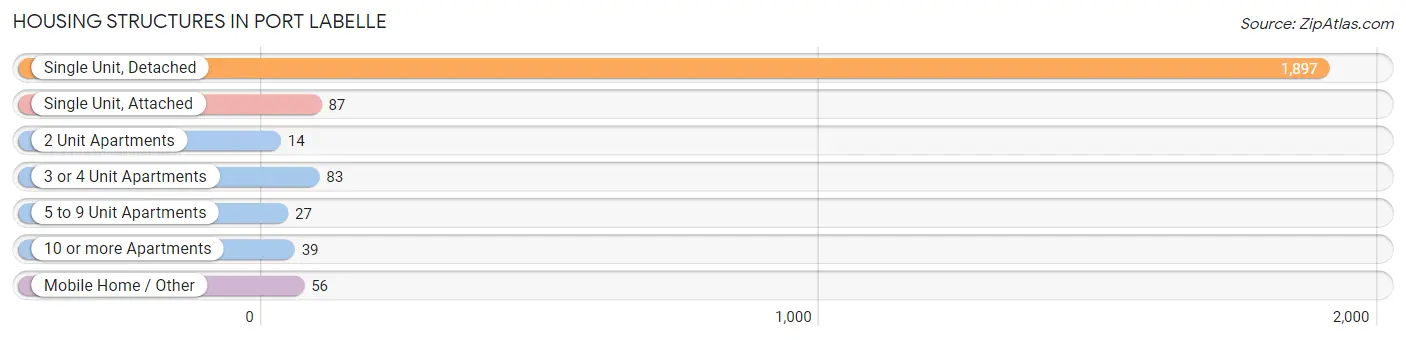
| Structure Type | # Housing Units | % Housing Units |
| Single Unit, Detached | 1,897 | 86.1% |
| Single Unit, Attached | 87 | 4.0% |
| 2 Unit Apartments | 14 | 0.6% |
| 3 or 4 Unit Apartments | 83 | 3.8% |
| 5 to 9 Unit Apartments | 27 | 1.2% |
| 10 or more Apartments | 39 | 1.8% |
| Mobile Home / Other | 56 | 2.5% |
| Total | 2,203 | 100.0% |
Housing Structures by Occupancy in Port LaBelle
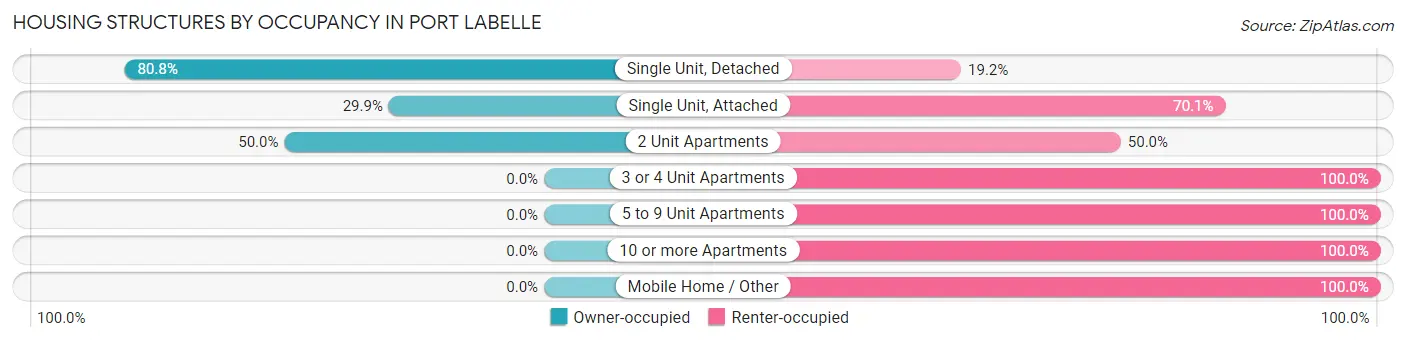
| Structure Type | Owner-occupied | Renter-occupied |
| Single Unit, Detached | 1,532 (80.8%) | 365 (19.2%) |
| Single Unit, Attached | 26 (29.9%) | 61 (70.1%) |
| 2 Unit Apartments | 7 (50.0%) | 7 (50.0%) |
| 3 or 4 Unit Apartments | 0 (0.0%) | 83 (100.0%) |
| 5 to 9 Unit Apartments | 0 (0.0%) | 27 (100.0%) |
| 10 or more Apartments | 0 (0.0%) | 39 (100.0%) |
| Mobile Home / Other | 0 (0.0%) | 56 (100.0%) |
| Total | 1,565 (71.0%) | 638 (29.0%) |
Housing Structures by Number of Rooms in Port LaBelle
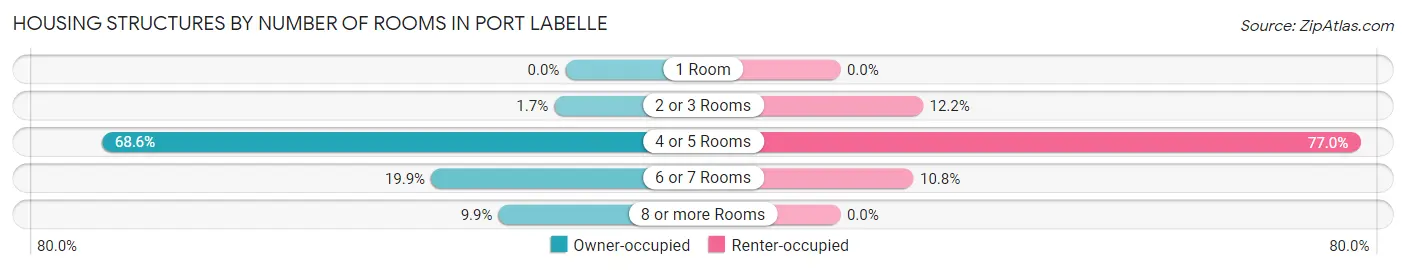
| Number of Rooms | Owner-occupied | Renter-occupied |
| 1 Room | 0 (0.0%) | 0 (0.0%) |
| 2 or 3 Rooms | 26 (1.7%) | 78 (12.2%) |
| 4 or 5 Rooms | 1,073 (68.6%) | 491 (77.0%) |
| 6 or 7 Rooms | 311 (19.9%) | 69 (10.8%) |
| 8 or more Rooms | 155 (9.9%) | 0 (0.0%) |
| Total | 1,565 (100.0%) | 638 (100.0%) |
Housing Structure by Heating Type in Port LaBelle
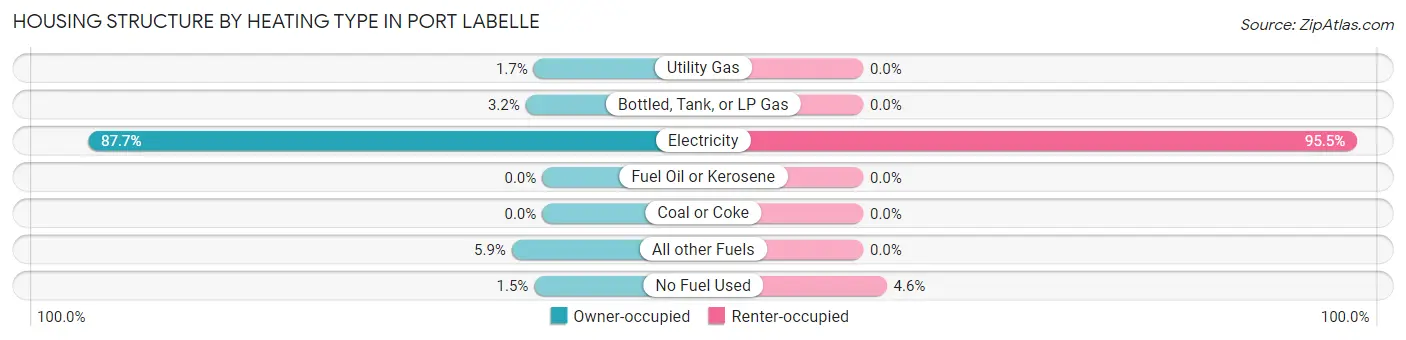
| Heating Type | Owner-occupied | Renter-occupied |
| Utility Gas | 26 (1.7%) | 0 (0.0%) |
| Bottled, Tank, or LP Gas | 50 (3.2%) | 0 (0.0%) |
| Electricity | 1,373 (87.7%) | 609 (95.5%) |
| Fuel Oil or Kerosene | 0 (0.0%) | 0 (0.0%) |
| Coal or Coke | 0 (0.0%) | 0 (0.0%) |
| All other Fuels | 92 (5.9%) | 0 (0.0%) |
| No Fuel Used | 24 (1.5%) | 29 (4.5%) |
| Total | 1,565 (100.0%) | 638 (100.0%) |
Household Vehicle Usage in Port LaBelle
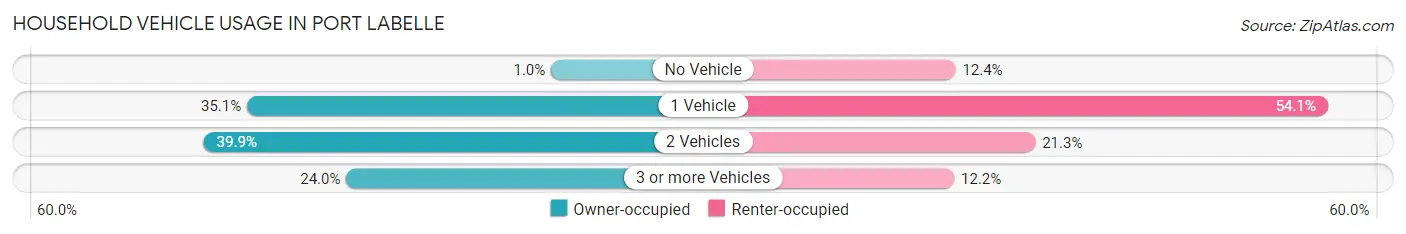
| Vehicles per Household | Owner-occupied | Renter-occupied |
| No Vehicle | 16 (1.0%) | 79 (12.4%) |
| 1 Vehicle | 549 (35.1%) | 345 (54.1%) |
| 2 Vehicles | 625 (39.9%) | 136 (21.3%) |
| 3 or more Vehicles | 375 (24.0%) | 78 (12.2%) |
| Total | 1,565 (100.0%) | 638 (100.0%) |
Real Estate & Mortgages in Port LaBelle
Real Estate and Mortgage Overview in Port LaBelle
| Characteristic | Without Mortgage | With Mortgage |
| Housing Units | 594 | 971 |
| Median Property Value | $163,600 | $161,800 |
| Median Household Income | $36,710 | $111 |
| Monthly Housing Costs | $368 | $17 |
| Real Estate Taxes | $1,322 | $16 |
Property Value by Mortgage Status in Port LaBelle
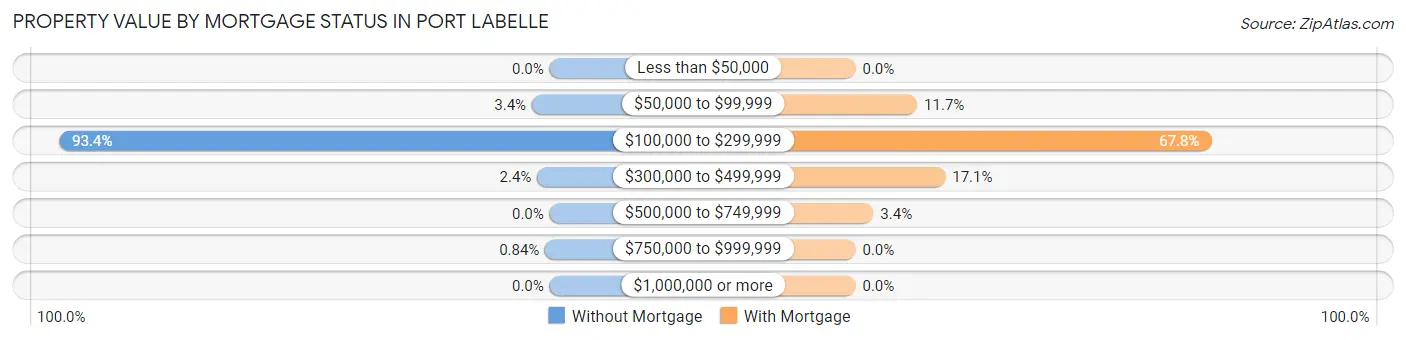
| Property Value | Without Mortgage | With Mortgage |
| Less than $50,000 | 0 (0.0%) | 0 (0.0%) |
| $50,000 to $99,999 | 20 (3.4%) | 114 (11.7%) |
| $100,000 to $299,999 | 555 (93.4%) | 658 (67.8%) |
| $300,000 to $499,999 | 14 (2.4%) | 166 (17.1%) |
| $500,000 to $749,999 | 0 (0.0%) | 33 (3.4%) |
| $750,000 to $999,999 | 5 (0.8%) | 0 (0.0%) |
| $1,000,000 or more | 0 (0.0%) | 0 (0.0%) |
| Total | 594 (100.0%) | 971 (100.0%) |
Household Income by Mortgage Status in Port LaBelle
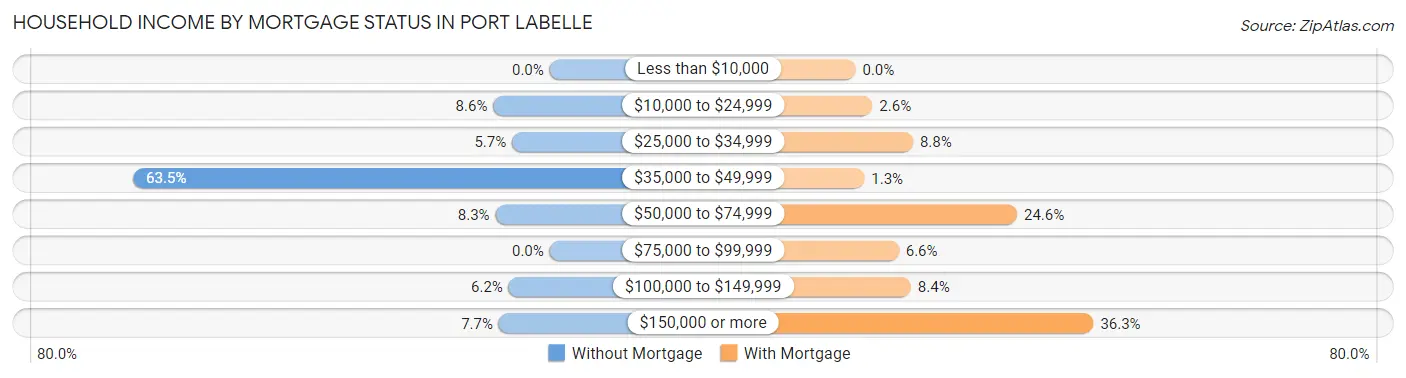
| Household Income | Without Mortgage | With Mortgage |
| Less than $10,000 | 0 (0.0%) | 0 (0.0%) |
| $10,000 to $24,999 | 51 (8.6%) | 25 (2.6%) |
| $25,000 to $34,999 | 34 (5.7%) | 85 (8.7%) |
| $35,000 to $49,999 | 377 (63.5%) | 13 (1.3%) |
| $50,000 to $74,999 | 49 (8.3%) | 239 (24.6%) |
| $75,000 to $99,999 | 0 (0.0%) | 64 (6.6%) |
| $100,000 to $149,999 | 37 (6.2%) | 82 (8.4%) |
| $150,000 or more | 46 (7.7%) | 352 (36.2%) |
| Total | 594 (100.0%) | 971 (100.0%) |
Property Value to Household Income Ratio in Port LaBelle
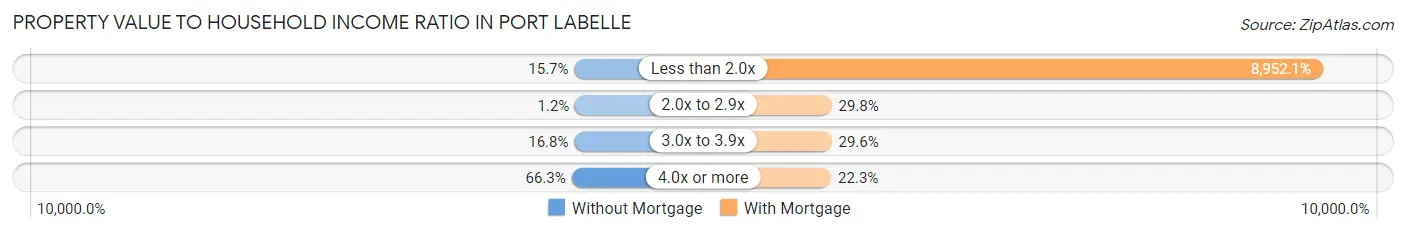
| Value-to-Income Ratio | Without Mortgage | With Mortgage |
| Less than 2.0x | 93 (15.7%) | 86,925 (8,952.1%) |
| 2.0x to 2.9x | 7 (1.2%) | 289 (29.8%) |
| 3.0x to 3.9x | 100 (16.8%) | 287 (29.6%) |
| 4.0x or more | 394 (66.3%) | 216 (22.3%) |
| Total | 594 (100.0%) | 971 (100.0%) |
Real Estate Taxes by Mortgage Status in Port LaBelle
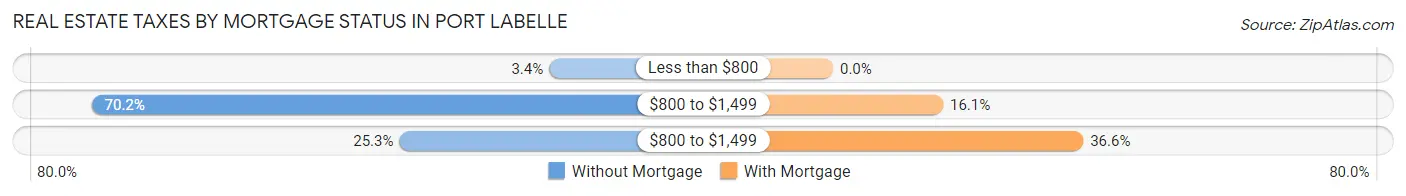
| Property Taxes | Without Mortgage | With Mortgage |
| Less than $800 | 20 (3.4%) | 0 (0.0%) |
| $800 to $1,499 | 417 (70.2%) | 156 (16.1%) |
| $800 to $1,499 | 150 (25.3%) | 355 (36.6%) |
| Total | 594 (100.0%) | 971 (100.0%) |
Health & Disability in Port LaBelle
Health Insurance Coverage by Age in Port LaBelle
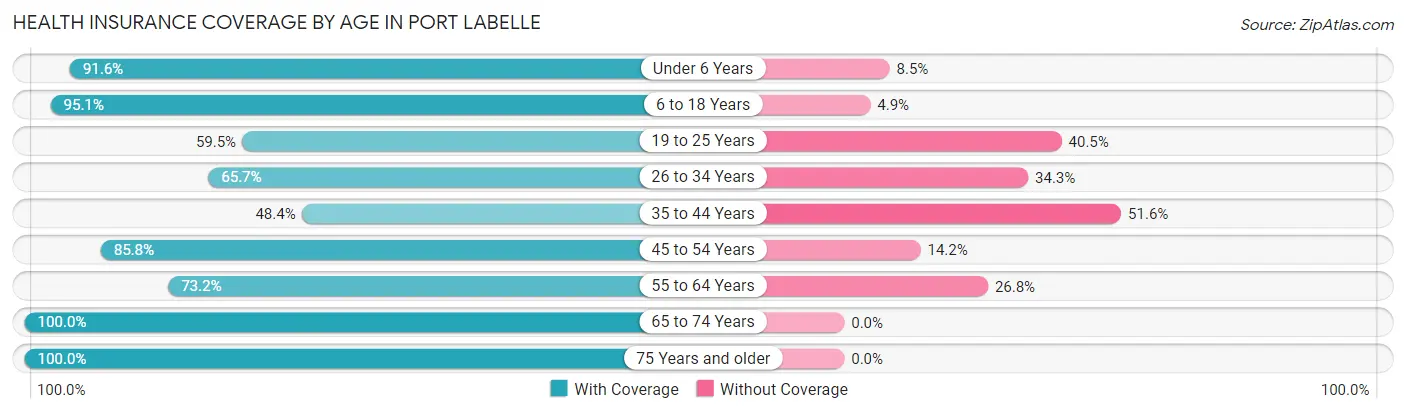
| Age Bracket | With Coverage | Without Coverage |
| Under 6 Years | 401 (91.5%) | 37 (8.5%) |
| 6 to 18 Years | 1,174 (95.1%) | 60 (4.9%) |
| 19 to 25 Years | 380 (59.5%) | 259 (40.5%) |
| 26 to 34 Years | 623 (65.7%) | 325 (34.3%) |
| 35 to 44 Years | 416 (48.4%) | 444 (51.6%) |
| 45 to 54 Years | 766 (85.8%) | 127 (14.2%) |
| 55 to 64 Years | 317 (73.2%) | 116 (26.8%) |
| 65 to 74 Years | 208 (100.0%) | 0 (0.0%) |
| 75 Years and older | 205 (100.0%) | 0 (0.0%) |
| Total | 4,490 (76.6%) | 1,368 (23.4%) |
Health Insurance Coverage by Citizenship Status in Port LaBelle
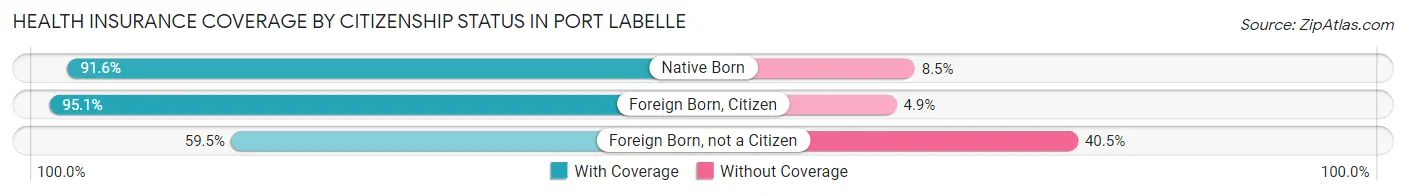
| Citizenship Status | With Coverage | Without Coverage |
| Native Born | 401 (91.5%) | 37 (8.5%) |
| Foreign Born, Citizen | 1,174 (95.1%) | 60 (4.9%) |
| Foreign Born, not a Citizen | 380 (59.5%) | 259 (40.5%) |
Health Insurance Coverage by Household Income in Port LaBelle
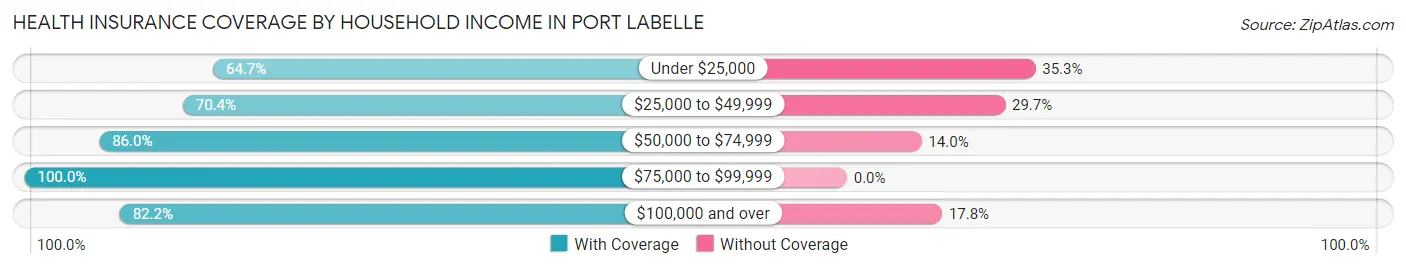
| Household Income | With Coverage | Without Coverage |
| Under $25,000 | 423 (64.7%) | 231 (35.3%) |
| $25,000 to $49,999 | 1,504 (70.4%) | 634 (29.6%) |
| $50,000 to $74,999 | 338 (86.0%) | 55 (14.0%) |
| $75,000 to $99,999 | 161 (100.0%) | 0 (0.0%) |
| $100,000 and over | 2,064 (82.2%) | 448 (17.8%) |
Public vs Private Health Insurance Coverage by Age in Port LaBelle
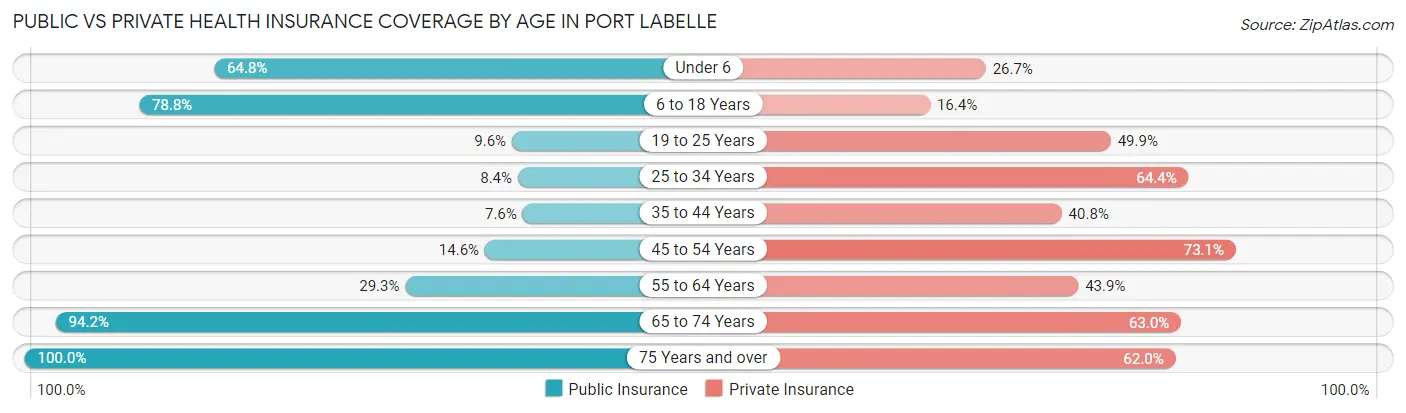
| Age Bracket | Public Insurance | Private Insurance |
| Under 6 | 284 (64.8%) | 117 (26.7%) |
| 6 to 18 Years | 972 (78.8%) | 202 (16.4%) |
| 19 to 25 Years | 61 (9.6%) | 319 (49.9%) |
| 25 to 34 Years | 80 (8.4%) | 610 (64.3%) |
| 35 to 44 Years | 65 (7.6%) | 351 (40.8%) |
| 45 to 54 Years | 130 (14.6%) | 653 (73.1%) |
| 55 to 64 Years | 127 (29.3%) | 190 (43.9%) |
| 65 to 74 Years | 196 (94.2%) | 131 (63.0%) |
| 75 Years and over | 205 (100.0%) | 127 (62.0%) |
| Total | 2,120 (36.2%) | 2,700 (46.1%) |
Disability Status by Sex by Age in Port LaBelle
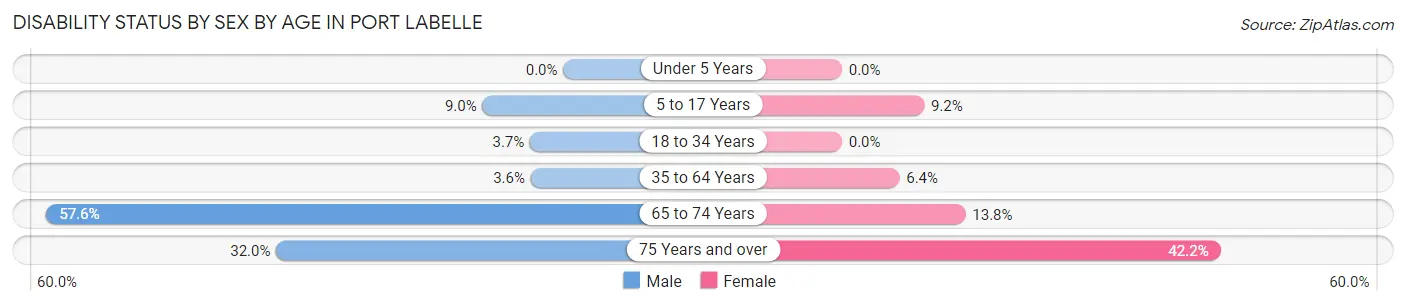
| Age Bracket | Male | Female |
| Under 5 Years | 0 (0.0%) | 0 (0.0%) |
| 5 to 17 Years | 47 (9.0%) | 57 (9.2%) |
| 18 to 34 Years | 36 (3.7%) | 0 (0.0%) |
| 35 to 64 Years | 47 (3.6%) | 57 (6.4%) |
| 65 to 74 Years | 57 (57.6%) | 15 (13.8%) |
| 75 Years and over | 39 (32.0%) | 35 (42.2%) |
Disability Class by Sex by Age in Port LaBelle
Disability Class: Hearing Difficulty
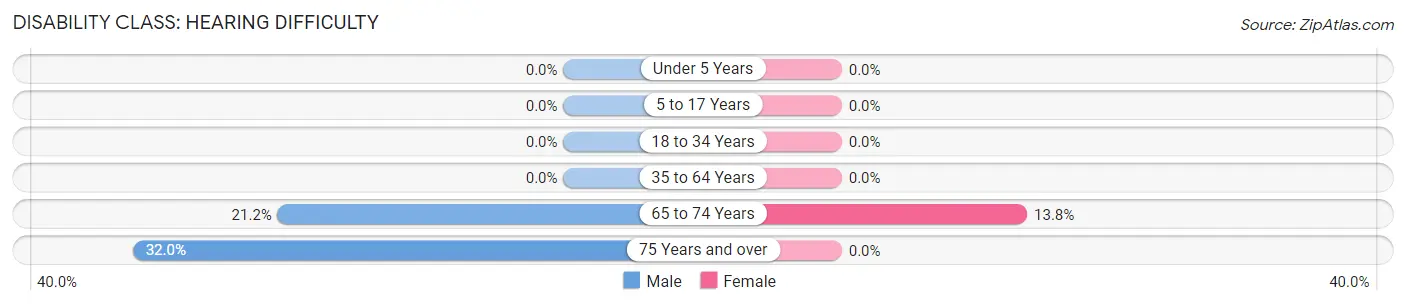
| Age Bracket | Male | Female |
| Under 5 Years | 0 (0.0%) | 0 (0.0%) |
| 5 to 17 Years | 0 (0.0%) | 0 (0.0%) |
| 18 to 34 Years | 0 (0.0%) | 0 (0.0%) |
| 35 to 64 Years | 0 (0.0%) | 0 (0.0%) |
| 65 to 74 Years | 21 (21.2%) | 15 (13.8%) |
| 75 Years and over | 39 (32.0%) | 0 (0.0%) |
Disability Class: Vision Difficulty
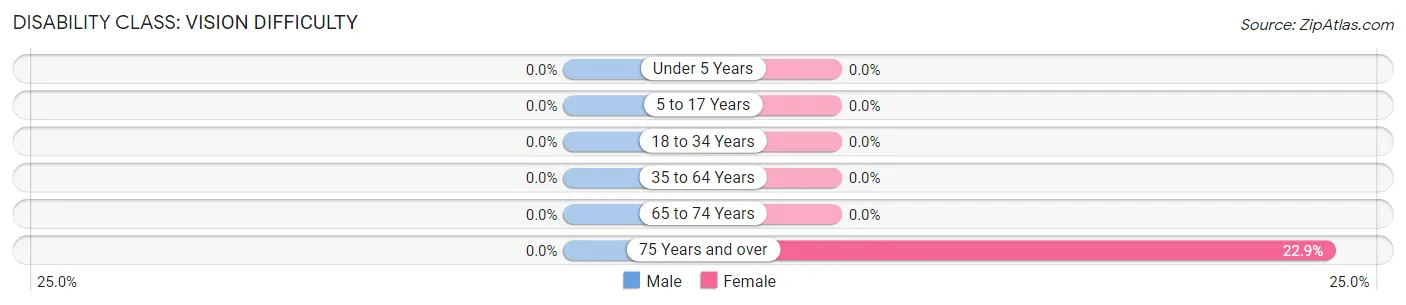
| Age Bracket | Male | Female |
| Under 5 Years | 0 (0.0%) | 0 (0.0%) |
| 5 to 17 Years | 0 (0.0%) | 0 (0.0%) |
| 18 to 34 Years | 0 (0.0%) | 0 (0.0%) |
| 35 to 64 Years | 0 (0.0%) | 0 (0.0%) |
| 65 to 74 Years | 0 (0.0%) | 0 (0.0%) |
| 75 Years and over | 0 (0.0%) | 19 (22.9%) |
Disability Class: Cognitive Difficulty
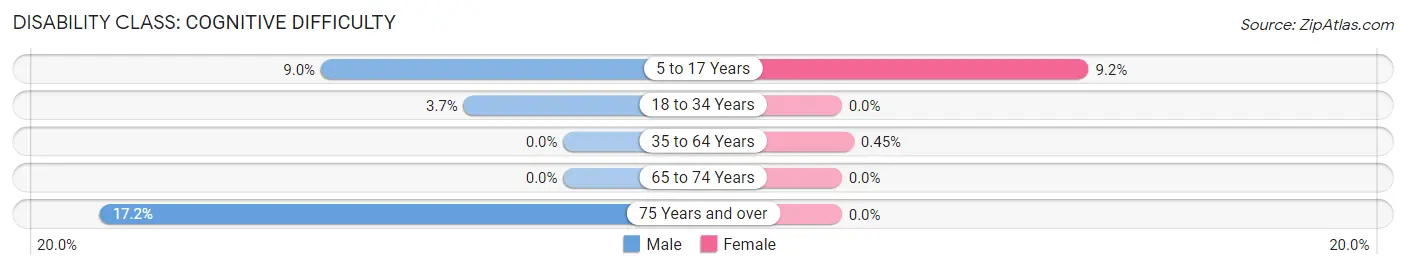
| Age Bracket | Male | Female |
| 5 to 17 Years | 47 (9.0%) | 57 (9.2%) |
| 18 to 34 Years | 36 (3.7%) | 0 (0.0%) |
| 35 to 64 Years | 0 (0.0%) | 4 (0.4%) |
| 65 to 74 Years | 0 (0.0%) | 0 (0.0%) |
| 75 Years and over | 21 (17.2%) | 0 (0.0%) |
Disability Class: Ambulatory Difficulty
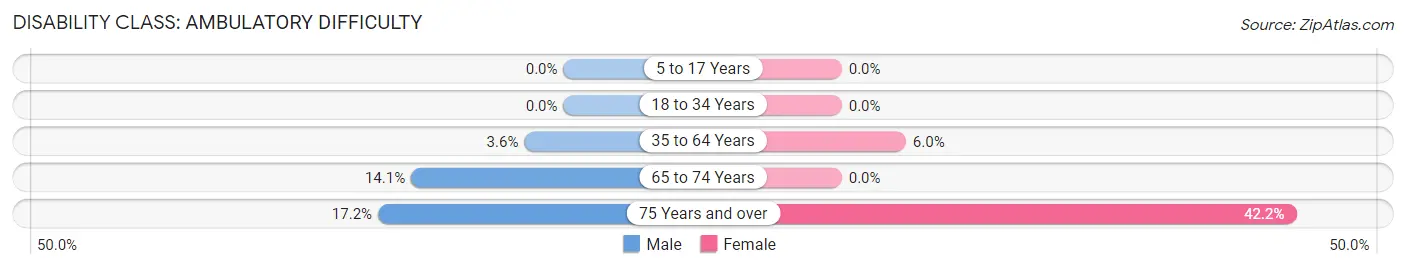
| Age Bracket | Male | Female |
| 5 to 17 Years | 0 (0.0%) | 0 (0.0%) |
| 18 to 34 Years | 0 (0.0%) | 0 (0.0%) |
| 35 to 64 Years | 47 (3.6%) | 53 (5.9%) |
| 65 to 74 Years | 14 (14.1%) | 0 (0.0%) |
| 75 Years and over | 21 (17.2%) | 35 (42.2%) |
Disability Class: Self-Care Difficulty
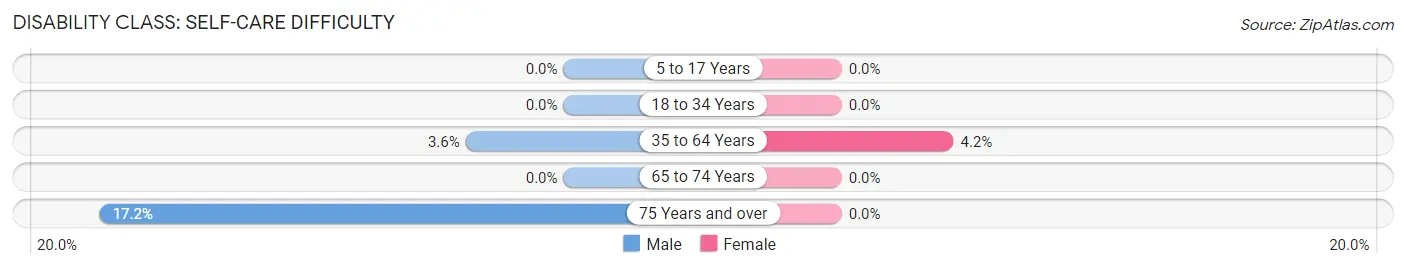
| Age Bracket | Male | Female |
| 5 to 17 Years | 0 (0.0%) | 0 (0.0%) |
| 18 to 34 Years | 0 (0.0%) | 0 (0.0%) |
| 35 to 64 Years | 47 (3.6%) | 37 (4.2%) |
| 65 to 74 Years | 0 (0.0%) | 0 (0.0%) |
| 75 Years and over | 21 (17.2%) | 0 (0.0%) |
Technology Access in Port LaBelle
Computing Device Access in Port LaBelle
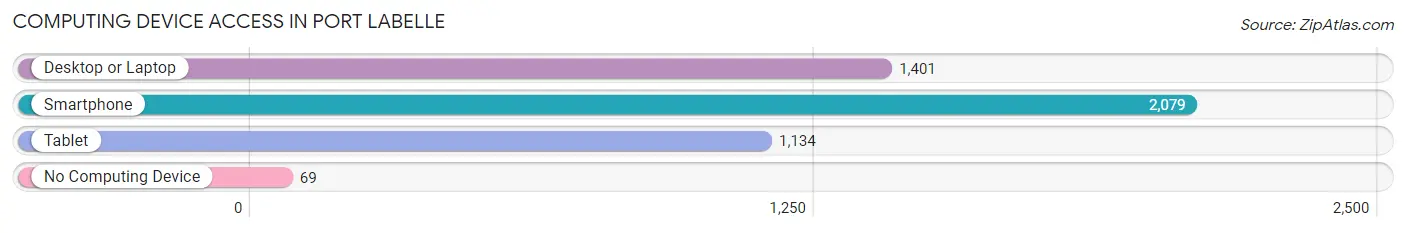
| Device Type | # Households | % Households |
| Desktop or Laptop | 1,401 | 63.6% |
| Smartphone | 2,079 | 94.4% |
| Tablet | 1,134 | 51.5% |
| No Computing Device | 69 | 3.1% |
| Total | 2,203 | 100.0% |
Internet Access in Port LaBelle
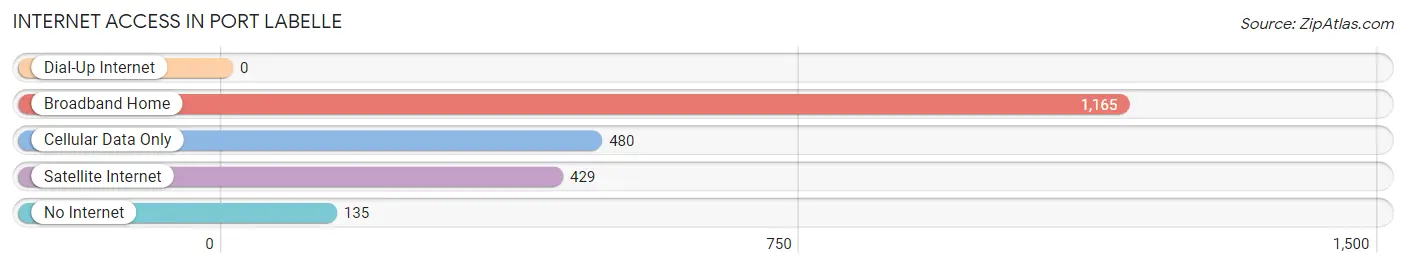
| Internet Type | # Households | % Households |
| Dial-Up Internet | 0 | 0.0% |
| Broadband Home | 1,165 | 52.9% |
| Cellular Data Only | 480 | 21.8% |
| Satellite Internet | 429 | 19.5% |
| No Internet | 135 | 6.1% |
| Total | 2,203 | 100.0% |
Port LaBelle Summary
Labelle, Florida is a small town located in Hendry County, in the southwestern part of the state. It is situated on the banks of the Caloosahatchee River, about 25 miles east of Fort Myers. The town was founded in the late 19th century and has a population of about 5,000 people.
History
Labelle was founded in 1883 by Captain Francis A. Hendry, a former Confederate soldier. He named the town after his daughter, Belle. The town was originally a trading post and a stop on the Florida East Coast Railway. In the early 1900s, the town began to grow as a center for the citrus industry. The town was incorporated in 1911 and by the 1920s, it had become a major citrus-producing center.
In the 1950s, the town began to experience a decline in the citrus industry due to freezes and disease. This led to a shift in the economy towards tourism and agriculture. The town was also home to a large sugar mill, which closed in the 1980s.
Geography
Labelle is located in the southwestern part of Florida, about 25 miles east of Fort Myers. The town is situated on the banks of the Caloosahatchee River. The town is surrounded by the Big Cypress National Preserve and the Fisheating Creek Wildlife Management Area. The town is also close to Lake Okeechobee, the largest lake in the state.
The town has a humid subtropical climate, with hot, humid summers and mild winters. The average temperature in the summer is around 90°F and the average temperature in the winter is around 60°F.
Economy
The economy of Labelle is largely based on agriculture and tourism. The town is home to several citrus groves and is a major producer of oranges, grapefruit, and tangerines. The town is also home to several nurseries and greenhouses.
The town is also a popular tourist destination, with several attractions such as the Caloosahatchee River, the Big Cypress National Preserve, and the Fisheating Creek Wildlife Management Area. The town is also home to several restaurants, shops, and hotels.
Demographics
As of the 2010 census, the population of Labelle was 5,285. The racial makeup of the town was 79.3% White, 15.2% African American, 0.5% Native American, 0.7% Asian, 0.1% Pacific Islander, and 4.2% from other races. The median household income was $30,938 and the median family income was $37,917.
The town is home to several churches, including the First Baptist Church of Labelle, the First United Methodist Church of Labelle, and the Church of Jesus Christ of Latter-day Saints. The town is also home to several schools, including Labelle High School, Labelle Middle School, and Labelle Elementary School.
Common Questions
What is Per Capita Income in Port LaBelle?
Per Capita income in Port LaBelle is $29,569.
What is the Median Family Income in Port LaBelle?
Median Family Income in Port LaBelle is $46,535.
What is the Median Household income in Port LaBelle?
Median Household Income in Port LaBelle is $40,250.
What is Income or Wage Gap in Port LaBelle?
Income or Wage Gap in Port LaBelle is 33.6%.
Women in Port LaBelle earn 66.4 cents for every dollar earned by a man.
What is Inequality or Gini Index in Port LaBelle?
Inequality or Gini Index in Port LaBelle is 0.46.
What is the Total Population of Port LaBelle?
Total Population of Port LaBelle is 5,858.
What is the Total Male Population of Port LaBelle?
Total Male Population of Port LaBelle is 3,278.
What is the Total Female Population of Port LaBelle?
Total Female Population of Port LaBelle is 2,580.
What is the Ratio of Males per 100 Females in Port LaBelle?
There are 127.05 Males per 100 Females in Port LaBelle.
What is the Ratio of Females per 100 Males in Port LaBelle?
There are 78.71 Females per 100 Males in Port LaBelle.
What is the Median Population Age in Port LaBelle?
Median Population Age in Port LaBelle is 31.0 Years.
What is the Average Family Size in Port LaBelle
Average Family Size in Port LaBelle is 3.3 People.
What is the Average Household Size in Port LaBelle
Average Household Size in Port LaBelle is 2.7 People.
How Large is the Labor Force in Port LaBelle?
There are 3,377 People in the Labor Forcein in Port LaBelle.
What is the Percentage of People in the Labor Force in Port LaBelle?
74.1% of People are in the Labor Force in Port LaBelle.
What is the Unemployment Rate in Port LaBelle?
Unemployment Rate in Port LaBelle is 7.9%.