Jupiter Island, FL Map & Demographics
Jupiter Island Map
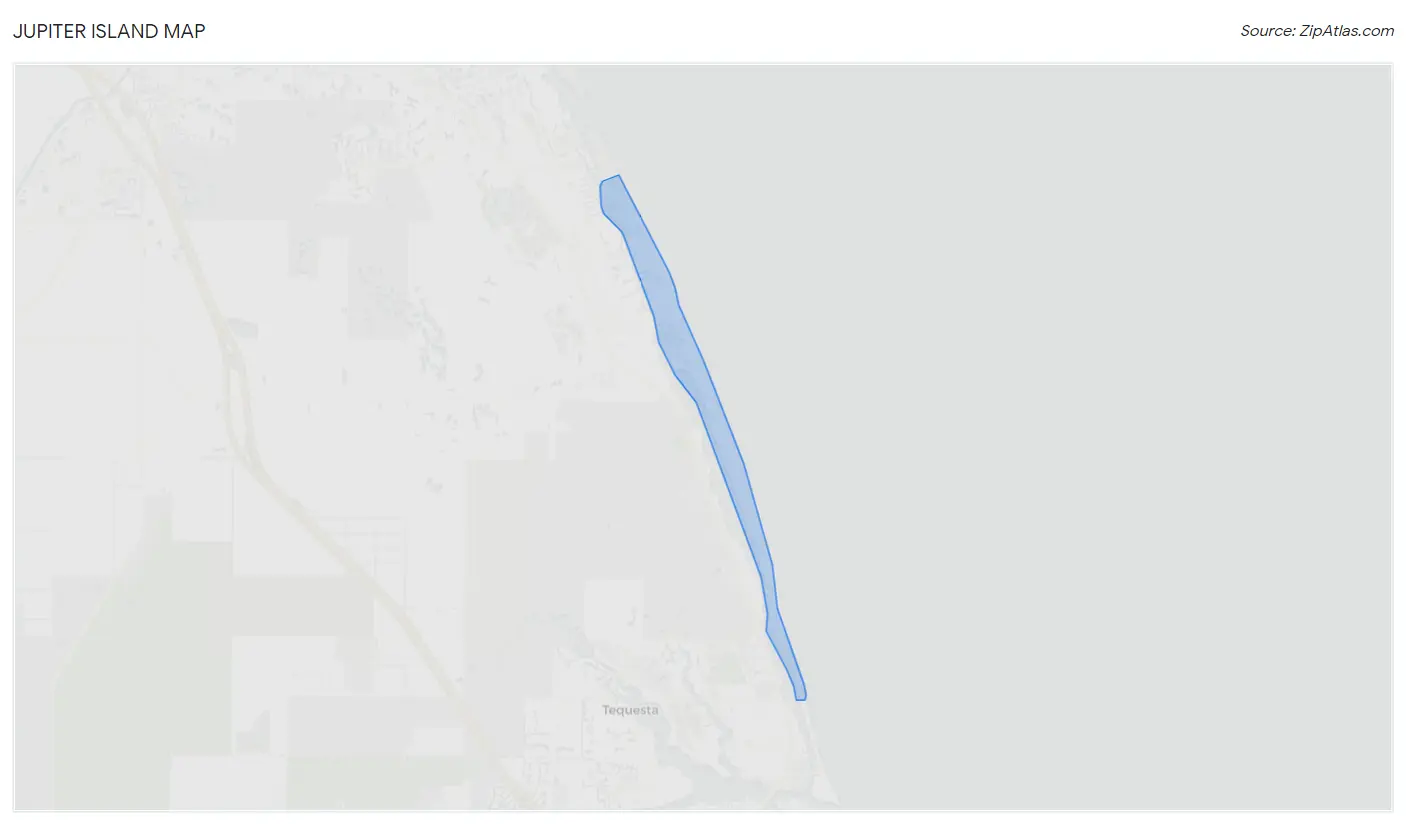
Jupiter Island Overview
$201,240
PER CAPITA INCOME
$247,857
AVG FAMILY INCOME
$235,500
AVG HOUSEHOLD INCOME
78.2%
WAGE / INCOME GAP [ % ]
21.8¢/ $1
WAGE / INCOME GAP [ $ ]
0.58
INEQUALITY / GINI INDEX
866
TOTAL POPULATION
415
MALE POPULATION
451
FEMALE POPULATION
92.02
MALES / 100 FEMALES
108.67
FEMALES / 100 MALES
61.8
MEDIAN AGE
2.3
AVG FAMILY SIZE
2.0
AVG HOUSEHOLD SIZE
321
LABOR FORCE [ PEOPLE ]
39.2%
PERCENT IN LABOR FORCE
28.3%
UNEMPLOYMENT RATE
Jupiter Island Area Codes
Income in Jupiter Island
Income Overview in Jupiter Island
Per Capita Income in Jupiter Island is $201,240, while median incomes of families and households are $247,857 and $235,500 respectively.
| Characteristic | Number | Measure |
| Per Capita Income | 866 | $201,240 |
| Median Family Income | 228 | $247,857 |
| Mean Family Income | 228 | $562,417 |
| Median Household Income | 342 | $235,500 |
| Mean Household Income | 342 | $497,536 |
| Income Deficit | 228 | $0 |
| Wage / Income Gap (%) | 866 | 78.24% |
| Wage / Income Gap ($) | 866 | 21.76¢ per $1 |
| Gini / Inequality Index | 866 | 0.58 |
Earnings by Sex in Jupiter Island
Average Earnings in Jupiter Island are $34,688, $84,107 for men and $18,300 for women, a difference of 78.2%.
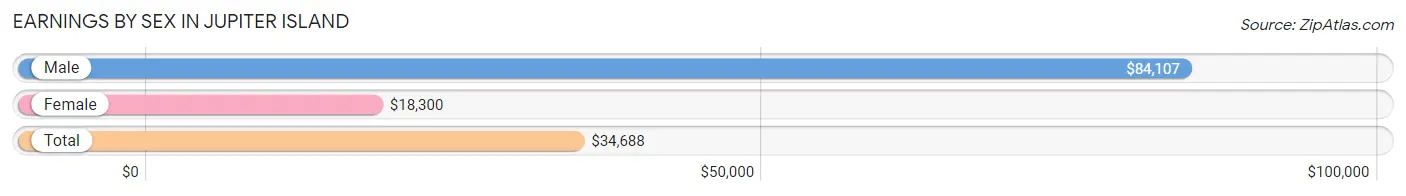
| Sex | Number | Average Earnings |
| Male | 129 (49.4%) | $84,107 |
| Female | 132 (50.6%) | $18,300 |
| Total | 261 (100.0%) | $34,688 |
Earnings by Sex by Income Bracket in Jupiter Island
The most common earnings brackets in Jupiter Island are $100,000+ for men (58 | 45.0%) and $2,499 or less for women (25 | 18.9%).
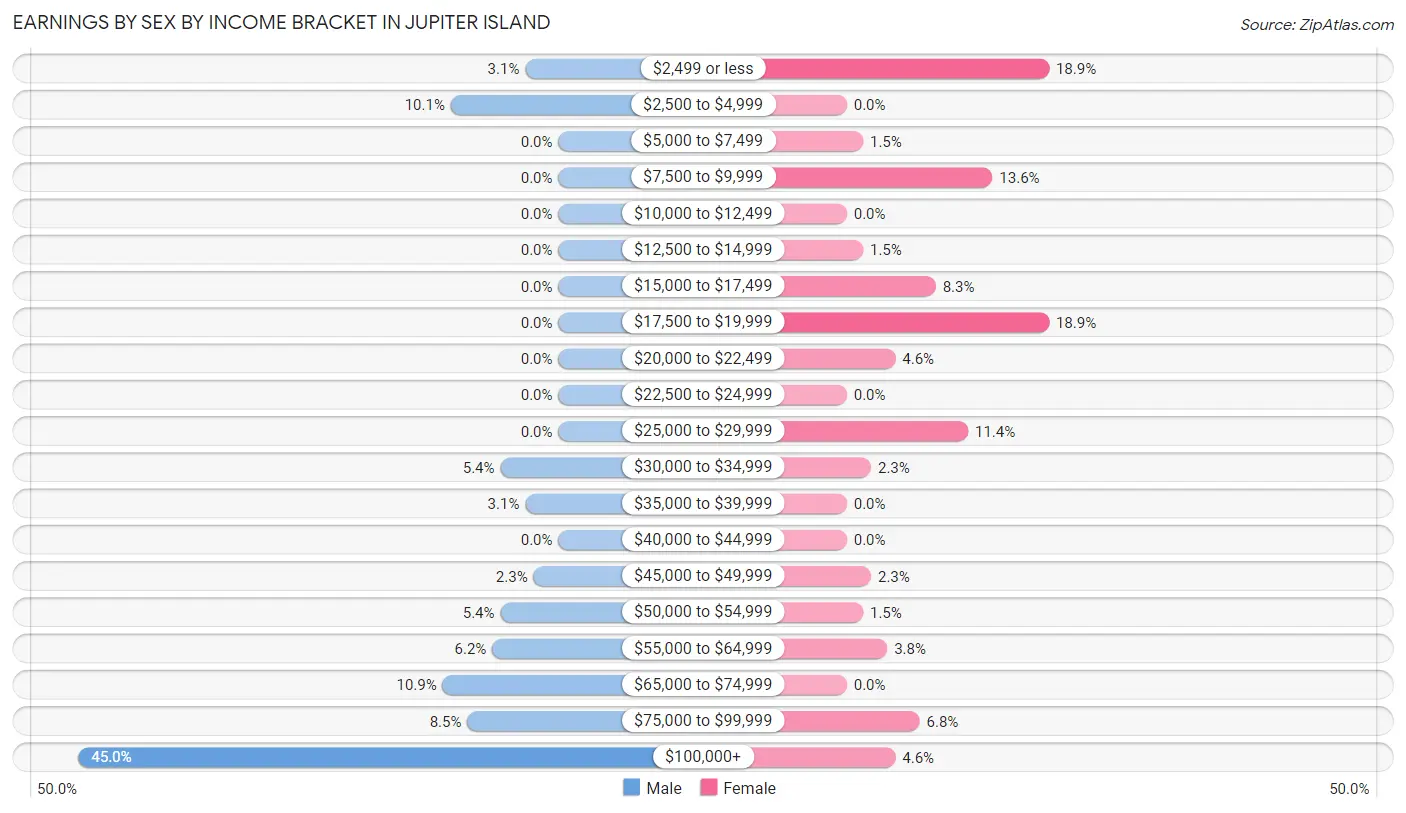
| Income | Male | Female |
| $2,499 or less | 4 (3.1%) | 25 (18.9%) |
| $2,500 to $4,999 | 13 (10.1%) | 0 (0.0%) |
| $5,000 to $7,499 | 0 (0.0%) | 2 (1.5%) |
| $7,500 to $9,999 | 0 (0.0%) | 18 (13.6%) |
| $10,000 to $12,499 | 0 (0.0%) | 0 (0.0%) |
| $12,500 to $14,999 | 0 (0.0%) | 2 (1.5%) |
| $15,000 to $17,499 | 0 (0.0%) | 11 (8.3%) |
| $17,500 to $19,999 | 0 (0.0%) | 25 (18.9%) |
| $20,000 to $22,499 | 0 (0.0%) | 6 (4.5%) |
| $22,500 to $24,999 | 0 (0.0%) | 0 (0.0%) |
| $25,000 to $29,999 | 0 (0.0%) | 15 (11.4%) |
| $30,000 to $34,999 | 7 (5.4%) | 3 (2.3%) |
| $35,000 to $39,999 | 4 (3.1%) | 0 (0.0%) |
| $40,000 to $44,999 | 0 (0.0%) | 0 (0.0%) |
| $45,000 to $49,999 | 3 (2.3%) | 3 (2.3%) |
| $50,000 to $54,999 | 7 (5.4%) | 2 (1.5%) |
| $55,000 to $64,999 | 8 (6.2%) | 5 (3.8%) |
| $65,000 to $74,999 | 14 (10.8%) | 0 (0.0%) |
| $75,000 to $99,999 | 11 (8.5%) | 9 (6.8%) |
| $100,000+ | 58 (45.0%) | 6 (4.5%) |
| Total | 129 (100.0%) | 132 (100.0%) |
Earnings by Sex by Educational Attainment in Jupiter Island
Average earnings in Jupiter Island are $84,821 for men and $19,083 for women, a difference of 77.5%. Men with an educational attainment of college or associate's degree enjoy the highest average annual earnings of $113,088, while those with college or associate's degree education earn the least with $113,088. Women with an educational attainment of bachelor's degree earn the most with the average annual earnings of $18,667, while those with bachelor's degree education have the smallest earnings of $18,667.
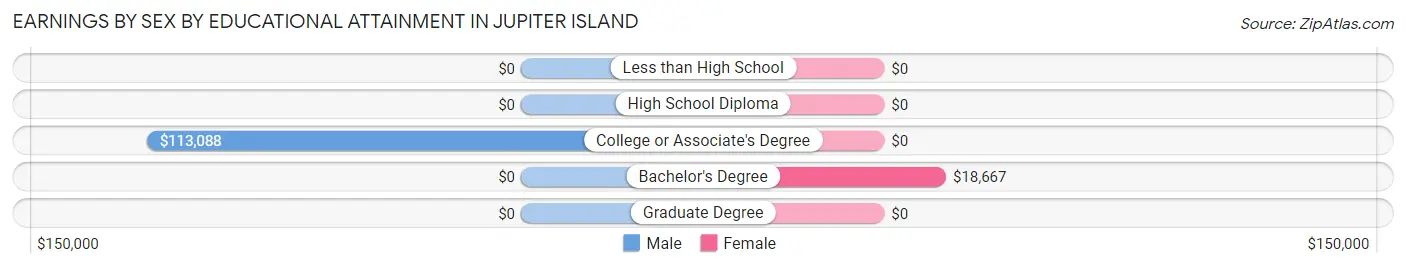
| Educational Attainment | Male Income | Female Income |
| Less than High School | - | - |
| High School Diploma | - | - |
| College or Associate's Degree | $113,088 | $0 |
| Bachelor's Degree | - | - |
| Graduate Degree | - | - |
| Total | $84,821 | $19,083 |
Family Income in Jupiter Island
Family Income Brackets in Jupiter Island
According to the Jupiter Island family income data, there are 130 families falling into the $200,000+ income range, which is the most common income bracket and makes up 57.0% of all families.
| Income Bracket | # Families | % Families |
| Less than $10,000 | 3 | 1.3% |
| $10,000 to $14,999 | 3 | 1.3% |
| $15,000 to $24,999 | 7 | 3.1% |
| $25,000 to $34,999 | 0 | 0.0% |
| $35,000 to $49,999 | 7 | 3.1% |
| $50,000 to $74,999 | 6 | 2.6% |
| $75,000 to $99,999 | 19 | 8.3% |
| $100,000 to $149,999 | 44 | 19.3% |
| $150,000 to $199,999 | 9 | 3.9% |
| $200,000+ | 130 | 57.0% |
Family Income by Famaliy Size in Jupiter Island
2-person families (196 | 86.0%) account for the highest median family income in Jupiter Island with $250,001 per family, while 2-person families (196 | 86.0%) have the highest median income of $125,000 per family member.
| Income Bracket | # Families | Median Income |
| 2-Person Families | 196 (86.0%) | $250,001 |
| 3-Person Families | 10 (4.4%) | $236,250 |
| 4-Person Families | 19 (8.3%) | $0 |
| 5-Person Families | 3 (1.3%) | $0 |
| 6-Person Families | 0 (0.0%) | $0 |
| 7+ Person Families | 0 (0.0%) | $0 |
| Total | 228 (100.0%) | $247,857 |
Family Income by Number of Earners in Jupiter Island
| Number of Earners | # Families | Median Income |
| No Earners | 127 (55.7%) | $244,063 |
| 1 Earner | 49 (21.5%) | $250,001 |
| 2 Earners | 52 (22.8%) | $131,667 |
| 3+ Earners | 0 (0.0%) | $0 |
| Total | 228 (100.0%) | $247,857 |
Household Income in Jupiter Island
Household Income Brackets in Jupiter Island
With 178 households falling in the category, the $200,000+ income range is the most frequent in Jupiter Island, accounting for 52.0% of all households. In contrast, only 3 households (0.9%) fall into the $25,000 to $34,999 income bracket, making it the least populous group.
| Income Bracket | # Households | % Households |
| Less than $10,000 | 18 | 5.3% |
| $10,000 to $14,999 | 6 | 1.8% |
| $15,000 to $24,999 | 13 | 3.8% |
| $25,000 to $34,999 | 3 | 0.9% |
| $35,000 to $49,999 | 11 | 3.2% |
| $50,000 to $74,999 | 12 | 3.5% |
| $75,000 to $99,999 | 45 | 13.2% |
| $100,000 to $149,999 | 44 | 12.9% |
| $150,000 to $199,999 | 12 | 3.5% |
| $200,000+ | 178 | 52.0% |
Household Income by Householder Age in Jupiter Island
The median household income in Jupiter Island is $235,500, with the highest median household income of $250,001 found in the 65+ years age bracket for the primary householder. A total of 235 households (68.7%) fall into this category. Meanwhile, the 15 to 24 years age bracket for the primary householder has the lowest median household income of $0, with 3 households (0.9%) in this group.
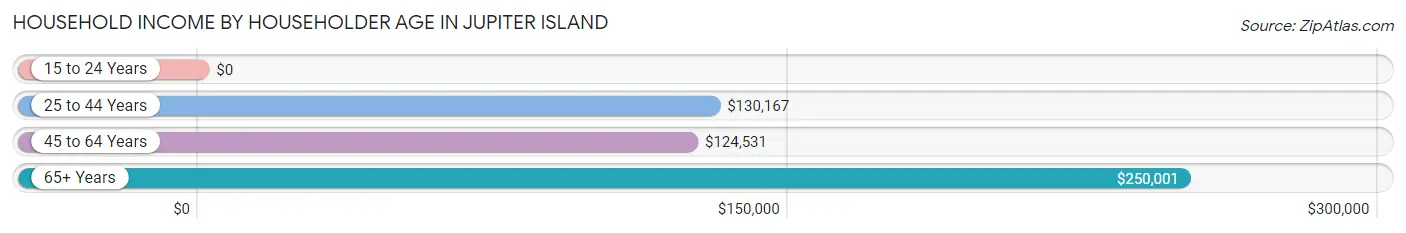
| Income Bracket | # Households | Median Income |
| 15 to 24 Years | 3 (0.9%) | $0 |
| 25 to 44 Years | 34 (9.9%) | $130,167 |
| 45 to 64 Years | 70 (20.5%) | $124,531 |
| 65+ Years | 235 (68.7%) | $250,001 |
| Total | 342 (100.0%) | $235,500 |
Poverty in Jupiter Island
Income Below Poverty by Sex and Age in Jupiter Island
With 27.8% poverty level for males and 19.3% for females among the residents of Jupiter Island, 18 to 24 year old males and 18 to 24 year old females are the most vulnerable to poverty, with 24 males (77.4%) and 21 females (100.0%) in their respective age groups living below the poverty level.
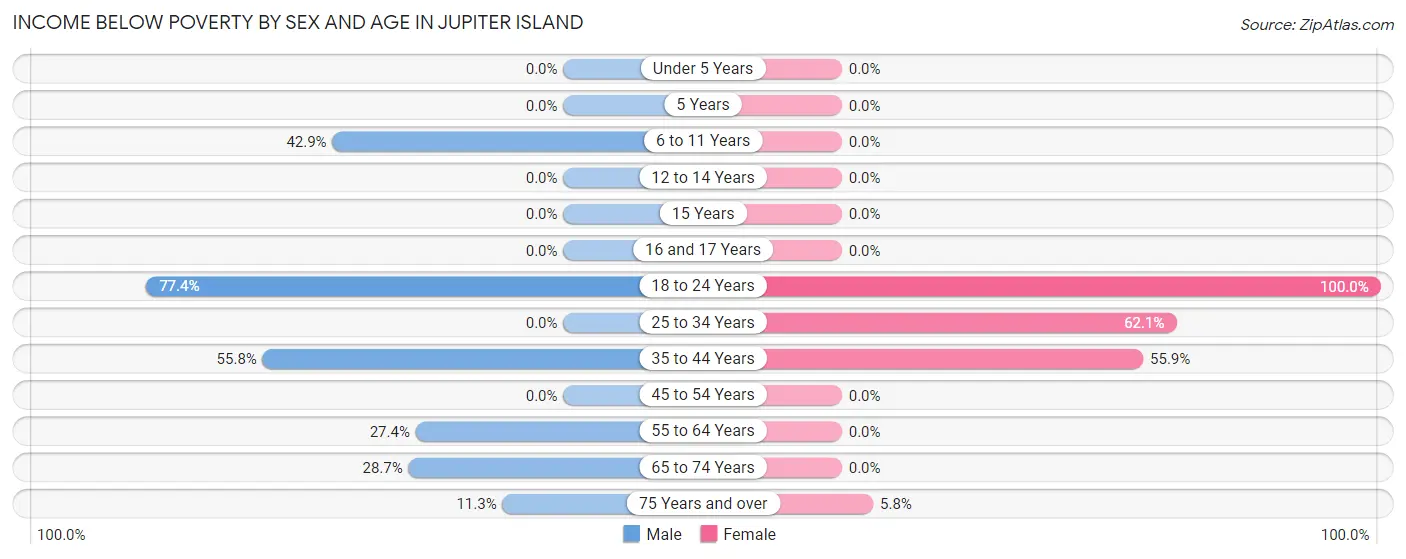
| Age Bracket | Male | Female |
| Under 5 Years | 0 (0.0%) | 0 (0.0%) |
| 5 Years | 0 (0.0%) | 0 (0.0%) |
| 6 to 11 Years | 6 (42.9%) | 0 (0.0%) |
| 12 to 14 Years | 0 (0.0%) | 0 (0.0%) |
| 15 Years | 0 (0.0%) | 0 (0.0%) |
| 16 and 17 Years | 0 (0.0%) | 0 (0.0%) |
| 18 to 24 Years | 24 (77.4%) | 21 (100.0%) |
| 25 to 34 Years | 0 (0.0%) | 18 (62.1%) |
| 35 to 44 Years | 24 (55.8%) | 33 (55.9%) |
| 45 to 54 Years | 0 (0.0%) | 0 (0.0%) |
| 55 to 64 Years | 20 (27.4%) | 0 (0.0%) |
| 65 to 74 Years | 25 (28.7%) | 0 (0.0%) |
| 75 Years and over | 13 (11.3%) | 9 (5.8%) |
| Total | 112 (27.8%) | 81 (19.3%) |
Income Above Poverty by Sex and Age in Jupiter Island
According to the poverty statistics in Jupiter Island, males aged 5 years and females aged under 5 years are the age groups that are most secure financially, with 100.0% of males and 100.0% of females in these age groups living above the poverty line.
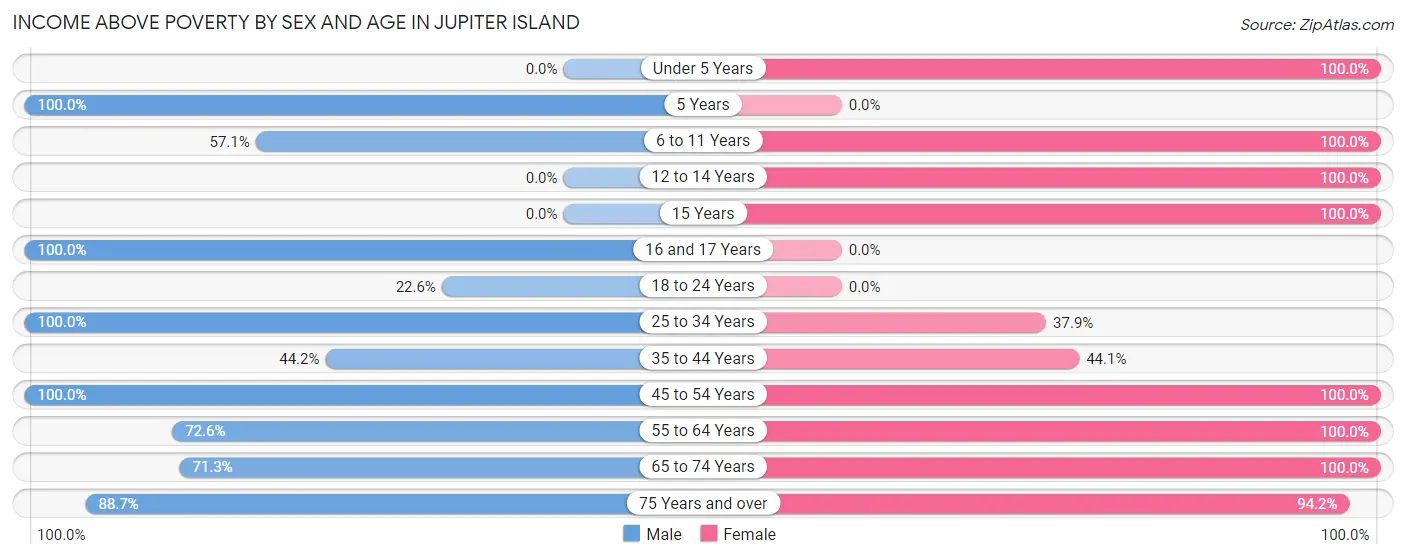
| Age Bracket | Male | Female |
| Under 5 Years | 0 (0.0%) | 4 (100.0%) |
| 5 Years | 9 (100.0%) | 0 (0.0%) |
| 6 to 11 Years | 8 (57.1%) | 8 (100.0%) |
| 12 to 14 Years | 0 (0.0%) | 7 (100.0%) |
| 15 Years | 0 (0.0%) | 5 (100.0%) |
| 16 and 17 Years | 3 (100.0%) | 0 (0.0%) |
| 18 to 24 Years | 7 (22.6%) | 0 (0.0%) |
| 25 to 34 Years | 3 (100.0%) | 11 (37.9%) |
| 35 to 44 Years | 19 (44.2%) | 26 (44.1%) |
| 45 to 54 Years | 25 (100.0%) | 34 (100.0%) |
| 55 to 64 Years | 53 (72.6%) | 53 (100.0%) |
| 65 to 74 Years | 62 (71.3%) | 44 (100.0%) |
| 75 Years and over | 102 (88.7%) | 146 (94.2%) |
| Total | 291 (72.2%) | 338 (80.7%) |
Income Below Poverty Among Married-Couple Families in Jupiter Island
The poverty statistics for married-couple families in Jupiter Island show that 2.7% or 6 of the total 220 families live below the poverty line. Families with no children have the highest poverty rate of 3.0%, comprising of 6 families. On the other hand, families with 1 or 2 children have the lowest poverty rate of 0.0%, which includes 0 families.
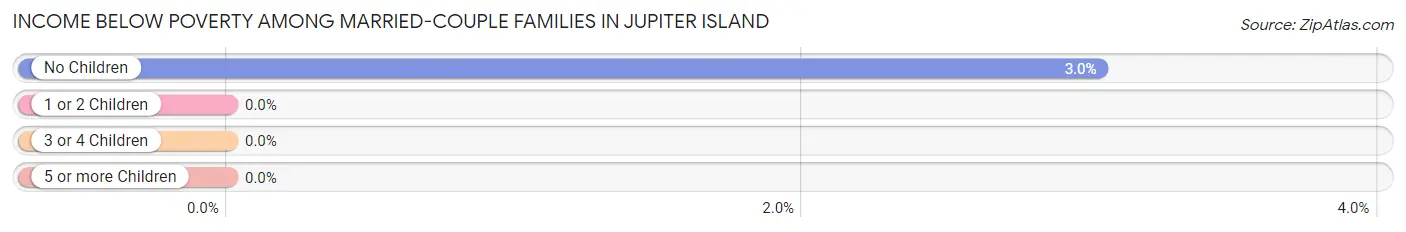
| Children | Above Poverty | Below Poverty |
| No Children | 192 (97.0%) | 6 (3.0%) |
| 1 or 2 Children | 19 (100.0%) | 0 (0.0%) |
| 3 or 4 Children | 3 (100.0%) | 0 (0.0%) |
| 5 or more Children | 0 (0.0%) | 0 (0.0%) |
| Total | 214 (97.3%) | 6 (2.7%) |
Income Below Poverty Among Single-Parent Households in Jupiter Island
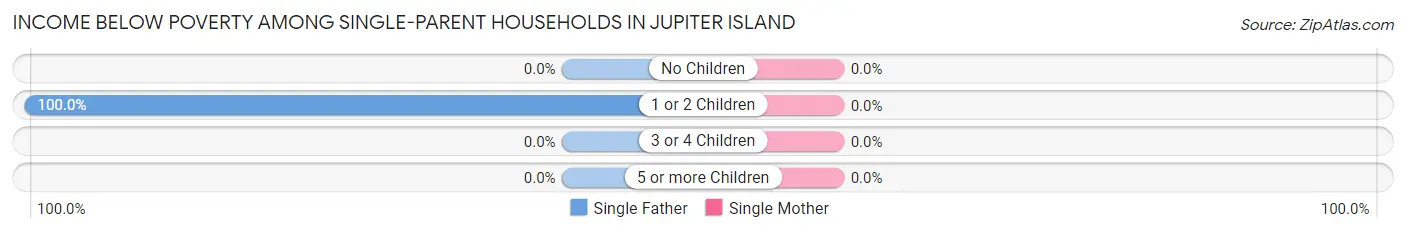
| Children | Single Father | Single Mother |
| No Children | 0 (0.0%) | 0 (0.0%) |
| 1 or 2 Children | 4 (100.0%) | 0 (0.0%) |
| 3 or 4 Children | 0 (0.0%) | 0 (0.0%) |
| 5 or more Children | 0 (0.0%) | 0 (0.0%) |
| Total | 4 (50.0%) | 0 (0.0%) |
Income Below Poverty Among Married-Couple vs Single-Parent Households in Jupiter Island
The poverty data for Jupiter Island shows that 6 of the married-couple family households (2.7%) and 4 of the single-parent households (50.0%) are living below the poverty level. Within the married-couple family households, those with no children have the highest poverty rate, with 6 households (3.0%) falling below the poverty line. Among the single-parent households, those with 1 or 2 children have the highest poverty rate, with 4 household (100.0%) living below poverty.
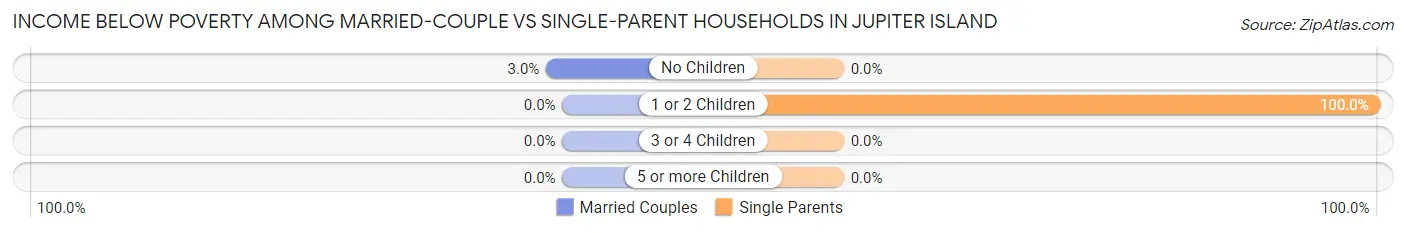
| Children | Married-Couple Families | Single-Parent Households |
| No Children | 6 (3.0%) | 0 (0.0%) |
| 1 or 2 Children | 0 (0.0%) | 4 (100.0%) |
| 3 or 4 Children | 0 (0.0%) | 0 (0.0%) |
| 5 or more Children | 0 (0.0%) | 0 (0.0%) |
| Total | 6 (2.7%) | 4 (50.0%) |
Race in Jupiter Island
The most populous races in Jupiter Island are White / Caucasian (750 | 86.6%), Black / African American (87 | 10.1%), and Hispanic or Latino (36 | 4.2%).
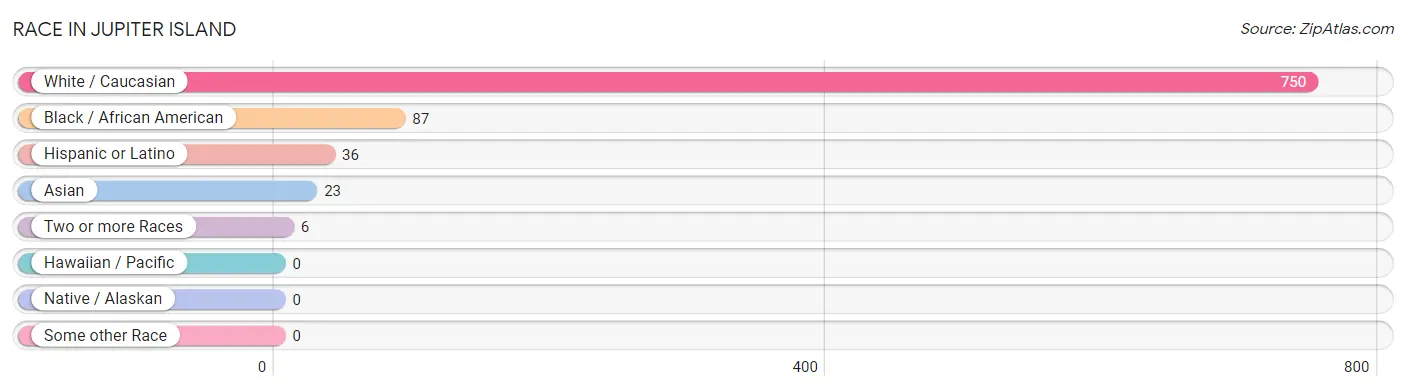
| Race | # Population | % Population |
| Asian | 23 | 2.7% |
| Black / African American | 87 | 10.1% |
| Hawaiian / Pacific | 0 | 0.0% |
| Hispanic or Latino | 36 | 4.2% |
| Native / Alaskan | 0 | 0.0% |
| White / Caucasian | 750 | 86.6% |
| Two or more Races | 6 | 0.7% |
| Some other Race | 0 | 0.0% |
| Total | 866 | 100.0% |
Ancestry in Jupiter Island
The most populous ancestries reported in Jupiter Island are English (143 | 16.5%), Irish (64 | 7.4%), Scottish (51 | 5.9%), German (50 | 5.8%), and American (40 | 4.6%), together accounting for 40.2% of all Jupiter Island residents.
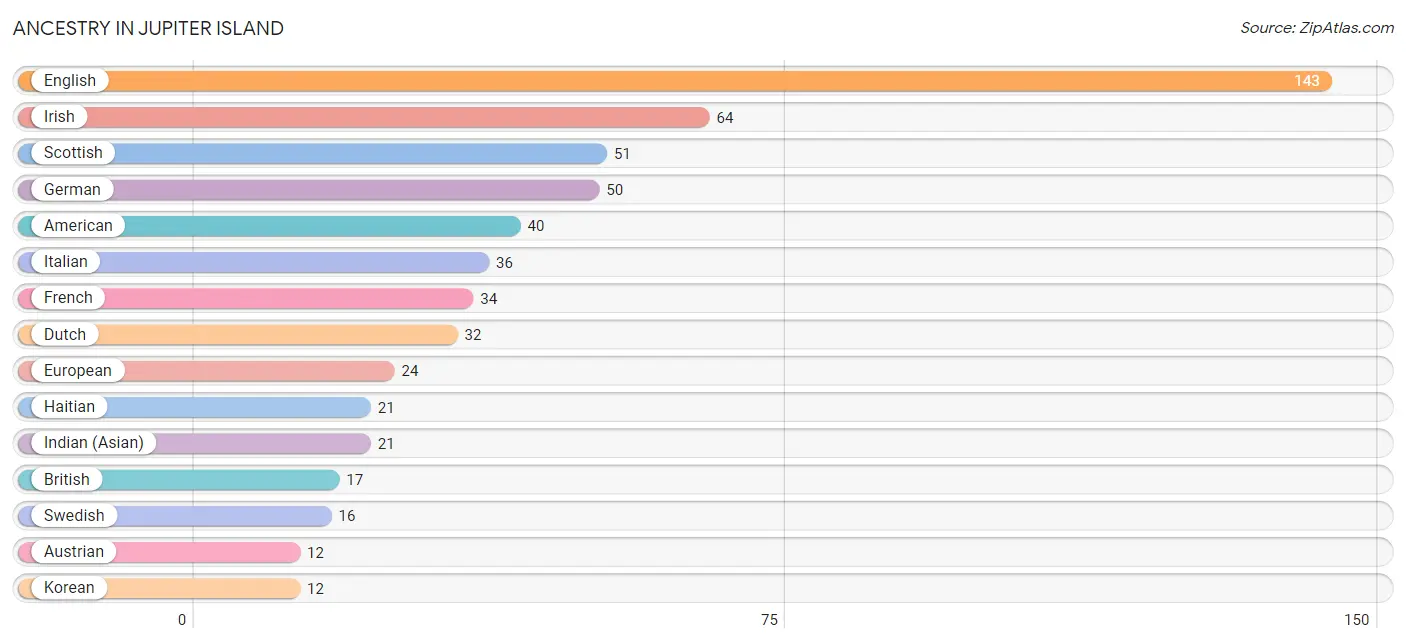
| Ancestry | # Population | % Population |
| American | 40 | 4.6% |
| Australian | 3 | 0.4% |
| Austrian | 12 | 1.4% |
| British | 17 | 2.0% |
| Central American | 4 | 0.5% |
| Danish | 8 | 0.9% |
| Dutch | 32 | 3.7% |
| English | 143 | 16.5% |
| European | 24 | 2.8% |
| French | 34 | 3.9% |
| German | 50 | 5.8% |
| Greek | 9 | 1.0% |
| Guatemalan | 4 | 0.5% |
| Haitian | 21 | 2.4% |
| Indian (Asian) | 21 | 2.4% |
| Irish | 64 | 7.4% |
| Italian | 36 | 4.2% |
| Jamaican | 11 | 1.3% |
| Korean | 12 | 1.4% |
| Mexican | 3 | 0.4% |
| Norwegian | 6 | 0.7% |
| Polish | 9 | 1.0% |
| Scandinavian | 2 | 0.2% |
| Scotch-Irish | 9 | 1.0% |
| Scottish | 51 | 5.9% |
| Slovak | 4 | 0.5% |
| Spaniard | 3 | 0.4% |
| Swedish | 16 | 1.8% |
| Swiss | 6 | 0.7% |
| Thai | 3 | 0.4% |
| Ukrainian | 3 | 0.4% |
| Welsh | 1 | 0.1% | View All 32 Rows |
Immigrants in Jupiter Island
The most numerous immigrant groups reported in Jupiter Island came from Latin America (56 | 6.5%), Caribbean (49 | 5.7%), Europe (43 | 5.0%), Western Europe (43 | 5.0%), and Haiti (21 | 2.4%), together accounting for 24.5% of all Jupiter Island residents.
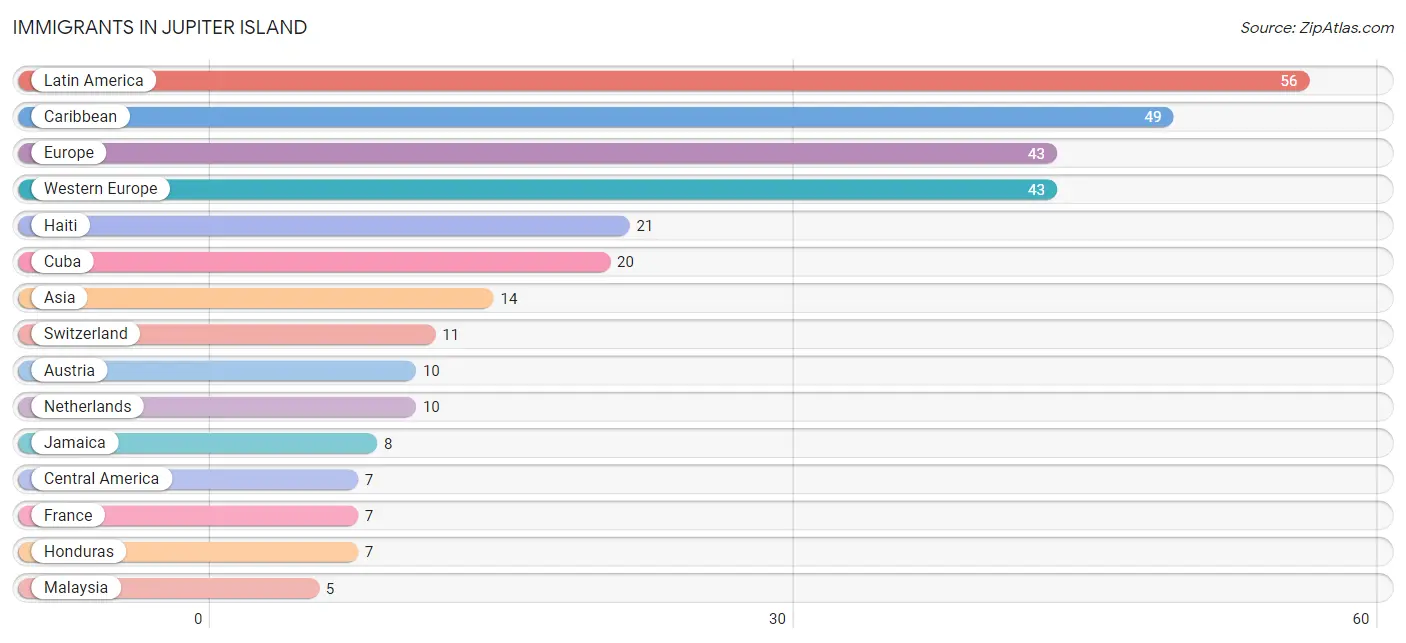
| Immigration Origin | # Population | % Population |
| Asia | 14 | 1.6% |
| Australia | 3 | 0.4% |
| Austria | 10 | 1.1% |
| Belgium | 3 | 0.4% |
| Caribbean | 49 | 5.7% |
| Central America | 7 | 0.8% |
| China | 2 | 0.2% |
| Cuba | 20 | 2.3% |
| Eastern Asia | 2 | 0.2% |
| Europe | 43 | 5.0% |
| France | 7 | 0.8% |
| Germany | 2 | 0.2% |
| Haiti | 21 | 2.4% |
| Honduras | 7 | 0.8% |
| India | 4 | 0.5% |
| Jamaica | 8 | 0.9% |
| Latin America | 56 | 6.5% |
| Lebanon | 3 | 0.4% |
| Malaysia | 5 | 0.6% |
| Netherlands | 10 | 1.1% |
| Oceania | 3 | 0.4% |
| South Central Asia | 4 | 0.5% |
| South Eastern Asia | 5 | 0.6% |
| Switzerland | 11 | 1.3% |
| Taiwan | 2 | 0.2% |
| Western Asia | 3 | 0.4% |
| Western Europe | 43 | 5.0% | View All 27 Rows |
Sex and Age in Jupiter Island
Sex and Age in Jupiter Island
The most populous age groups in Jupiter Island are 70 to 74 Years (69 | 16.6%) for men and 75 to 79 Years (90 | 20.0%) for women.
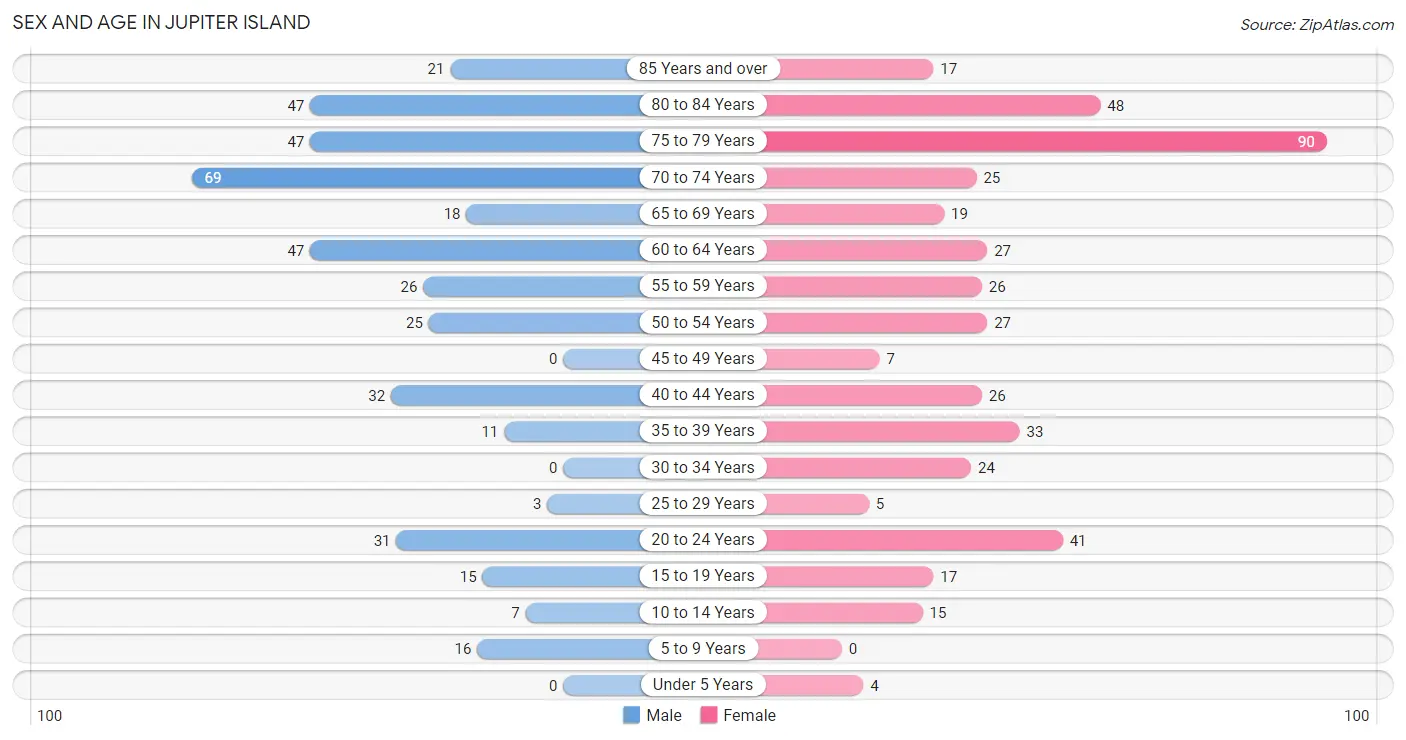
| Age Bracket | Male | Female |
| Under 5 Years | 0 (0.0%) | 4 (0.9%) |
| 5 to 9 Years | 16 (3.9%) | 0 (0.0%) |
| 10 to 14 Years | 7 (1.7%) | 15 (3.3%) |
| 15 to 19 Years | 15 (3.6%) | 17 (3.8%) |
| 20 to 24 Years | 31 (7.5%) | 41 (9.1%) |
| 25 to 29 Years | 3 (0.7%) | 5 (1.1%) |
| 30 to 34 Years | 0 (0.0%) | 24 (5.3%) |
| 35 to 39 Years | 11 (2.6%) | 33 (7.3%) |
| 40 to 44 Years | 32 (7.7%) | 26 (5.8%) |
| 45 to 49 Years | 0 (0.0%) | 7 (1.5%) |
| 50 to 54 Years | 25 (6.0%) | 27 (6.0%) |
| 55 to 59 Years | 26 (6.3%) | 26 (5.8%) |
| 60 to 64 Years | 47 (11.3%) | 27 (6.0%) |
| 65 to 69 Years | 18 (4.3%) | 19 (4.2%) |
| 70 to 74 Years | 69 (16.6%) | 25 (5.5%) |
| 75 to 79 Years | 47 (11.3%) | 90 (20.0%) |
| 80 to 84 Years | 47 (11.3%) | 48 (10.6%) |
| 85 Years and over | 21 (5.1%) | 17 (3.8%) |
| Total | 415 (100.0%) | 451 (100.0%) |
Families and Households in Jupiter Island
Median Family Size in Jupiter Island
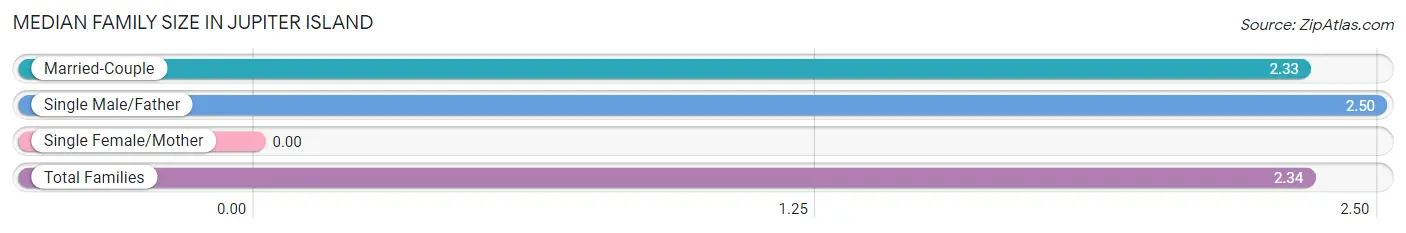
| Family Type | # Families | Family Size |
| Married-Couple | 220 (96.5%) | 2.33 |
| Single Male/Father | 8 (3.5%) | 2.50 |
| Single Female/Mother | 0 (0.0%) | - |
| Total Families | 228 (100.0%) | 2.34 |
Median Household Size in Jupiter Island
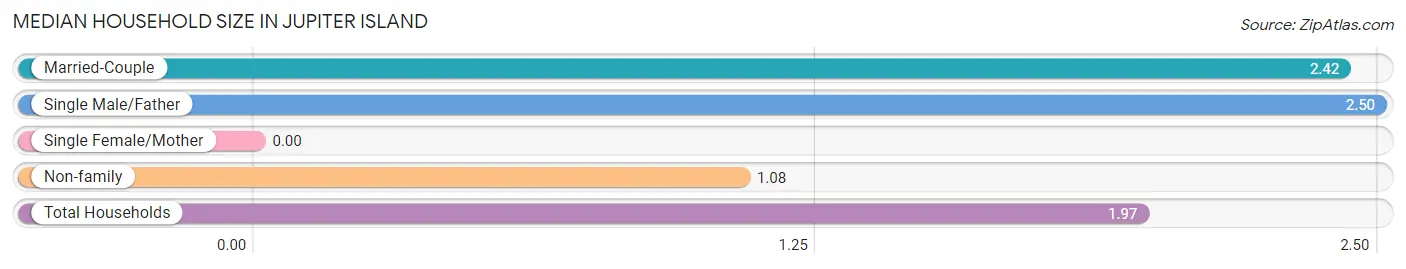
| Household Type | # Households | Household Size |
| Married-Couple | 220 (64.3%) | 2.42 |
| Single Male/Father | 8 (2.3%) | 2.50 |
| Single Female/Mother | 0 (0.0%) | - |
| Non-family | 114 (33.3%) | 1.08 |
| Total Households | 342 (100.0%) | 1.97 |
Household Size by Marriage Status in Jupiter Island
Out of a total of 342 households in Jupiter Island, 228 (66.7%) are family households, while 114 (33.3%) are nonfamily households. The most numerous type of family households are 2-person households, comprising 186, and the most common type of nonfamily households are 1-person households, comprising 108.
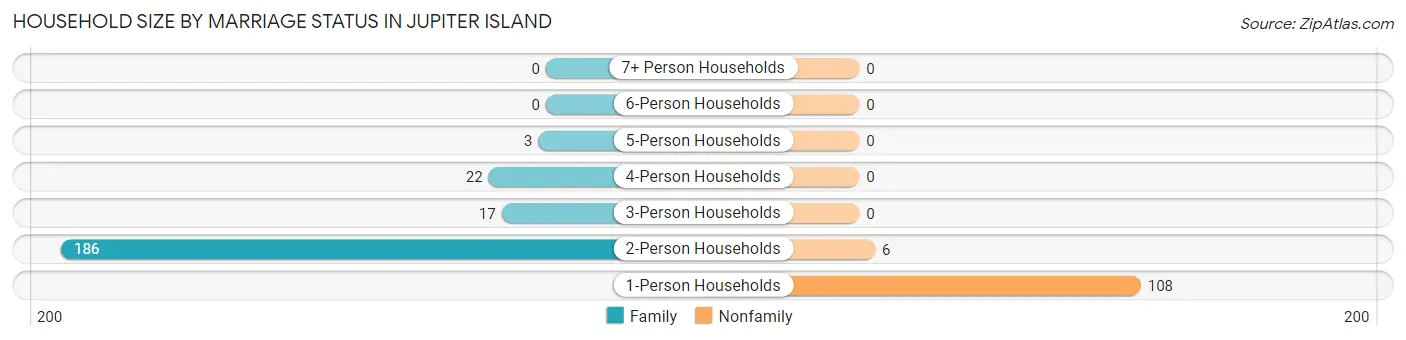
| Household Size | Family Households | Nonfamily Households |
| 1-Person Households | - | 108 (31.6%) |
| 2-Person Households | 186 (54.4%) | 6 (1.8%) |
| 3-Person Households | 17 (5.0%) | 0 (0.0%) |
| 4-Person Households | 22 (6.4%) | 0 (0.0%) |
| 5-Person Households | 3 (0.9%) | 0 (0.0%) |
| 6-Person Households | 0 (0.0%) | 0 (0.0%) |
| 7+ Person Households | 0 (0.0%) | 0 (0.0%) |
| Total | 228 (66.7%) | 114 (33.3%) |
Female Fertility in Jupiter Island
Fertility by Age in Jupiter Island
Average fertility rate in Jupiter Island is 68.0 births per 1,000 women. Women in the age bracket of 35 to 50 years have the highest fertility rate with 108.0 births per 1,000 women. Women in the age bracket of 35 to 50 years acount for 72.7% of all women with births.
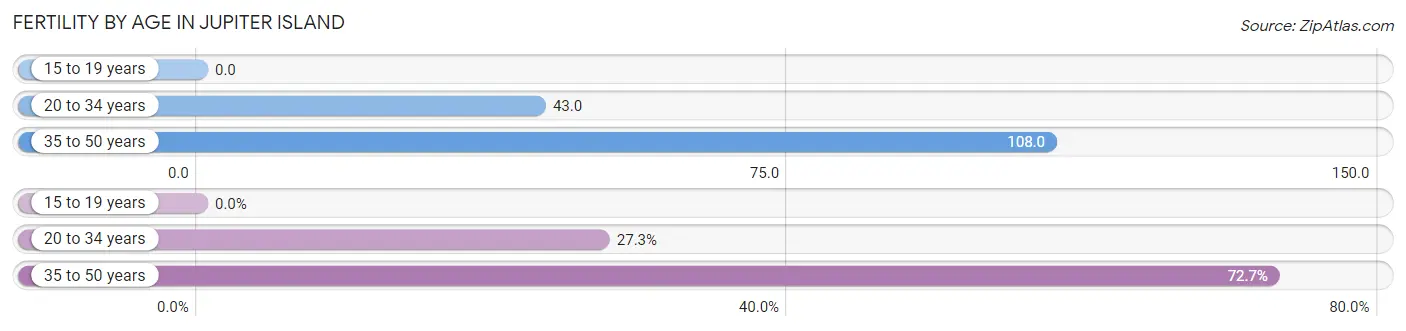
| Age Bracket | Women with Births | Births / 1,000 Women |
| 15 to 19 years | 0 (0.0%) | 0.0 |
| 20 to 34 years | 3 (27.3%) | 43.0 |
| 35 to 50 years | 8 (72.7%) | 108.0 |
| Total | 11 (100.0%) | 68.0 |
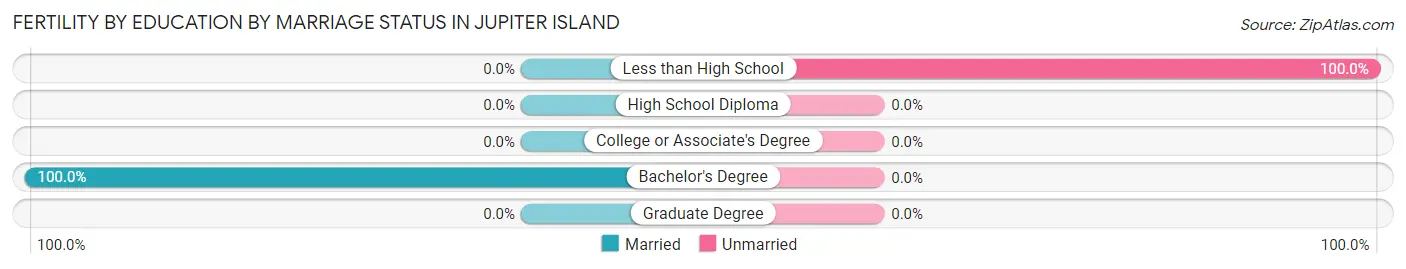
Fertility by Age by Marriage Status in Jupiter Island
72.7% of women with births (11) in Jupiter Island are married. The highest percentage of unmarried women with births falls into 20 to 34 years age bracket with 100.0% of them unmarried at the time of birth, while the lowest percentage of unmarried women with births belong to 35 to 50 years age bracket with 0.0% of them unmarried.
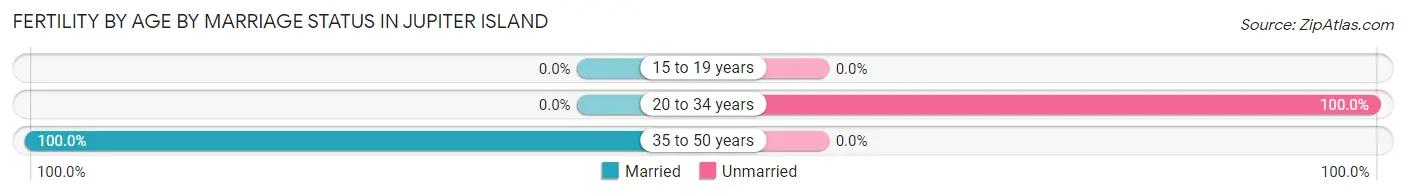
| Age Bracket | Married | Unmarried |
| 15 to 19 years | 0 (0.0%) | 0 (0.0%) |
| 20 to 34 years | 0 (0.0%) | 3 (100.0%) |
| 35 to 50 years | 8 (100.0%) | 0 (0.0%) |
| Total | 8 (72.7%) | 3 (27.3%) |
Fertility by Education in Jupiter Island
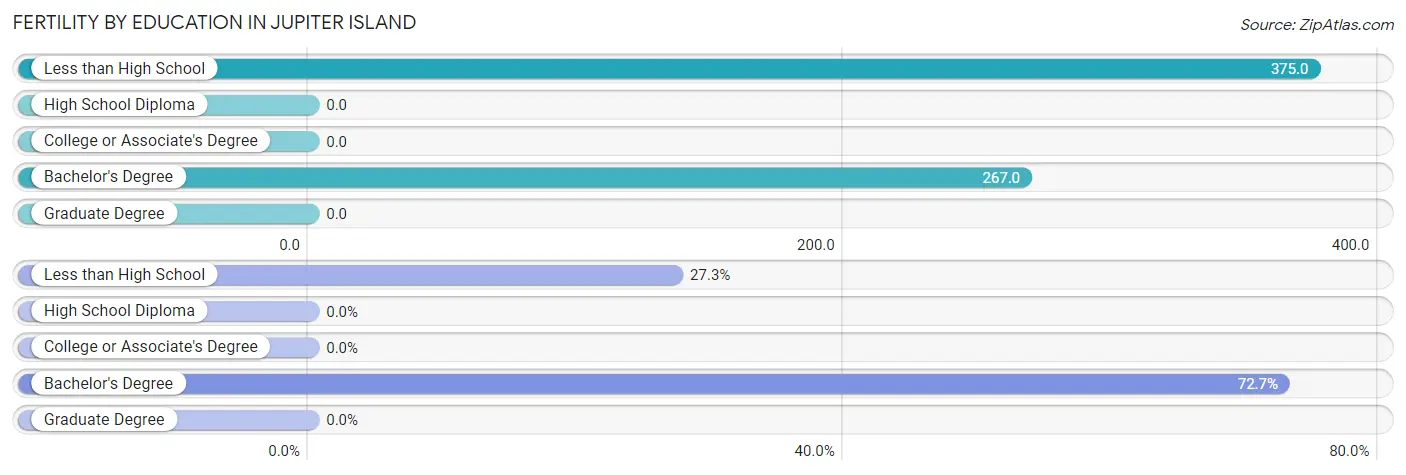
| Educational Attainment | Women with Births | Births / 1,000 Women |
| Less than High School | 3 (27.3%) | 375.0 |
| High School Diploma | 0 (0.0%) | 0.0 |
| College or Associate's Degree | 0 (0.0%) | 0.0 |
| Bachelor's Degree | 8 (72.7%) | 267.0 |
| Graduate Degree | 0 (0.0%) | 0.0 |
| Total | 11 (100.0%) | 68.0 |
Fertility by Education by Marriage Status in Jupiter Island
27.3% of women with births in Jupiter Island are unmarried. Women with the educational attainment of bachelor's degree are most likely to be married with 100.0% of them married at childbirth, while women with the educational attainment of less than high school are least likely to be married with 100.0% of them unmarried at childbirth.
| Educational Attainment | Married | Unmarried |
| Less than High School | 0 (0.0%) | 3 (100.0%) |
| High School Diploma | 0 (0.0%) | 0 (0.0%) |
| College or Associate's Degree | 0 (0.0%) | 0 (0.0%) |
| Bachelor's Degree | 8 (100.0%) | 0 (0.0%) |
| Graduate Degree | 0 (0.0%) | 0 (0.0%) |
| Total | 8 (72.7%) | 3 (27.3%) |
Employment Characteristics in Jupiter Island
Employment by Class of Employer in Jupiter Island
Among the 230 employed individuals in Jupiter Island, private company employees (131 | 57.0%), self-employed (incorporated) (52 | 22.6%), and not-for-profit organizations (33 | 14.3%) make up the most common classes of employment.
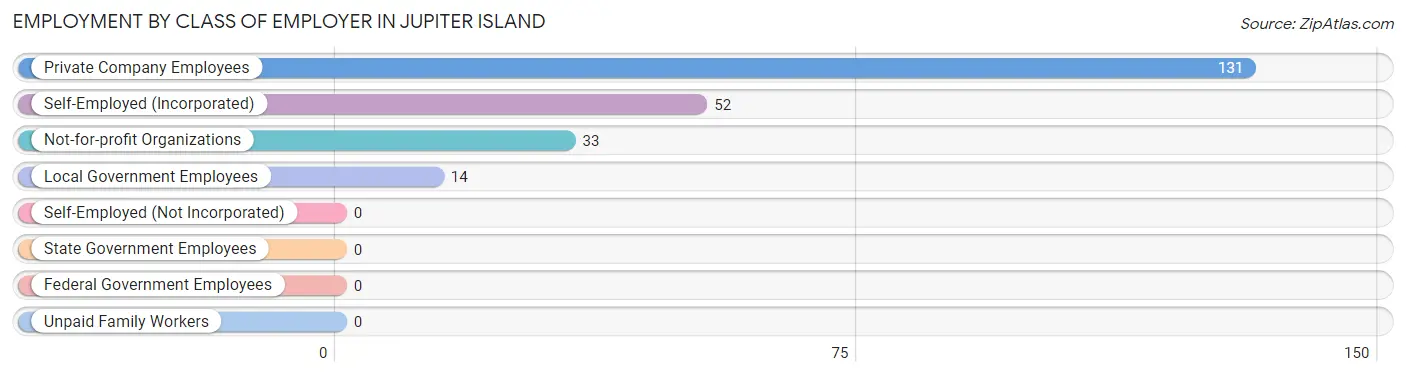
| Employer Class | # Employees | % Employees |
| Private Company Employees | 131 | 57.0% |
| Self-Employed (Incorporated) | 52 | 22.6% |
| Self-Employed (Not Incorporated) | 0 | 0.0% |
| Not-for-profit Organizations | 33 | 14.3% |
| Local Government Employees | 14 | 6.1% |
| State Government Employees | 0 | 0.0% |
| Federal Government Employees | 0 | 0.0% |
| Unpaid Family Workers | 0 | 0.0% |
| Total | 230 | 100.0% |
Employment Status by Age in Jupiter Island
According to the labor force statistics for Jupiter Island, out of the total population over 16 years of age (819), 39.2% or 321 individuals are in the labor force, with 28.3% or 91 of them unemployed. The age group with the highest labor force participation rate is 25 to 29 years, with 100.0% or 8 individuals in the labor force. Within the labor force, the 35 to 44 years age range has the highest percentage of unemployed individuals, with 56.7% or 51 of them being unemployed.
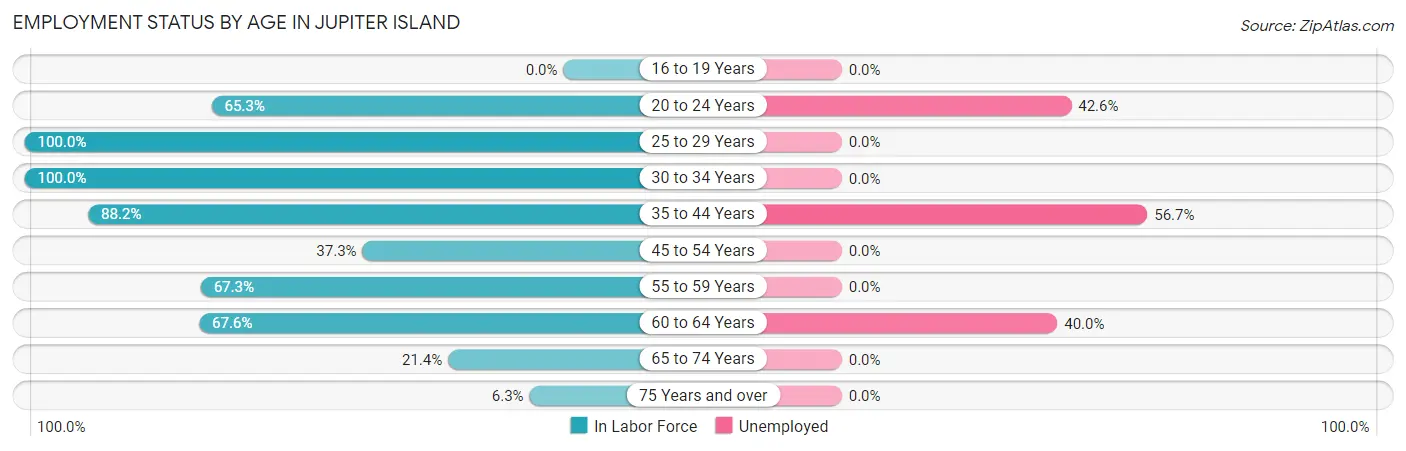
| Age Bracket | In Labor Force | Unemployed |
| 16 to 19 Years | 0 (0.0%) | 0 (0.0%) |
| 20 to 24 Years | 47 (65.3%) | 20 (42.6%) |
| 25 to 29 Years | 8 (100.0%) | 0 (0.0%) |
| 30 to 34 Years | 24 (100.0%) | 0 (0.0%) |
| 35 to 44 Years | 90 (88.2%) | 51 (56.7%) |
| 45 to 54 Years | 22 (37.3%) | 0 (0.0%) |
| 55 to 59 Years | 35 (67.3%) | 0 (0.0%) |
| 60 to 64 Years | 50 (67.6%) | 20 (40.0%) |
| 65 to 74 Years | 28 (21.4%) | 0 (0.0%) |
| 75 Years and over | 17 (6.3%) | 0 (0.0%) |
| Total | 321 (39.2%) | 91 (28.3%) |
Employment Status by Educational Attainment in Jupiter Island
According to labor force statistics for Jupiter Island, 71.8% of individuals (229) out of the total population between 25 and 64 years of age (319) are in the labor force, with 31.0% or 71 of them being unemployed. The group with the highest labor force participation rate are those with the educational attainment of less than high school, with 100.0% or 3 individuals in the labor force. Within the labor force, individuals with high school diploma education have the highest percentage of unemployment, with 61.7% or 71 of them being unemployed.
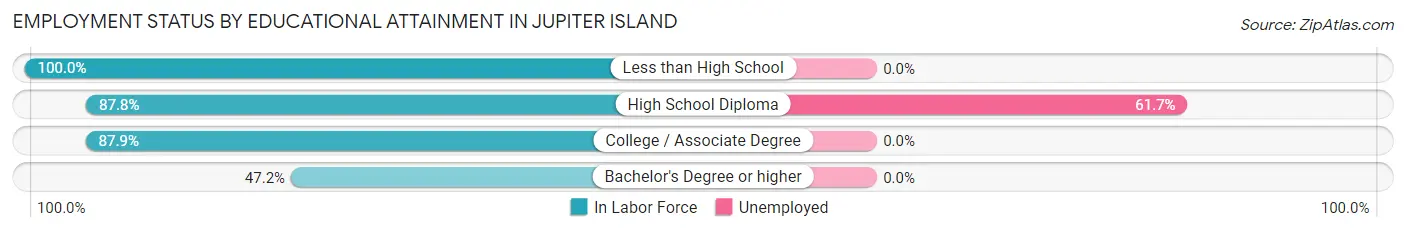
| Educational Attainment | In Labor Force | Unemployed |
| Less than High School | 3 (100.0%) | 0 (0.0%) |
| High School Diploma | 115 (87.8%) | 81 (61.7%) |
| College / Associate Degree | 51 (87.9%) | 0 (0.0%) |
| Bachelor's Degree or higher | 60 (47.2%) | 0 (0.0%) |
| Total | 229 (71.8%) | 99 (31.0%) |
Employment Occupations by Sex in Jupiter Island
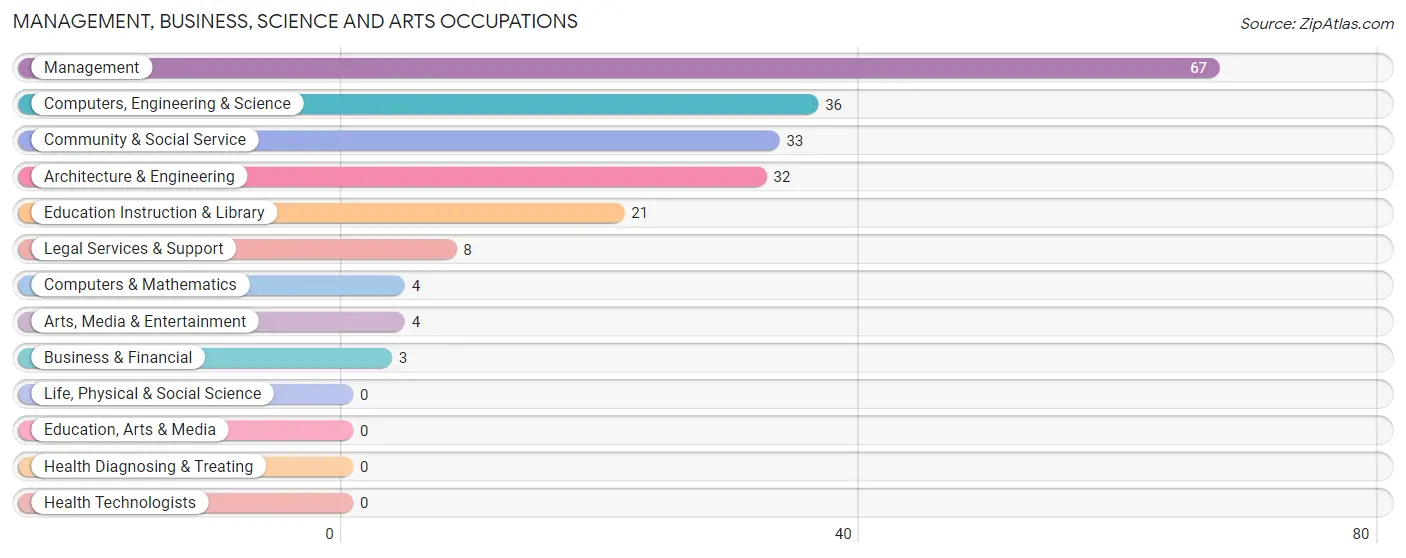
Management, Business, Science and Arts Occupations
The most common Management, Business, Science and Arts occupations in Jupiter Island are Management (67 | 29.1%), Computers, Engineering & Science (36 | 15.7%), Community & Social Service (33 | 14.3%), Architecture & Engineering (32 | 13.9%), and Education Instruction & Library (21 | 9.1%).
Management, Business, Science and Arts Occupations by Sex
Within the Management, Business, Science and Arts occupations in Jupiter Island, the most male-oriented occupations are Business & Financial (100.0%), Arts, Media & Entertainment (100.0%), and Management (71.6%), while the most female-oriented occupations are Computers & Mathematics (100.0%), Education Instruction & Library (100.0%), and Community & Social Service (72.7%).
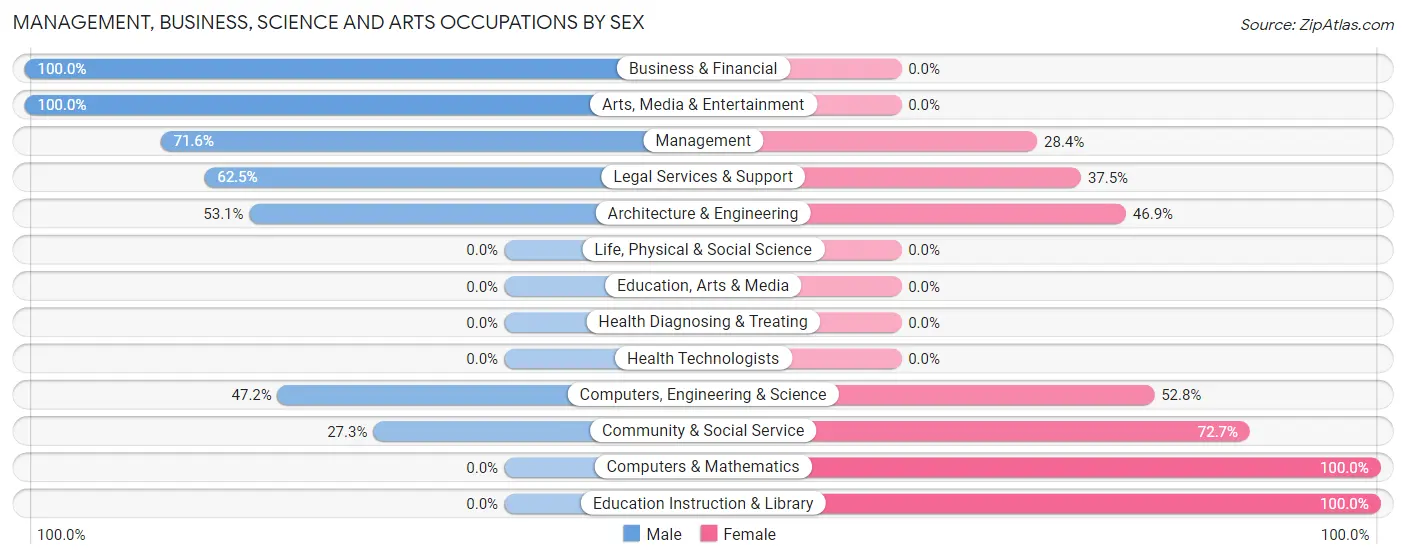
| Occupation | Male | Female |
| Management | 48 (71.6%) | 19 (28.4%) |
| Business & Financial | 3 (100.0%) | 0 (0.0%) |
| Computers, Engineering & Science | 17 (47.2%) | 19 (52.8%) |
| Computers & Mathematics | 0 (0.0%) | 4 (100.0%) |
| Architecture & Engineering | 17 (53.1%) | 15 (46.9%) |
| Life, Physical & Social Science | 0 (0.0%) | 0 (0.0%) |
| Community & Social Service | 9 (27.3%) | 24 (72.7%) |
| Education, Arts & Media | 0 (0.0%) | 0 (0.0%) |
| Legal Services & Support | 5 (62.5%) | 3 (37.5%) |
| Education Instruction & Library | 0 (0.0%) | 21 (100.0%) |
| Arts, Media & Entertainment | 4 (100.0%) | 0 (0.0%) |
| Health Diagnosing & Treating | 0 (0.0%) | 0 (0.0%) |
| Health Technologists | 0 (0.0%) | 0 (0.0%) |
| Total (Category) | 77 (55.4%) | 62 (44.6%) |
| Total (Overall) | 115 (50.0%) | 115 (50.0%) |
Services Occupations
The most common Services occupations in Jupiter Island are Security & Protection (21 | 9.1%), Firefighting & Prevention (18 | 7.8%), Food Preparation & Serving (16 | 7.0%), Personal Care & Service (16 | 7.0%), and Law Enforcement (3 | 1.3%).
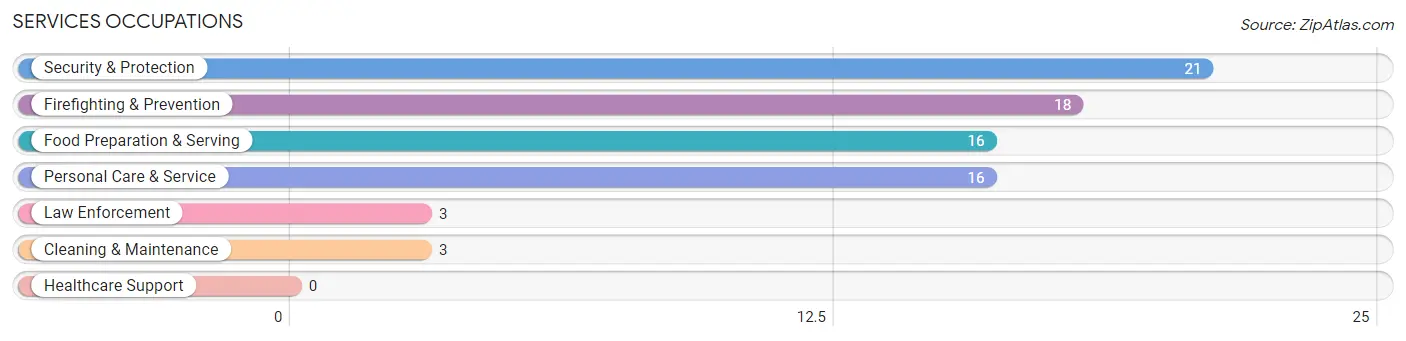
Services Occupations by Sex
Within the Services occupations in Jupiter Island, the most male-oriented occupations are Law Enforcement (100.0%), Food Preparation & Serving (81.2%), and Personal Care & Service (18.8%), while the most female-oriented occupations are Firefighting & Prevention (100.0%), Cleaning & Maintenance (100.0%), and Security & Protection (85.7%).
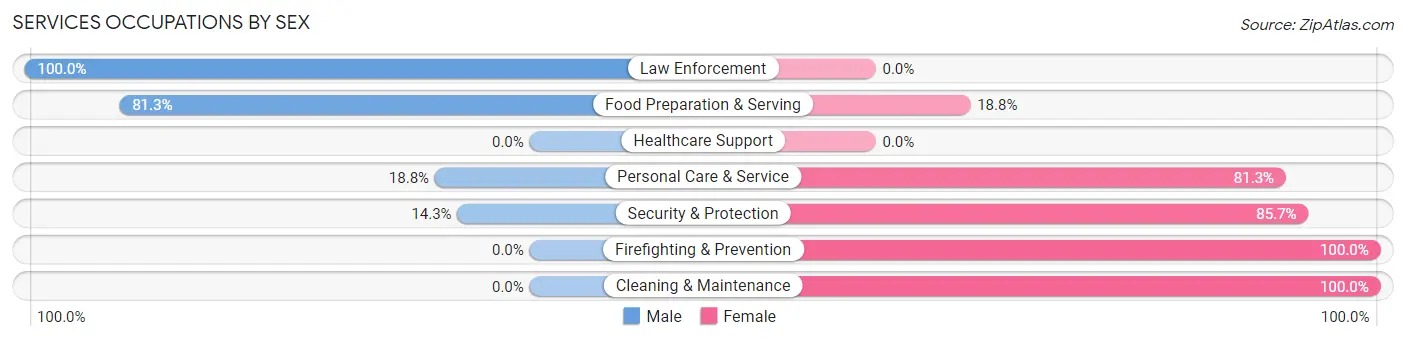
| Occupation | Male | Female |
| Healthcare Support | 0 (0.0%) | 0 (0.0%) |
| Security & Protection | 3 (14.3%) | 18 (85.7%) |
| Firefighting & Prevention | 0 (0.0%) | 18 (100.0%) |
| Law Enforcement | 3 (100.0%) | 0 (0.0%) |
| Food Preparation & Serving | 13 (81.2%) | 3 (18.8%) |
| Cleaning & Maintenance | 0 (0.0%) | 3 (100.0%) |
| Personal Care & Service | 3 (18.8%) | 13 (81.2%) |
| Total (Category) | 19 (33.9%) | 37 (66.1%) |
| Total (Overall) | 115 (50.0%) | 115 (50.0%) |
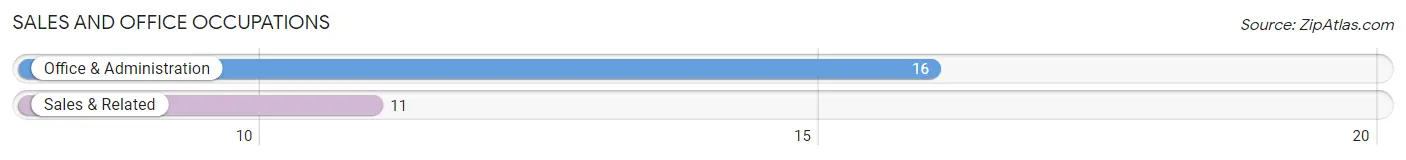
Sales and Office Occupations
The most common Sales and Office occupations in Jupiter Island are Office & Administration (16 | 7.0%), and Sales & Related (11 | 4.8%).
Sales and Office Occupations by Sex
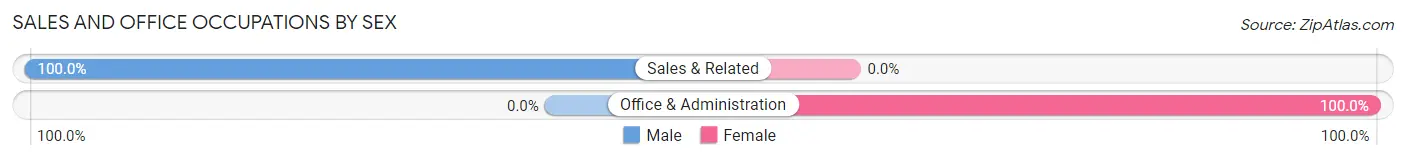
| Occupation | Male | Female |
| Sales & Related | 11 (100.0%) | 0 (0.0%) |
| Office & Administration | 0 (0.0%) | 16 (100.0%) |
| Total (Category) | 11 (40.7%) | 16 (59.3%) |
| Total (Overall) | 115 (50.0%) | 115 (50.0%) |
Natural Resources, Construction and Maintenance Occupations
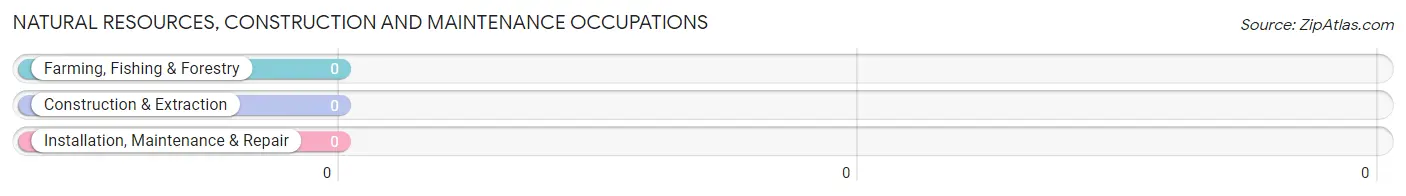
Natural Resources, Construction and Maintenance Occupations by Sex
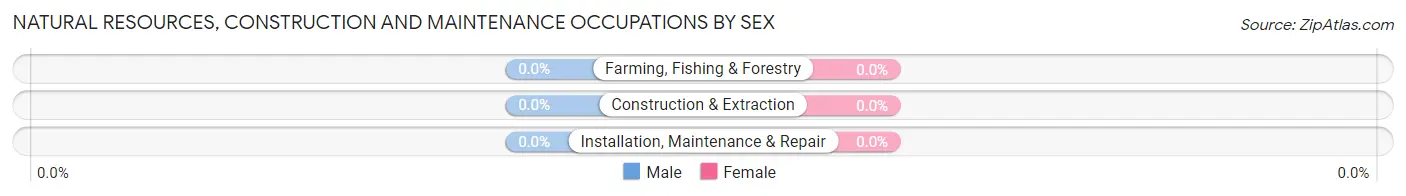
| Occupation | Male | Female |
| Farming, Fishing & Forestry | 0 (0.0%) | 0 (0.0%) |
| Construction & Extraction | 0 (0.0%) | 0 (0.0%) |
| Installation, Maintenance & Repair | 0 (0.0%) | 0 (0.0%) |
| Total (Category) | 0 (0.0%) | 0 (0.0%) |
| Total (Overall) | 115 (50.0%) | 115 (50.0%) |
Production, Transportation and Moving Occupations
The most common Production, Transportation and Moving occupations in Jupiter Island are , and Production (8 | 3.5%).
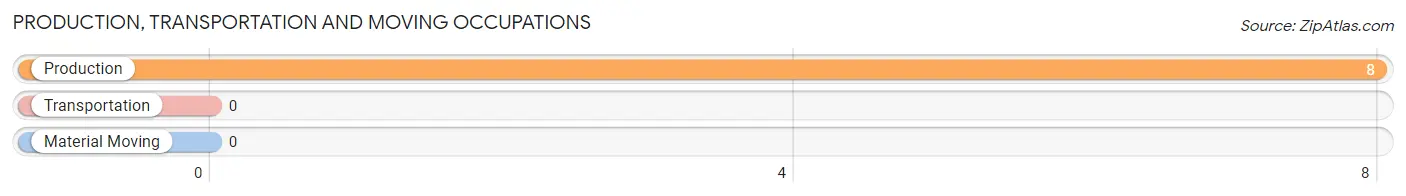
Production, Transportation and Moving Occupations by Sex
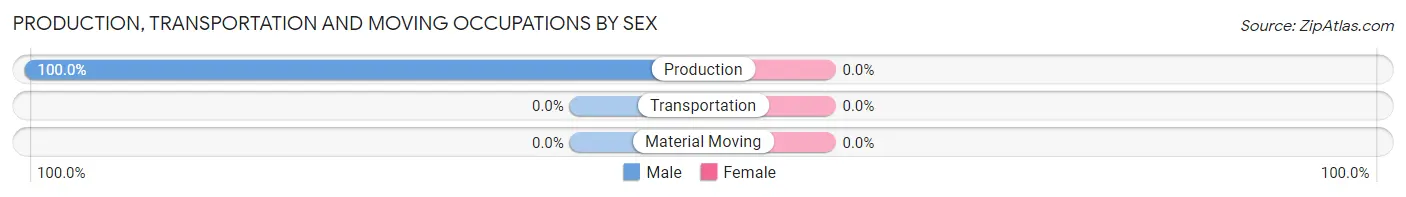
| Occupation | Male | Female |
| Production | 8 (100.0%) | 0 (0.0%) |
| Transportation | 0 (0.0%) | 0 (0.0%) |
| Material Moving | 0 (0.0%) | 0 (0.0%) |
| Total (Category) | 8 (100.0%) | 0 (0.0%) |
| Total (Overall) | 115 (50.0%) | 115 (50.0%) |
Employment Industries by Sex in Jupiter Island
Employment Industries in Jupiter Island
The major employment industries in Jupiter Island include Manufacturing (45 | 19.6%), Educational Services (36 | 15.7%), Finance & Insurance (30 | 13.0%), Administrative & Support (21 | 9.1%), and Accommodation & Food Services (21 | 9.1%).
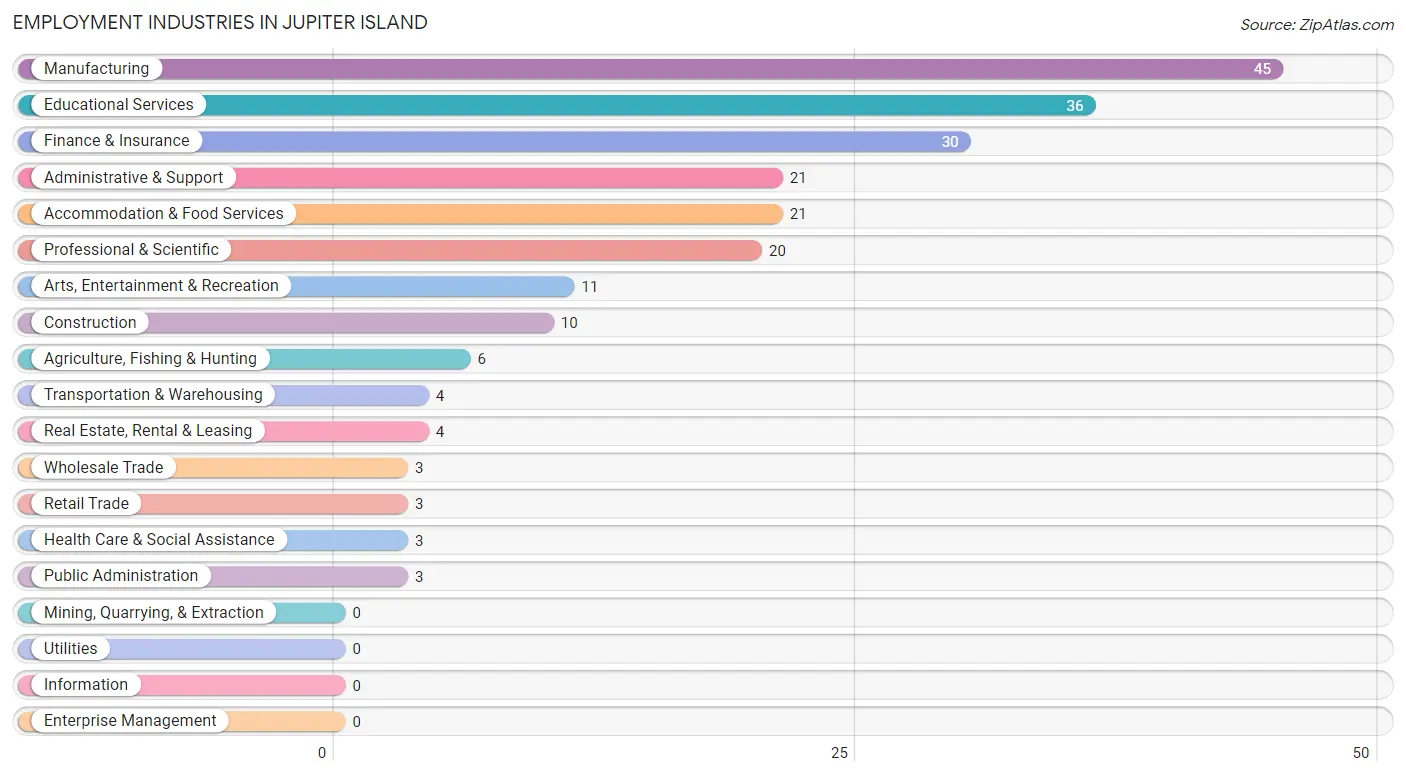
Employment Industries by Sex in Jupiter Island
The Jupiter Island industries that see more men than women are Construction (100.0%), Wholesale Trade (100.0%), and Retail Trade (100.0%), whereas the industries that tend to have a higher number of women are Agriculture, Fishing & Hunting (100.0%), Educational Services (100.0%), and Arts, Entertainment & Recreation (100.0%).
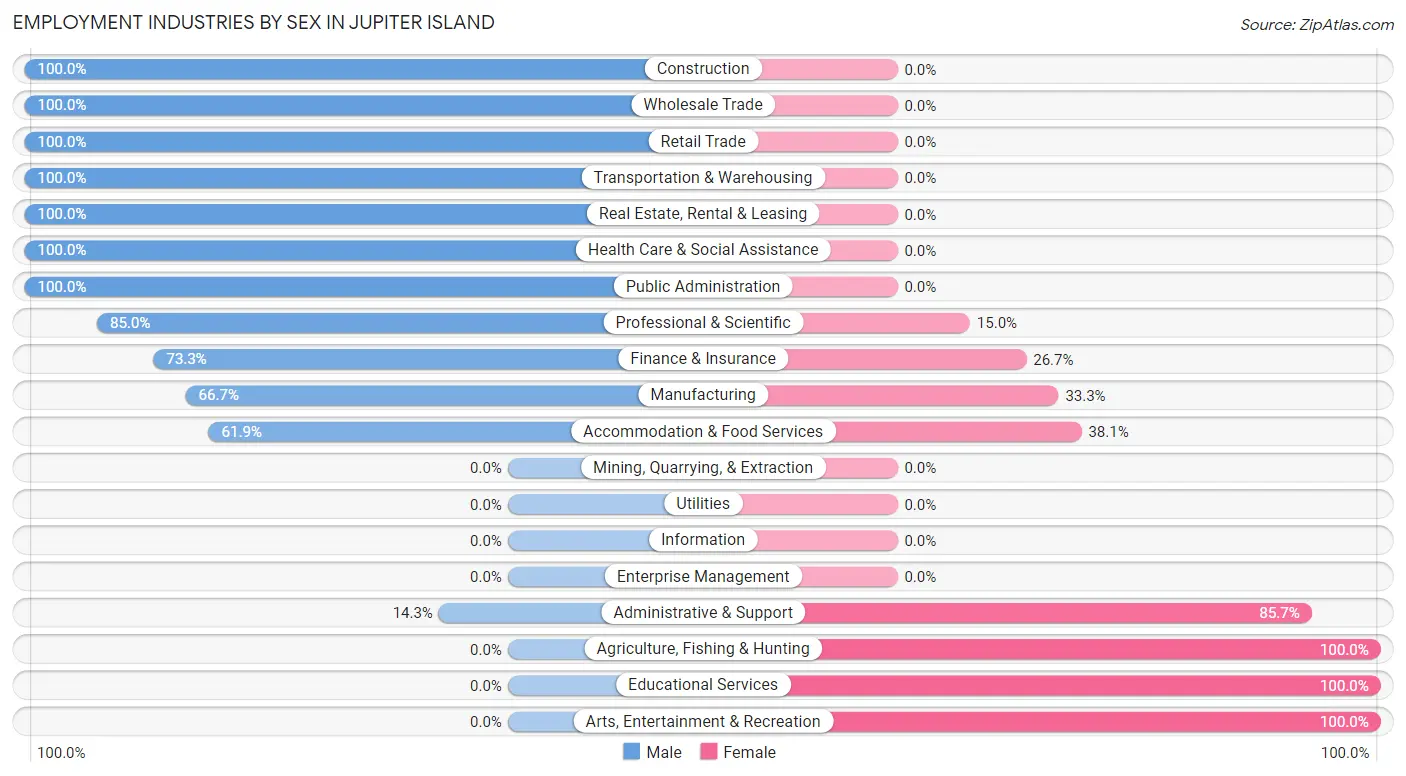
| Industry | Male | Female |
| Agriculture, Fishing & Hunting | 0 (0.0%) | 6 (100.0%) |
| Mining, Quarrying, & Extraction | 0 (0.0%) | 0 (0.0%) |
| Construction | 10 (100.0%) | 0 (0.0%) |
| Manufacturing | 30 (66.7%) | 15 (33.3%) |
| Wholesale Trade | 3 (100.0%) | 0 (0.0%) |
| Retail Trade | 3 (100.0%) | 0 (0.0%) |
| Transportation & Warehousing | 4 (100.0%) | 0 (0.0%) |
| Utilities | 0 (0.0%) | 0 (0.0%) |
| Information | 0 (0.0%) | 0 (0.0%) |
| Finance & Insurance | 22 (73.3%) | 8 (26.7%) |
| Real Estate, Rental & Leasing | 4 (100.0%) | 0 (0.0%) |
| Professional & Scientific | 17 (85.0%) | 3 (15.0%) |
| Enterprise Management | 0 (0.0%) | 0 (0.0%) |
| Administrative & Support | 3 (14.3%) | 18 (85.7%) |
| Educational Services | 0 (0.0%) | 36 (100.0%) |
| Health Care & Social Assistance | 3 (100.0%) | 0 (0.0%) |
| Arts, Entertainment & Recreation | 0 (0.0%) | 11 (100.0%) |
| Accommodation & Food Services | 13 (61.9%) | 8 (38.1%) |
| Public Administration | 3 (100.0%) | 0 (0.0%) |
| Total | 115 (50.0%) | 115 (50.0%) |
Education in Jupiter Island
School Enrollment in Jupiter Island
The most common levels of schooling among the 108 students in Jupiter Island are college / undergraduate (48 | 44.4%), middle school (22 | 20.4%), and graduate / professional (10 | 9.3%).
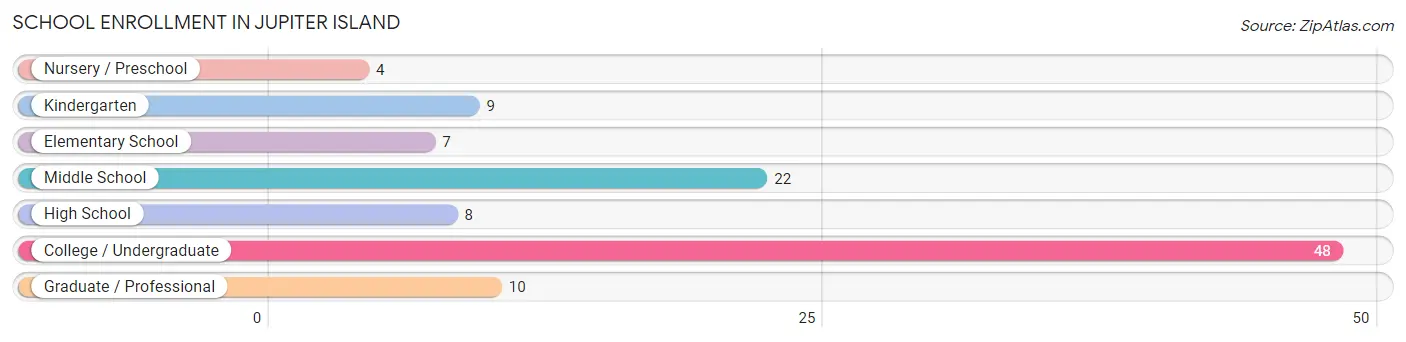
| School Level | # Students | % Students |
| Nursery / Preschool | 4 | 3.7% |
| Kindergarten | 9 | 8.3% |
| Elementary School | 7 | 6.5% |
| Middle School | 22 | 20.4% |
| High School | 8 | 7.4% |
| College / Undergraduate | 48 | 44.4% |
| Graduate / Professional | 10 | 9.3% |
| Total | 108 | 100.0% |
School Enrollment by Age by Funding Source in Jupiter Island
Out of a total of 108 students who are enrolled in schools in Jupiter Island, 60 (55.6%) attend a private institution, while the remaining 48 (44.4%) are enrolled in public schools. The age group of 3 to 4 year olds has the highest likelihood of being enrolled in private schools, with 4 (100.0% in the age bracket) enrolled. Conversely, the age group of 5 to 9 year old has the lowest likelihood of being enrolled in a private school, with 16 (100.0% in the age bracket) attending a public institution.
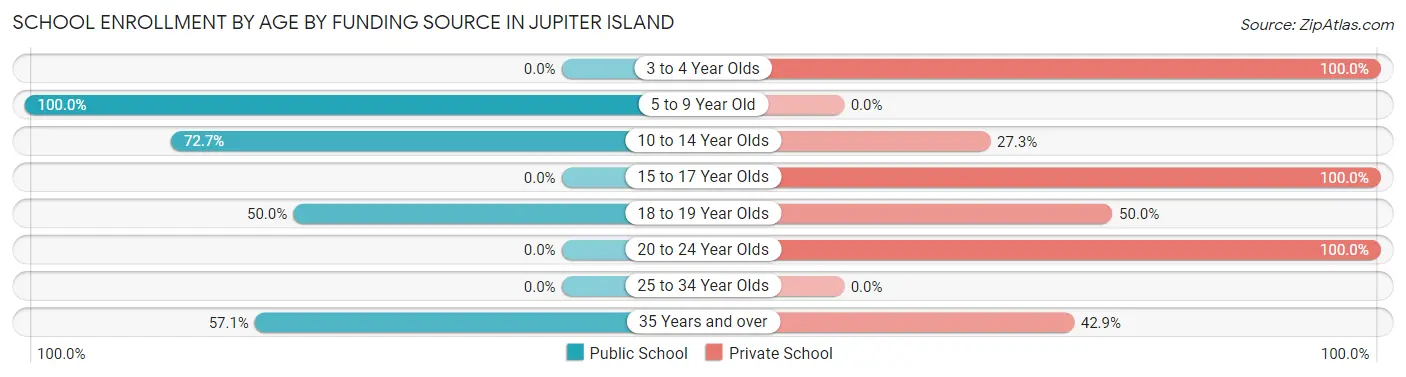
| Age Bracket | Public School | Private School |
| 3 to 4 Year Olds | 0 (0.0%) | 4 (100.0%) |
| 5 to 9 Year Old | 16 (100.0%) | 0 (0.0%) |
| 10 to 14 Year Olds | 16 (72.7%) | 6 (27.3%) |
| 15 to 17 Year Olds | 0 (0.0%) | 8 (100.0%) |
| 18 to 19 Year Olds | 12 (50.0%) | 12 (50.0%) |
| 20 to 24 Year Olds | 0 (0.0%) | 27 (100.0%) |
| 25 to 34 Year Olds | 0 (0.0%) | 0 (0.0%) |
| 35 Years and over | 4 (57.1%) | 3 (42.9%) |
| Total | 48 (44.4%) | 60 (55.6%) |
Educational Attainment by Field of Study in Jupiter Island
Education (69 | 15.1%), business (66 | 14.4%), liberal arts & history (53 | 11.6%), social sciences (49 | 10.7%), and literature & languages (45 | 9.8%) are the most common fields of study among 458 individuals in Jupiter Island who have obtained a bachelor's degree or higher.
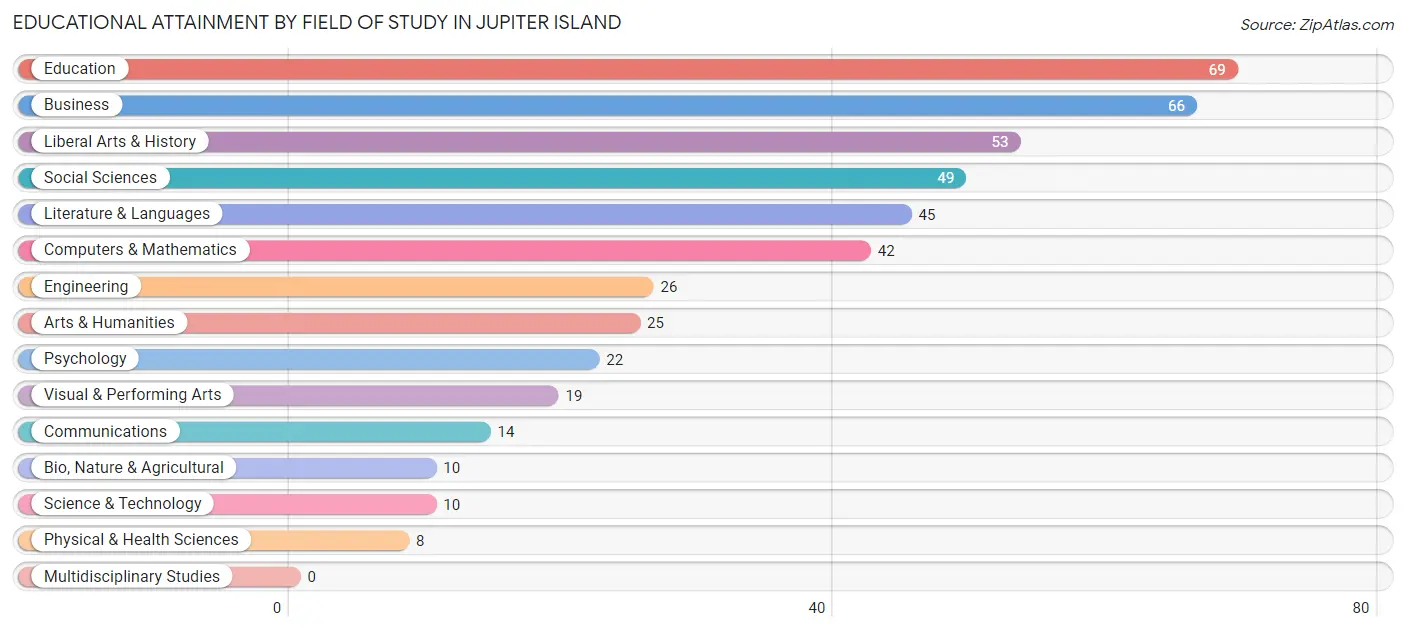
| Field of Study | # Graduates | % Graduates |
| Computers & Mathematics | 42 | 9.2% |
| Bio, Nature & Agricultural | 10 | 2.2% |
| Physical & Health Sciences | 8 | 1.8% |
| Psychology | 22 | 4.8% |
| Social Sciences | 49 | 10.7% |
| Engineering | 26 | 5.7% |
| Multidisciplinary Studies | 0 | 0.0% |
| Science & Technology | 10 | 2.2% |
| Business | 66 | 14.4% |
| Education | 69 | 15.1% |
| Literature & Languages | 45 | 9.8% |
| Liberal Arts & History | 53 | 11.6% |
| Visual & Performing Arts | 19 | 4.2% |
| Communications | 14 | 3.1% |
| Arts & Humanities | 25 | 5.5% |
| Total | 458 | 100.0% |
Transportation & Commute in Jupiter Island
Vehicle Availability by Sex in Jupiter Island
The most prevalent vehicle ownership categories in Jupiter Island are males with 2 vehicles (49, accounting for 42.6%) and females with 2 vehicles (30, making up 63.6%).
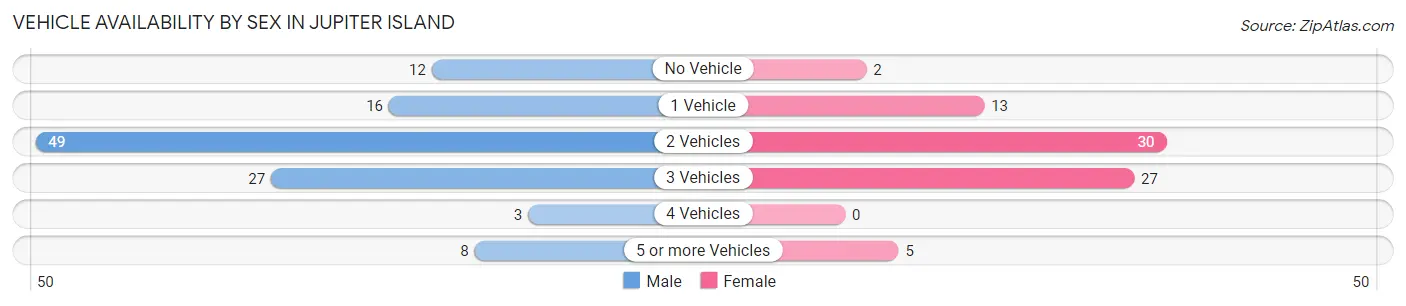
| Vehicles Available | Male | Female |
| No Vehicle | 12 (10.4%) | 2 (2.6%) |
| 1 Vehicle | 16 (13.9%) | 13 (16.9%) |
| 2 Vehicles | 49 (42.6%) | 30 (39.0%) |
| 3 Vehicles | 27 (23.5%) | 27 (35.1%) |
| 4 Vehicles | 3 (2.6%) | 0 (0.0%) |
| 5 or more Vehicles | 8 (7.0%) | 5 (6.5%) |
| Total | 115 (100.0%) | 77 (100.0%) |
Commute Time in Jupiter Island
The most frequently occuring commute durations in Jupiter Island are less than 5 minutes (36 commuters, 20.8%), 45 to 59 minutes (33 commuters, 19.1%), and 5 to 9 minutes (23 commuters, 13.3%).
| Commute Time | # Commuters | % Commuters |
| Less than 5 Minutes | 36 | 20.8% |
| 5 to 9 Minutes | 23 | 13.3% |
| 10 to 14 Minutes | 17 | 9.8% |
| 15 to 19 Minutes | 0 | 0.0% |
| 20 to 24 Minutes | 18 | 10.4% |
| 25 to 29 Minutes | 17 | 9.8% |
| 30 to 34 Minutes | 23 | 13.3% |
| 35 to 39 Minutes | 0 | 0.0% |
| 40 to 44 Minutes | 6 | 3.5% |
| 45 to 59 Minutes | 33 | 19.1% |
| 60 to 89 Minutes | 0 | 0.0% |
| 90 or more Minutes | 0 | 0.0% |
Commute Time by Sex in Jupiter Island
The most common commute times in Jupiter Island are 20 to 24 minutes (18 commuters, 20.7%) for males and 45 to 59 minutes (26 commuters, 30.2%) for females.
| Commute Time | Male | Female |
| Less than 5 Minutes | 13 (14.9%) | 23 (26.7%) |
| 5 to 9 Minutes | 3 (3.5%) | 20 (23.3%) |
| 10 to 14 Minutes | 11 (12.6%) | 6 (7.0%) |
| 15 to 19 Minutes | 0 (0.0%) | 0 (0.0%) |
| 20 to 24 Minutes | 18 (20.7%) | 0 (0.0%) |
| 25 to 29 Minutes | 17 (19.5%) | 0 (0.0%) |
| 30 to 34 Minutes | 14 (16.1%) | 9 (10.5%) |
| 35 to 39 Minutes | 0 (0.0%) | 0 (0.0%) |
| 40 to 44 Minutes | 4 (4.6%) | 2 (2.3%) |
| 45 to 59 Minutes | 7 (8.1%) | 26 (30.2%) |
| 60 to 89 Minutes | 0 (0.0%) | 0 (0.0%) |
| 90 or more Minutes | 0 (0.0%) | 0 (0.0%) |
Time of Departure to Work by Sex in Jupiter Island
The most frequent times of departure to work in Jupiter Island are 10:00 AM to 10:59 AM (17, 19.5%) for males and 7:30 AM to 7:59 AM (20, 23.3%) for females.
| Time of Departure | Male | Female |
| 12:00 AM to 4:59 AM | 3 (3.5%) | 0 (0.0%) |
| 5:00 AM to 5:29 AM | 0 (0.0%) | 0 (0.0%) |
| 5:30 AM to 5:59 AM | 7 (8.1%) | 0 (0.0%) |
| 6:00 AM to 6:29 AM | 7 (8.1%) | 11 (12.8%) |
| 6:30 AM to 6:59 AM | 4 (4.6%) | 0 (0.0%) |
| 7:00 AM to 7:29 AM | 7 (8.1%) | 2 (2.3%) |
| 7:30 AM to 7:59 AM | 3 (3.5%) | 20 (23.3%) |
| 8:00 AM to 8:29 AM | 7 (8.1%) | 6 (7.0%) |
| 8:30 AM to 8:59 AM | 13 (14.9%) | 0 (0.0%) |
| 9:00 AM to 9:59 AM | 9 (10.3%) | 5 (5.8%) |
| 10:00 AM to 10:59 AM | 17 (19.5%) | 4 (4.6%) |
| 11:00 AM to 11:59 AM | 10 (11.5%) | 0 (0.0%) |
| 12:00 PM to 3:59 PM | 0 (0.0%) | 20 (23.3%) |
| 4:00 PM to 11:59 PM | 0 (0.0%) | 18 (20.9%) |
| Total | 87 (100.0%) | 86 (100.0%) |
Housing Occupancy in Jupiter Island
Occupancy by Ownership in Jupiter Island
Of the total 342 dwellings in Jupiter Island, owner-occupied units account for 320 (93.6%), while renter-occupied units make up 22 (6.4%).
| Occupancy | # Housing Units | % Housing Units |
| Owner Occupied Housing Units | 320 | 93.6% |
| Renter-Occupied Housing Units | 22 | 6.4% |
| Total Occupied Housing Units | 342 | 100.0% |
Occupancy by Household Size in Jupiter Island
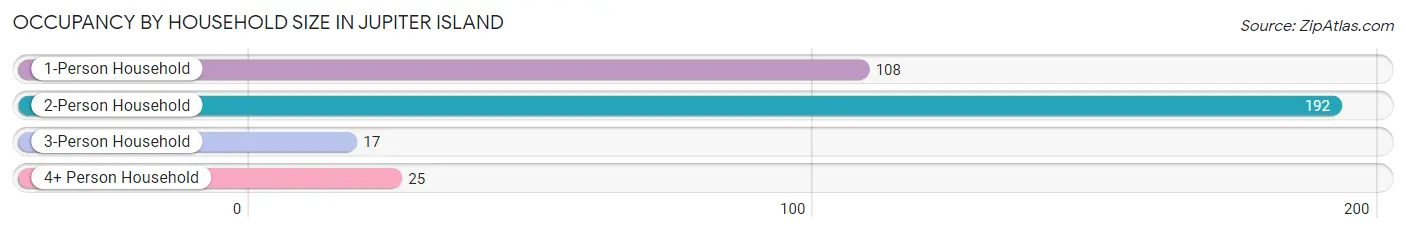
| Household Size | # Housing Units | % Housing Units |
| 1-Person Household | 108 | 31.6% |
| 2-Person Household | 192 | 56.1% |
| 3-Person Household | 17 | 5.0% |
| 4+ Person Household | 25 | 7.3% |
| Total Housing Units | 342 | 100.0% |
Occupancy by Ownership by Household Size in Jupiter Island
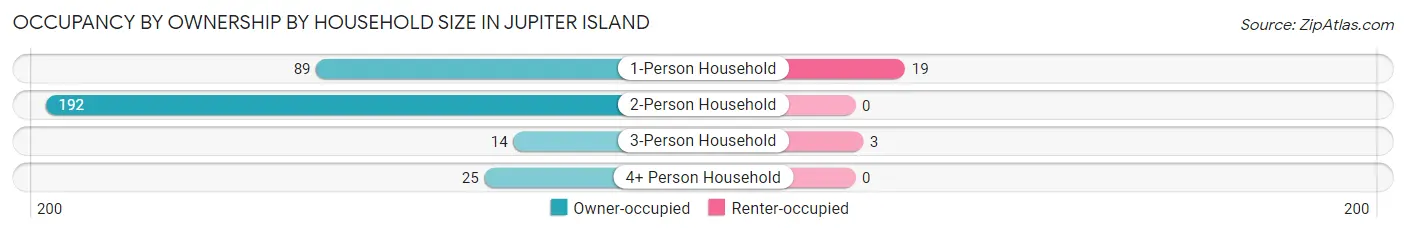
| Household Size | Owner-occupied | Renter-occupied |
| 1-Person Household | 89 (82.4%) | 19 (17.6%) |
| 2-Person Household | 192 (100.0%) | 0 (0.0%) |
| 3-Person Household | 14 (82.4%) | 3 (17.6%) |
| 4+ Person Household | 25 (100.0%) | 0 (0.0%) |
| Total Housing Units | 320 (93.6%) | 22 (6.4%) |
Occupancy by Educational Attainment in Jupiter Island
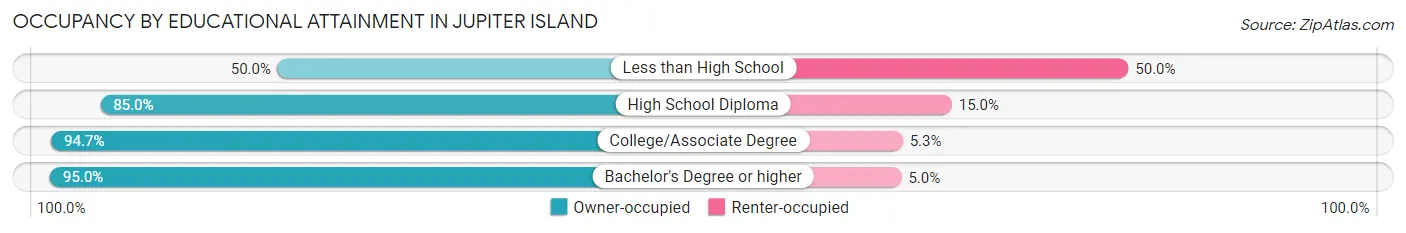
| Household Size | Owner-occupied | Renter-occupied |
| Less than High School | 3 (50.0%) | 3 (50.0%) |
| High School Diploma | 17 (85.0%) | 3 (15.0%) |
| College/Associate Degree | 54 (94.7%) | 3 (5.3%) |
| Bachelor's Degree or higher | 246 (95.0%) | 13 (5.0%) |
Occupancy by Age of Householder in Jupiter Island
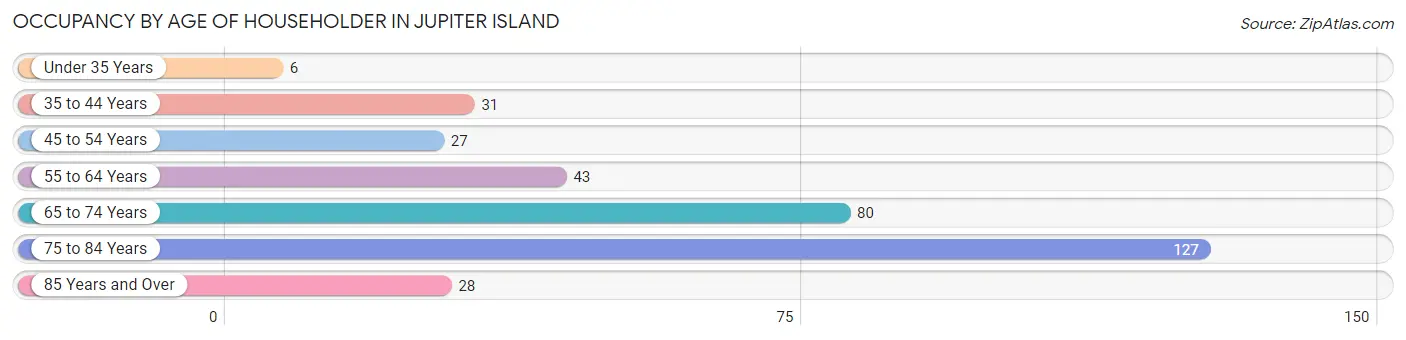
| Age Bracket | # Households | % Households |
| Under 35 Years | 6 | 1.8% |
| 35 to 44 Years | 31 | 9.1% |
| 45 to 54 Years | 27 | 7.9% |
| 55 to 64 Years | 43 | 12.6% |
| 65 to 74 Years | 80 | 23.4% |
| 75 to 84 Years | 127 | 37.1% |
| 85 Years and Over | 28 | 8.2% |
| Total | 342 | 100.0% |
Housing Finances in Jupiter Island
Median Income by Occupancy in Jupiter Island
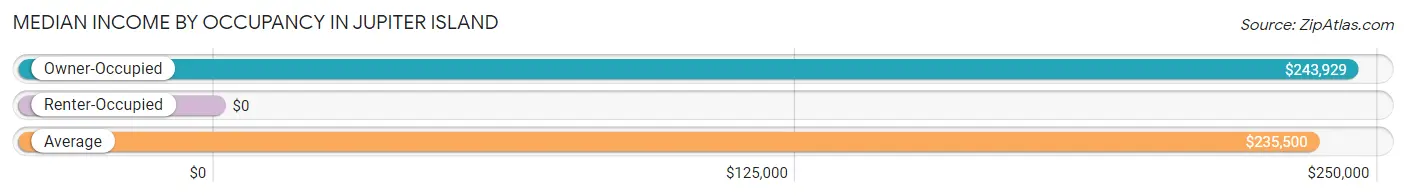
| Occupancy Type | # Households | Median Income |
| Owner-Occupied | 320 (93.6%) | $243,929 |
| Renter-Occupied | 22 (6.4%) | $0 |
| Average | 342 (100.0%) | $235,500 |
Occupancy by Householder Income Bracket in Jupiter Island
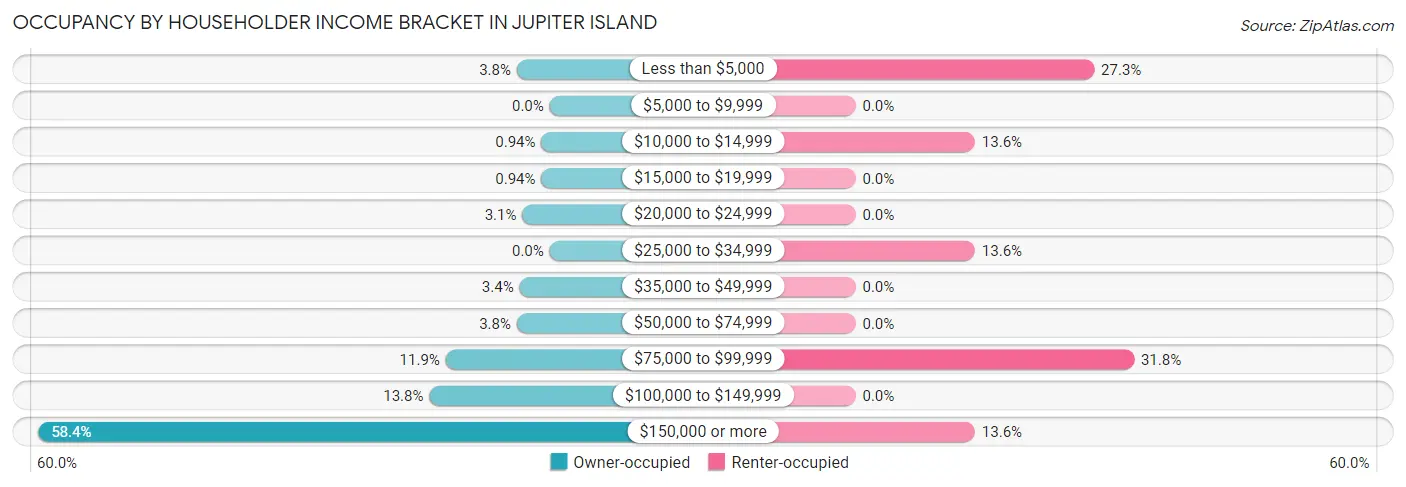
| Income Bracket | Owner-occupied | Renter-occupied |
| Less than $5,000 | 12 (3.7%) | 6 (27.3%) |
| $5,000 to $9,999 | 0 (0.0%) | 0 (0.0%) |
| $10,000 to $14,999 | 3 (0.9%) | 3 (13.6%) |
| $15,000 to $19,999 | 3 (0.9%) | 0 (0.0%) |
| $20,000 to $24,999 | 10 (3.1%) | 0 (0.0%) |
| $25,000 to $34,999 | 0 (0.0%) | 3 (13.6%) |
| $35,000 to $49,999 | 11 (3.4%) | 0 (0.0%) |
| $50,000 to $74,999 | 12 (3.7%) | 0 (0.0%) |
| $75,000 to $99,999 | 38 (11.9%) | 7 (31.8%) |
| $100,000 to $149,999 | 44 (13.8%) | 0 (0.0%) |
| $150,000 or more | 187 (58.4%) | 3 (13.6%) |
| Total | 320 (100.0%) | 22 (100.0%) |
Monthly Housing Cost Tiers in Jupiter Island
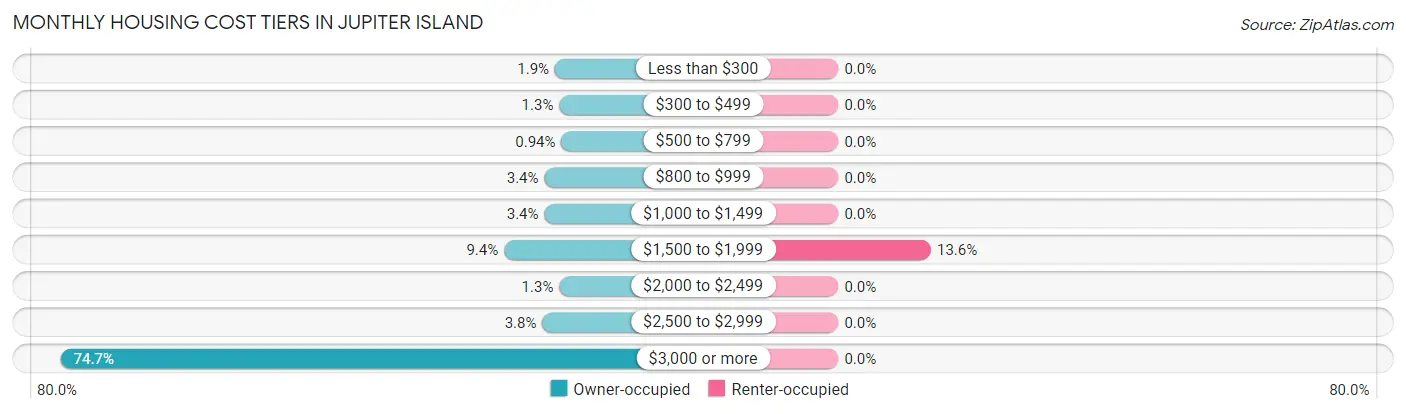
| Monthly Cost | Owner-occupied | Renter-occupied |
| Less than $300 | 6 (1.9%) | 0 (0.0%) |
| $300 to $499 | 4 (1.3%) | 0 (0.0%) |
| $500 to $799 | 3 (0.9%) | 0 (0.0%) |
| $800 to $999 | 11 (3.4%) | 0 (0.0%) |
| $1,000 to $1,499 | 11 (3.4%) | 0 (0.0%) |
| $1,500 to $1,999 | 30 (9.4%) | 3 (13.6%) |
| $2,000 to $2,499 | 4 (1.3%) | 0 (0.0%) |
| $2,500 to $2,999 | 12 (3.7%) | 0 (0.0%) |
| $3,000 or more | 239 (74.7%) | 0 (0.0%) |
| Total | 320 (100.0%) | 22 (100.0%) |
Physical Housing Characteristics in Jupiter Island
Housing Structures in Jupiter Island
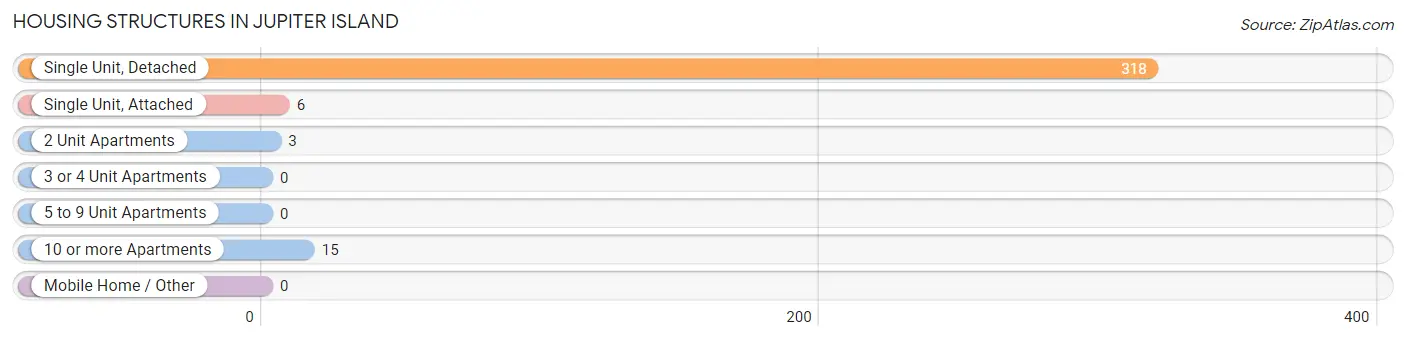
| Structure Type | # Housing Units | % Housing Units |
| Single Unit, Detached | 318 | 93.0% |
| Single Unit, Attached | 6 | 1.8% |
| 2 Unit Apartments | 3 | 0.9% |
| 3 or 4 Unit Apartments | 0 | 0.0% |
| 5 to 9 Unit Apartments | 0 | 0.0% |
| 10 or more Apartments | 15 | 4.4% |
| Mobile Home / Other | 0 | 0.0% |
| Total | 342 | 100.0% |
Housing Structures by Occupancy in Jupiter Island
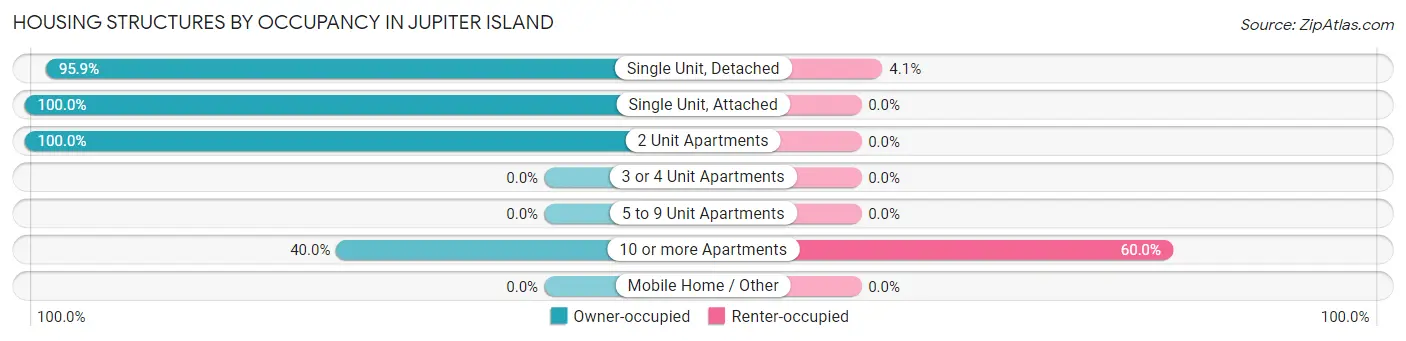
| Structure Type | Owner-occupied | Renter-occupied |
| Single Unit, Detached | 305 (95.9%) | 13 (4.1%) |
| Single Unit, Attached | 6 (100.0%) | 0 (0.0%) |
| 2 Unit Apartments | 3 (100.0%) | 0 (0.0%) |
| 3 or 4 Unit Apartments | 0 (0.0%) | 0 (0.0%) |
| 5 to 9 Unit Apartments | 0 (0.0%) | 0 (0.0%) |
| 10 or more Apartments | 6 (40.0%) | 9 (60.0%) |
| Mobile Home / Other | 0 (0.0%) | 0 (0.0%) |
| Total | 320 (93.6%) | 22 (6.4%) |
Housing Structures by Number of Rooms in Jupiter Island
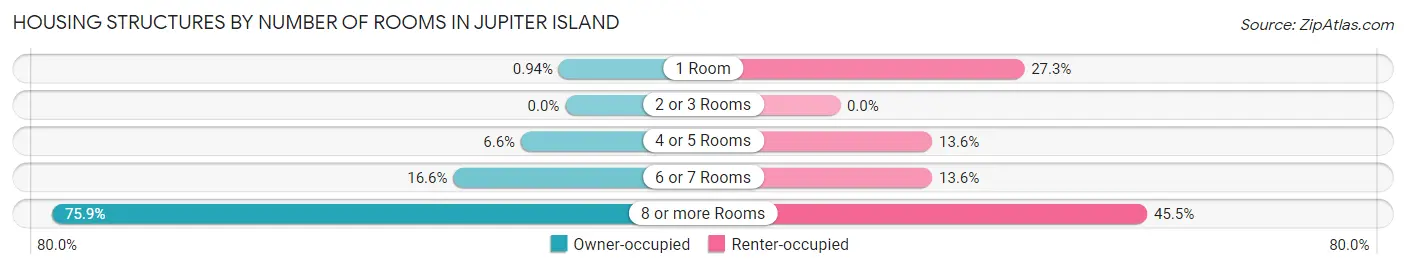
| Number of Rooms | Owner-occupied | Renter-occupied |
| 1 Room | 3 (0.9%) | 6 (27.3%) |
| 2 or 3 Rooms | 0 (0.0%) | 0 (0.0%) |
| 4 or 5 Rooms | 21 (6.6%) | 3 (13.6%) |
| 6 or 7 Rooms | 53 (16.6%) | 3 (13.6%) |
| 8 or more Rooms | 243 (75.9%) | 10 (45.5%) |
| Total | 320 (100.0%) | 22 (100.0%) |
Housing Structure by Heating Type in Jupiter Island
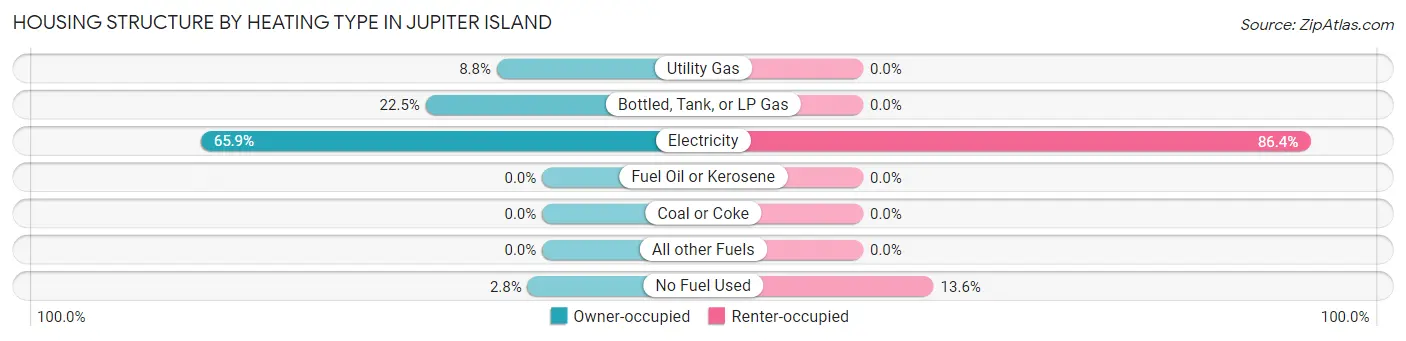
| Heating Type | Owner-occupied | Renter-occupied |
| Utility Gas | 28 (8.7%) | 0 (0.0%) |
| Bottled, Tank, or LP Gas | 72 (22.5%) | 0 (0.0%) |
| Electricity | 211 (65.9%) | 19 (86.4%) |
| Fuel Oil or Kerosene | 0 (0.0%) | 0 (0.0%) |
| Coal or Coke | 0 (0.0%) | 0 (0.0%) |
| All other Fuels | 0 (0.0%) | 0 (0.0%) |
| No Fuel Used | 9 (2.8%) | 3 (13.6%) |
| Total | 320 (100.0%) | 22 (100.0%) |
Household Vehicle Usage in Jupiter Island
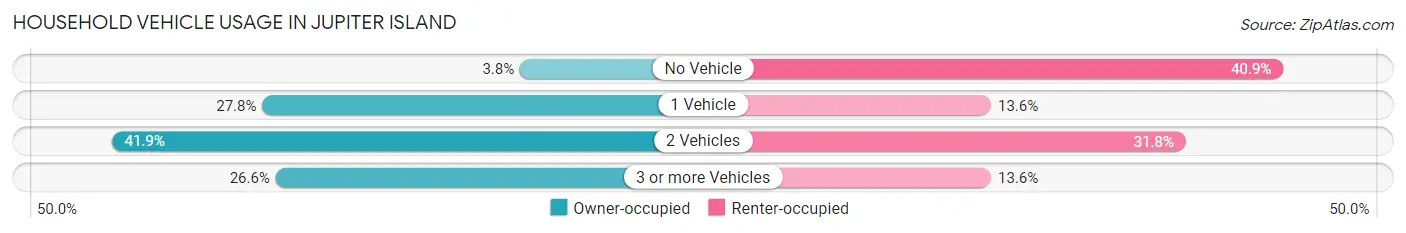
| Vehicles per Household | Owner-occupied | Renter-occupied |
| No Vehicle | 12 (3.7%) | 9 (40.9%) |
| 1 Vehicle | 89 (27.8%) | 3 (13.6%) |
| 2 Vehicles | 134 (41.9%) | 7 (31.8%) |
| 3 or more Vehicles | 85 (26.6%) | 3 (13.6%) |
| Total | 320 (100.0%) | 22 (100.0%) |
Real Estate & Mortgages in Jupiter Island
Real Estate and Mortgage Overview in Jupiter Island
| Characteristic | Without Mortgage | With Mortgage |
| Housing Units | 250 | 70 |
| Median Property Value | $2,000,001 | $2,000,001 |
| Median Household Income | $242,857 | $45 |
| Monthly Housing Costs | $1,501 | $56 |
| Real Estate Taxes | $10,001 | $0 |
Property Value by Mortgage Status in Jupiter Island
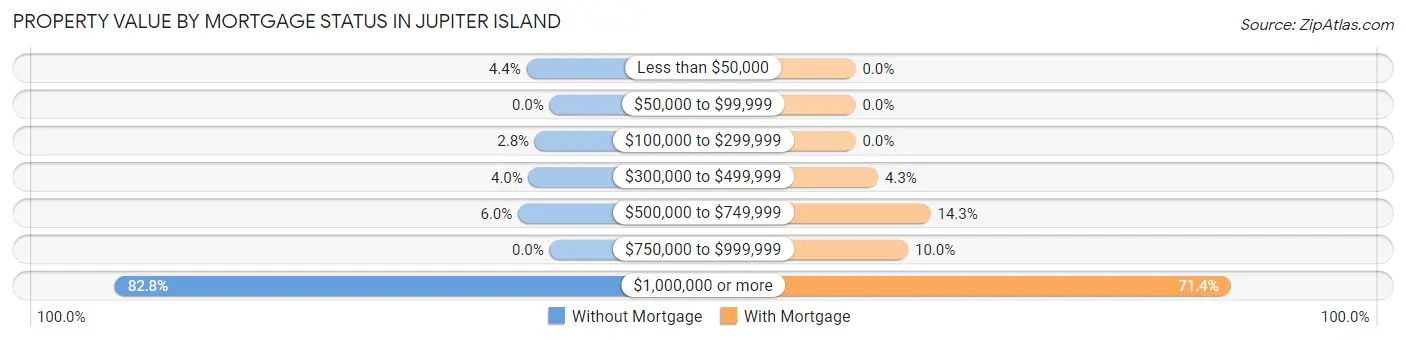
| Property Value | Without Mortgage | With Mortgage |
| Less than $50,000 | 11 (4.4%) | 0 (0.0%) |
| $50,000 to $99,999 | 0 (0.0%) | 0 (0.0%) |
| $100,000 to $299,999 | 7 (2.8%) | 0 (0.0%) |
| $300,000 to $499,999 | 10 (4.0%) | 3 (4.3%) |
| $500,000 to $749,999 | 15 (6.0%) | 10 (14.3%) |
| $750,000 to $999,999 | 0 (0.0%) | 7 (10.0%) |
| $1,000,000 or more | 207 (82.8%) | 50 (71.4%) |
| Total | 250 (100.0%) | 70 (100.0%) |
Household Income by Mortgage Status in Jupiter Island
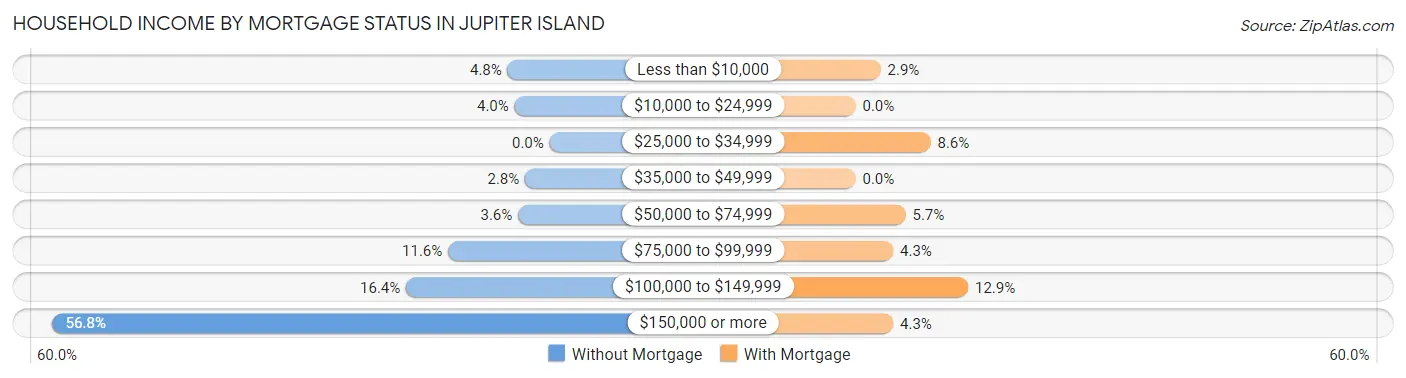
| Household Income | Without Mortgage | With Mortgage |
| Less than $10,000 | 12 (4.8%) | 2 (2.9%) |
| $10,000 to $24,999 | 10 (4.0%) | 0 (0.0%) |
| $25,000 to $34,999 | 0 (0.0%) | 6 (8.6%) |
| $35,000 to $49,999 | 7 (2.8%) | 0 (0.0%) |
| $50,000 to $74,999 | 9 (3.6%) | 4 (5.7%) |
| $75,000 to $99,999 | 29 (11.6%) | 3 (4.3%) |
| $100,000 to $149,999 | 41 (16.4%) | 9 (12.9%) |
| $150,000 or more | 142 (56.8%) | 3 (4.3%) |
| Total | 250 (100.0%) | 70 (100.0%) |
Property Value to Household Income Ratio in Jupiter Island
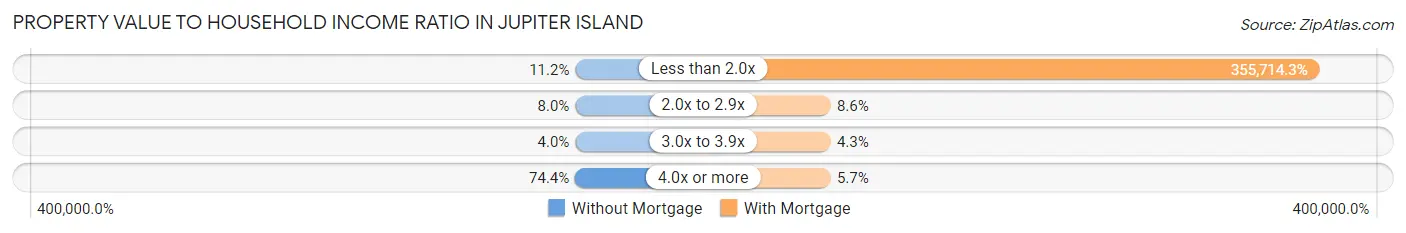
| Value-to-Income Ratio | Without Mortgage | With Mortgage |
| Less than 2.0x | 28 (11.2%) | 249,000 (355,714.3%) |
| 2.0x to 2.9x | 20 (8.0%) | 6 (8.6%) |
| 3.0x to 3.9x | 10 (4.0%) | 3 (4.3%) |
| 4.0x or more | 186 (74.4%) | 4 (5.7%) |
| Total | 250 (100.0%) | 70 (100.0%) |
Real Estate Taxes by Mortgage Status in Jupiter Island
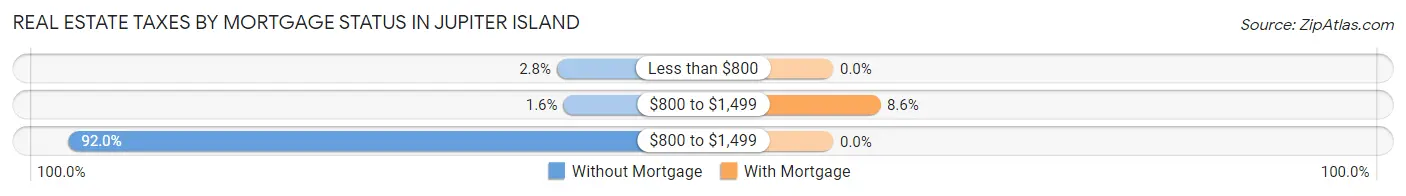
| Property Taxes | Without Mortgage | With Mortgage |
| Less than $800 | 7 (2.8%) | 0 (0.0%) |
| $800 to $1,499 | 4 (1.6%) | 6 (8.6%) |
| $800 to $1,499 | 230 (92.0%) | 0 (0.0%) |
| Total | 250 (100.0%) | 70 (100.0%) |
Health & Disability in Jupiter Island
Health Insurance Coverage by Age in Jupiter Island
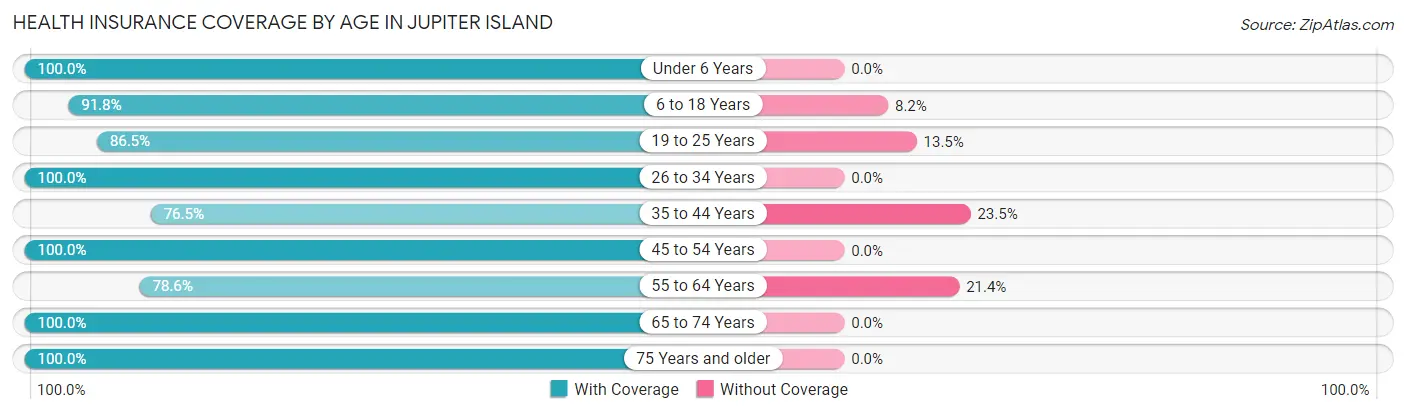
| Age Bracket | With Coverage | Without Coverage |
| Under 6 Years | 13 (100.0%) | 0 (0.0%) |
| 6 to 18 Years | 45 (91.8%) | 4 (8.2%) |
| 19 to 25 Years | 77 (86.5%) | 12 (13.5%) |
| 26 to 34 Years | 27 (100.0%) | 0 (0.0%) |
| 35 to 44 Years | 78 (76.5%) | 24 (23.5%) |
| 45 to 54 Years | 59 (100.0%) | 0 (0.0%) |
| 55 to 64 Years | 99 (78.6%) | 27 (21.4%) |
| 65 to 74 Years | 131 (100.0%) | 0 (0.0%) |
| 75 Years and older | 270 (100.0%) | 0 (0.0%) |
| Total | 799 (92.3%) | 67 (7.7%) |
Health Insurance Coverage by Citizenship Status in Jupiter Island
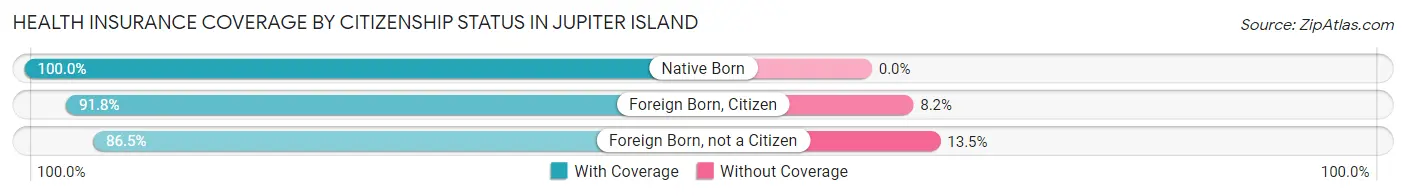
| Citizenship Status | With Coverage | Without Coverage |
| Native Born | 13 (100.0%) | 0 (0.0%) |
| Foreign Born, Citizen | 45 (91.8%) | 4 (8.2%) |
| Foreign Born, not a Citizen | 77 (86.5%) | 12 (13.5%) |
Health Insurance Coverage by Household Income in Jupiter Island
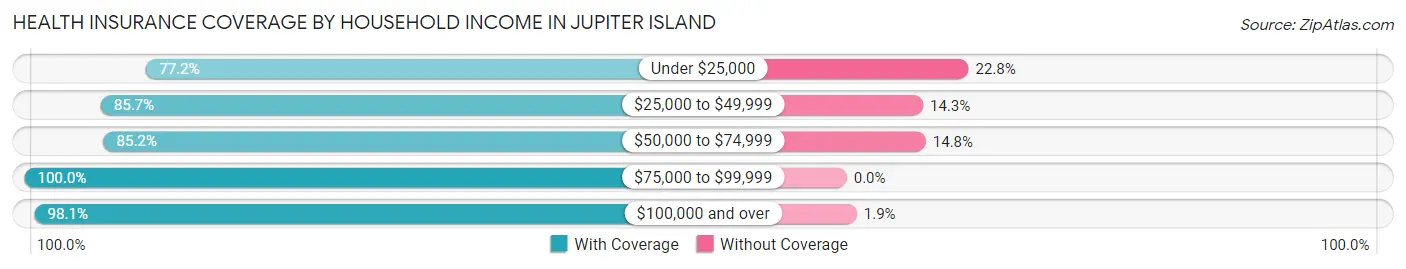
| Household Income | With Coverage | Without Coverage |
| Under $25,000 | 44 (77.2%) | 13 (22.8%) |
| $25,000 to $49,999 | 18 (85.7%) | 3 (14.3%) |
| $50,000 to $74,999 | 23 (85.2%) | 4 (14.8%) |
| $75,000 to $99,999 | 93 (100.0%) | 0 (0.0%) |
| $100,000 and over | 468 (98.1%) | 9 (1.9%) |
Public vs Private Health Insurance Coverage by Age in Jupiter Island
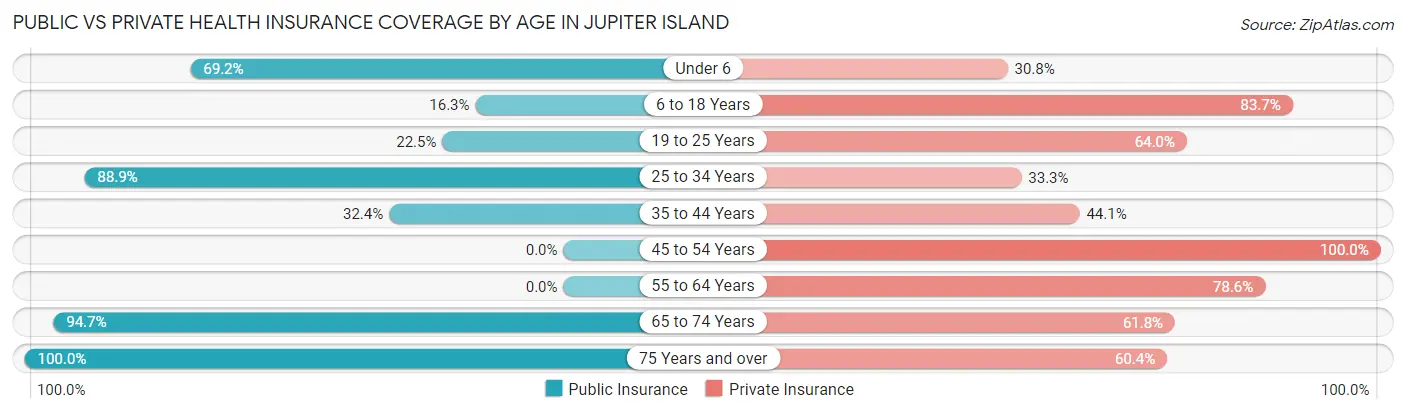
| Age Bracket | Public Insurance | Private Insurance |
| Under 6 | 9 (69.2%) | 4 (30.8%) |
| 6 to 18 Years | 8 (16.3%) | 41 (83.7%) |
| 19 to 25 Years | 20 (22.5%) | 57 (64.0%) |
| 25 to 34 Years | 24 (88.9%) | 9 (33.3%) |
| 35 to 44 Years | 33 (32.4%) | 45 (44.1%) |
| 45 to 54 Years | 0 (0.0%) | 59 (100.0%) |
| 55 to 64 Years | 0 (0.0%) | 99 (78.6%) |
| 65 to 74 Years | 124 (94.7%) | 81 (61.8%) |
| 75 Years and over | 270 (100.0%) | 163 (60.4%) |
| Total | 488 (56.4%) | 558 (64.4%) |
Disability Status by Sex by Age in Jupiter Island
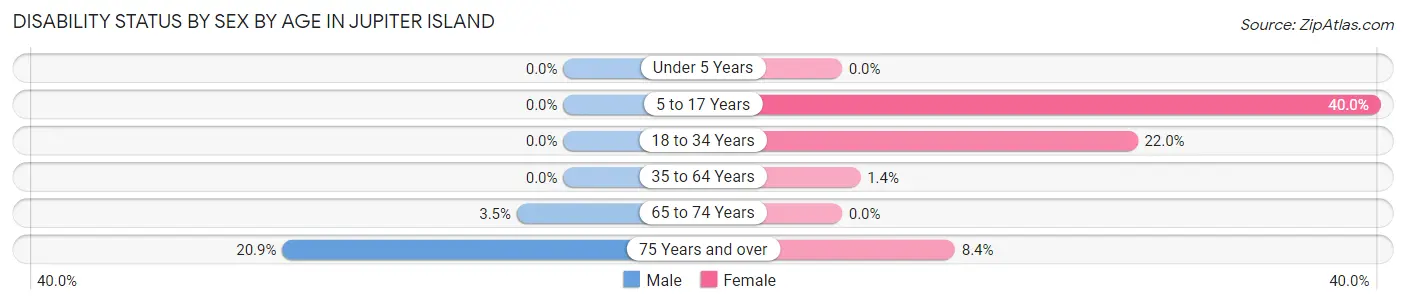
| Age Bracket | Male | Female |
| Under 5 Years | 0 (0.0%) | 0 (0.0%) |
| 5 to 17 Years | 0 (0.0%) | 8 (40.0%) |
| 18 to 34 Years | 0 (0.0%) | 18 (22.0%) |
| 35 to 64 Years | 0 (0.0%) | 2 (1.4%) |
| 65 to 74 Years | 3 (3.5%) | 0 (0.0%) |
| 75 Years and over | 24 (20.9%) | 13 (8.4%) |
Disability Class by Sex by Age in Jupiter Island
Disability Class: Hearing Difficulty
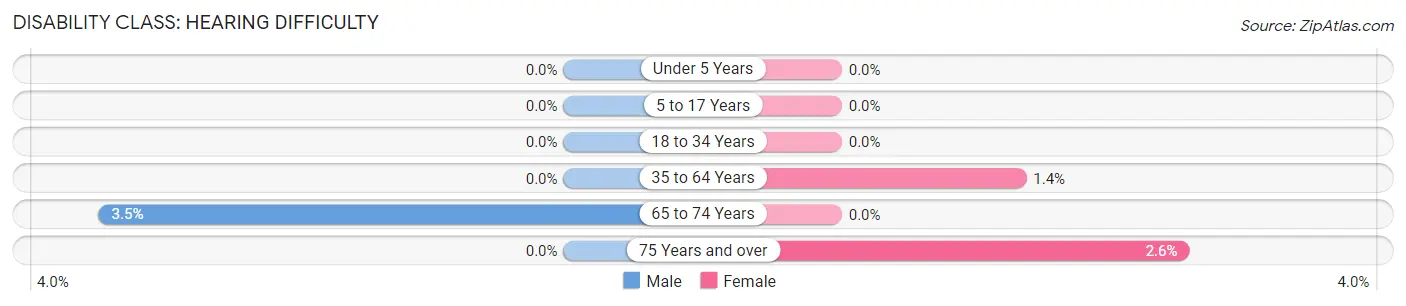
| Age Bracket | Male | Female |
| Under 5 Years | 0 (0.0%) | 0 (0.0%) |
| 5 to 17 Years | 0 (0.0%) | 0 (0.0%) |
| 18 to 34 Years | 0 (0.0%) | 0 (0.0%) |
| 35 to 64 Years | 0 (0.0%) | 2 (1.4%) |
| 65 to 74 Years | 3 (3.5%) | 0 (0.0%) |
| 75 Years and over | 0 (0.0%) | 4 (2.6%) |
Disability Class: Vision Difficulty
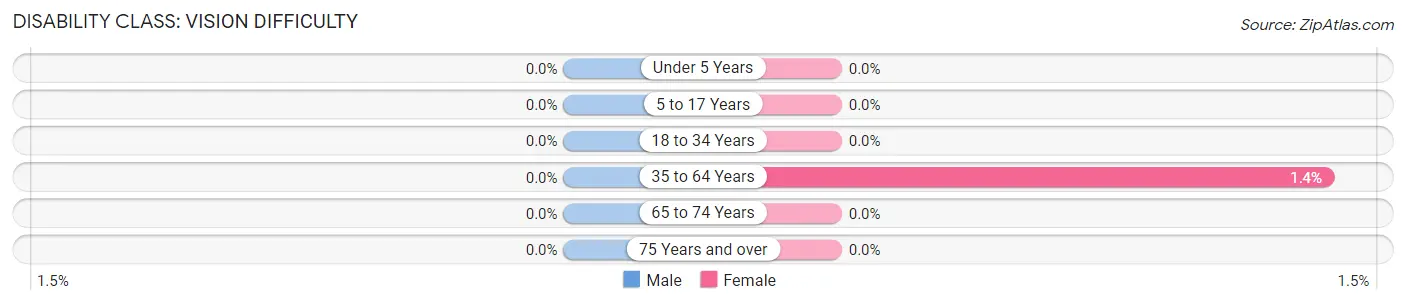
| Age Bracket | Male | Female |
| Under 5 Years | 0 (0.0%) | 0 (0.0%) |
| 5 to 17 Years | 0 (0.0%) | 0 (0.0%) |
| 18 to 34 Years | 0 (0.0%) | 0 (0.0%) |
| 35 to 64 Years | 0 (0.0%) | 2 (1.4%) |
| 65 to 74 Years | 0 (0.0%) | 0 (0.0%) |
| 75 Years and over | 0 (0.0%) | 0 (0.0%) |
Disability Class: Cognitive Difficulty
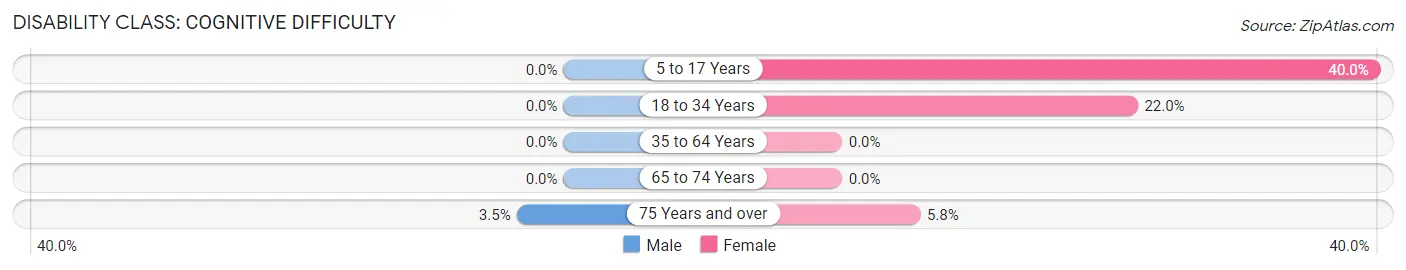
| Age Bracket | Male | Female |
| 5 to 17 Years | 0 (0.0%) | 8 (40.0%) |
| 18 to 34 Years | 0 (0.0%) | 18 (22.0%) |
| 35 to 64 Years | 0 (0.0%) | 0 (0.0%) |
| 65 to 74 Years | 0 (0.0%) | 0 (0.0%) |
| 75 Years and over | 4 (3.5%) | 9 (5.8%) |
Disability Class: Ambulatory Difficulty
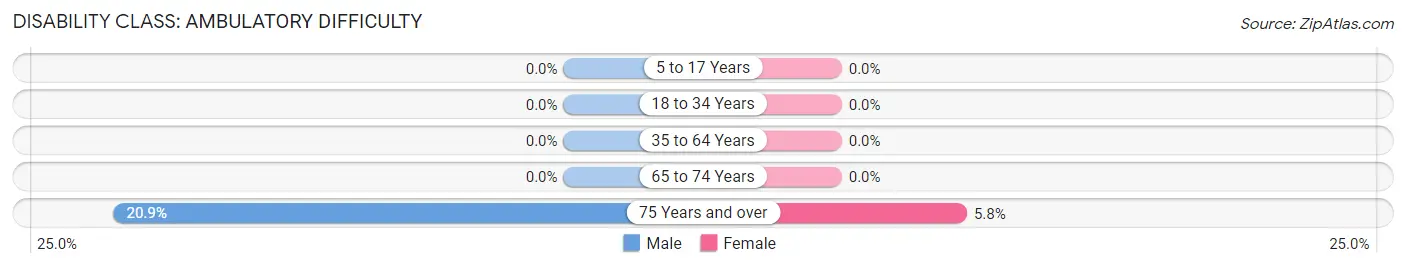
| Age Bracket | Male | Female |
| 5 to 17 Years | 0 (0.0%) | 0 (0.0%) |
| 18 to 34 Years | 0 (0.0%) | 0 (0.0%) |
| 35 to 64 Years | 0 (0.0%) | 0 (0.0%) |
| 65 to 74 Years | 0 (0.0%) | 0 (0.0%) |
| 75 Years and over | 24 (20.9%) | 9 (5.8%) |
Disability Class: Self-Care Difficulty
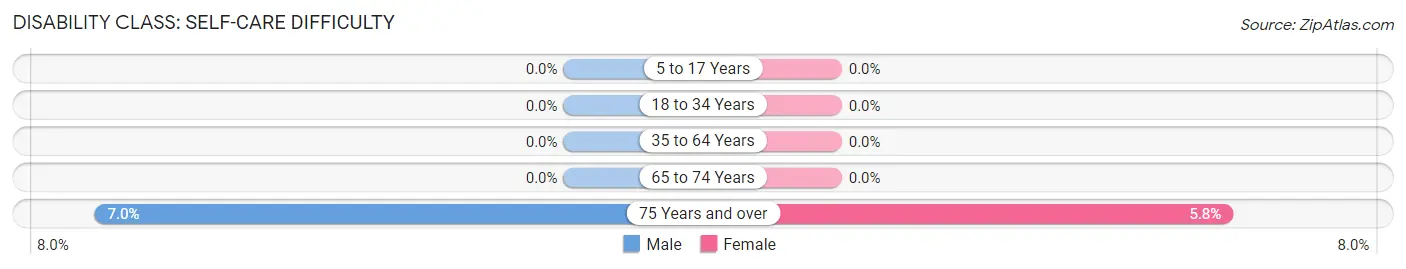
| Age Bracket | Male | Female |
| 5 to 17 Years | 0 (0.0%) | 0 (0.0%) |
| 18 to 34 Years | 0 (0.0%) | 0 (0.0%) |
| 35 to 64 Years | 0 (0.0%) | 0 (0.0%) |
| 65 to 74 Years | 0 (0.0%) | 0 (0.0%) |
| 75 Years and over | 8 (7.0%) | 9 (5.8%) |
Technology Access in Jupiter Island
Computing Device Access in Jupiter Island
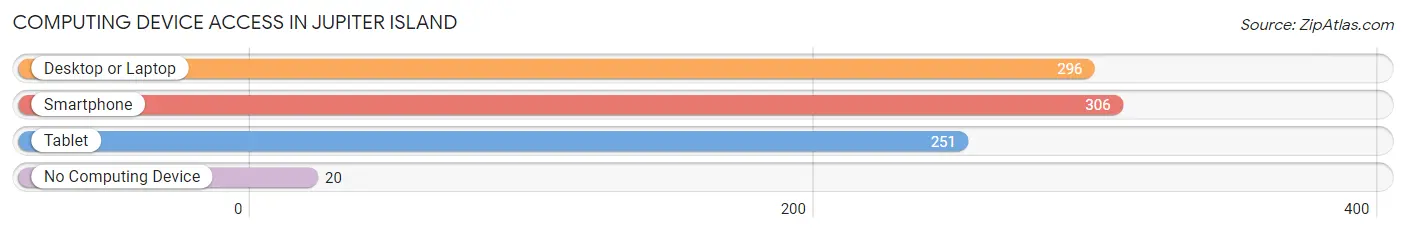
| Device Type | # Households | % Households |
| Desktop or Laptop | 296 | 86.6% |
| Smartphone | 306 | 89.5% |
| Tablet | 251 | 73.4% |
| No Computing Device | 20 | 5.9% |
| Total | 342 | 100.0% |
Internet Access in Jupiter Island
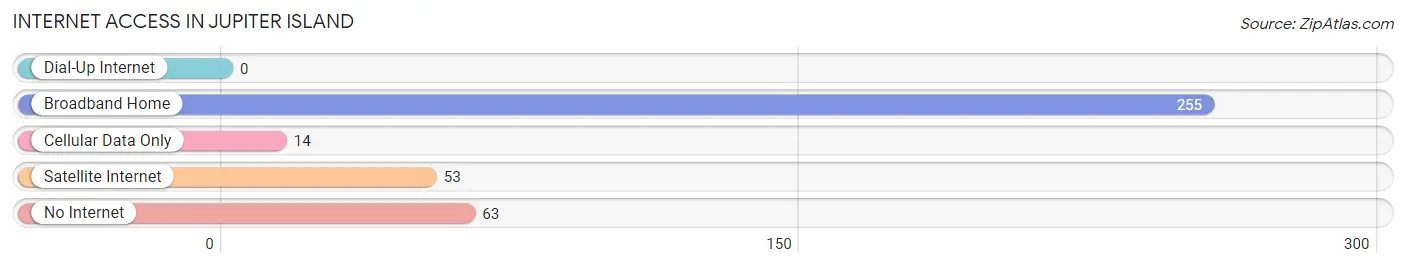
| Internet Type | # Households | % Households |
| Dial-Up Internet | 0 | 0.0% |
| Broadband Home | 255 | 74.6% |
| Cellular Data Only | 14 | 4.1% |
| Satellite Internet | 53 | 15.5% |
| No Internet | 63 | 18.4% |
| Total | 342 | 100.0% |
Jupiter Island Summary
Jupiter Island is a small, affluent town located in Martin County, Florida. It is situated on the Atlantic coast, just north of Palm Beach County. The town is known for its pristine beaches, lush vegetation, and exclusive lifestyle. It is home to some of the wealthiest people in the United States, including Tiger Woods, Celine Dion, and Burt Reynolds.
History
Jupiter Island was first inhabited by the Tequesta Indians, who lived in the area for thousands of years before the arrival of Europeans. The first Europeans to settle in the area were the Spanish, who established a mission in the area in 1565. The mission was abandoned in 1567, and the area was largely uninhabited until the late 19th century.
In 1892, a group of settlers from Jupiter, Florida, led by William and Mary Lainhart, purchased the land that would become Jupiter Island. The Lainharts built a hotel and a post office, and the area began to attract wealthy visitors from the north. In the early 20th century, the area became a popular destination for wealthy northerners looking to escape the cold winters.
In the 1920s, the town was incorporated as the Town of Jupiter Island. The town was home to a number of wealthy families, including the Flaglers, the Vanderbilts, and the DuPonts. The town was also home to a number of celebrities, including Burt Reynolds, Celine Dion, and Tiger Woods.
Geography
Jupiter Island is located on the Atlantic coast of Florida, just north of Palm Beach County. The town is situated on a barrier island, which is separated from the mainland by the Indian River Lagoon. The island is approximately 8 miles long and 1 mile wide, and is bordered by the Atlantic Ocean to the east and the Indian River Lagoon to the west.
The town is home to a number of pristine beaches, including Hobe Sound Beach, Jupiter Beach, and Juno Beach. The town is also home to a number of parks, including Jonathan Dickinson State Park and the Hobe Sound National Wildlife Refuge.
Economy
Jupiter Island has a thriving economy, which is largely driven by tourism and real estate. The town is home to a number of exclusive resorts, including the Jupiter Island Club and the Jupiter Beach Resort. The town is also home to a number of exclusive golf courses, including the Jupiter Island Golf Club and the Jupiter Country Club.
The town is also home to a number of exclusive shopping centers, including the Harbourside Place and the Jupiter Town Center. The town is also home to a number of exclusive restaurants, including the Jupiter Island Grill and the Jupiter Island Steakhouse.
Demographics
As of the 2010 census, the population of Jupiter Island was 814. The median age of the population was 57.7 years, and the median household income was $125,000. The town is predominantly white, with 92.3% of the population identifying as white. The town is also home to a small Hispanic population, with 4.3% of the population identifying as Hispanic or Latino.
Common Questions
What is Per Capita Income in Jupiter Island?
Per Capita income in Jupiter Island is $201,240.
What is the Median Family Income in Jupiter Island?
Median Family Income in Jupiter Island is $247,857.
What is the Median Household income in Jupiter Island?
Median Household Income in Jupiter Island is $235,500.
What is Income or Wage Gap in Jupiter Island?
Income or Wage Gap in Jupiter Island is 78.2%.
Women in Jupiter Island earn 21.8 cents for every dollar earned by a man.
What is Inequality or Gini Index in Jupiter Island?
Inequality or Gini Index in Jupiter Island is 0.58.
What is the Total Population of Jupiter Island?
Total Population of Jupiter Island is 866.
What is the Total Male Population of Jupiter Island?
Total Male Population of Jupiter Island is 415.
What is the Total Female Population of Jupiter Island?
Total Female Population of Jupiter Island is 451.
What is the Ratio of Males per 100 Females in Jupiter Island?
There are 92.02 Males per 100 Females in Jupiter Island.
What is the Ratio of Females per 100 Males in Jupiter Island?
There are 108.67 Females per 100 Males in Jupiter Island.
What is the Median Population Age in Jupiter Island?
Median Population Age in Jupiter Island is 61.8 Years.
What is the Average Family Size in Jupiter Island
Average Family Size in Jupiter Island is 2.3 People.
What is the Average Household Size in Jupiter Island
Average Household Size in Jupiter Island is 2.0 People.
How Large is the Labor Force in Jupiter Island?
There are 321 People in the Labor Forcein in Jupiter Island.
What is the Percentage of People in the Labor Force in Jupiter Island?
39.2% of People are in the Labor Force in Jupiter Island.
What is the Unemployment Rate in Jupiter Island?
Unemployment Rate in Jupiter Island is 28.3%.