Wacissa, FL Map & Demographics
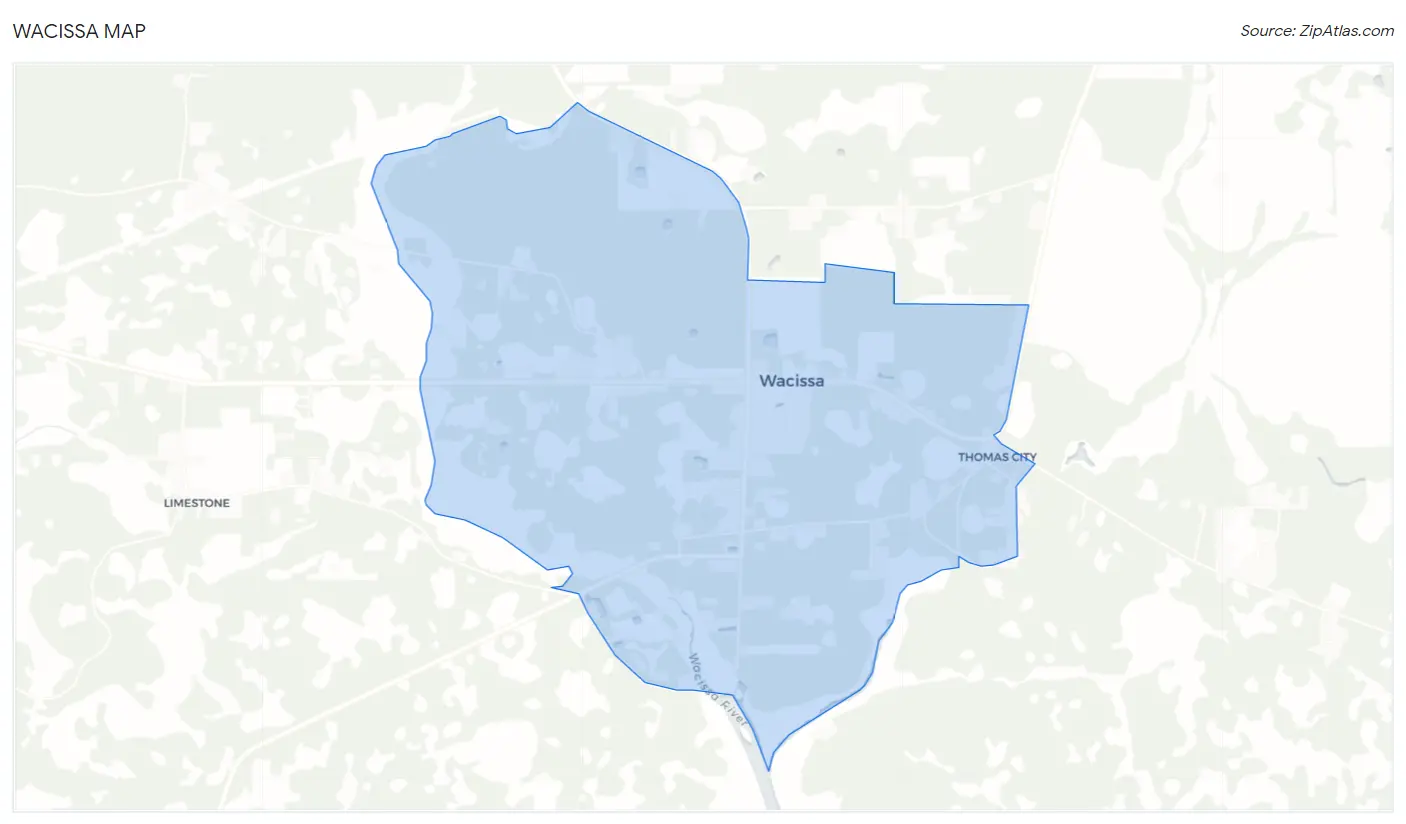
Wacissa Map
Wacissa Overview
$53,747
PER CAPITA INCOME
$34,013
AVG FAMILY INCOME
41.9%
WAGE / INCOME GAP [ % ]
58.1¢/ $1
WAGE / INCOME GAP [ $ ]
0.32
INEQUALITY / GINI INDEX
330
TOTAL POPULATION
157
MALE POPULATION
173
FEMALE POPULATION
90.75
MALES / 100 FEMALES
110.19
FEMALES / 100 MALES
60.2
MEDIAN AGE
2.4
AVG FAMILY SIZE
1.7
AVG HOUSEHOLD SIZE
177
LABOR FORCE [ PEOPLE ]
59.4%
PERCENT IN LABOR FORCE
12.4%
UNEMPLOYMENT RATE
Wacissa Zip Codes
Wacissa Area Codes
Income in Wacissa
Income Overview in Wacissa
| Characteristic | Number | Measure |
| Per Capita Income | 330 | $53,747 |
| Median Family Income | 81 | $34,013 |
| Mean Family Income | 81 | $44,574 |
| Median Household Income | 195 | $0 |
| Mean Household Income | 195 | $92,323 |
| Income Deficit | 81 | $0 |
| Wage / Income Gap (%) | 330 | 41.89% |
| Wage / Income Gap ($) | 330 | 58.11¢ per $1 |
| Gini / Inequality Index | 330 | 0.32 |
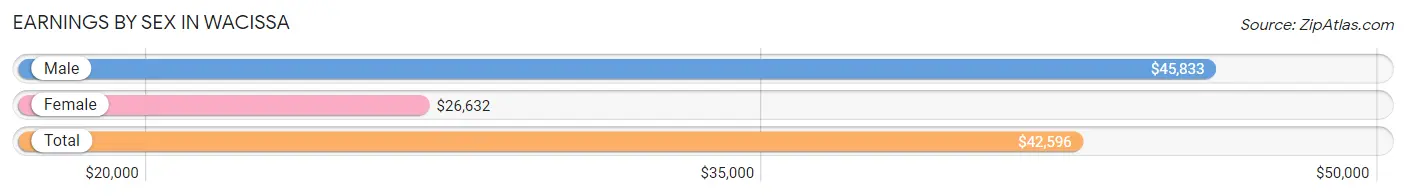
Earnings by Sex in Wacissa
Average Earnings in Wacissa are $42,596, $45,833 for men and $26,632 for women, a difference of 41.9%.
| Sex | Number | Average Earnings |
| Male | 102 (59.7%) | $45,833 |
| Female | 69 (40.4%) | $26,632 |
| Total | 171 (100.0%) | $42,596 |
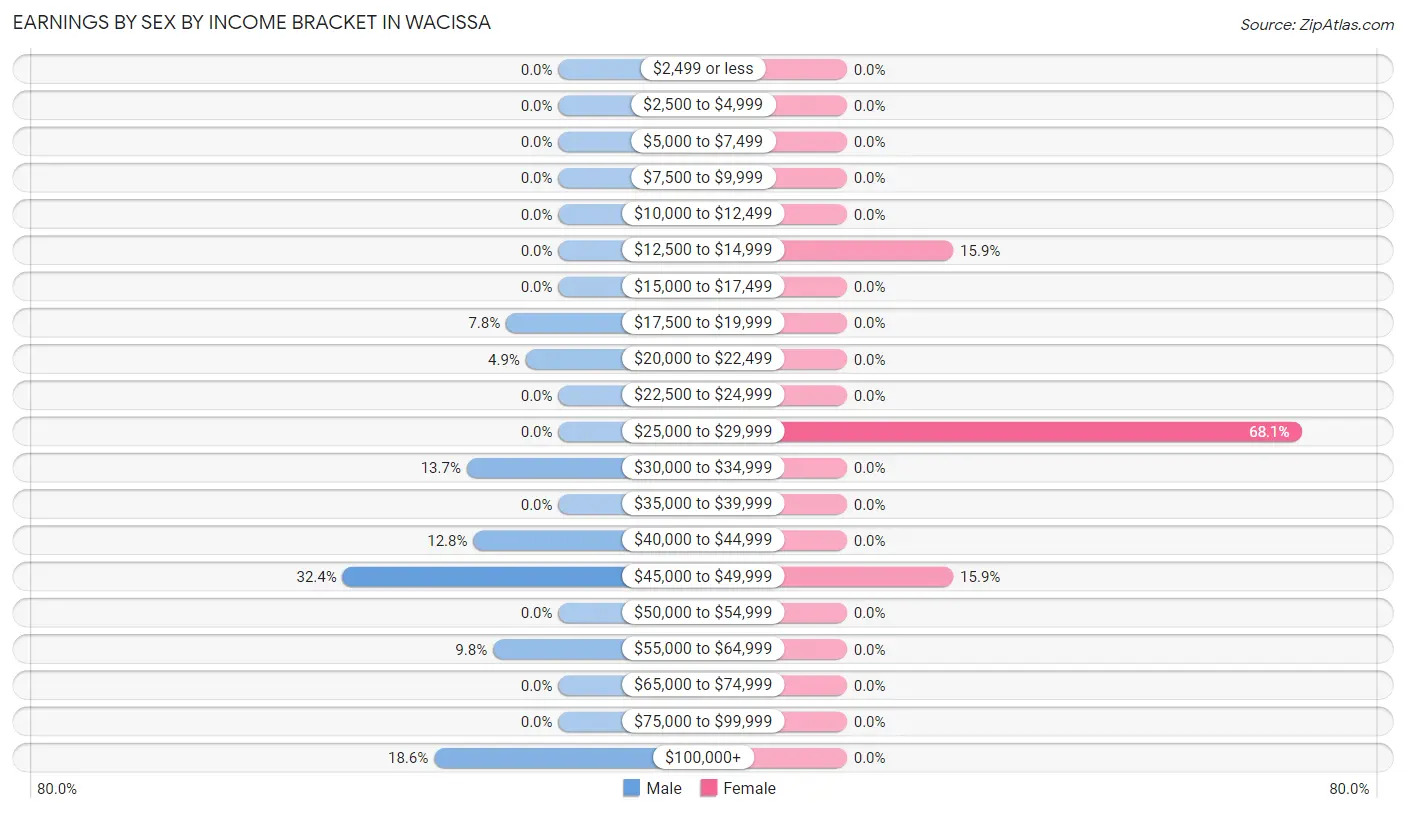
Earnings by Sex by Income Bracket in Wacissa
The most common earnings brackets in Wacissa are $45,000 to $49,999 for men (33 | 32.4%) and $25,000 to $29,999 for women (47 | 68.1%).
| Income | Male | Female |
| $2,499 or less | 0 (0.0%) | 0 (0.0%) |
| $2,500 to $4,999 | 0 (0.0%) | 0 (0.0%) |
| $5,000 to $7,499 | 0 (0.0%) | 0 (0.0%) |
| $7,500 to $9,999 | 0 (0.0%) | 0 (0.0%) |
| $10,000 to $12,499 | 0 (0.0%) | 0 (0.0%) |
| $12,500 to $14,999 | 0 (0.0%) | 11 (15.9%) |
| $15,000 to $17,499 | 0 (0.0%) | 0 (0.0%) |
| $17,500 to $19,999 | 8 (7.8%) | 0 (0.0%) |
| $20,000 to $22,499 | 5 (4.9%) | 0 (0.0%) |
| $22,500 to $24,999 | 0 (0.0%) | 0 (0.0%) |
| $25,000 to $29,999 | 0 (0.0%) | 47 (68.1%) |
| $30,000 to $34,999 | 14 (13.7%) | 0 (0.0%) |
| $35,000 to $39,999 | 0 (0.0%) | 0 (0.0%) |
| $40,000 to $44,999 | 13 (12.8%) | 0 (0.0%) |
| $45,000 to $49,999 | 33 (32.4%) | 11 (15.9%) |
| $50,000 to $54,999 | 0 (0.0%) | 0 (0.0%) |
| $55,000 to $64,999 | 10 (9.8%) | 0 (0.0%) |
| $65,000 to $74,999 | 0 (0.0%) | 0 (0.0%) |
| $75,000 to $99,999 | 0 (0.0%) | 0 (0.0%) |
| $100,000+ | 19 (18.6%) | 0 (0.0%) |
| Total | 102 (100.0%) | 69 (100.0%) |
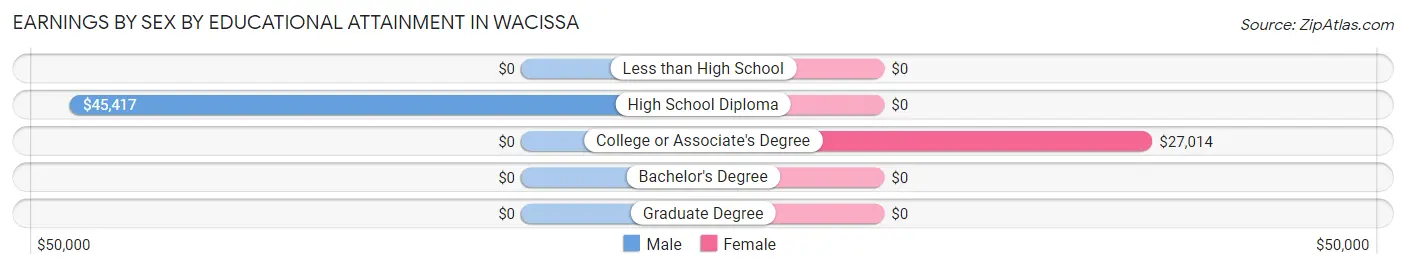
Earnings by Sex by Educational Attainment in Wacissa
Average earnings in Wacissa are $46,023 for men and $27,014 for women, a difference of 41.3%. Men with an educational attainment of high school diploma enjoy the highest average annual earnings of $45,417, while those with high school diploma education earn the least with $45,417. Women with an educational attainment of college or associate's degree earn the most with the average annual earnings of $27,014, while those with college or associate's degree education have the smallest earnings of $27,014.
| Educational Attainment | Male Income | Female Income |
| Less than High School | - | - |
| High School Diploma | $45,417 | $0 |
| College or Associate's Degree | - | - |
| Bachelor's Degree | - | - |
| Graduate Degree | - | - |
| Total | $46,023 | $27,014 |
Family Income in Wacissa
Family Income Brackets in Wacissa
According to the Wacissa family income data, there are 48 families falling into the $25,000 to $34,999 income range, which is the most common income bracket and makes up 59.3% of all families.
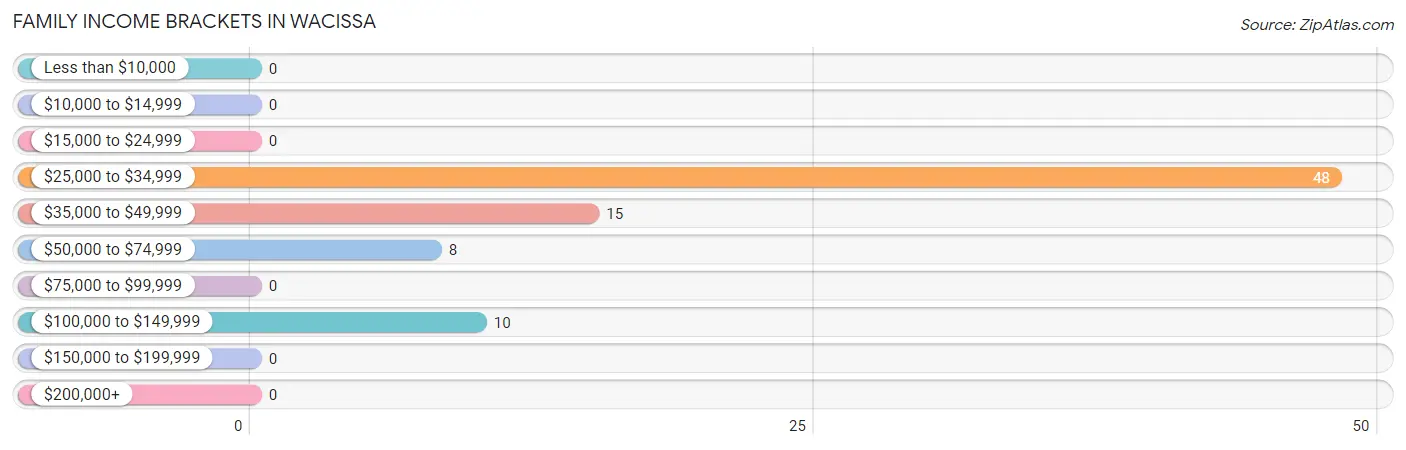
| Income Bracket | # Families | % Families |
| Less than $10,000 | 0 | 0.0% |
| $10,000 to $14,999 | 0 | 0.0% |
| $15,000 to $24,999 | 0 | 0.0% |
| $25,000 to $34,999 | 48 | 59.3% |
| $35,000 to $49,999 | 15 | 18.5% |
| $50,000 to $74,999 | 8 | 9.9% |
| $75,000 to $99,999 | 0 | 0.0% |
| $100,000 to $149,999 | 10 | 12.3% |
| $150,000 to $199,999 | 0 | 0.0% |
| $200,000+ | 0 | 0.0% |
Family Income by Famaliy Size in Wacissa
2-person families (48 | 59.3%) account for the highest median family income in Wacissa with $36,500 per family, while 2-person families (48 | 59.3%) have the highest median income of $18,250 per family member.
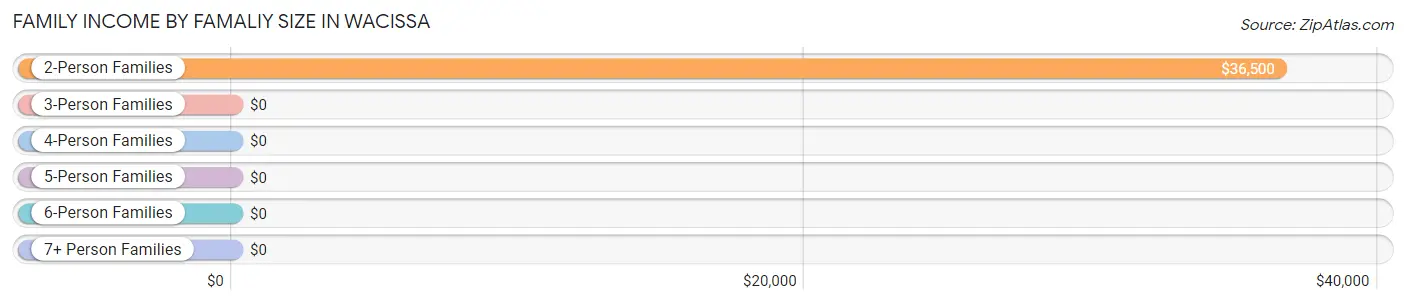
| Income Bracket | # Families | Median Income |
| 2-Person Families | 48 (59.3%) | $36,500 |
| 3-Person Families | 14 (17.3%) | $0 |
| 4-Person Families | 19 (23.5%) | $0 |
| 5-Person Families | 0 (0.0%) | $0 |
| 6-Person Families | 0 (0.0%) | $0 |
| 7+ Person Families | 0 (0.0%) | $0 |
| Total | 81 (100.0%) | $34,013 |
Family Income by Number of Earners in Wacissa
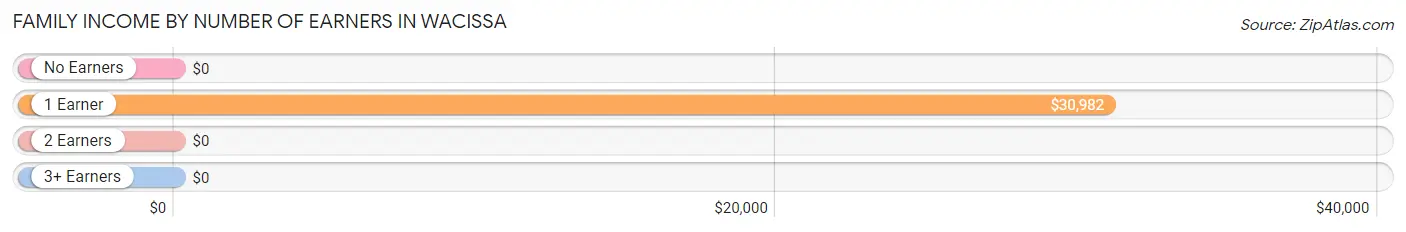
| Number of Earners | # Families | Median Income |
| No Earners | 19 (23.5%) | $0 |
| 1 Earner | 33 (40.7%) | $30,982 |
| 2 Earners | 29 (35.8%) | $0 |
| 3+ Earners | 0 (0.0%) | $0 |
| Total | 81 (100.0%) | $34,013 |
Household Income in Wacissa
Household Income Brackets in Wacissa
With 61 households falling in the category, the $100,000 to $149,999 income range is the most frequent in Wacissa, accounting for 31.3% of all households.
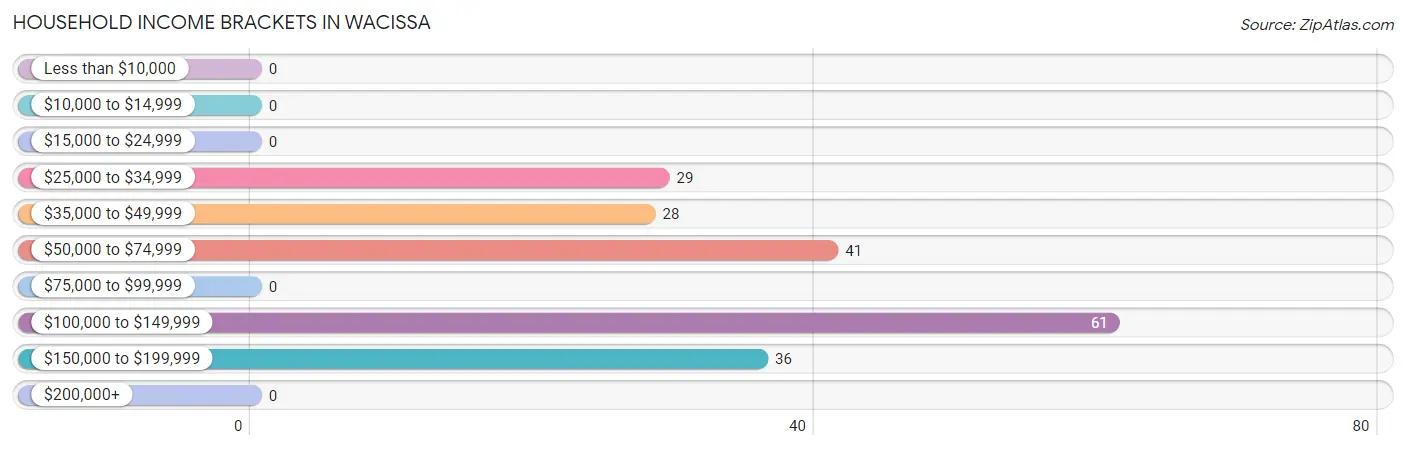
| Income Bracket | # Households | % Households |
| Less than $10,000 | 0 | 0.0% |
| $10,000 to $14,999 | 0 | 0.0% |
| $15,000 to $24,999 | 0 | 0.0% |
| $25,000 to $34,999 | 29 | 14.9% |
| $35,000 to $49,999 | 28 | 14.4% |
| $50,000 to $74,999 | 41 | 21.0% |
| $75,000 to $99,999 | 0 | 0.0% |
| $100,000 to $149,999 | 61 | 31.3% |
| $150,000 to $199,999 | 36 | 18.5% |
| $200,000+ | 0 | 0.0% |
Household Income by Householder Age in Wacissa
The median household income in Wacissa is $0, with the highest median household income of $170,521 found in the 45 to 64 years age bracket for the primary householder. A total of 57 households (29.2%) fall into this category.
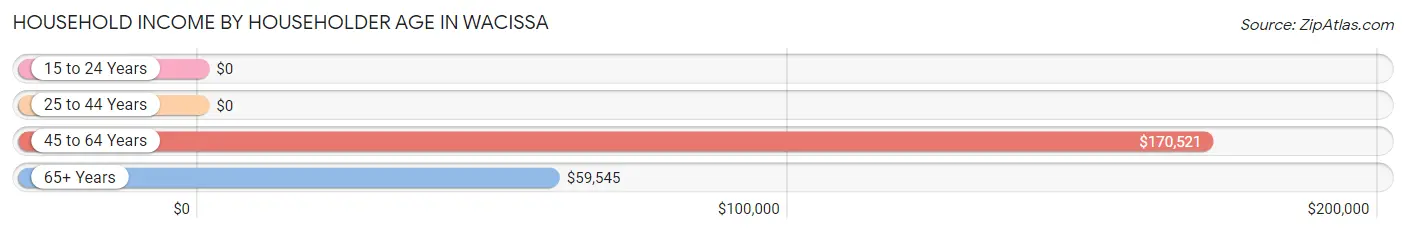
| Income Bracket | # Households | Median Income |
| 15 to 24 Years | 0 (0.0%) | $0 |
| 25 to 44 Years | 46 (23.6%) | $0 |
| 45 to 64 Years | 57 (29.2%) | $170,521 |
| 65+ Years | 92 (47.2%) | $59,545 |
| Total | 195 (100.0%) | $0 |
Poverty in Wacissa
Income Below Poverty by Sex and Age in Wacissa
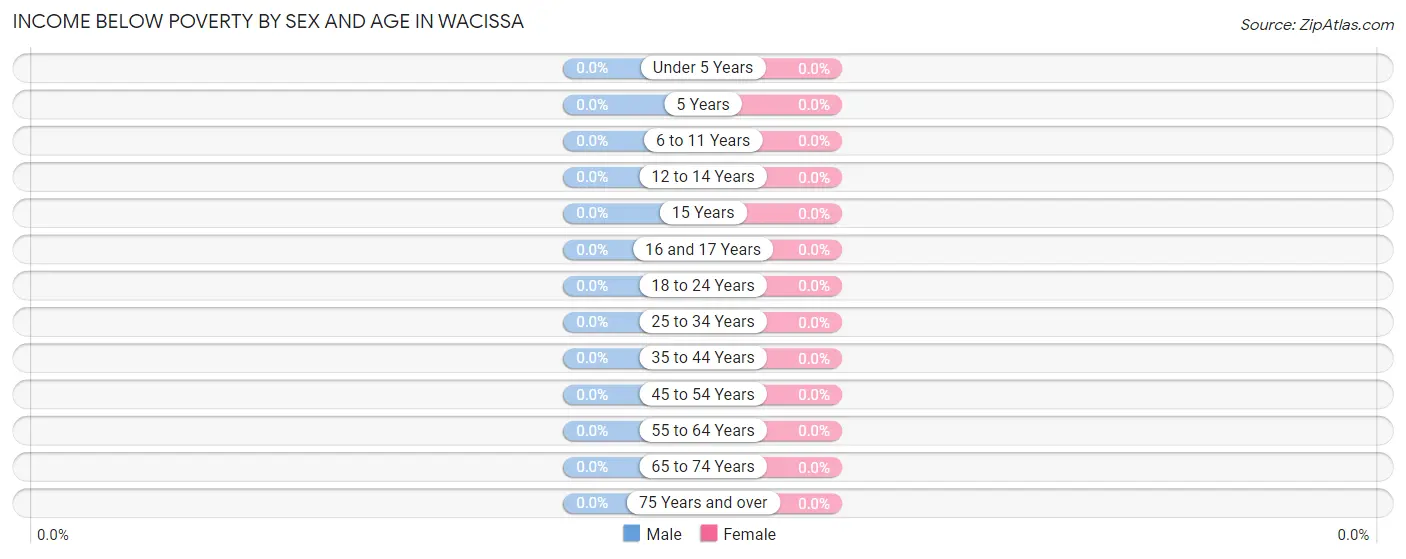
| Age Bracket | Male | Female |
| Under 5 Years | 0 (0.0%) | 0 (0.0%) |
| 5 Years | 0 (0.0%) | 0 (0.0%) |
| 6 to 11 Years | 0 (0.0%) | 0 (0.0%) |
| 12 to 14 Years | 0 (0.0%) | 0 (0.0%) |
| 15 Years | 0 (0.0%) | 0 (0.0%) |
| 16 and 17 Years | 0 (0.0%) | 0 (0.0%) |
| 18 to 24 Years | 0 (0.0%) | 0 (0.0%) |
| 25 to 34 Years | 0 (0.0%) | 0 (0.0%) |
| 35 to 44 Years | 0 (0.0%) | 0 (0.0%) |
| 45 to 54 Years | 0 (0.0%) | 0 (0.0%) |
| 55 to 64 Years | 0 (0.0%) | 0 (0.0%) |
| 65 to 74 Years | 0 (0.0%) | 0 (0.0%) |
| 75 Years and over | 0 (0.0%) | 0 (0.0%) |
| Total | 0 (0.0%) | 0 (0.0%) |
Income Above Poverty by Sex and Age in Wacissa
According to the poverty statistics in Wacissa, males aged under 5 years and females aged under 5 years are the age groups that are most secure financially, with 100.0% of males and 100.0% of females in these age groups living above the poverty line.
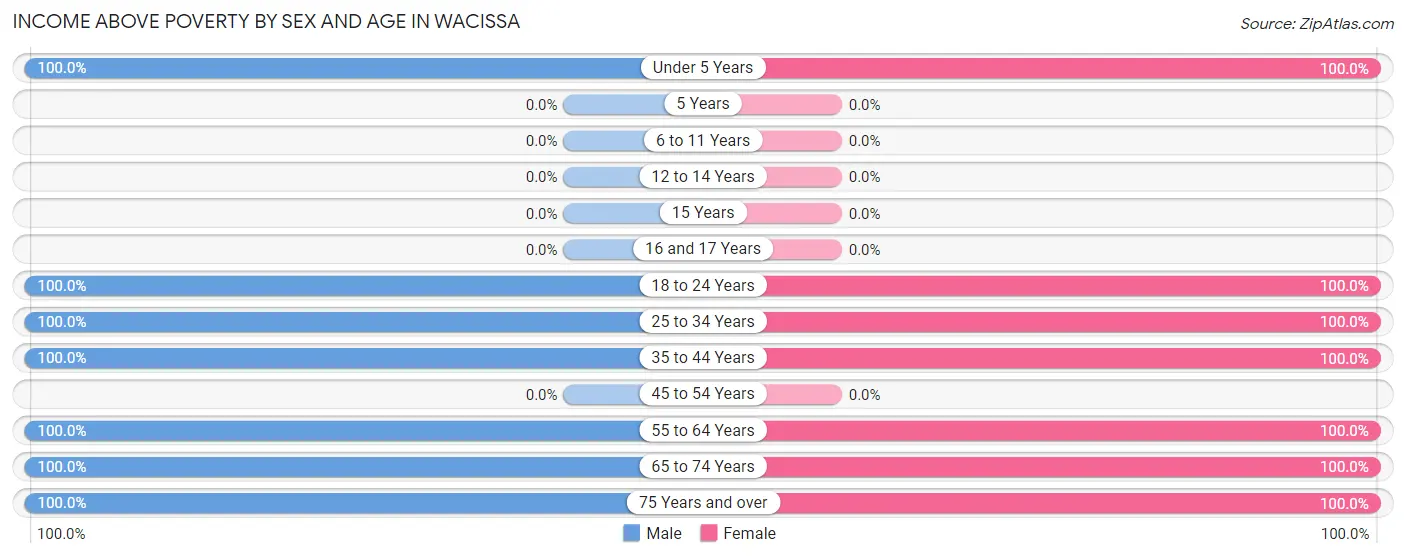
| Age Bracket | Male | Female |
| Under 5 Years | 19 (100.0%) | 13 (100.0%) |
| 5 Years | 0 (0.0%) | 0 (0.0%) |
| 6 to 11 Years | 0 (0.0%) | 0 (0.0%) |
| 12 to 14 Years | 0 (0.0%) | 0 (0.0%) |
| 15 Years | 0 (0.0%) | 0 (0.0%) |
| 16 and 17 Years | 0 (0.0%) | 0 (0.0%) |
| 18 to 24 Years | 5 (100.0%) | 11 (100.0%) |
| 25 to 34 Years | 27 (100.0%) | 13 (100.0%) |
| 35 to 44 Years | 19 (100.0%) | 25 (100.0%) |
| 45 to 54 Years | 0 (0.0%) | 0 (0.0%) |
| 55 to 64 Years | 10 (100.0%) | 58 (100.0%) |
| 65 to 74 Years | 65 (100.0%) | 13 (100.0%) |
| 75 Years and over | 12 (100.0%) | 40 (100.0%) |
| Total | 157 (100.0%) | 173 (100.0%) |
Income Below Poverty Among Married-Couple Families in Wacissa
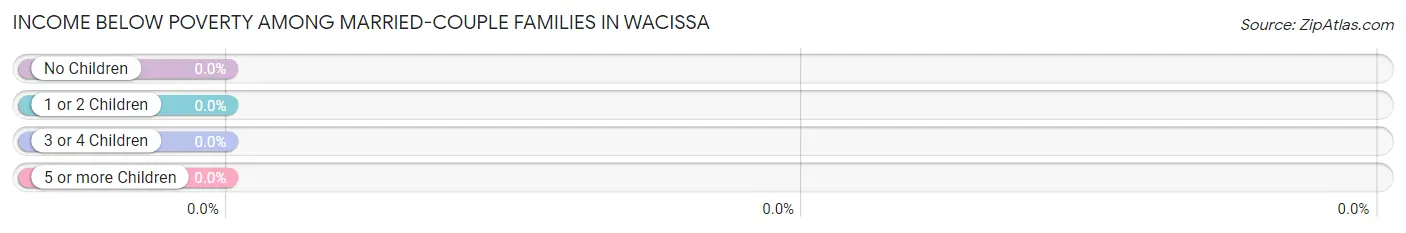
| Children | Above Poverty | Below Poverty |
| No Children | 37 (100.0%) | 0 (0.0%) |
| 1 or 2 Children | 14 (100.0%) | 0 (0.0%) |
| 3 or 4 Children | 0 (0.0%) | 0 (0.0%) |
| 5 or more Children | 0 (0.0%) | 0 (0.0%) |
| Total | 51 (100.0%) | 0 (0.0%) |
Income Below Poverty Among Single-Parent Households in Wacissa
| Children | Single Father | Single Mother |
| No Children | 0 (0.0%) | 0 (0.0%) |
| 1 or 2 Children | 0 (0.0%) | 0 (0.0%) |
| 3 or 4 Children | 0 (0.0%) | 0 (0.0%) |
| 5 or more Children | 0 (0.0%) | 0 (0.0%) |
| Total | 0 (0.0%) | 0 (0.0%) |
Income Below Poverty Among Married-Couple vs Single-Parent Households in Wacissa
| Children | Married-Couple Families | Single-Parent Households |
| No Children | 0 (0.0%) | 0 (0.0%) |
| 1 or 2 Children | 0 (0.0%) | 0 (0.0%) |
| 3 or 4 Children | 0 (0.0%) | 0 (0.0%) |
| 5 or more Children | 0 (0.0%) | 0 (0.0%) |
| Total | 0 (0.0%) | 0 (0.0%) |
Race in Wacissa
The most populous races in Wacissa are White / Caucasian (252 | 76.4%), Two or more Races (41 | 12.4%), and Black / African American (33 | 10.0%).
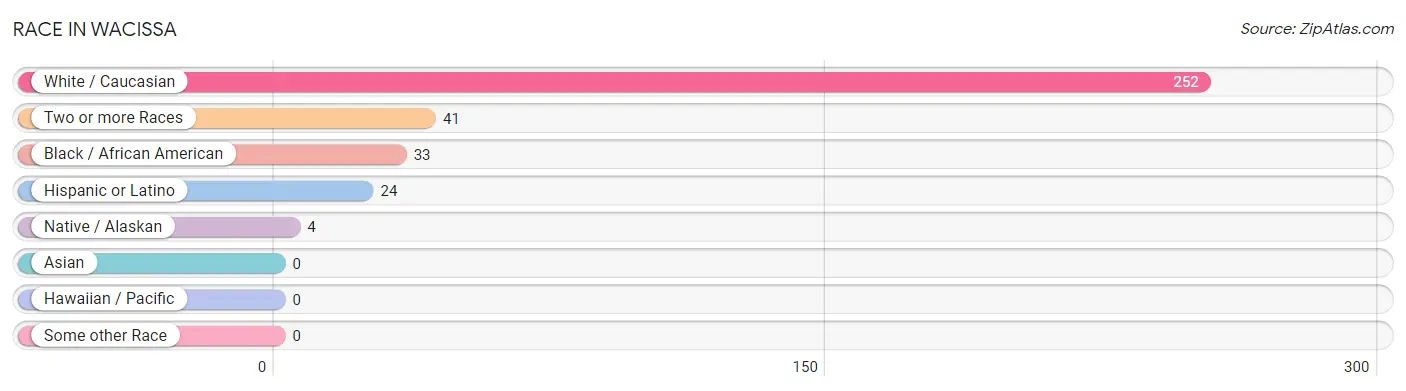
| Race | # Population | % Population |
| Asian | 0 | 0.0% |
| Black / African American | 33 | 10.0% |
| Hawaiian / Pacific | 0 | 0.0% |
| Hispanic or Latino | 24 | 7.3% |
| Native / Alaskan | 4 | 1.2% |
| White / Caucasian | 252 | 76.4% |
| Two or more Races | 41 | 12.4% |
| Some other Race | 0 | 0.0% |
| Total | 330 | 100.0% |
Ancestry in Wacissa
The most populous ancestries reported in Wacissa are Irish (111 | 33.6%), German (44 | 13.3%), Puerto Rican (24 | 7.3%), Scotch-Irish (17 | 5.1%), and English (13 | 3.9%), together accounting for 63.3% of all Wacissa residents.
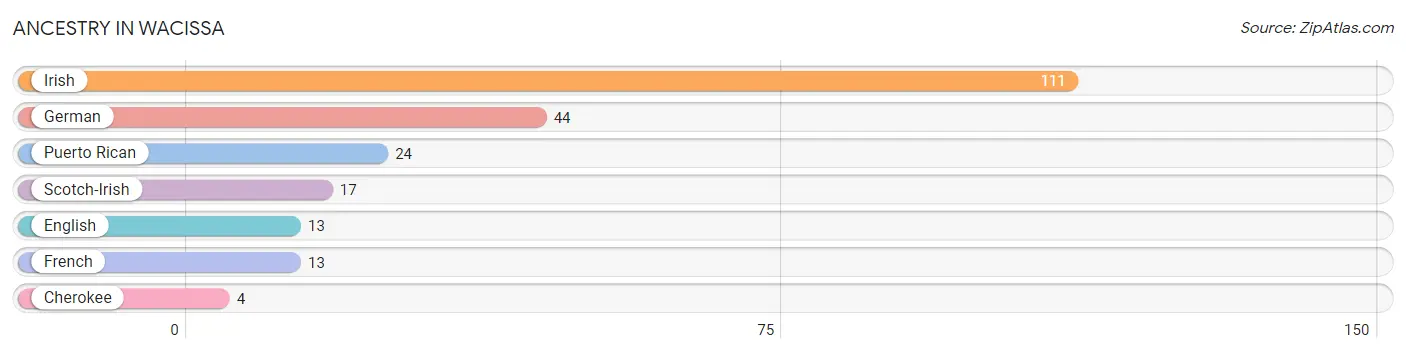
| Ancestry | # Population | % Population |
| Cherokee | 4 | 1.2% |
| English | 13 | 3.9% |
| French | 13 | 3.9% |
| German | 44 | 13.3% |
| Irish | 111 | 33.6% |
| Puerto Rican | 24 | 7.3% |
| Scotch-Irish | 17 | 5.1% | View All 7 Rows |
Immigrants in Wacissa

| Immigration Origin | # Population | % Population | View All 0 Rows |
Sex and Age in Wacissa
Sex and Age in Wacissa
The most populous age groups in Wacissa are 70 to 74 Years (33 | 21.0%) for men and 75 to 79 Years (40 | 23.1%) for women.
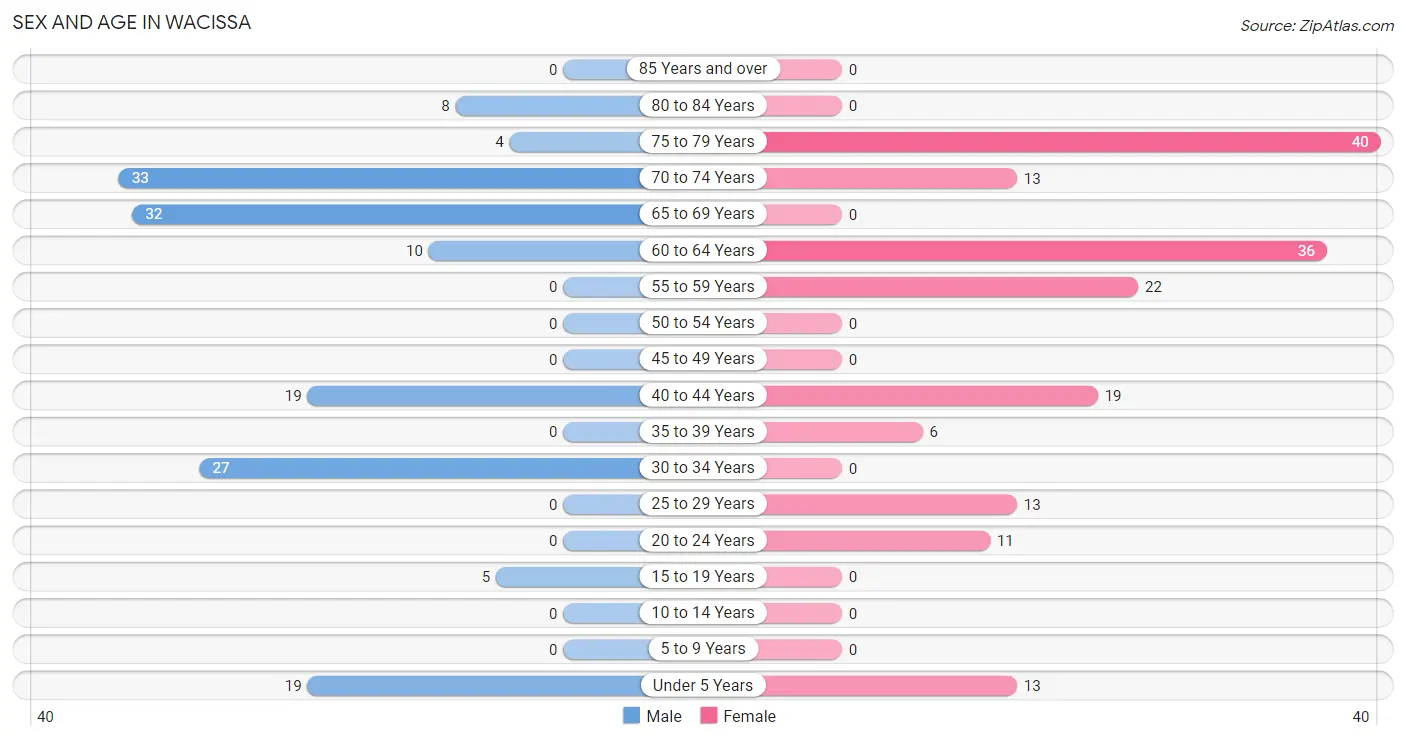
| Age Bracket | Male | Female |
| Under 5 Years | 19 (12.1%) | 13 (7.5%) |
| 5 to 9 Years | 0 (0.0%) | 0 (0.0%) |
| 10 to 14 Years | 0 (0.0%) | 0 (0.0%) |
| 15 to 19 Years | 5 (3.2%) | 0 (0.0%) |
| 20 to 24 Years | 0 (0.0%) | 11 (6.4%) |
| 25 to 29 Years | 0 (0.0%) | 13 (7.5%) |
| 30 to 34 Years | 27 (17.2%) | 0 (0.0%) |
| 35 to 39 Years | 0 (0.0%) | 6 (3.5%) |
| 40 to 44 Years | 19 (12.1%) | 19 (11.0%) |
| 45 to 49 Years | 0 (0.0%) | 0 (0.0%) |
| 50 to 54 Years | 0 (0.0%) | 0 (0.0%) |
| 55 to 59 Years | 0 (0.0%) | 22 (12.7%) |
| 60 to 64 Years | 10 (6.4%) | 36 (20.8%) |
| 65 to 69 Years | 32 (20.4%) | 0 (0.0%) |
| 70 to 74 Years | 33 (21.0%) | 13 (7.5%) |
| 75 to 79 Years | 4 (2.5%) | 40 (23.1%) |
| 80 to 84 Years | 8 (5.1%) | 0 (0.0%) |
| 85 Years and over | 0 (0.0%) | 0 (0.0%) |
| Total | 157 (100.0%) | 173 (100.0%) |
Families and Households in Wacissa
Median Family Size in Wacissa
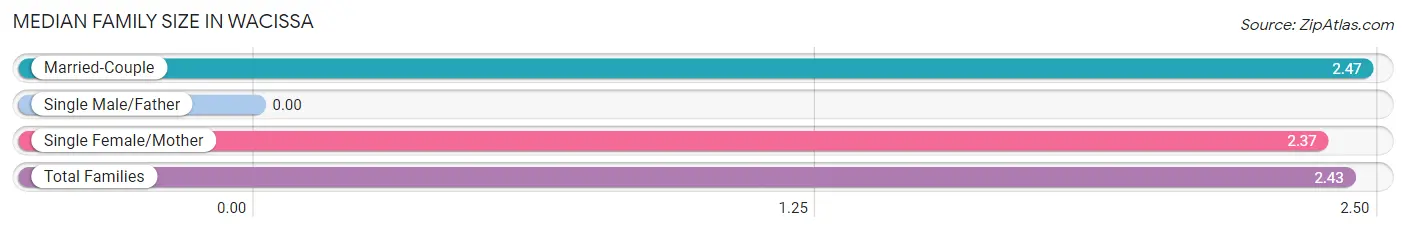
| Family Type | # Families | Family Size |
| Married-Couple | 51 (63.0%) | 2.47 |
| Single Male/Father | 0 (0.0%) | - |
| Single Female/Mother | 30 (37.0%) | 2.37 |
| Total Families | 81 (100.0%) | 2.43 |
Median Household Size in Wacissa
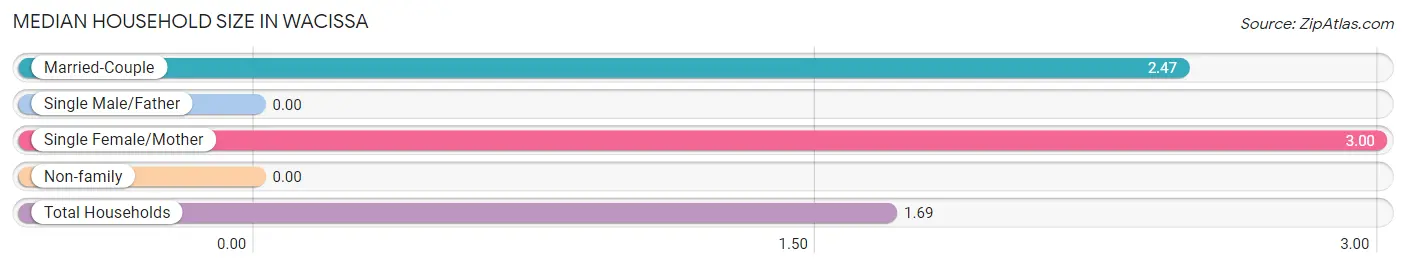
| Household Type | # Households | Household Size |
| Married-Couple | 51 (26.2%) | 2.47 |
| Single Male/Father | 0 (0.0%) | - |
| Single Female/Mother | 30 (15.4%) | 3.00 |
| Non-family | 114 (58.5%) | - |
| Total Households | 195 (100.0%) | 1.69 |
Household Size by Marriage Status in Wacissa
Out of a total of 195 households in Wacissa, 81 (41.5%) are family households, while 114 (58.5%) are nonfamily households. The most numerous type of family households are 2-person households, comprising 48, and the most common type of nonfamily households are 1-person households, comprising 114.
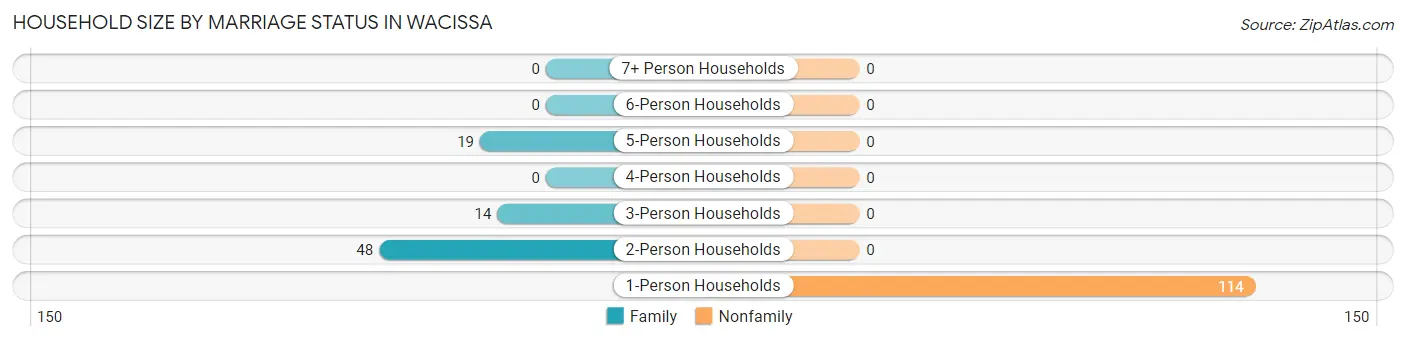
| Household Size | Family Households | Nonfamily Households |
| 1-Person Households | - | 114 (58.5%) |
| 2-Person Households | 48 (24.6%) | 0 (0.0%) |
| 3-Person Households | 14 (7.2%) | 0 (0.0%) |
| 4-Person Households | 0 (0.0%) | 0 (0.0%) |
| 5-Person Households | 19 (9.7%) | 0 (0.0%) |
| 6-Person Households | 0 (0.0%) | 0 (0.0%) |
| 7+ Person Households | 0 (0.0%) | 0 (0.0%) |
| Total | 81 (41.5%) | 114 (58.5%) |
Female Fertility in Wacissa
Fertility by Age in Wacissa
Average fertility rate in Wacissa is 224.0 births per 1,000 women. Women in the age bracket of 20 to 34 years have the highest fertility rate with 458.0 births per 1,000 women. Women in the age bracket of 20 to 34 years acount for 100.0% of all women with births.
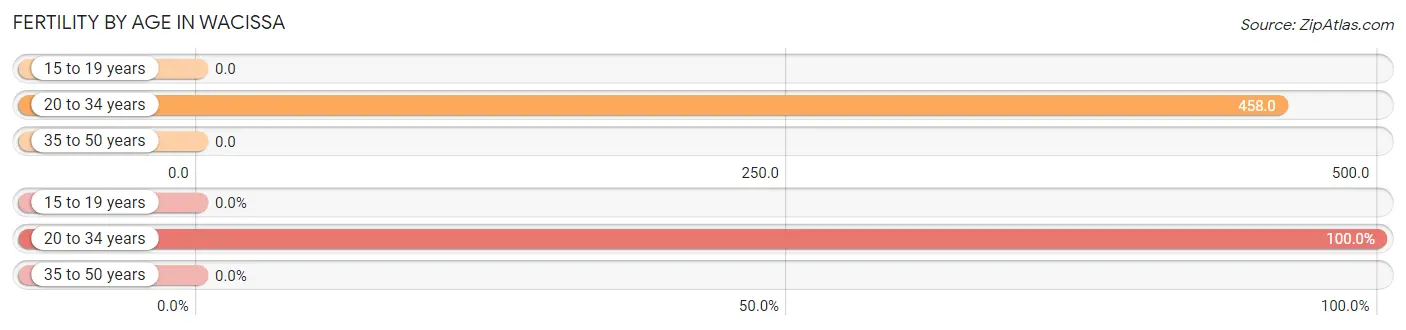
| Age Bracket | Women with Births | Births / 1,000 Women |
| 15 to 19 years | 0 (0.0%) | 0.0 |
| 20 to 34 years | 11 (100.0%) | 458.0 |
| 35 to 50 years | 0 (0.0%) | 0.0 |
| Total | 11 (100.0%) | 224.0 |
Fertility by Age by Marriage Status in Wacissa
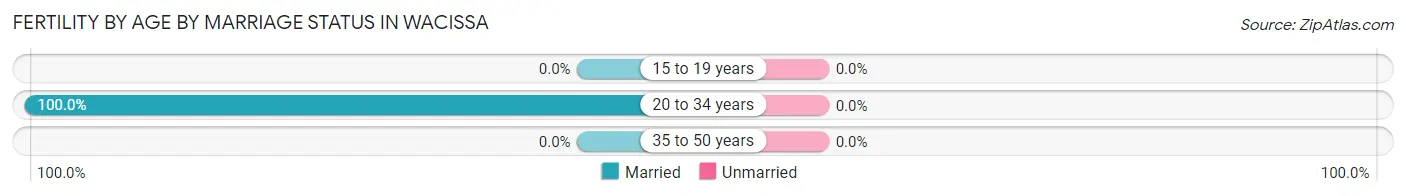
| Age Bracket | Married | Unmarried |
| 15 to 19 years | 0 (0.0%) | 0 (0.0%) |
| 20 to 34 years | 11 (100.0%) | 0 (0.0%) |
| 35 to 50 years | 0 (0.0%) | 0 (0.0%) |
| Total | 11 (100.0%) | 0 (0.0%) |
Fertility by Education in Wacissa
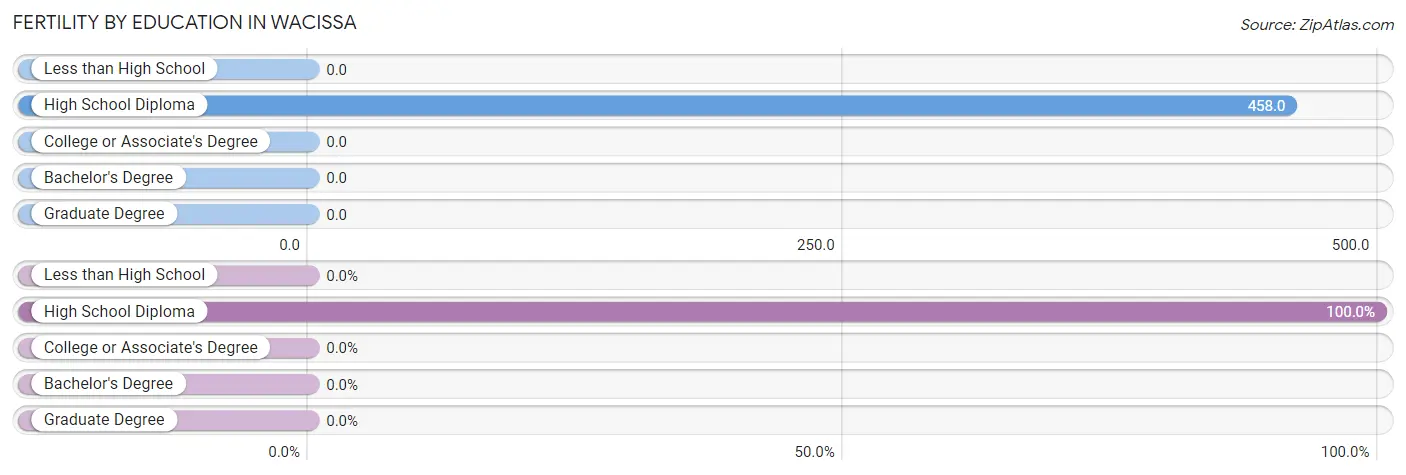
| Educational Attainment | Women with Births | Births / 1,000 Women |
| Less than High School | 0 (0.0%) | 0.0 |
| High School Diploma | 11 (100.0%) | 458.0 |
| College or Associate's Degree | 0 (0.0%) | 0.0 |
| Bachelor's Degree | 0 (0.0%) | 0.0 |
| Graduate Degree | 0 (0.0%) | 0.0 |
| Total | 11 (100.0%) | 224.0 |
Fertility by Education by Marriage Status in Wacissa
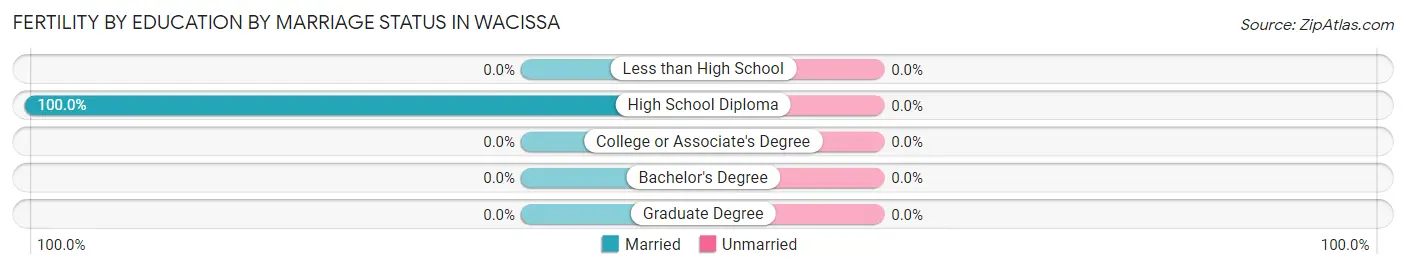
| Educational Attainment | Married | Unmarried |
| Less than High School | 0 (0.0%) | 0 (0.0%) |
| High School Diploma | 11 (100.0%) | 0 (0.0%) |
| College or Associate's Degree | 0 (0.0%) | 0 (0.0%) |
| Bachelor's Degree | 0 (0.0%) | 0 (0.0%) |
| Graduate Degree | 0 (0.0%) | 0 (0.0%) |
| Total | 11 (100.0%) | 0 (0.0%) |
Employment Characteristics in Wacissa
Employment by Class of Employer in Wacissa
Among the 155 employed individuals in Wacissa, private company employees (68 | 43.9%), self-employed (not incorporated) (57 | 36.8%), and self-employed (incorporated) (19 | 12.3%) make up the most common classes of employment.
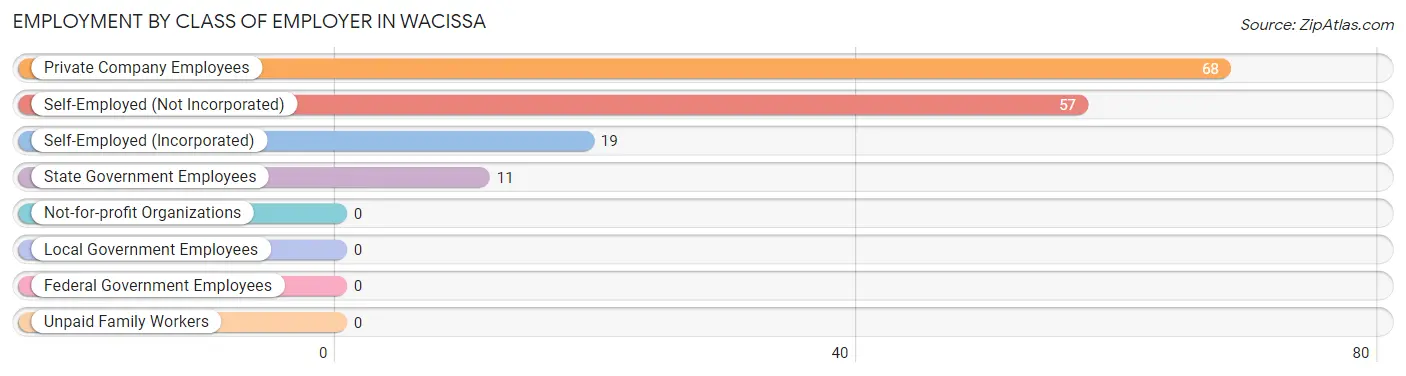
| Employer Class | # Employees | % Employees |
| Private Company Employees | 68 | 43.9% |
| Self-Employed (Incorporated) | 19 | 12.3% |
| Self-Employed (Not Incorporated) | 57 | 36.8% |
| Not-for-profit Organizations | 0 | 0.0% |
| Local Government Employees | 0 | 0.0% |
| State Government Employees | 11 | 7.1% |
| Federal Government Employees | 0 | 0.0% |
| Unpaid Family Workers | 0 | 0.0% |
| Total | 155 | 100.0% |
Employment Status by Age in Wacissa
According to the labor force statistics for Wacissa, out of the total population over 16 years of age (298), 59.4% or 177 individuals are in the labor force, with 12.4% or 22 of them unemployed. The age group with the highest labor force participation rate is 16 to 19 years, with 100.0% or 5 individuals in the labor force. Within the labor force, the 16 to 19 years age range has the highest percentage of unemployed individuals, with 100.0% or 5 of them being unemployed.
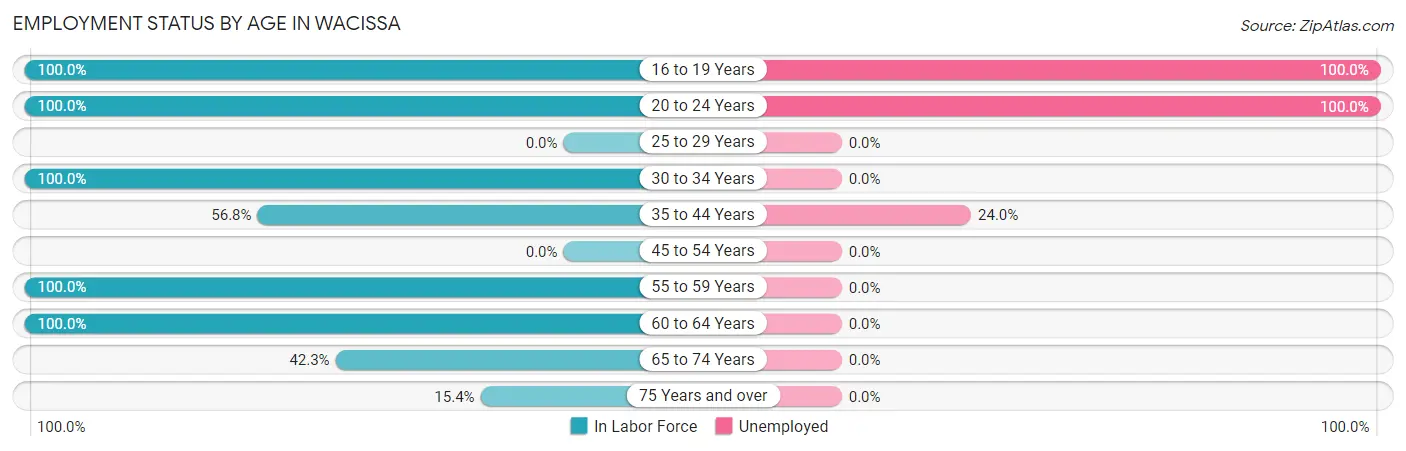
| Age Bracket | In Labor Force | Unemployed |
| 16 to 19 Years | 5 (100.0%) | 5 (100.0%) |
| 20 to 24 Years | 11 (100.0%) | 11 (100.0%) |
| 25 to 29 Years | 0 (0.0%) | 0 (0.0%) |
| 30 to 34 Years | 27 (100.0%) | 0 (0.0%) |
| 35 to 44 Years | 25 (56.8%) | 6 (24.0%) |
| 45 to 54 Years | 0 (0.0%) | 0 (0.0%) |
| 55 to 59 Years | 22 (100.0%) | 0 (0.0%) |
| 60 to 64 Years | 46 (100.0%) | 0 (0.0%) |
| 65 to 74 Years | 33 (42.3%) | 0 (0.0%) |
| 75 Years and over | 8 (15.4%) | 0 (0.0%) |
| Total | 177 (59.4%) | 22 (12.4%) |
Employment Status by Educational Attainment in Wacissa
According to labor force statistics for Wacissa, 78.9% of individuals (120) out of the total population between 25 and 64 years of age (152) are in the labor force, with 5.0% or 6 of them being unemployed. The group with the highest labor force participation rate are those with the educational attainment of college / associate degree, with 100.0% or 68 individuals in the labor force. Within the labor force, individuals with less than high school education have the highest percentage of unemployment, with 24.0% or 6 of them being unemployed.
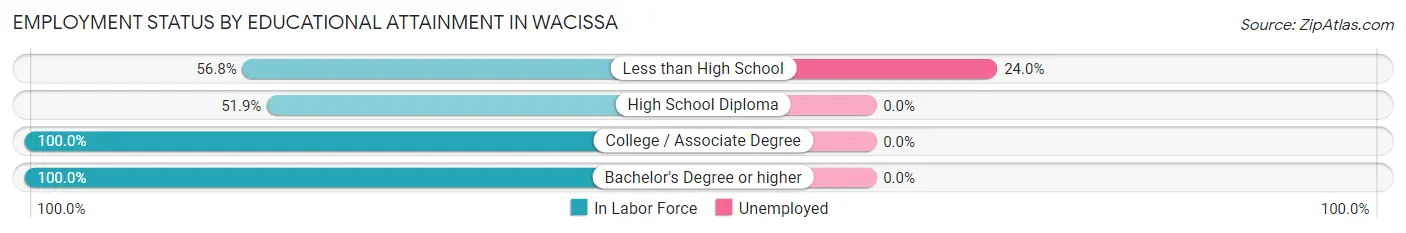
| Educational Attainment | In Labor Force | Unemployed |
| Less than High School | 25 (56.8%) | 11 (24.0%) |
| High School Diploma | 14 (51.9%) | 0 (0.0%) |
| College / Associate Degree | 68 (100.0%) | 0 (0.0%) |
| Bachelor's Degree or higher | 13 (100.0%) | 0 (0.0%) |
| Total | 120 (78.9%) | 8 (5.0%) |
Employment Occupations by Sex in Wacissa
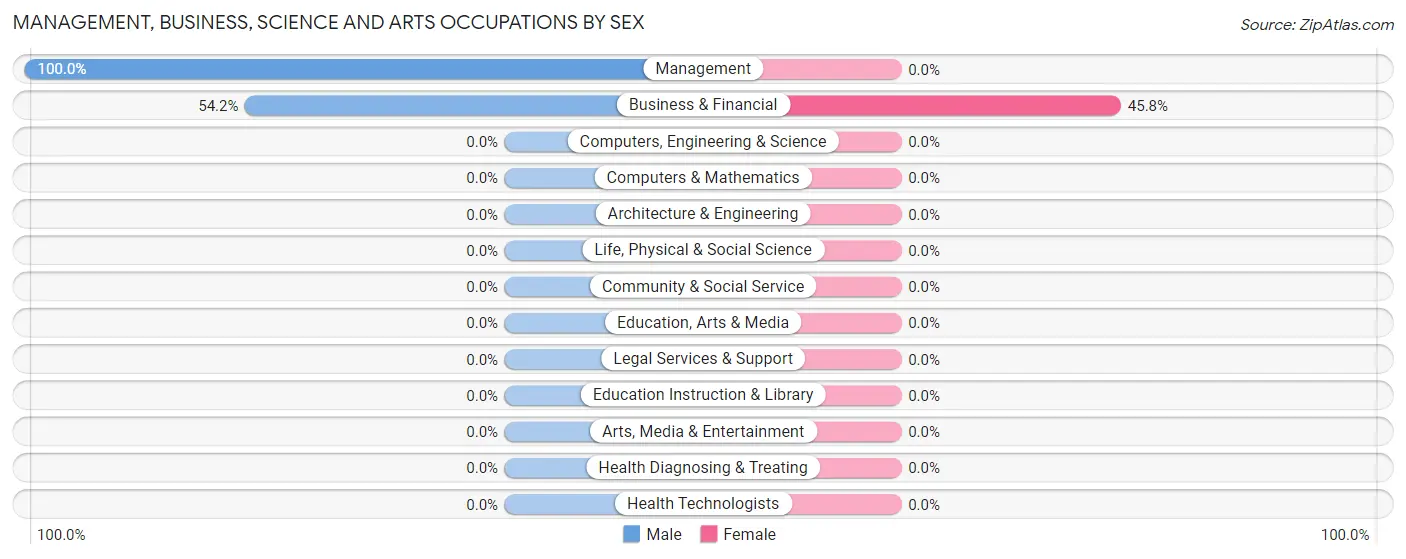
Management, Business, Science and Arts Occupations
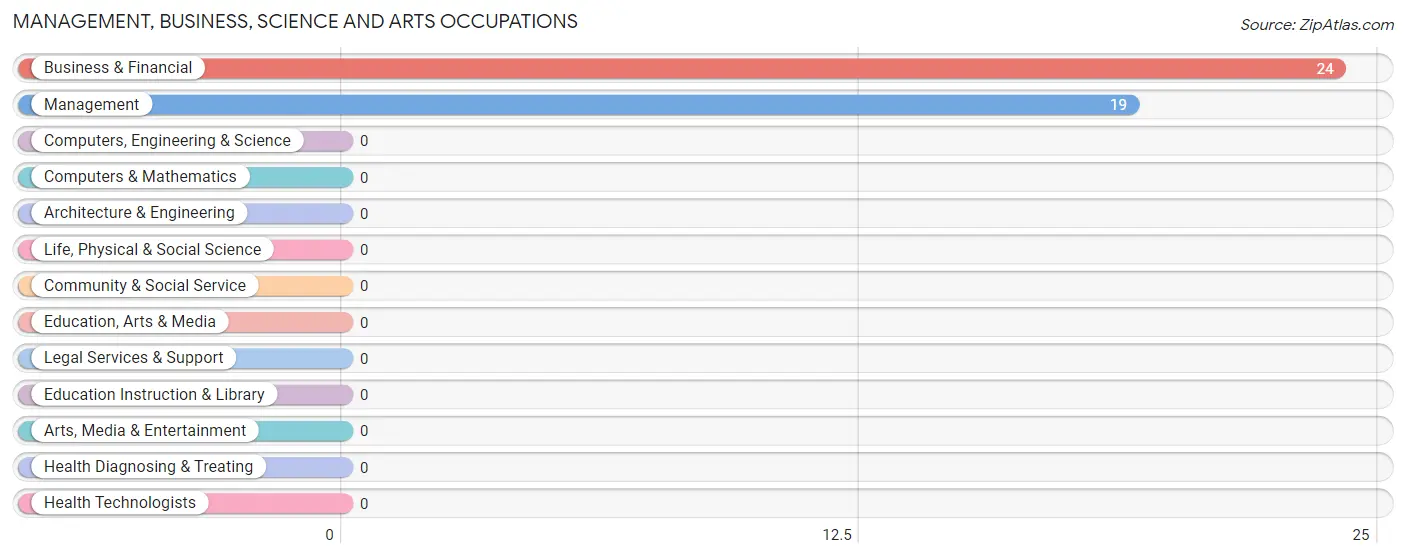
The most common Management, Business, Science and Arts occupations in Wacissa are Business & Financial (24 | 15.5%), and Management (19 | 12.3%).
Management, Business, Science and Arts Occupations by Sex
| Occupation | Male | Female |
| Management | 19 (100.0%) | 0 (0.0%) |
| Business & Financial | 13 (54.2%) | 11 (45.8%) |
| Computers, Engineering & Science | 0 (0.0%) | 0 (0.0%) |
| Computers & Mathematics | 0 (0.0%) | 0 (0.0%) |
| Architecture & Engineering | 0 (0.0%) | 0 (0.0%) |
| Life, Physical & Social Science | 0 (0.0%) | 0 (0.0%) |
| Community & Social Service | 0 (0.0%) | 0 (0.0%) |
| Education, Arts & Media | 0 (0.0%) | 0 (0.0%) |
| Legal Services & Support | 0 (0.0%) | 0 (0.0%) |
| Education Instruction & Library | 0 (0.0%) | 0 (0.0%) |
| Arts, Media & Entertainment | 0 (0.0%) | 0 (0.0%) |
| Health Diagnosing & Treating | 0 (0.0%) | 0 (0.0%) |
| Health Technologists | 0 (0.0%) | 0 (0.0%) |
| Total (Category) | 32 (74.4%) | 11 (25.6%) |
| Total (Overall) | 97 (62.6%) | 58 (37.4%) |
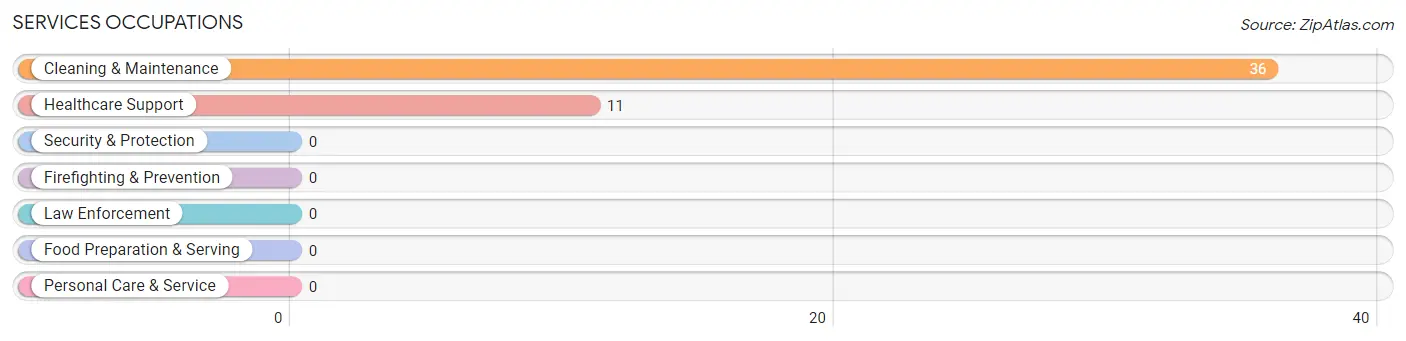
Services Occupations
The most common Services occupations in Wacissa are Cleaning & Maintenance (36 | 23.2%), and Healthcare Support (11 | 7.1%).
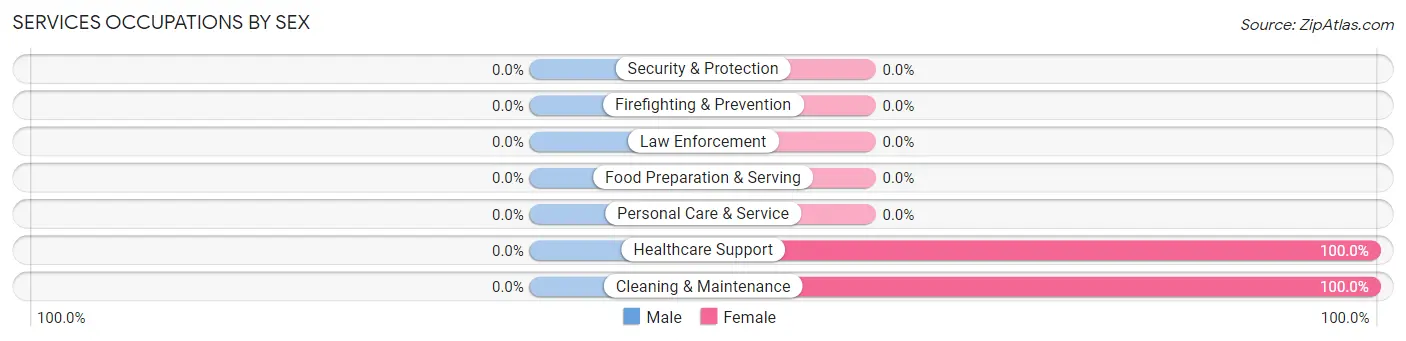
Services Occupations by Sex
| Occupation | Male | Female |
| Healthcare Support | 0 (0.0%) | 11 (100.0%) |
| Security & Protection | 0 (0.0%) | 0 (0.0%) |
| Firefighting & Prevention | 0 (0.0%) | 0 (0.0%) |
| Law Enforcement | 0 (0.0%) | 0 (0.0%) |
| Food Preparation & Serving | 0 (0.0%) | 0 (0.0%) |
| Cleaning & Maintenance | 0 (0.0%) | 36 (100.0%) |
| Personal Care & Service | 0 (0.0%) | 0 (0.0%) |
| Total (Category) | 0 (0.0%) | 47 (100.0%) |
| Total (Overall) | 97 (62.6%) | 58 (37.4%) |
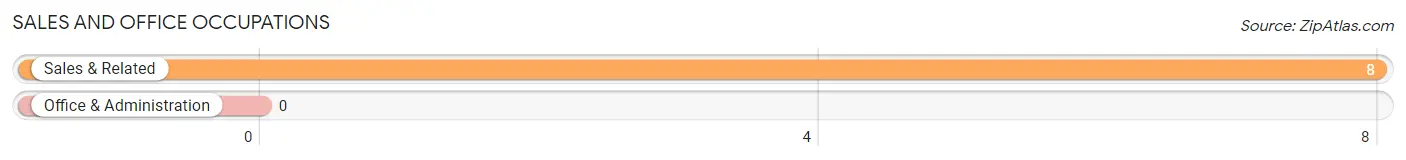
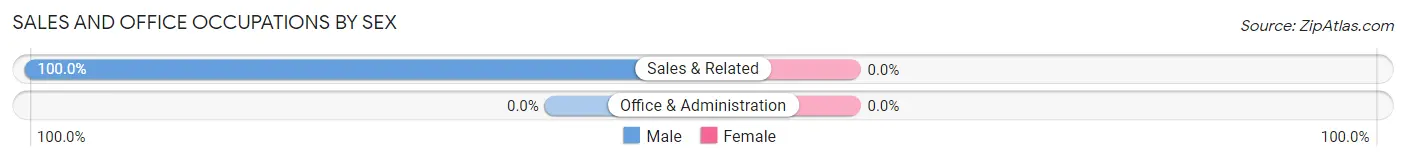
Sales and Office Occupations
The most common Sales and Office occupations in Wacissa are , and Sales & Related (8 | 5.2%).
Sales and Office Occupations by Sex
| Occupation | Male | Female |
| Sales & Related | 8 (100.0%) | 0 (0.0%) |
| Office & Administration | 0 (0.0%) | 0 (0.0%) |
| Total (Category) | 8 (100.0%) | 0 (0.0%) |
| Total (Overall) | 97 (62.6%) | 58 (37.4%) |
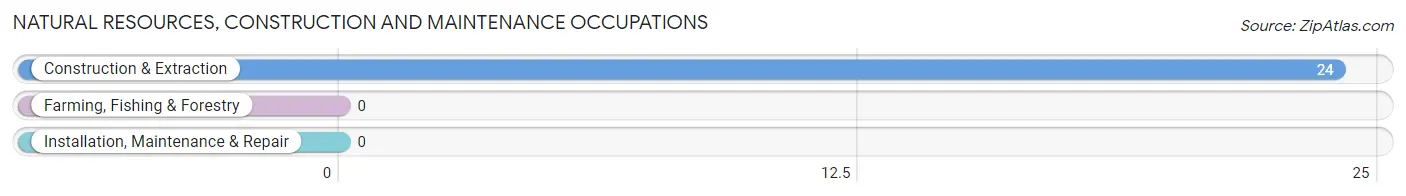
Natural Resources, Construction and Maintenance Occupations
The most common Natural Resources, Construction and Maintenance occupations in Wacissa are , and Construction & Extraction (24 | 15.5%).
Natural Resources, Construction and Maintenance Occupations by Sex
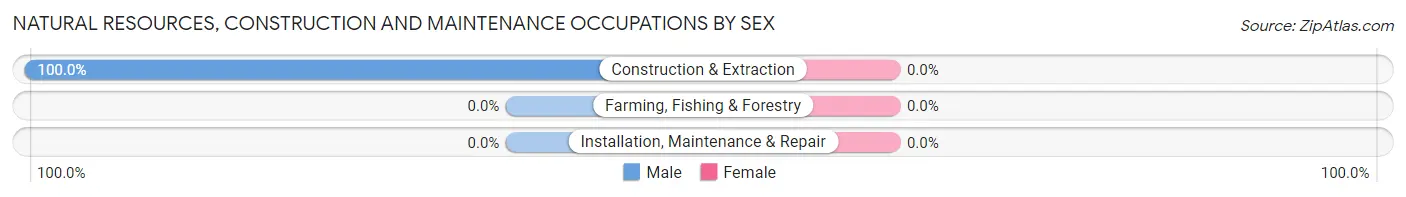
| Occupation | Male | Female |
| Farming, Fishing & Forestry | 0 (0.0%) | 0 (0.0%) |
| Construction & Extraction | 24 (100.0%) | 0 (0.0%) |
| Installation, Maintenance & Repair | 0 (0.0%) | 0 (0.0%) |
| Total (Category) | 24 (100.0%) | 0 (0.0%) |
| Total (Overall) | 97 (62.6%) | 58 (37.4%) |
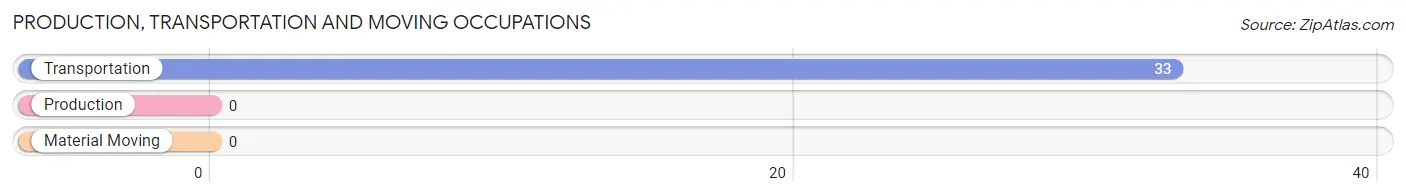
Production, Transportation and Moving Occupations
The most common Production, Transportation and Moving occupations in Wacissa are , and Transportation (33 | 21.3%).
Production, Transportation and Moving Occupations by Sex
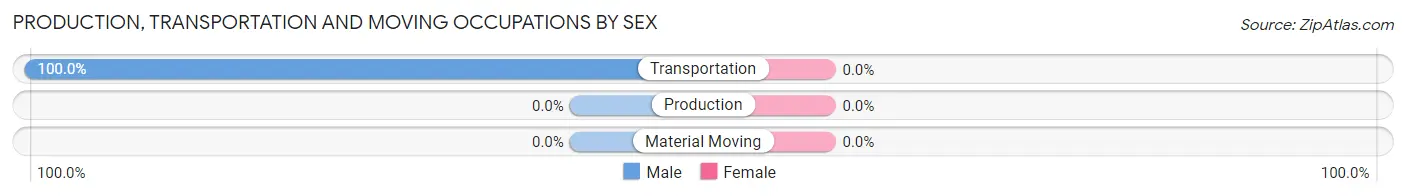
| Occupation | Male | Female |
| Production | 0 (0.0%) | 0 (0.0%) |
| Transportation | 33 (100.0%) | 0 (0.0%) |
| Material Moving | 0 (0.0%) | 0 (0.0%) |
| Total (Category) | 33 (100.0%) | 0 (0.0%) |
| Total (Overall) | 97 (62.6%) | 58 (37.4%) |
Employment Industries by Sex in Wacissa
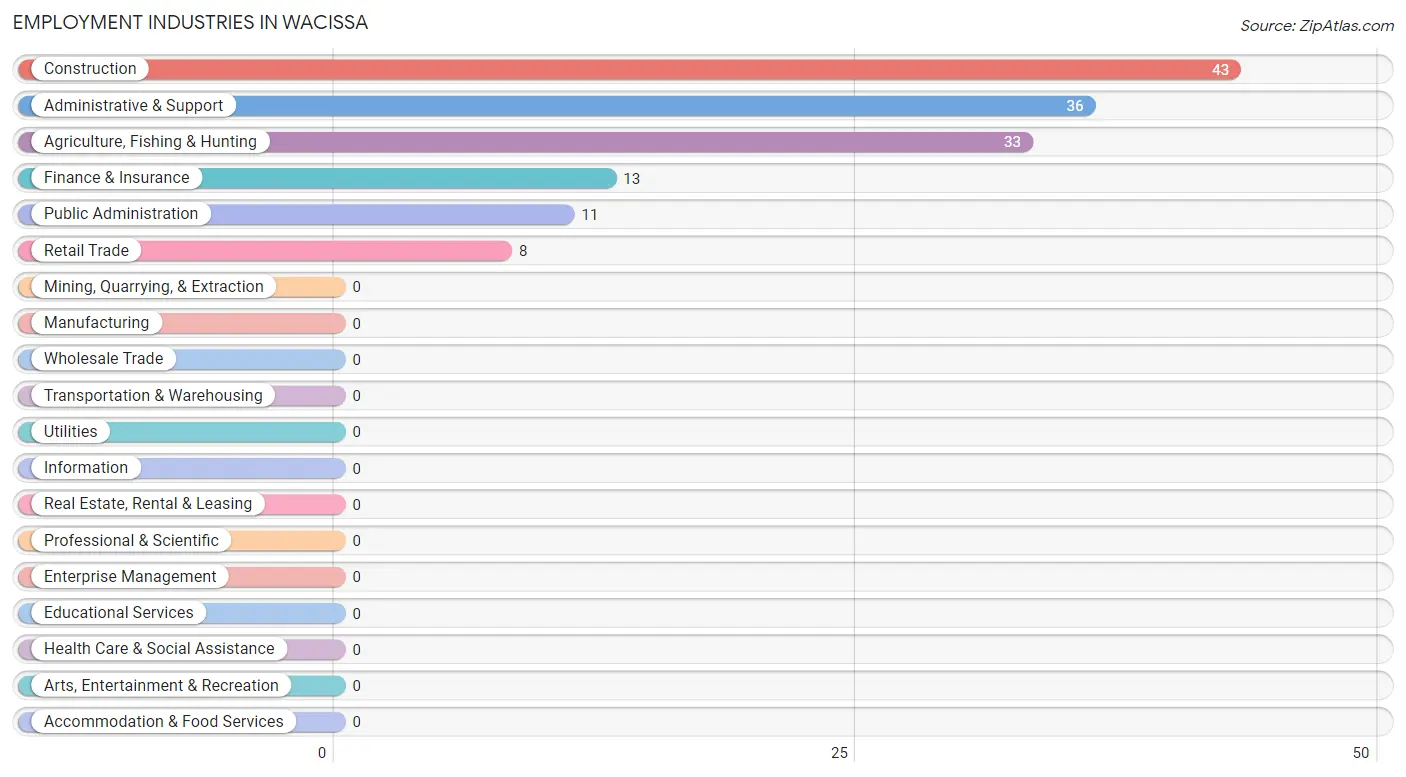
Employment Industries in Wacissa
The major employment industries in Wacissa include Construction (43 | 27.7%), Administrative & Support (36 | 23.2%), Agriculture, Fishing & Hunting (33 | 21.3%), Finance & Insurance (13 | 8.4%), and Public Administration (11 | 7.1%).
Employment Industries by Sex in Wacissa
The Wacissa industries that see more men than women are Agriculture, Fishing & Hunting (100.0%), Construction (100.0%), and Retail Trade (100.0%), whereas the industries that tend to have a higher number of women are Administrative & Support (100.0%), and Public Administration (100.0%).
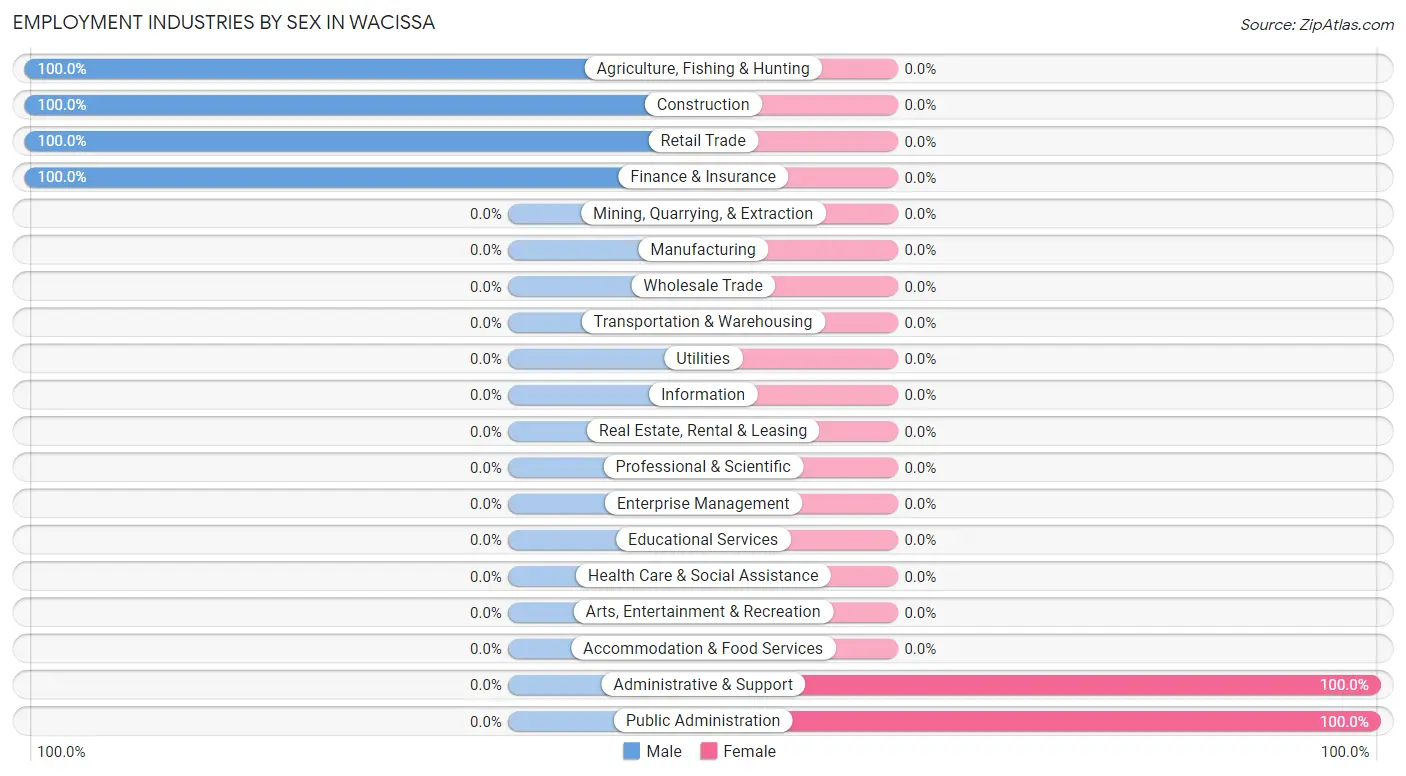
| Industry | Male | Female |
| Agriculture, Fishing & Hunting | 33 (100.0%) | 0 (0.0%) |
| Mining, Quarrying, & Extraction | 0 (0.0%) | 0 (0.0%) |
| Construction | 43 (100.0%) | 0 (0.0%) |
| Manufacturing | 0 (0.0%) | 0 (0.0%) |
| Wholesale Trade | 0 (0.0%) | 0 (0.0%) |
| Retail Trade | 8 (100.0%) | 0 (0.0%) |
| Transportation & Warehousing | 0 (0.0%) | 0 (0.0%) |
| Utilities | 0 (0.0%) | 0 (0.0%) |
| Information | 0 (0.0%) | 0 (0.0%) |
| Finance & Insurance | 13 (100.0%) | 0 (0.0%) |
| Real Estate, Rental & Leasing | 0 (0.0%) | 0 (0.0%) |
| Professional & Scientific | 0 (0.0%) | 0 (0.0%) |
| Enterprise Management | 0 (0.0%) | 0 (0.0%) |
| Administrative & Support | 0 (0.0%) | 36 (100.0%) |
| Educational Services | 0 (0.0%) | 0 (0.0%) |
| Health Care & Social Assistance | 0 (0.0%) | 0 (0.0%) |
| Arts, Entertainment & Recreation | 0 (0.0%) | 0 (0.0%) |
| Accommodation & Food Services | 0 (0.0%) | 0 (0.0%) |
| Public Administration | 0 (0.0%) | 11 (100.0%) |
| Total | 97 (62.6%) | 58 (37.4%) |
Education in Wacissa
School Enrollment in Wacissa
| School Level | # Students | % Students |
| Nursery / Preschool | 0 | 0.0% |
| Kindergarten | 0 | 0.0% |
| Elementary School | 0 | 0.0% |
| Middle School | 0 | 0.0% |
| High School | 0 | 0.0% |
| College / Undergraduate | 0 | 0.0% |
| Graduate / Professional | 0 | 0.0% |
| Total | 0 | 0.0% |
School Enrollment by Age by Funding Source in Wacissa
| Age Bracket | Public School | Private School |
| 3 to 4 Year Olds | 0 (0.0%) | 0 (0.0%) |
| 5 to 9 Year Old | 0 (0.0%) | 0 (0.0%) |
| 10 to 14 Year Olds | 0 (0.0%) | 0 (0.0%) |
| 15 to 17 Year Olds | 0 (0.0%) | 0 (0.0%) |
| 18 to 19 Year Olds | 0 (0.0%) | 0 (0.0%) |
| 20 to 24 Year Olds | 0 (0.0%) | 0 (0.0%) |
| 25 to 34 Year Olds | 0 (0.0%) | 0 (0.0%) |
| 35 Years and over | 0 (0.0%) | 0 (0.0%) |
| Total | 0 (0.0%) | 0 (0.0%) |
Educational Attainment by Field of Study in Wacissa
Bio, nature & agricultural (15 | 41.7%), computers & mathematics (13 | 36.1%), psychology (4 | 11.1%), and literature & languages (4 | 11.1%) are the most common fields of study among 36 individuals in Wacissa who have obtained a bachelor's degree or higher.
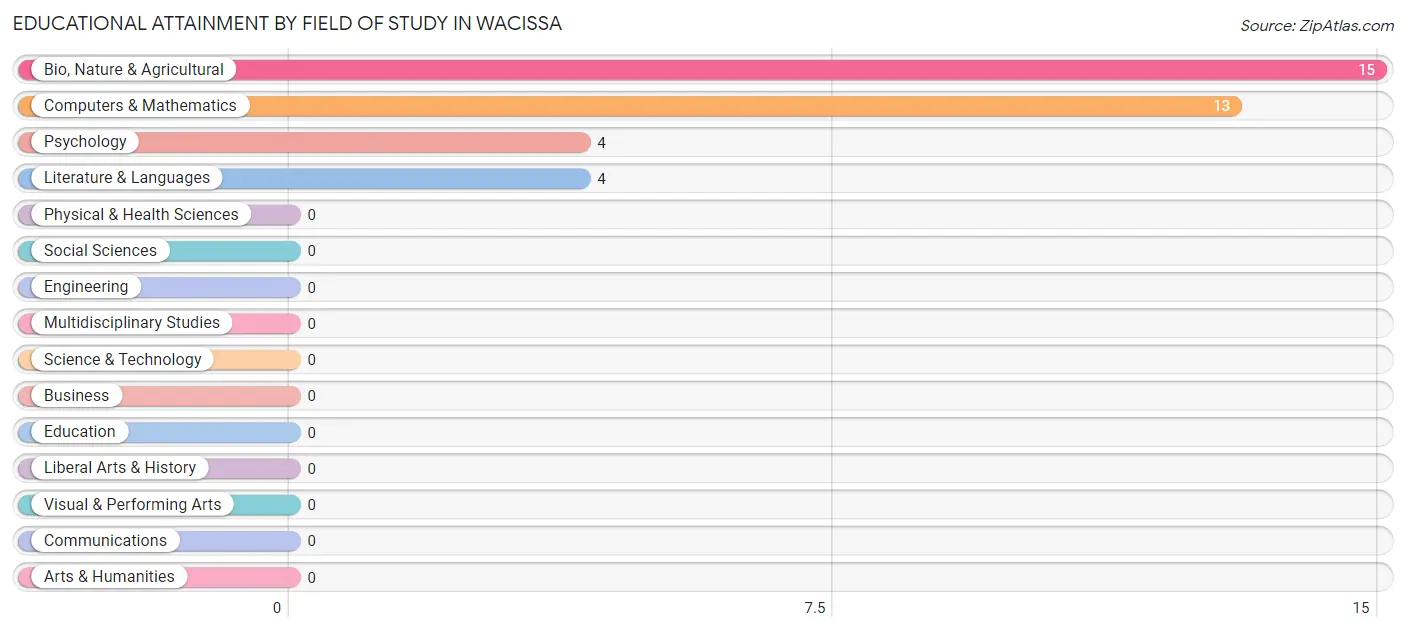
| Field of Study | # Graduates | % Graduates |
| Computers & Mathematics | 13 | 36.1% |
| Bio, Nature & Agricultural | 15 | 41.7% |
| Physical & Health Sciences | 0 | 0.0% |
| Psychology | 4 | 11.1% |
| Social Sciences | 0 | 0.0% |
| Engineering | 0 | 0.0% |
| Multidisciplinary Studies | 0 | 0.0% |
| Science & Technology | 0 | 0.0% |
| Business | 0 | 0.0% |
| Education | 0 | 0.0% |
| Literature & Languages | 4 | 11.1% |
| Liberal Arts & History | 0 | 0.0% |
| Visual & Performing Arts | 0 | 0.0% |
| Communications | 0 | 0.0% |
| Arts & Humanities | 0 | 0.0% |
| Total | 36 | 100.0% |
Transportation & Commute in Wacissa
Vehicle Availability by Sex in Wacissa
The most prevalent vehicle ownership categories in Wacissa are males with 1 vehicle (46, accounting for 47.4%) and females with 1 vehicle (36, making up 79.3%).
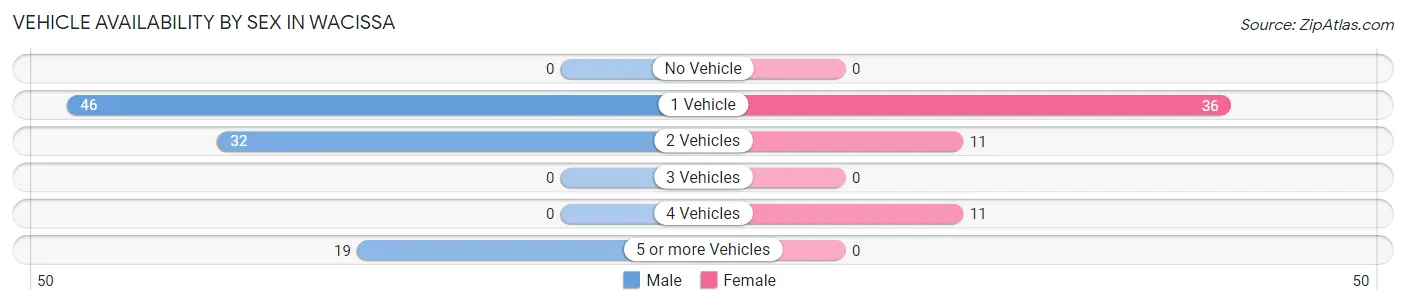
| Vehicles Available | Male | Female |
| No Vehicle | 0 (0.0%) | 0 (0.0%) |
| 1 Vehicle | 46 (47.4%) | 36 (62.1%) |
| 2 Vehicles | 32 (33.0%) | 11 (19.0%) |
| 3 Vehicles | 0 (0.0%) | 0 (0.0%) |
| 4 Vehicles | 0 (0.0%) | 11 (19.0%) |
| 5 or more Vehicles | 19 (19.6%) | 0 (0.0%) |
| Total | 97 (100.0%) | 58 (100.0%) |
Commute Time in Wacissa
The most frequently occuring commute durations in Wacissa are 30 to 34 minutes (36 commuters, 23.2%), 40 to 44 minutes (33 commuters, 21.3%), and 25 to 29 minutes (32 commuters, 20.6%).
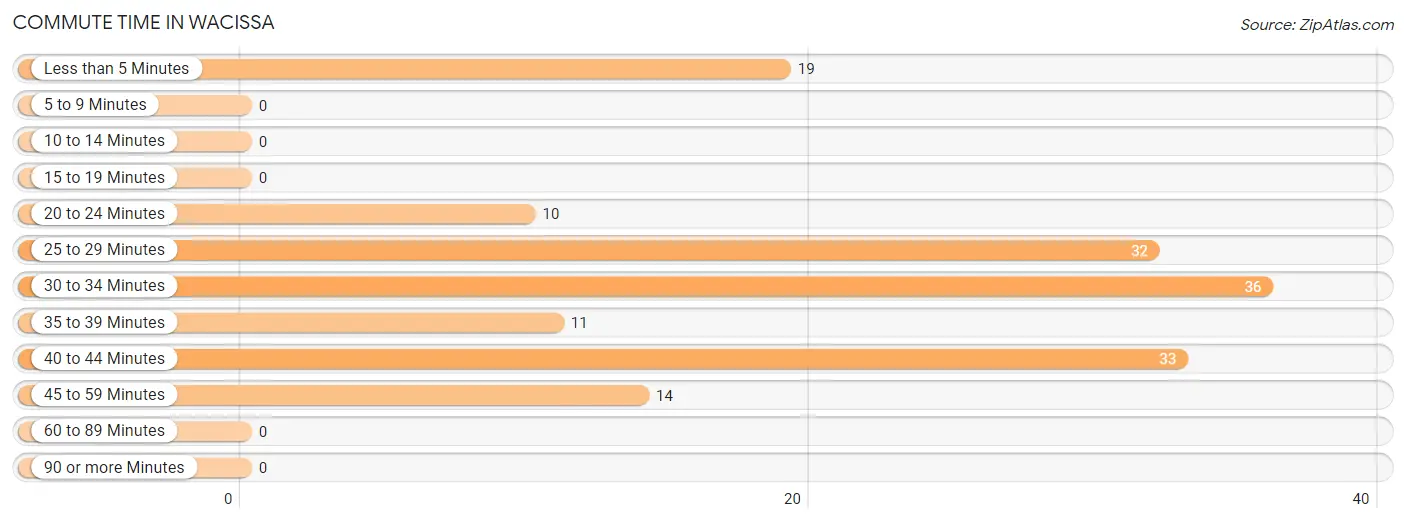
| Commute Time | # Commuters | % Commuters |
| Less than 5 Minutes | 19 | 12.3% |
| 5 to 9 Minutes | 0 | 0.0% |
| 10 to 14 Minutes | 0 | 0.0% |
| 15 to 19 Minutes | 0 | 0.0% |
| 20 to 24 Minutes | 10 | 6.5% |
| 25 to 29 Minutes | 32 | 20.6% |
| 30 to 34 Minutes | 36 | 23.2% |
| 35 to 39 Minutes | 11 | 7.1% |
| 40 to 44 Minutes | 33 | 21.3% |
| 45 to 59 Minutes | 14 | 9.0% |
| 60 to 89 Minutes | 0 | 0.0% |
| 90 or more Minutes | 0 | 0.0% |
Commute Time by Sex in Wacissa
The most common commute times in Wacissa are 40 to 44 minutes (33 commuters, 34.0%) for males and 30 to 34 minutes (36 commuters, 62.1%) for females.
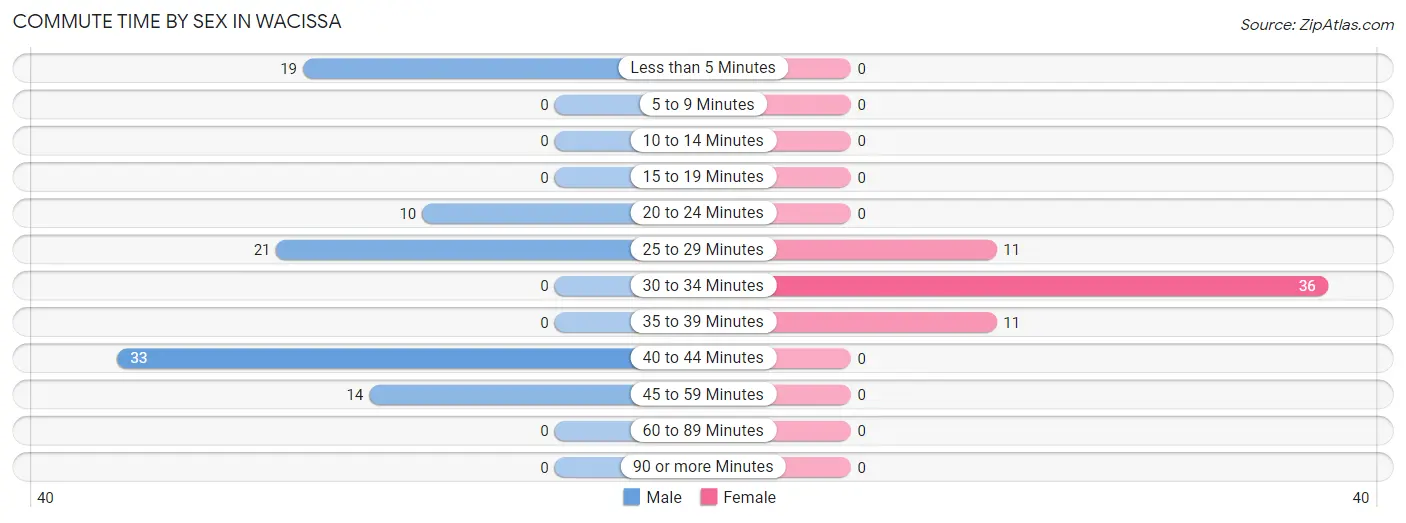
| Commute Time | Male | Female |
| Less than 5 Minutes | 19 (19.6%) | 0 (0.0%) |
| 5 to 9 Minutes | 0 (0.0%) | 0 (0.0%) |
| 10 to 14 Minutes | 0 (0.0%) | 0 (0.0%) |
| 15 to 19 Minutes | 0 (0.0%) | 0 (0.0%) |
| 20 to 24 Minutes | 10 (10.3%) | 0 (0.0%) |
| 25 to 29 Minutes | 21 (21.6%) | 11 (19.0%) |
| 30 to 34 Minutes | 0 (0.0%) | 36 (62.1%) |
| 35 to 39 Minutes | 0 (0.0%) | 11 (19.0%) |
| 40 to 44 Minutes | 33 (34.0%) | 0 (0.0%) |
| 45 to 59 Minutes | 14 (14.4%) | 0 (0.0%) |
| 60 to 89 Minutes | 0 (0.0%) | 0 (0.0%) |
| 90 or more Minutes | 0 (0.0%) | 0 (0.0%) |
Time of Departure to Work by Sex in Wacissa
The most frequent times of departure to work in Wacissa are 5:00 AM to 5:29 AM (33, 34.0%) for males and 7:00 AM to 7:29 AM (36, 62.1%) for females.
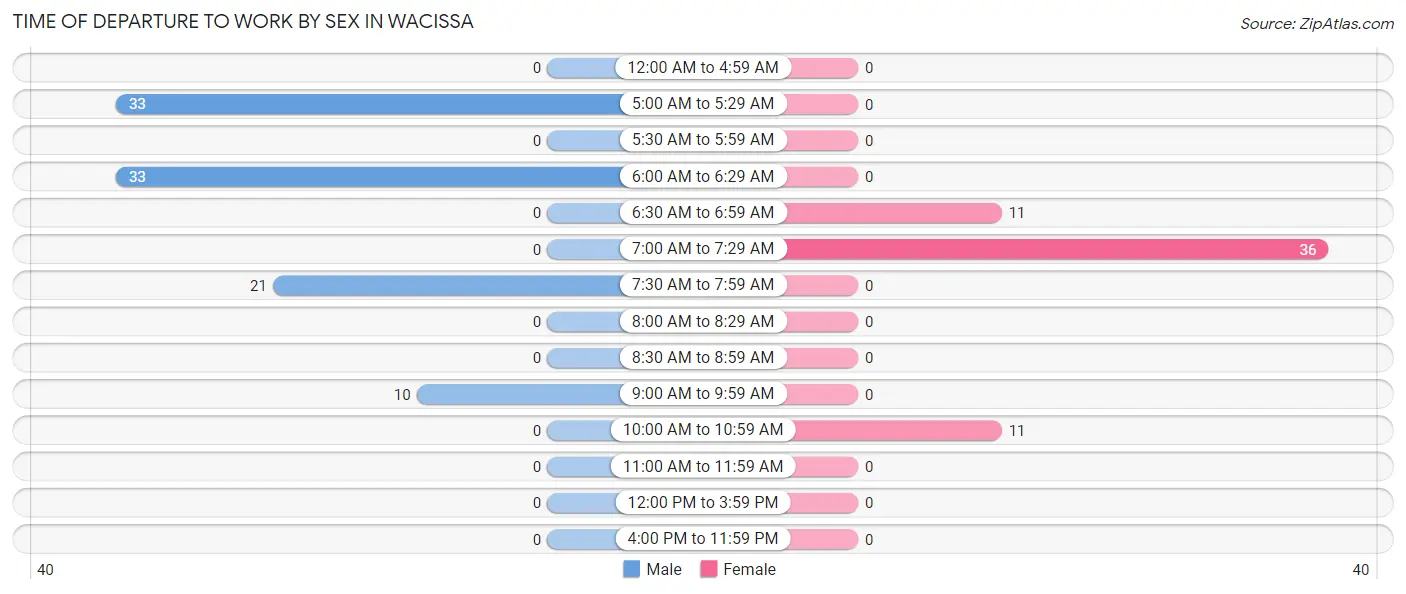
| Time of Departure | Male | Female |
| 12:00 AM to 4:59 AM | 0 (0.0%) | 0 (0.0%) |
| 5:00 AM to 5:29 AM | 33 (34.0%) | 0 (0.0%) |
| 5:30 AM to 5:59 AM | 0 (0.0%) | 0 (0.0%) |
| 6:00 AM to 6:29 AM | 33 (34.0%) | 0 (0.0%) |
| 6:30 AM to 6:59 AM | 0 (0.0%) | 11 (19.0%) |
| 7:00 AM to 7:29 AM | 0 (0.0%) | 36 (62.1%) |
| 7:30 AM to 7:59 AM | 21 (21.6%) | 0 (0.0%) |
| 8:00 AM to 8:29 AM | 0 (0.0%) | 0 (0.0%) |
| 8:30 AM to 8:59 AM | 0 (0.0%) | 0 (0.0%) |
| 9:00 AM to 9:59 AM | 10 (10.3%) | 0 (0.0%) |
| 10:00 AM to 10:59 AM | 0 (0.0%) | 11 (19.0%) |
| 11:00 AM to 11:59 AM | 0 (0.0%) | 0 (0.0%) |
| 12:00 PM to 3:59 PM | 0 (0.0%) | 0 (0.0%) |
| 4:00 PM to 11:59 PM | 0 (0.0%) | 0 (0.0%) |
| Total | 97 (100.0%) | 58 (100.0%) |
Housing Occupancy in Wacissa
Occupancy by Ownership in Wacissa
Of the total 195 dwellings in Wacissa, owner-occupied units account for 161 (82.6%), while renter-occupied units make up 34 (17.4%).
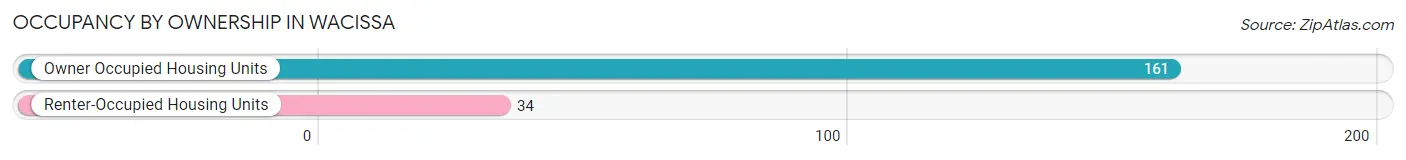
| Occupancy | # Housing Units | % Housing Units |
| Owner Occupied Housing Units | 161 | 82.6% |
| Renter-Occupied Housing Units | 34 | 17.4% |
| Total Occupied Housing Units | 195 | 100.0% |
Occupancy by Household Size in Wacissa
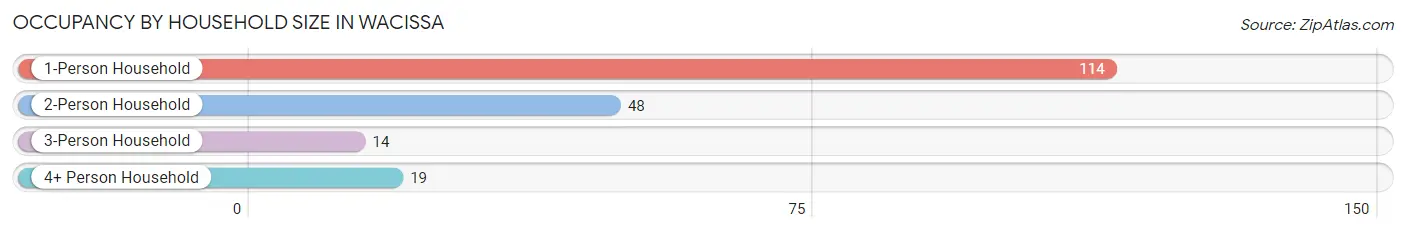
| Household Size | # Housing Units | % Housing Units |
| 1-Person Household | 114 | 58.5% |
| 2-Person Household | 48 | 24.6% |
| 3-Person Household | 14 | 7.2% |
| 4+ Person Household | 19 | 9.7% |
| Total Housing Units | 195 | 100.0% |
Occupancy by Ownership by Household Size in Wacissa
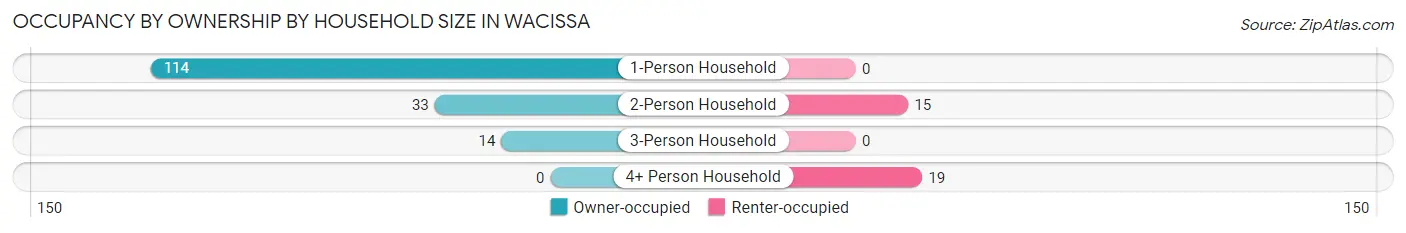
| Household Size | Owner-occupied | Renter-occupied |
| 1-Person Household | 114 (100.0%) | 0 (0.0%) |
| 2-Person Household | 33 (68.8%) | 15 (31.2%) |
| 3-Person Household | 14 (100.0%) | 0 (0.0%) |
| 4+ Person Household | 0 (0.0%) | 19 (100.0%) |
| Total Housing Units | 161 (82.6%) | 34 (17.4%) |
Occupancy by Educational Attainment in Wacissa
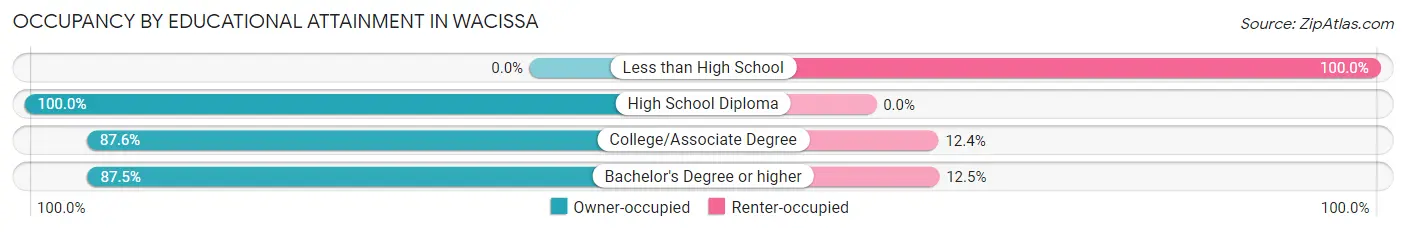
| Household Size | Owner-occupied | Renter-occupied |
| Less than High School | 0 (0.0%) | 19 (100.0%) |
| High School Diploma | 55 (100.0%) | 0 (0.0%) |
| College/Associate Degree | 78 (87.6%) | 11 (12.4%) |
| Bachelor's Degree or higher | 28 (87.5%) | 4 (12.5%) |
Occupancy by Age of Householder in Wacissa
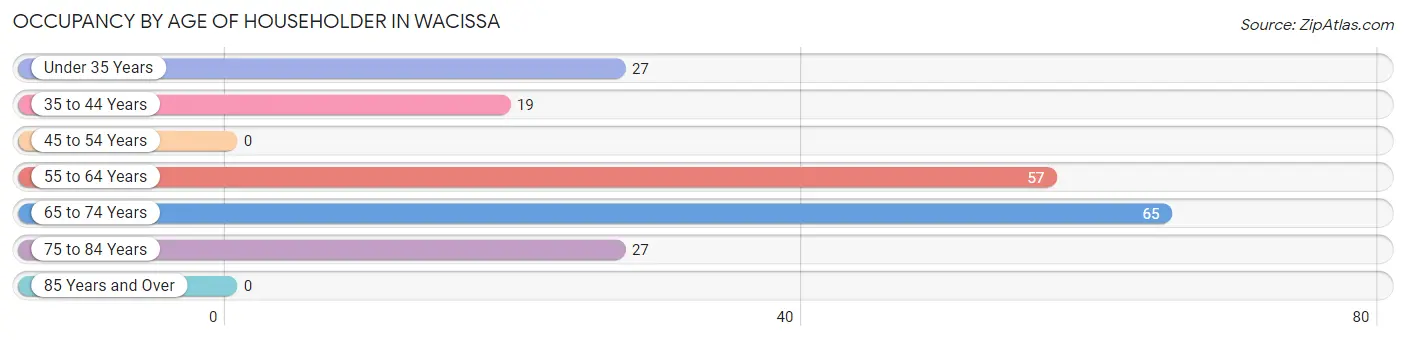
| Age Bracket | # Households | % Households |
| Under 35 Years | 27 | 13.9% |
| 35 to 44 Years | 19 | 9.7% |
| 45 to 54 Years | 0 | 0.0% |
| 55 to 64 Years | 57 | 29.2% |
| 65 to 74 Years | 65 | 33.3% |
| 75 to 84 Years | 27 | 13.9% |
| 85 Years and Over | 0 | 0.0% |
| Total | 195 | 100.0% |
Housing Finances in Wacissa
Median Income by Occupancy in Wacissa
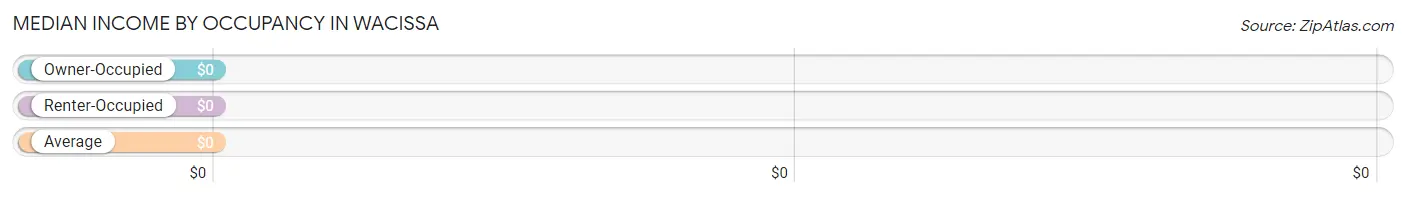
| Occupancy Type | # Households | Median Income |
| Owner-Occupied | 161 (82.6%) | $0 |
| Renter-Occupied | 34 (17.4%) | $0 |
| Average | 195 (100.0%) | $0 |
Occupancy by Householder Income Bracket in Wacissa
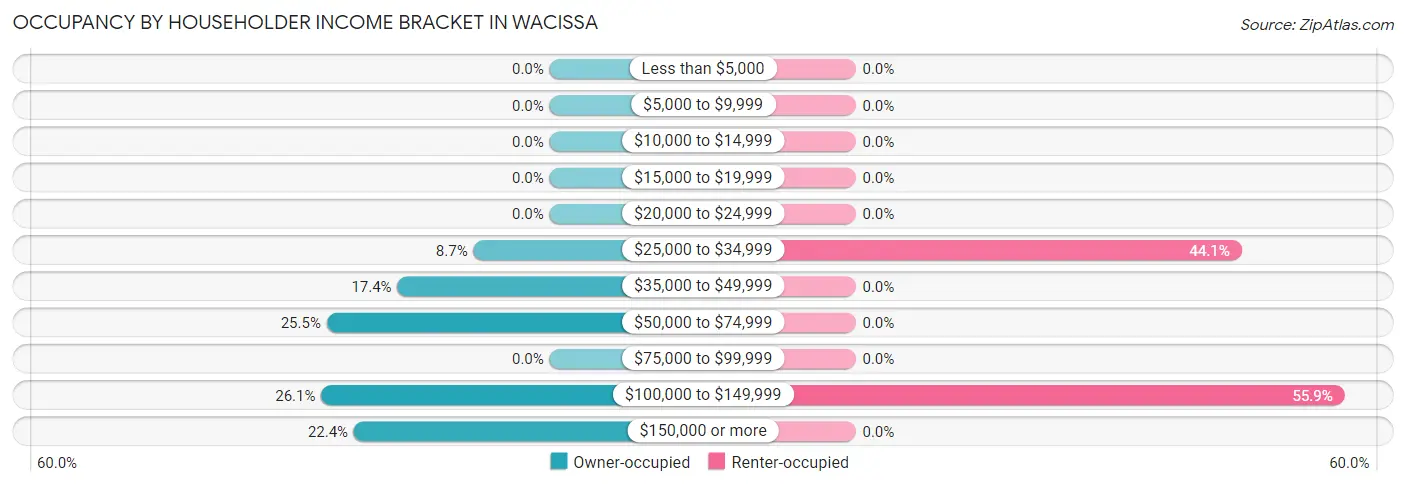
| Income Bracket | Owner-occupied | Renter-occupied |
| Less than $5,000 | 0 (0.0%) | 0 (0.0%) |
| $5,000 to $9,999 | 0 (0.0%) | 0 (0.0%) |
| $10,000 to $14,999 | 0 (0.0%) | 0 (0.0%) |
| $15,000 to $19,999 | 0 (0.0%) | 0 (0.0%) |
| $20,000 to $24,999 | 0 (0.0%) | 0 (0.0%) |
| $25,000 to $34,999 | 14 (8.7%) | 15 (44.1%) |
| $35,000 to $49,999 | 28 (17.4%) | 0 (0.0%) |
| $50,000 to $74,999 | 41 (25.5%) | 0 (0.0%) |
| $75,000 to $99,999 | 0 (0.0%) | 0 (0.0%) |
| $100,000 to $149,999 | 42 (26.1%) | 19 (55.9%) |
| $150,000 or more | 36 (22.4%) | 0 (0.0%) |
| Total | 161 (100.0%) | 34 (100.0%) |
Monthly Housing Cost Tiers in Wacissa
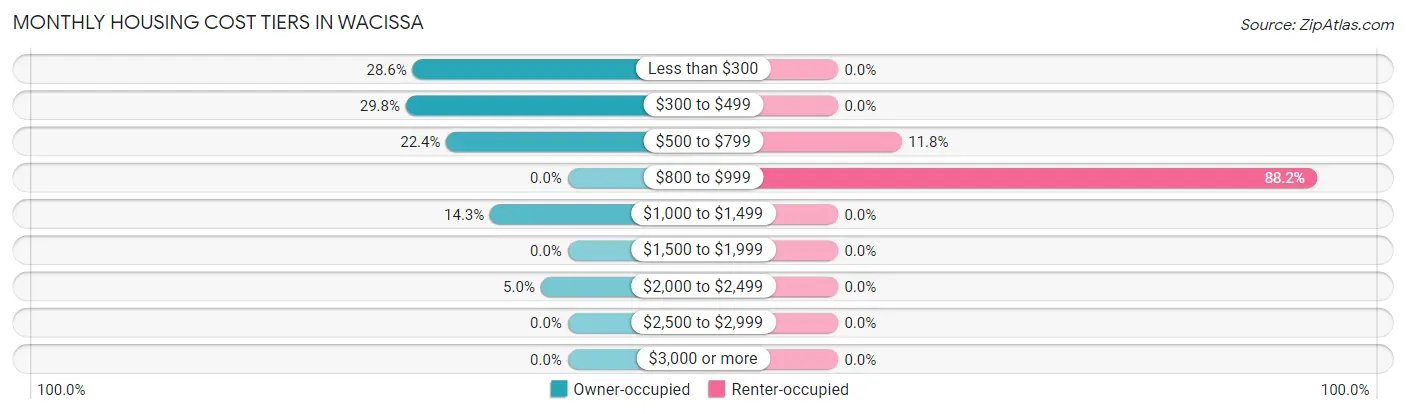
| Monthly Cost | Owner-occupied | Renter-occupied |
| Less than $300 | 46 (28.6%) | 0 (0.0%) |
| $300 to $499 | 48 (29.8%) | 0 (0.0%) |
| $500 to $799 | 36 (22.4%) | 4 (11.8%) |
| $800 to $999 | 0 (0.0%) | 30 (88.2%) |
| $1,000 to $1,499 | 23 (14.3%) | 0 (0.0%) |
| $1,500 to $1,999 | 0 (0.0%) | 0 (0.0%) |
| $2,000 to $2,499 | 8 (5.0%) | 0 (0.0%) |
| $2,500 to $2,999 | 0 (0.0%) | 0 (0.0%) |
| $3,000 or more | 0 (0.0%) | 0 (0.0%) |
| Total | 161 (100.0%) | 34 (100.0%) |
Physical Housing Characteristics in Wacissa
Housing Structures in Wacissa
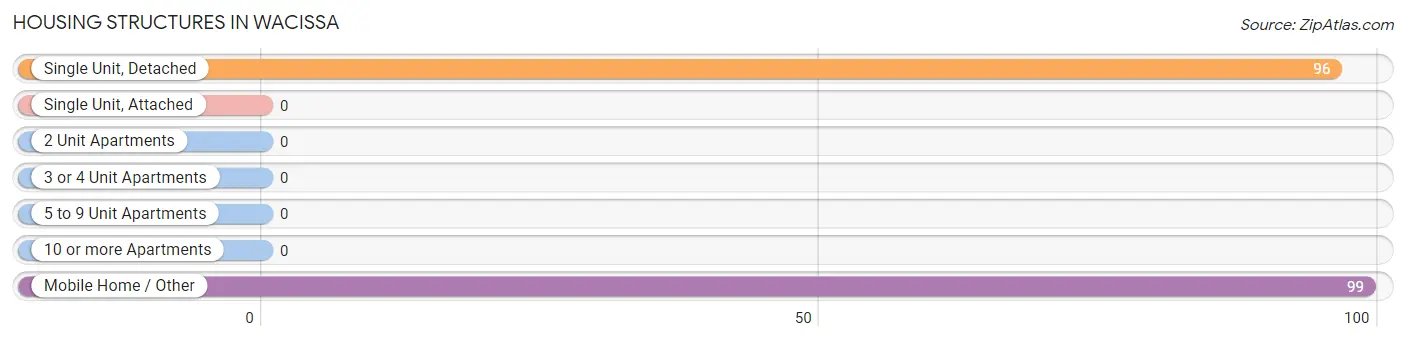
| Structure Type | # Housing Units | % Housing Units |
| Single Unit, Detached | 96 | 49.2% |
| Single Unit, Attached | 0 | 0.0% |
| 2 Unit Apartments | 0 | 0.0% |
| 3 or 4 Unit Apartments | 0 | 0.0% |
| 5 to 9 Unit Apartments | 0 | 0.0% |
| 10 or more Apartments | 0 | 0.0% |
| Mobile Home / Other | 99 | 50.8% |
| Total | 195 | 100.0% |
Housing Structures by Occupancy in Wacissa
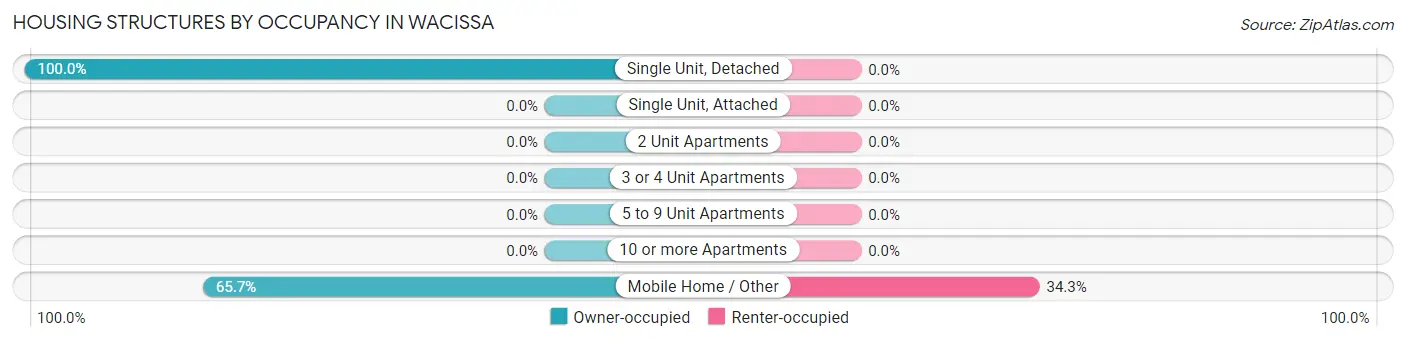
| Structure Type | Owner-occupied | Renter-occupied |
| Single Unit, Detached | 96 (100.0%) | 0 (0.0%) |
| Single Unit, Attached | 0 (0.0%) | 0 (0.0%) |
| 2 Unit Apartments | 0 (0.0%) | 0 (0.0%) |
| 3 or 4 Unit Apartments | 0 (0.0%) | 0 (0.0%) |
| 5 to 9 Unit Apartments | 0 (0.0%) | 0 (0.0%) |
| 10 or more Apartments | 0 (0.0%) | 0 (0.0%) |
| Mobile Home / Other | 65 (65.7%) | 34 (34.3%) |
| Total | 161 (82.6%) | 34 (17.4%) |
Housing Structures by Number of Rooms in Wacissa
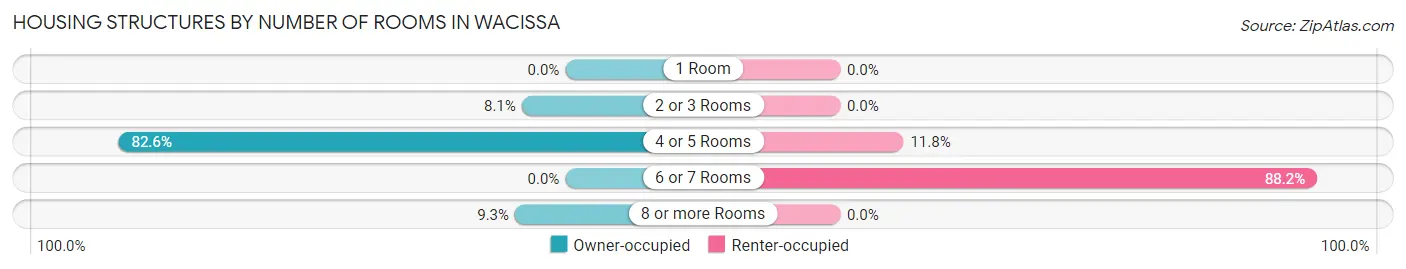
| Number of Rooms | Owner-occupied | Renter-occupied |
| 1 Room | 0 (0.0%) | 0 (0.0%) |
| 2 or 3 Rooms | 13 (8.1%) | 0 (0.0%) |
| 4 or 5 Rooms | 133 (82.6%) | 4 (11.8%) |
| 6 or 7 Rooms | 0 (0.0%) | 30 (88.2%) |
| 8 or more Rooms | 15 (9.3%) | 0 (0.0%) |
| Total | 161 (100.0%) | 34 (100.0%) |
Housing Structure by Heating Type in Wacissa
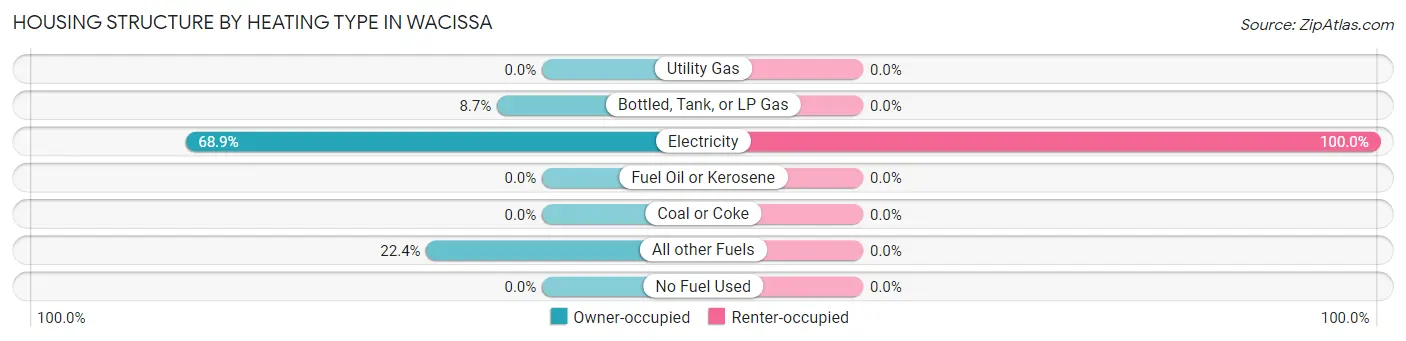
| Heating Type | Owner-occupied | Renter-occupied |
| Utility Gas | 0 (0.0%) | 0 (0.0%) |
| Bottled, Tank, or LP Gas | 14 (8.7%) | 0 (0.0%) |
| Electricity | 111 (68.9%) | 34 (100.0%) |
| Fuel Oil or Kerosene | 0 (0.0%) | 0 (0.0%) |
| Coal or Coke | 0 (0.0%) | 0 (0.0%) |
| All other Fuels | 36 (22.4%) | 0 (0.0%) |
| No Fuel Used | 0 (0.0%) | 0 (0.0%) |
| Total | 161 (100.0%) | 34 (100.0%) |
Household Vehicle Usage in Wacissa
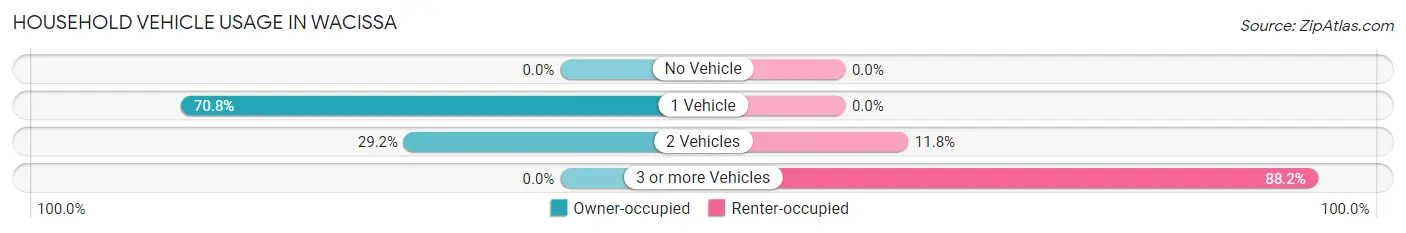
| Vehicles per Household | Owner-occupied | Renter-occupied |
| No Vehicle | 0 (0.0%) | 0 (0.0%) |
| 1 Vehicle | 114 (70.8%) | 0 (0.0%) |
| 2 Vehicles | 47 (29.2%) | 4 (11.8%) |
| 3 or more Vehicles | 0 (0.0%) | 30 (88.2%) |
| Total | 161 (100.0%) | 34 (100.0%) |
Real Estate & Mortgages in Wacissa
Real Estate and Mortgage Overview in Wacissa
| Characteristic | Without Mortgage | With Mortgage |
| Housing Units | 130 | 31 |
| Median Property Value | - | - |
| Median Household Income | - | - |
| Monthly Housing Costs | $379 | $0 |
| Real Estate Taxes | $1,169 | $0 |
Property Value by Mortgage Status in Wacissa
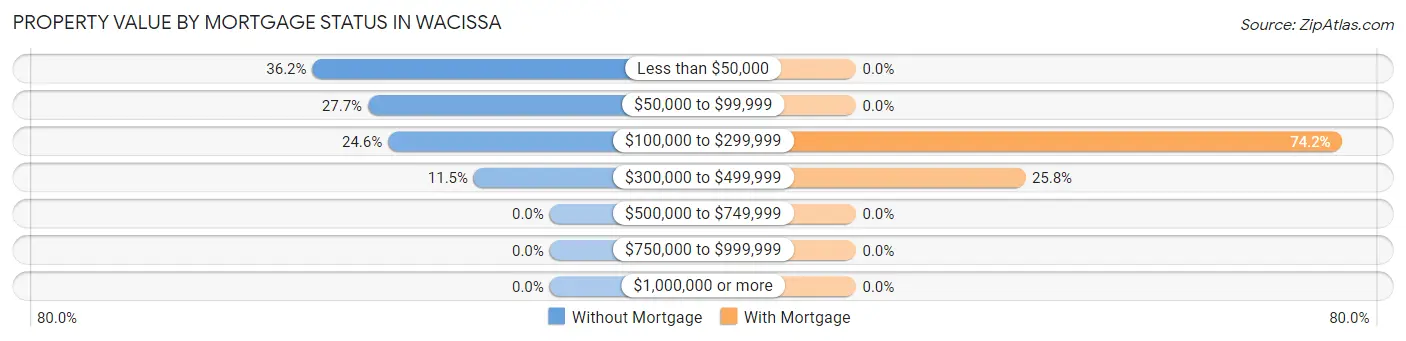
| Property Value | Without Mortgage | With Mortgage |
| Less than $50,000 | 47 (36.1%) | 0 (0.0%) |
| $50,000 to $99,999 | 36 (27.7%) | 0 (0.0%) |
| $100,000 to $299,999 | 32 (24.6%) | 23 (74.2%) |
| $300,000 to $499,999 | 15 (11.5%) | 8 (25.8%) |
| $500,000 to $749,999 | 0 (0.0%) | 0 (0.0%) |
| $750,000 to $999,999 | 0 (0.0%) | 0 (0.0%) |
| $1,000,000 or more | 0 (0.0%) | 0 (0.0%) |
| Total | 130 (100.0%) | 31 (100.0%) |
Household Income by Mortgage Status in Wacissa
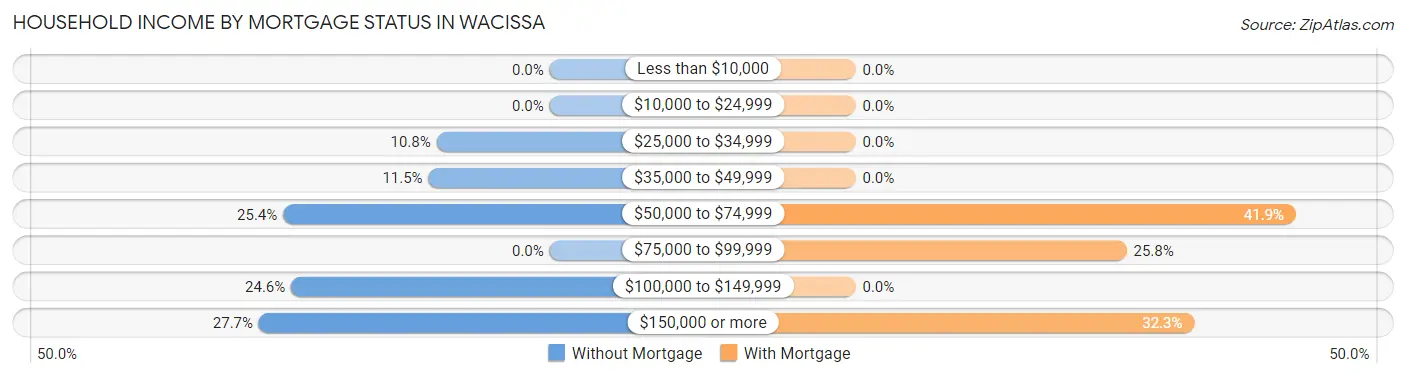
| Household Income | Without Mortgage | With Mortgage |
| Less than $10,000 | 0 (0.0%) | 0 (0.0%) |
| $10,000 to $24,999 | 0 (0.0%) | 0 (0.0%) |
| $25,000 to $34,999 | 14 (10.8%) | 0 (0.0%) |
| $35,000 to $49,999 | 15 (11.5%) | 0 (0.0%) |
| $50,000 to $74,999 | 33 (25.4%) | 13 (41.9%) |
| $75,000 to $99,999 | 0 (0.0%) | 8 (25.8%) |
| $100,000 to $149,999 | 32 (24.6%) | 0 (0.0%) |
| $150,000 or more | 36 (27.7%) | 10 (32.3%) |
| Total | 130 (100.0%) | 31 (100.0%) |
Property Value to Household Income Ratio in Wacissa
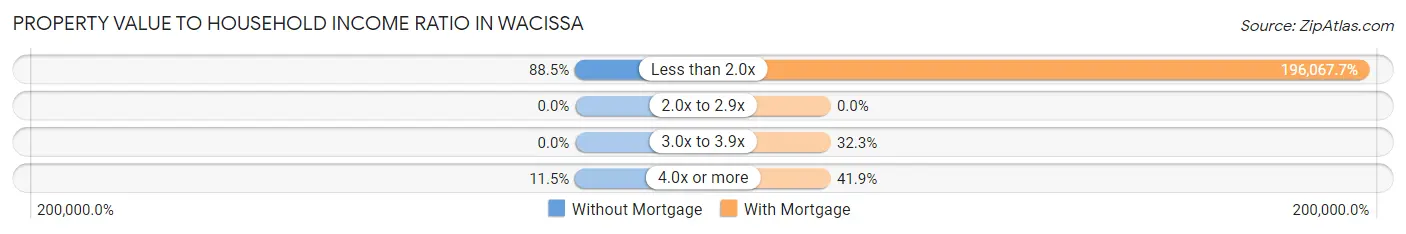
| Value-to-Income Ratio | Without Mortgage | With Mortgage |
| Less than 2.0x | 115 (88.5%) | 60,781 (196,067.7%) |
| 2.0x to 2.9x | 0 (0.0%) | 0 (0.0%) |
| 3.0x to 3.9x | 0 (0.0%) | 10 (32.3%) |
| 4.0x or more | 15 (11.5%) | 13 (41.9%) |
| Total | 130 (100.0%) | 31 (100.0%) |
Real Estate Taxes by Mortgage Status in Wacissa
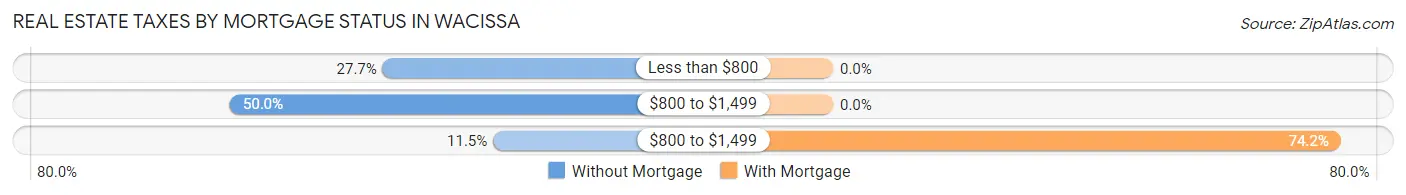
| Property Taxes | Without Mortgage | With Mortgage |
| Less than $800 | 36 (27.7%) | 0 (0.0%) |
| $800 to $1,499 | 65 (50.0%) | 0 (0.0%) |
| $800 to $1,499 | 15 (11.5%) | 23 (74.2%) |
| Total | 130 (100.0%) | 31 (100.0%) |
Health & Disability in Wacissa
Health Insurance Coverage by Age in Wacissa
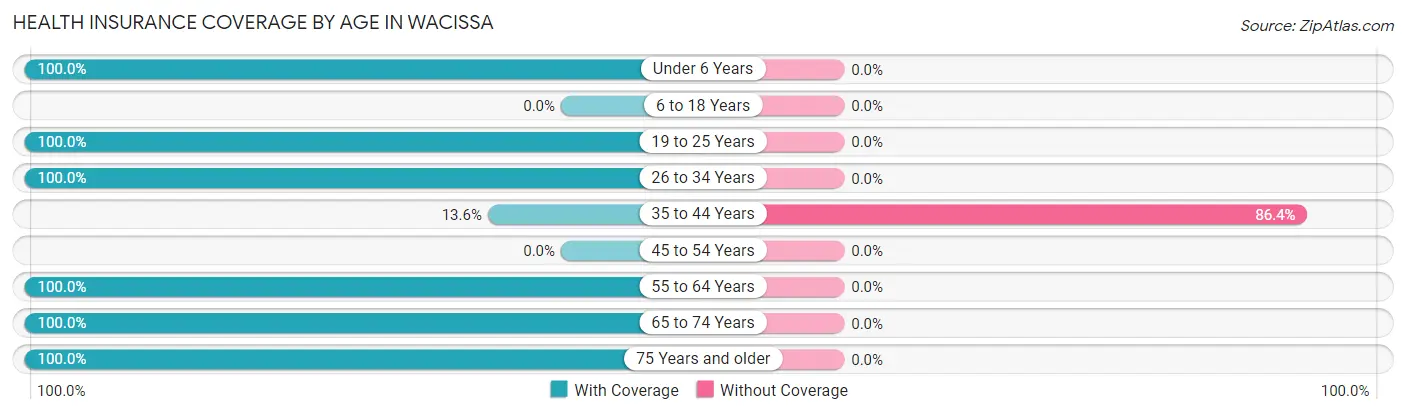
| Age Bracket | With Coverage | Without Coverage |
| Under 6 Years | 32 (100.0%) | 0 (0.0%) |
| 6 to 18 Years | 0 (0.0%) | 0 (0.0%) |
| 19 to 25 Years | 29 (100.0%) | 0 (0.0%) |
| 26 to 34 Years | 27 (100.0%) | 0 (0.0%) |
| 35 to 44 Years | 6 (13.6%) | 38 (86.4%) |
| 45 to 54 Years | 0 (0.0%) | 0 (0.0%) |
| 55 to 64 Years | 68 (100.0%) | 0 (0.0%) |
| 65 to 74 Years | 78 (100.0%) | 0 (0.0%) |
| 75 Years and older | 52 (100.0%) | 0 (0.0%) |
| Total | 292 (88.5%) | 38 (11.5%) |
Health Insurance Coverage by Citizenship Status in Wacissa
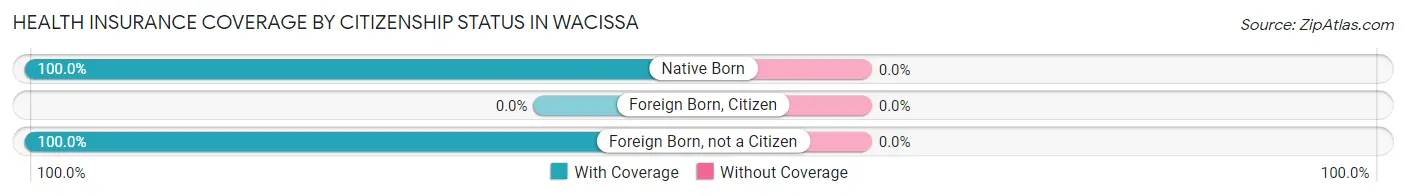
| Citizenship Status | With Coverage | Without Coverage |
| Native Born | 32 (100.0%) | 0 (0.0%) |
| Foreign Born, Citizen | 0 (0.0%) | 0 (0.0%) |
| Foreign Born, not a Citizen | 29 (100.0%) | 0 (0.0%) |
Health Insurance Coverage by Household Income in Wacissa
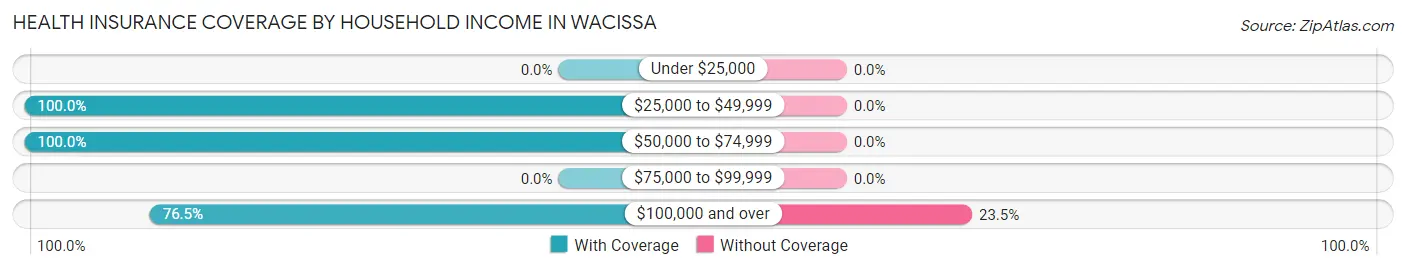
| Household Income | With Coverage | Without Coverage |
| Under $25,000 | 0 (0.0%) | 0 (0.0%) |
| $25,000 to $49,999 | 115 (100.0%) | 0 (0.0%) |
| $50,000 to $74,999 | 53 (100.0%) | 0 (0.0%) |
| $75,000 to $99,999 | 0 (0.0%) | 0 (0.0%) |
| $100,000 and over | 124 (76.5%) | 38 (23.5%) |
Public vs Private Health Insurance Coverage by Age in Wacissa
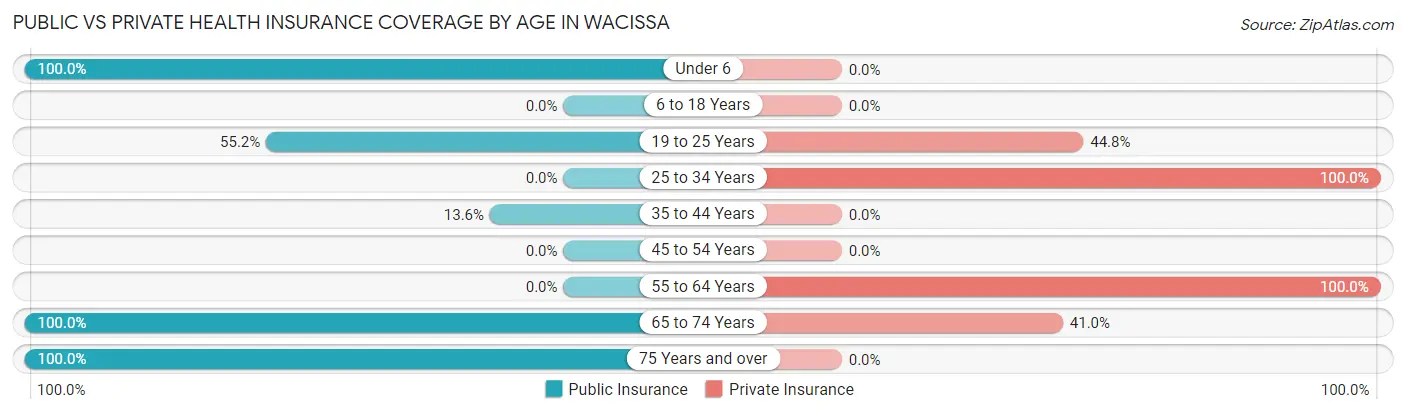
| Age Bracket | Public Insurance | Private Insurance |
| Under 6 | 32 (100.0%) | 0 (0.0%) |
| 6 to 18 Years | 0 (0.0%) | 0 (0.0%) |
| 19 to 25 Years | 16 (55.2%) | 13 (44.8%) |
| 25 to 34 Years | 0 (0.0%) | 27 (100.0%) |
| 35 to 44 Years | 6 (13.6%) | 0 (0.0%) |
| 45 to 54 Years | 0 (0.0%) | 0 (0.0%) |
| 55 to 64 Years | 0 (0.0%) | 68 (100.0%) |
| 65 to 74 Years | 78 (100.0%) | 32 (41.0%) |
| 75 Years and over | 52 (100.0%) | 0 (0.0%) |
| Total | 184 (55.8%) | 140 (42.4%) |
Disability Status by Sex by Age in Wacissa
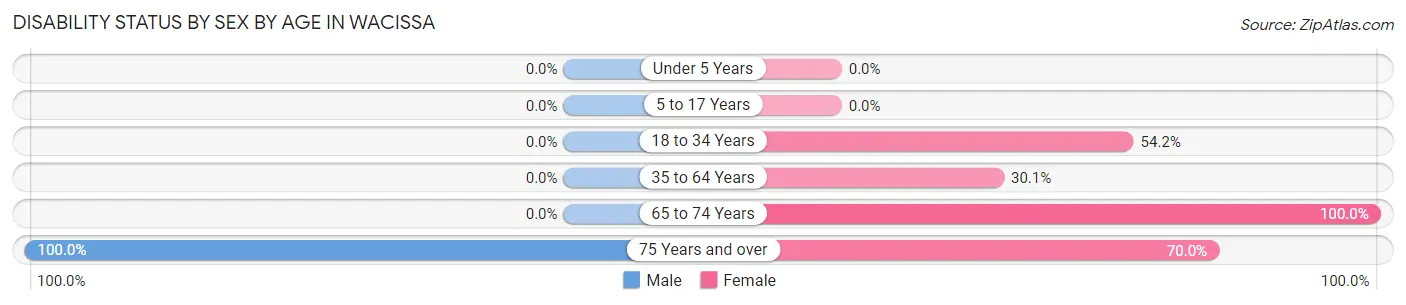
| Age Bracket | Male | Female |
| Under 5 Years | 0 (0.0%) | 0 (0.0%) |
| 5 to 17 Years | 0 (0.0%) | 0 (0.0%) |
| 18 to 34 Years | 0 (0.0%) | 13 (54.2%) |
| 35 to 64 Years | 0 (0.0%) | 25 (30.1%) |
| 65 to 74 Years | 0 (0.0%) | 13 (100.0%) |
| 75 Years and over | 12 (100.0%) | 28 (70.0%) |
Disability Class by Sex by Age in Wacissa
Disability Class: Hearing Difficulty
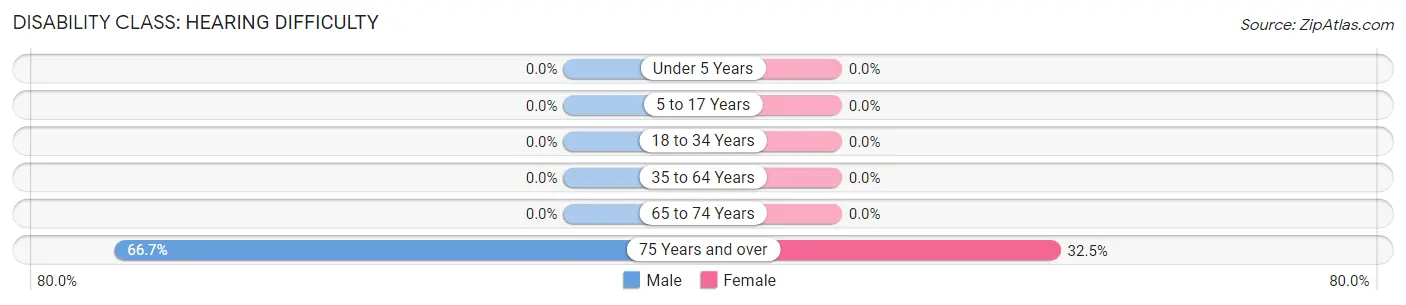
| Age Bracket | Male | Female |
| Under 5 Years | 0 (0.0%) | 0 (0.0%) |
| 5 to 17 Years | 0 (0.0%) | 0 (0.0%) |
| 18 to 34 Years | 0 (0.0%) | 0 (0.0%) |
| 35 to 64 Years | 0 (0.0%) | 0 (0.0%) |
| 65 to 74 Years | 0 (0.0%) | 0 (0.0%) |
| 75 Years and over | 8 (66.7%) | 13 (32.5%) |
Disability Class: Vision Difficulty
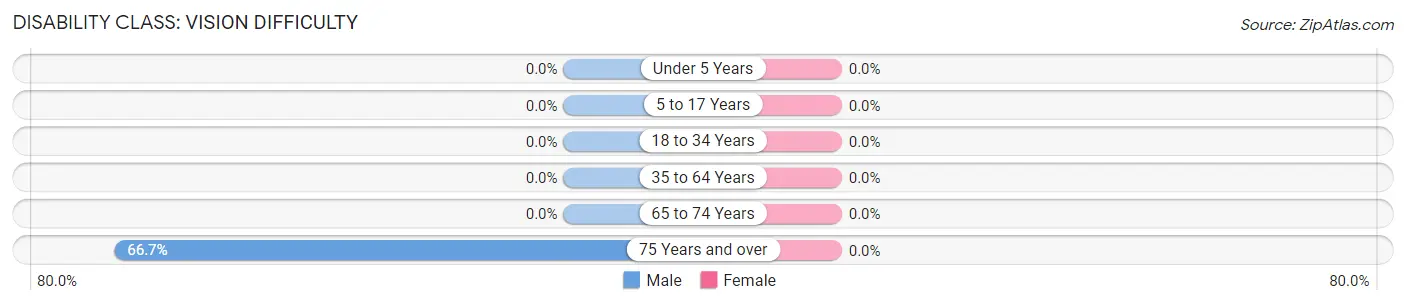
| Age Bracket | Male | Female |
| Under 5 Years | 0 (0.0%) | 0 (0.0%) |
| 5 to 17 Years | 0 (0.0%) | 0 (0.0%) |
| 18 to 34 Years | 0 (0.0%) | 0 (0.0%) |
| 35 to 64 Years | 0 (0.0%) | 0 (0.0%) |
| 65 to 74 Years | 0 (0.0%) | 0 (0.0%) |
| 75 Years and over | 8 (66.7%) | 0 (0.0%) |
Disability Class: Cognitive Difficulty
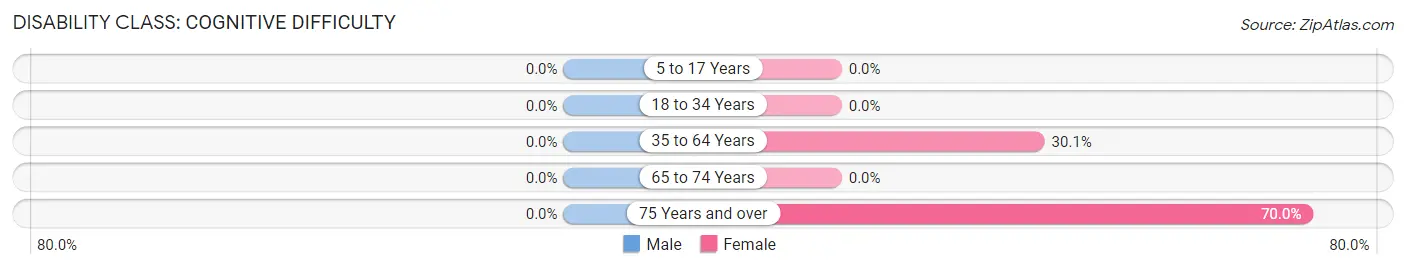
| Age Bracket | Male | Female |
| 5 to 17 Years | 0 (0.0%) | 0 (0.0%) |
| 18 to 34 Years | 0 (0.0%) | 0 (0.0%) |
| 35 to 64 Years | 0 (0.0%) | 25 (30.1%) |
| 65 to 74 Years | 0 (0.0%) | 0 (0.0%) |
| 75 Years and over | 0 (0.0%) | 28 (70.0%) |
Disability Class: Ambulatory Difficulty
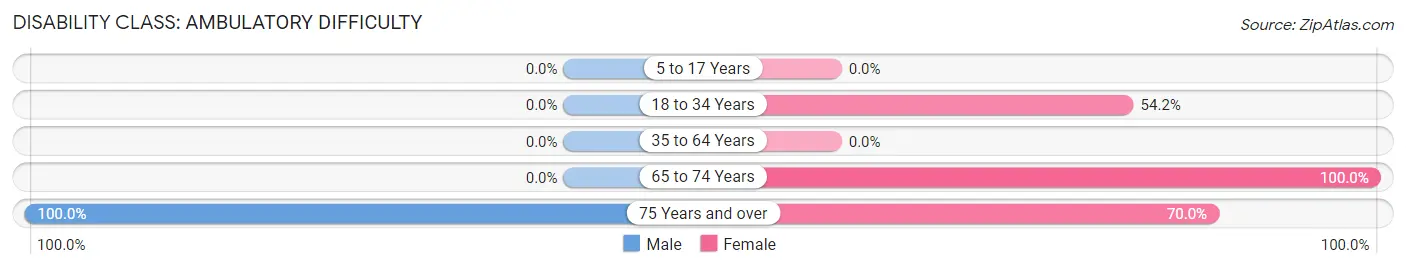
| Age Bracket | Male | Female |
| 5 to 17 Years | 0 (0.0%) | 0 (0.0%) |
| 18 to 34 Years | 0 (0.0%) | 13 (54.2%) |
| 35 to 64 Years | 0 (0.0%) | 0 (0.0%) |
| 65 to 74 Years | 0 (0.0%) | 13 (100.0%) |
| 75 Years and over | 12 (100.0%) | 28 (70.0%) |
Disability Class: Self-Care Difficulty
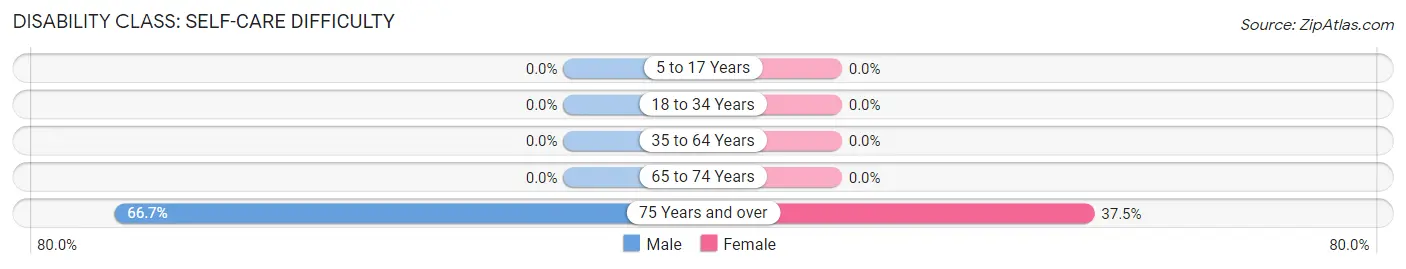
| Age Bracket | Male | Female |
| 5 to 17 Years | 0 (0.0%) | 0 (0.0%) |
| 18 to 34 Years | 0 (0.0%) | 0 (0.0%) |
| 35 to 64 Years | 0 (0.0%) | 0 (0.0%) |
| 65 to 74 Years | 0 (0.0%) | 0 (0.0%) |
| 75 Years and over | 8 (66.7%) | 15 (37.5%) |
Technology Access in Wacissa
Computing Device Access in Wacissa
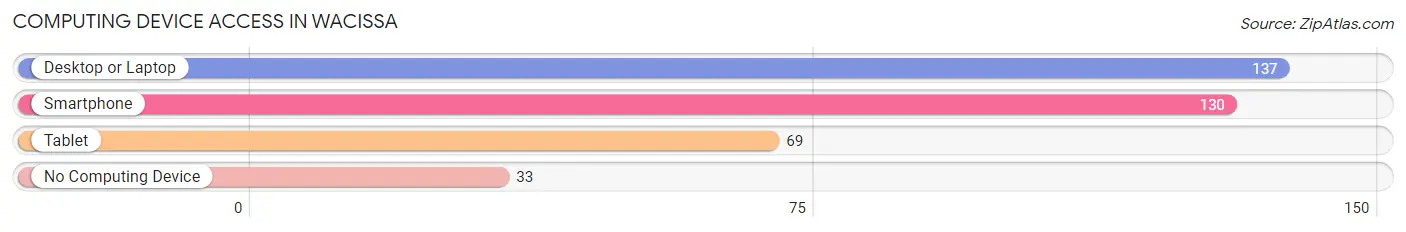
| Device Type | # Households | % Households |
| Desktop or Laptop | 137 | 70.3% |
| Smartphone | 130 | 66.7% |
| Tablet | 69 | 35.4% |
| No Computing Device | 33 | 16.9% |
| Total | 195 | 100.0% |
Internet Access in Wacissa
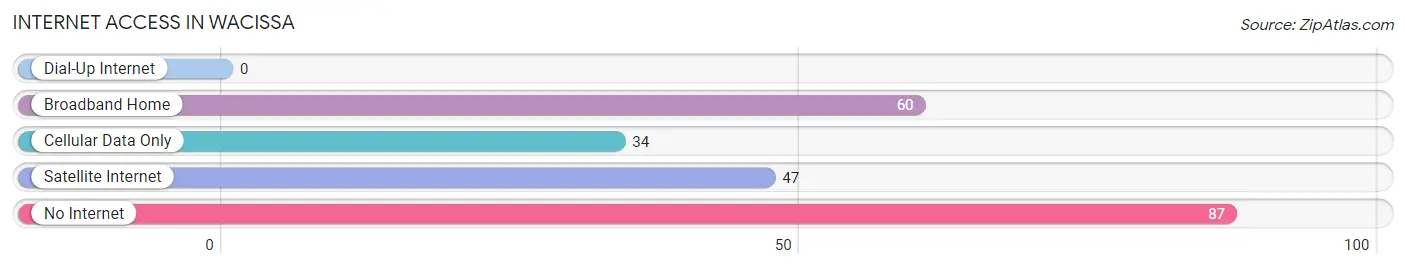
| Internet Type | # Households | % Households |
| Dial-Up Internet | 0 | 0.0% |
| Broadband Home | 60 | 30.8% |
| Cellular Data Only | 34 | 17.4% |
| Satellite Internet | 47 | 24.1% |
| No Internet | 87 | 44.6% |
| Total | 195 | 100.0% |
Wacissa Summary
Wacissa is a small unincorporated community located in Jefferson County, Florida. It is situated on the banks of the Wacissa River, which is a tributary of the Aucilla River. The town is located about 10 miles south of Monticello, the county seat, and about 25 miles east of Tallahassee, the state capital. The population of Wacissa was estimated to be around 200 people in 2020.
History
The area around Wacissa has been inhabited for thousands of years. Archaeological evidence suggests that Native Americans lived in the area as early as 12,000 years ago. The first European settlers arrived in the area in the early 1800s. The town was originally known as “Wacissa Springs” and was established in 1837. The town was named after the nearby Wacissa River, which was named after the Seminole Indian word for “black water.”
The town was a popular destination for tourists in the late 19th and early 20th centuries. The Wacissa Springs Hotel was built in 1887 and was a popular destination for visitors. The hotel was destroyed by a fire in the 1920s and was never rebuilt.
Geography
Wacissa is located in the panhandle region of Florida. The town is situated on the banks of the Wacissa River, which is a tributary of the Aucilla River. The town is located about 10 miles south of Monticello, the county seat, and about 25 miles east of Tallahassee, the state capital. The town is surrounded by forests and wetlands, and is home to a variety of wildlife.
Economy
The economy of Wacissa is largely based on agriculture and forestry. The town is home to several farms and timber companies. The town is also home to a number of small businesses, including a general store, a gas station, and a restaurant.
Demographics
The population of Wacissa was estimated to be around 200 people in 2020. The town is predominantly white, with a small African American population. The median household income in Wacissa is around $30,000, which is lower than the state average. The town has a high poverty rate, with around 25% of the population living below the poverty line.
Conclusion
Wacissa is a small unincorporated community located in Jefferson County, Florida. It is situated on the banks of the Wacissa River, which is a tributary of the Aucilla River. The town is surrounded by forests and wetlands, and is home to a variety of wildlife. The economy of Wacissa is largely based on agriculture and forestry, and the town is home to several small businesses. The population of Wacissa was estimated to be around 200 people in 2020, and the town is predominantly white, with a small African American population.
Common Questions
What is Per Capita Income in Wacissa?
Per Capita income in Wacissa is $53,747.
What is the Median Family Income in Wacissa?
Median Family Income in Wacissa is $34,013.
What is Income or Wage Gap in Wacissa?
Income or Wage Gap in Wacissa is 41.9%.
Women in Wacissa earn 58.1 cents for every dollar earned by a man.
What is Inequality or Gini Index in Wacissa?
Inequality or Gini Index in Wacissa is 0.32.
What is the Total Population of Wacissa?
Total Population of Wacissa is 330.
What is the Total Male Population of Wacissa?
Total Male Population of Wacissa is 157.
What is the Total Female Population of Wacissa?
Total Female Population of Wacissa is 173.
What is the Ratio of Males per 100 Females in Wacissa?
There are 90.75 Males per 100 Females in Wacissa.
What is the Ratio of Females per 100 Males in Wacissa?
There are 110.19 Females per 100 Males in Wacissa.
What is the Median Population Age in Wacissa?
Median Population Age in Wacissa is 60.2 Years.
What is the Average Family Size in Wacissa
Average Family Size in Wacissa is 2.4 People.
What is the Average Household Size in Wacissa
Average Household Size in Wacissa is 1.7 People.
How Large is the Labor Force in Wacissa?
There are 177 People in the Labor Forcein in Wacissa.
What is the Percentage of People in the Labor Force in Wacissa?
59.4% of People are in the Labor Force in Wacissa.
What is the Unemployment Rate in Wacissa?
Unemployment Rate in Wacissa is 12.4%.