Bayshore Gardens, FL Map & Demographics
Bayshore Gardens Map
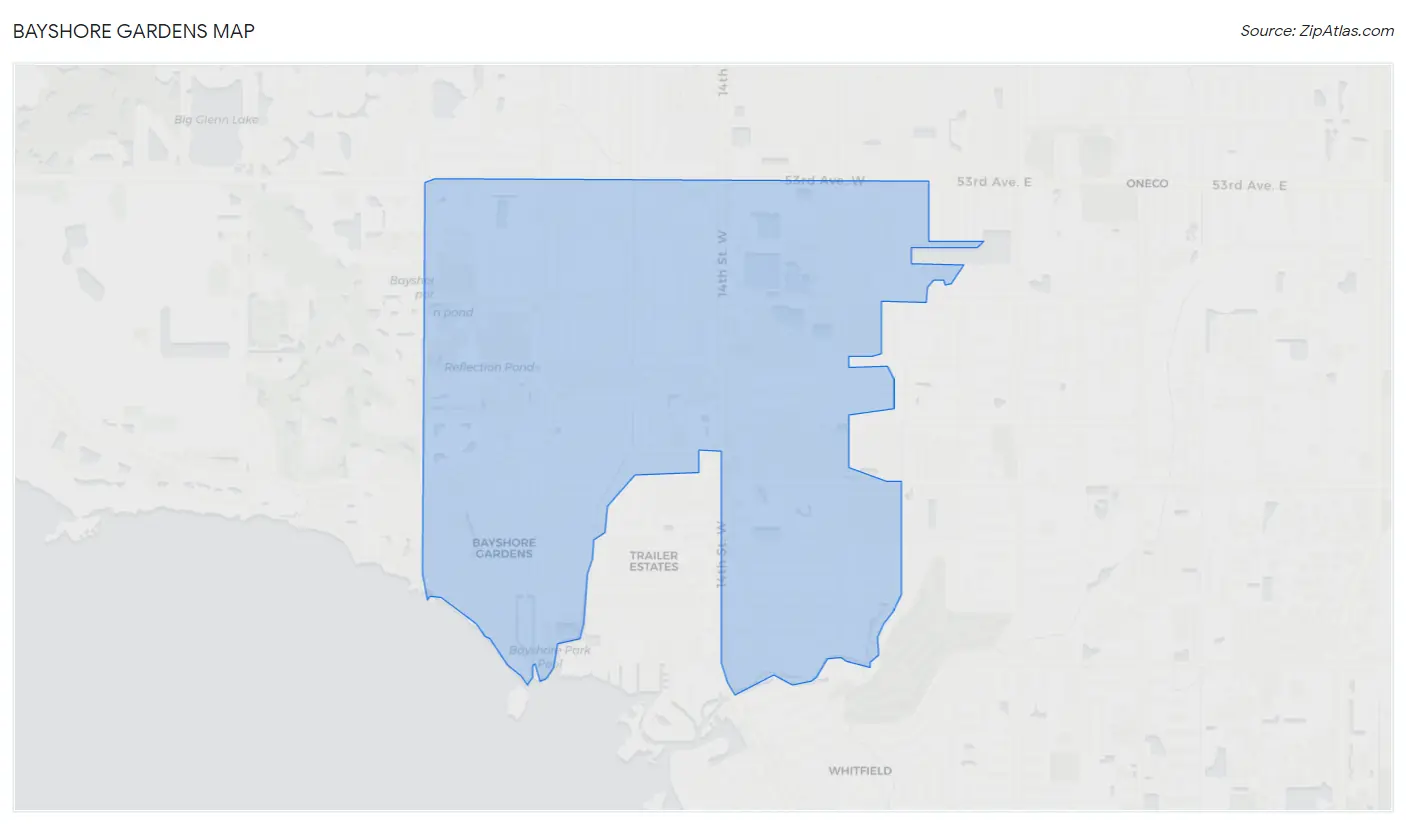
Bayshore Gardens Overview
$26,720
PER CAPITA INCOME
$60,919
AVG FAMILY INCOME
$49,003
AVG HOUSEHOLD INCOME
38.6%
WAGE / INCOME GAP [ % ]
61.4¢/ $1
WAGE / INCOME GAP [ $ ]
0.41
INEQUALITY / GINI INDEX
18,745
TOTAL POPULATION
9,085
MALE POPULATION
9,660
FEMALE POPULATION
94.05
MALES / 100 FEMALES
106.33
FEMALES / 100 MALES
47.5
MEDIAN AGE
3.2
AVG FAMILY SIZE
2.4
AVG HOUSEHOLD SIZE
8,635
LABOR FORCE [ PEOPLE ]
54.5%
PERCENT IN LABOR FORCE
11.7%
UNEMPLOYMENT RATE
Income in Bayshore Gardens
Income Overview in Bayshore Gardens
Per Capita Income in Bayshore Gardens is $26,720, while median incomes of families and households are $60,919 and $49,003 respectively.
| Characteristic | Number | Measure |
| Per Capita Income | 18,745 | $26,720 |
| Median Family Income | 4,053 | $60,919 |
| Mean Family Income | 4,053 | $73,108 |
| Median Household Income | 7,636 | $49,003 |
| Mean Household Income | 7,636 | $60,934 |
| Income Deficit | 4,053 | $0 |
| Wage / Income Gap (%) | 18,745 | 38.63% |
| Wage / Income Gap ($) | 18,745 | 61.37¢ per $1 |
| Gini / Inequality Index | 18,745 | 0.41 |
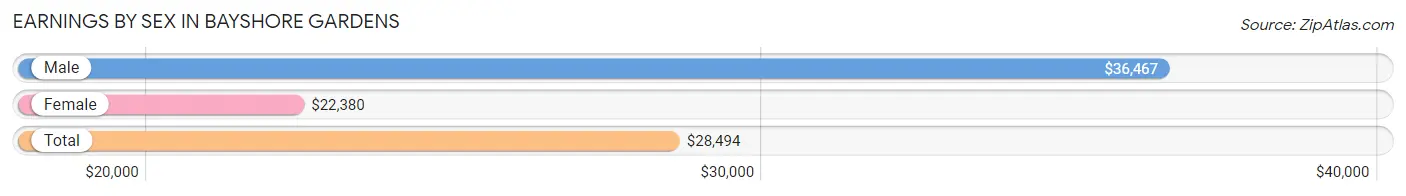
Earnings by Sex in Bayshore Gardens
Average Earnings in Bayshore Gardens are $28,494, $36,467 for men and $22,380 for women, a difference of 38.6%.
| Sex | Number | Average Earnings |
| Male | 4,710 (53.1%) | $36,467 |
| Female | 4,151 (46.9%) | $22,380 |
| Total | 8,861 (100.0%) | $28,494 |
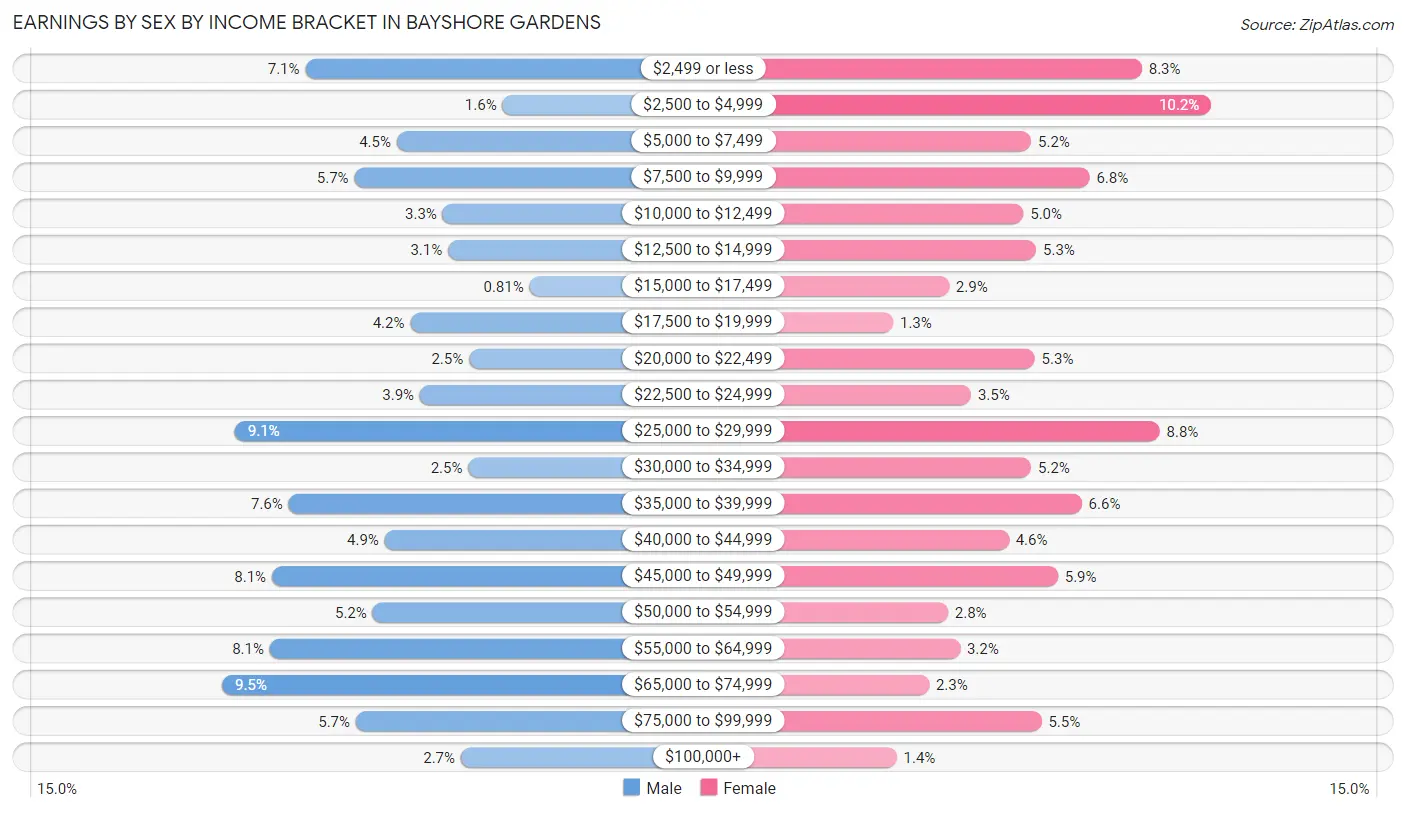
Earnings by Sex by Income Bracket in Bayshore Gardens
The most common earnings brackets in Bayshore Gardens are $65,000 to $74,999 for men (445 | 9.5%) and $2,500 to $4,999 for women (425 | 10.2%).
| Income | Male | Female |
| $2,499 or less | 335 (7.1%) | 344 (8.3%) |
| $2,500 to $4,999 | 74 (1.6%) | 425 (10.2%) |
| $5,000 to $7,499 | 214 (4.5%) | 215 (5.2%) |
| $7,500 to $9,999 | 270 (5.7%) | 283 (6.8%) |
| $10,000 to $12,499 | 153 (3.3%) | 206 (5.0%) |
| $12,500 to $14,999 | 146 (3.1%) | 221 (5.3%) |
| $15,000 to $17,499 | 38 (0.8%) | 119 (2.9%) |
| $17,500 to $19,999 | 196 (4.2%) | 54 (1.3%) |
| $20,000 to $22,499 | 118 (2.5%) | 219 (5.3%) |
| $22,500 to $24,999 | 183 (3.9%) | 145 (3.5%) |
| $25,000 to $29,999 | 428 (9.1%) | 365 (8.8%) |
| $30,000 to $34,999 | 119 (2.5%) | 215 (5.2%) |
| $35,000 to $39,999 | 357 (7.6%) | 274 (6.6%) |
| $40,000 to $44,999 | 230 (4.9%) | 189 (4.5%) |
| $45,000 to $49,999 | 379 (8.1%) | 246 (5.9%) |
| $50,000 to $54,999 | 246 (5.2%) | 118 (2.8%) |
| $55,000 to $64,999 | 382 (8.1%) | 132 (3.2%) |
| $65,000 to $74,999 | 445 (9.5%) | 96 (2.3%) |
| $75,000 to $99,999 | 268 (5.7%) | 227 (5.5%) |
| $100,000+ | 129 (2.7%) | 58 (1.4%) |
| Total | 4,710 (100.0%) | 4,151 (100.0%) |
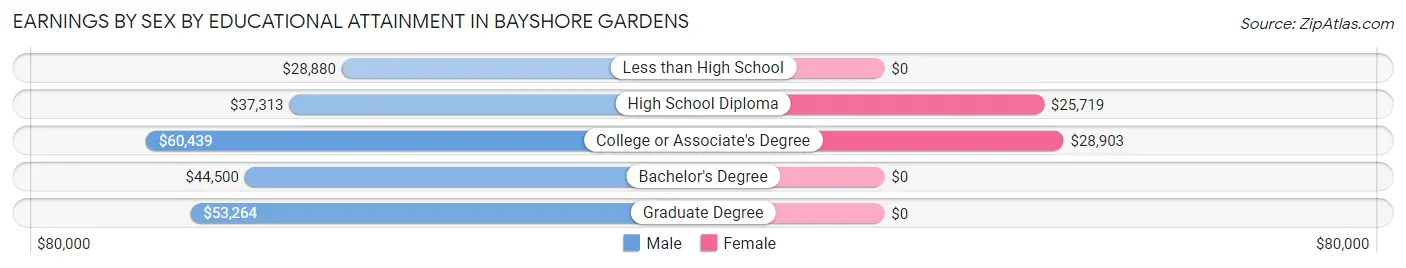
Earnings by Sex by Educational Attainment in Bayshore Gardens
Average earnings in Bayshore Gardens are $39,161 for men and $27,853 for women, a difference of 28.9%. Men with an educational attainment of college or associate's degree enjoy the highest average annual earnings of $60,439, while those with less than high school education earn the least with $28,880. Women with an educational attainment of college or associate's degree earn the most with the average annual earnings of $28,903, while those with high school diploma education have the smallest earnings of $25,719.
| Educational Attainment | Male Income | Female Income |
| Less than High School | $28,880 | $0 |
| High School Diploma | $37,313 | $25,719 |
| College or Associate's Degree | $60,439 | $28,903 |
| Bachelor's Degree | $44,500 | $0 |
| Graduate Degree | $53,264 | $0 |
| Total | $39,161 | $27,853 |
Family Income in Bayshore Gardens
Family Income Brackets in Bayshore Gardens
According to the Bayshore Gardens family income data, there are 1,208 families falling into the $50,000 to $74,999 income range, which is the most common income bracket and makes up 29.8% of all families. Conversely, the $10,000 to $14,999 income bracket is the least frequent group with only 20 families (0.5%) belonging to this category.
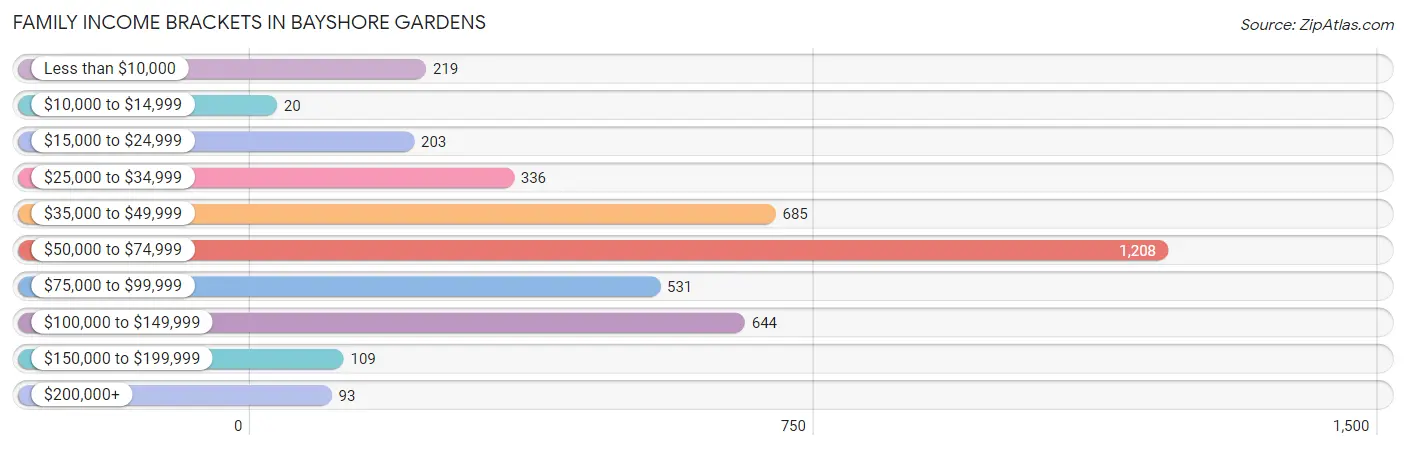
| Income Bracket | # Families | % Families |
| Less than $10,000 | 219 | 5.4% |
| $10,000 to $14,999 | 20 | 0.5% |
| $15,000 to $24,999 | 203 | 5.0% |
| $25,000 to $34,999 | 336 | 8.3% |
| $35,000 to $49,999 | 685 | 16.9% |
| $50,000 to $74,999 | 1,208 | 29.8% |
| $75,000 to $99,999 | 531 | 13.1% |
| $100,000 to $149,999 | 644 | 15.9% |
| $150,000 to $199,999 | 109 | 2.7% |
| $200,000+ | 93 | 2.3% |
Family Income by Famaliy Size in Bayshore Gardens
6-person families (40 | 1.0%) account for the highest median family income in Bayshore Gardens with $68,750 per family, while 2-person families (2,380 | 58.7%) have the highest median income of $32,466 per family member.
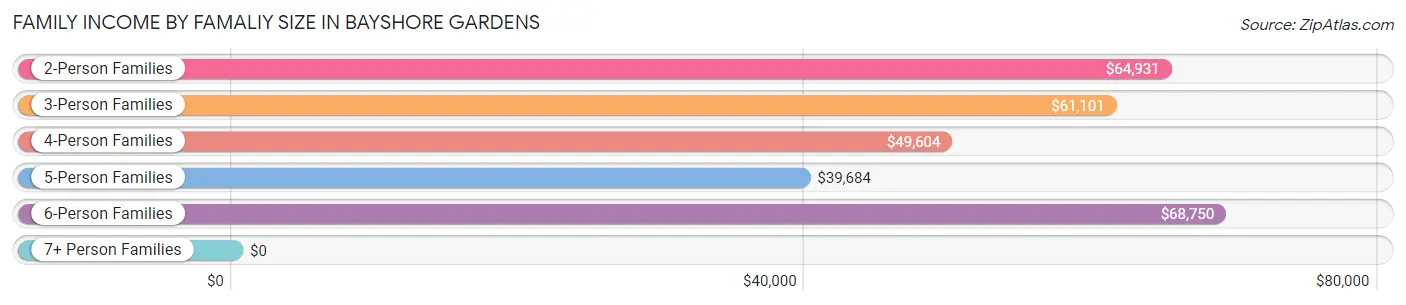
| Income Bracket | # Families | Median Income |
| 2-Person Families | 2,380 (58.7%) | $64,931 |
| 3-Person Families | 707 (17.4%) | $61,101 |
| 4-Person Families | 651 (16.1%) | $49,604 |
| 5-Person Families | 231 (5.7%) | $39,684 |
| 6-Person Families | 40 (1.0%) | $68,750 |
| 7+ Person Families | 44 (1.1%) | $0 |
| Total | 4,053 (100.0%) | $60,919 |
Family Income by Number of Earners in Bayshore Gardens
The median family income in Bayshore Gardens is $60,919, with families comprising 2 earners (1,245) having the highest median family income of $80,068, while families with no earners (1,003) have the lowest median family income of $50,302, accounting for 30.7% and 24.7% of families, respectively.
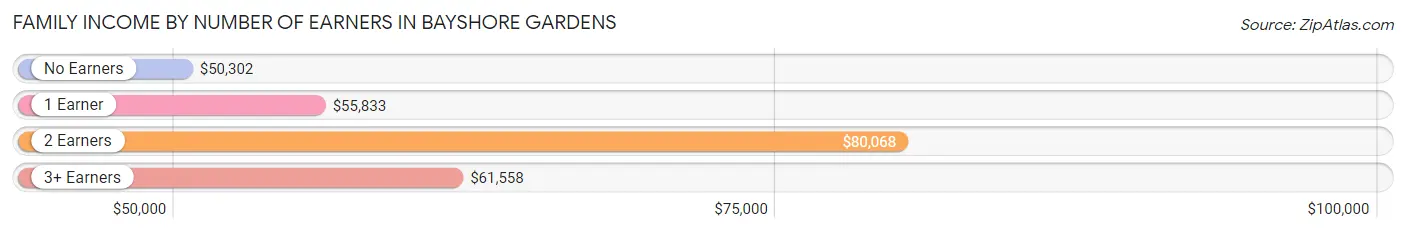
| Number of Earners | # Families | Median Income |
| No Earners | 1,003 (24.7%) | $50,302 |
| 1 Earner | 1,422 (35.1%) | $55,833 |
| 2 Earners | 1,245 (30.7%) | $80,068 |
| 3+ Earners | 383 (9.5%) | $61,558 |
| Total | 4,053 (100.0%) | $60,919 |
Household Income in Bayshore Gardens
Household Income Brackets in Bayshore Gardens
With 1,542 households falling in the category, the $50,000 to $74,999 income range is the most frequent in Bayshore Gardens, accounting for 20.2% of all households. In contrast, only 122 households (1.6%) fall into the $200,000+ income bracket, making it the least populous group.
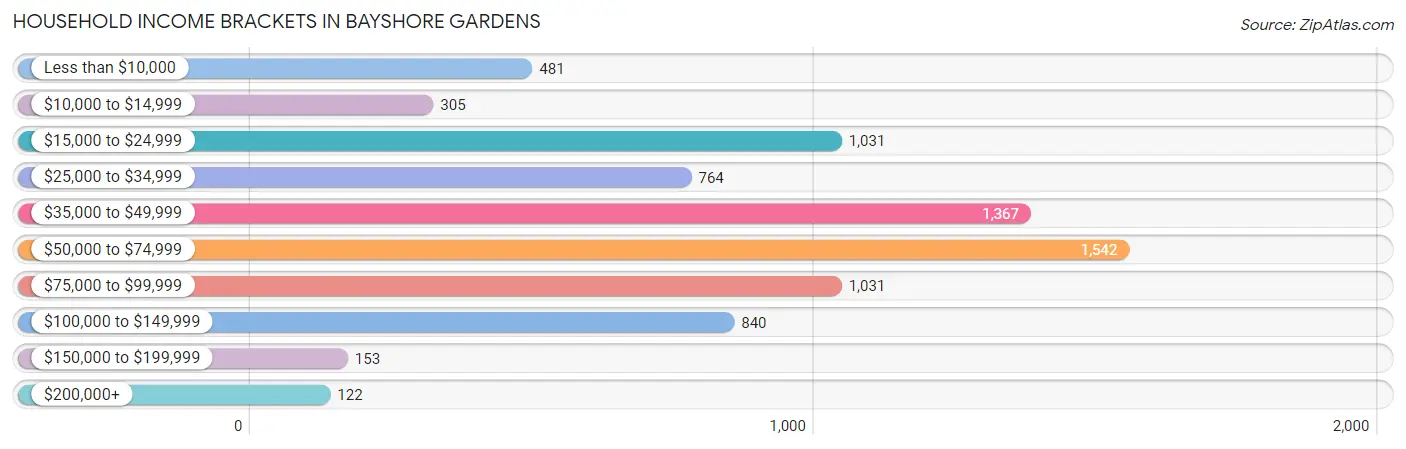
| Income Bracket | # Households | % Households |
| Less than $10,000 | 481 | 6.3% |
| $10,000 to $14,999 | 305 | 4.0% |
| $15,000 to $24,999 | 1,031 | 13.5% |
| $25,000 to $34,999 | 764 | 10.0% |
| $35,000 to $49,999 | 1,367 | 17.9% |
| $50,000 to $74,999 | 1,542 | 20.2% |
| $75,000 to $99,999 | 1,031 | 13.5% |
| $100,000 to $149,999 | 840 | 11.0% |
| $150,000 to $199,999 | 153 | 2.0% |
| $200,000+ | 122 | 1.6% |
Household Income by Householder Age in Bayshore Gardens
The median household income in Bayshore Gardens is $49,003, with the highest median household income of $61,650 found in the 45 to 64 years age bracket for the primary householder. A total of 2,354 households (30.8%) fall into this category. Meanwhile, the 65+ years age bracket for the primary householder has the lowest median household income of $35,900, with 3,657 households (47.9%) in this group.
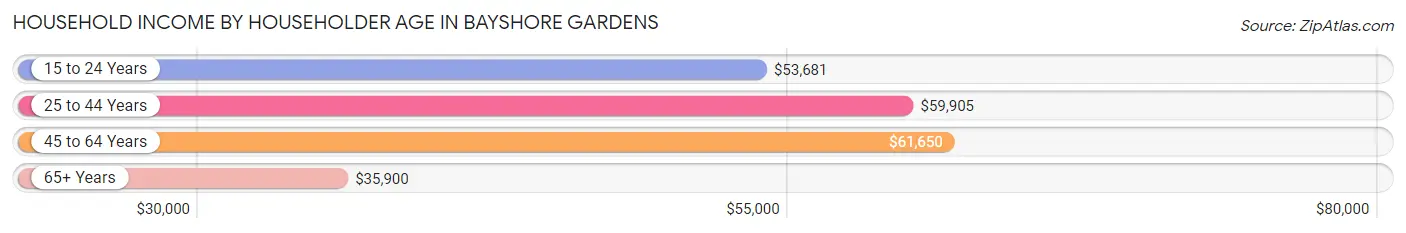
| Income Bracket | # Households | Median Income |
| 15 to 24 Years | 269 (3.5%) | $53,681 |
| 25 to 44 Years | 1,356 (17.8%) | $59,905 |
| 45 to 64 Years | 2,354 (30.8%) | $61,650 |
| 65+ Years | 3,657 (47.9%) | $35,900 |
| Total | 7,636 (100.0%) | $49,003 |
Poverty in Bayshore Gardens
Income Below Poverty by Sex and Age in Bayshore Gardens
With 14.3% poverty level for males and 14.5% for females among the residents of Bayshore Gardens, 16 and 17 year old males and 45 to 54 year old females are the most vulnerable to poverty, with 81 males (59.6%) and 358 females (37.6%) in their respective age groups living below the poverty level.
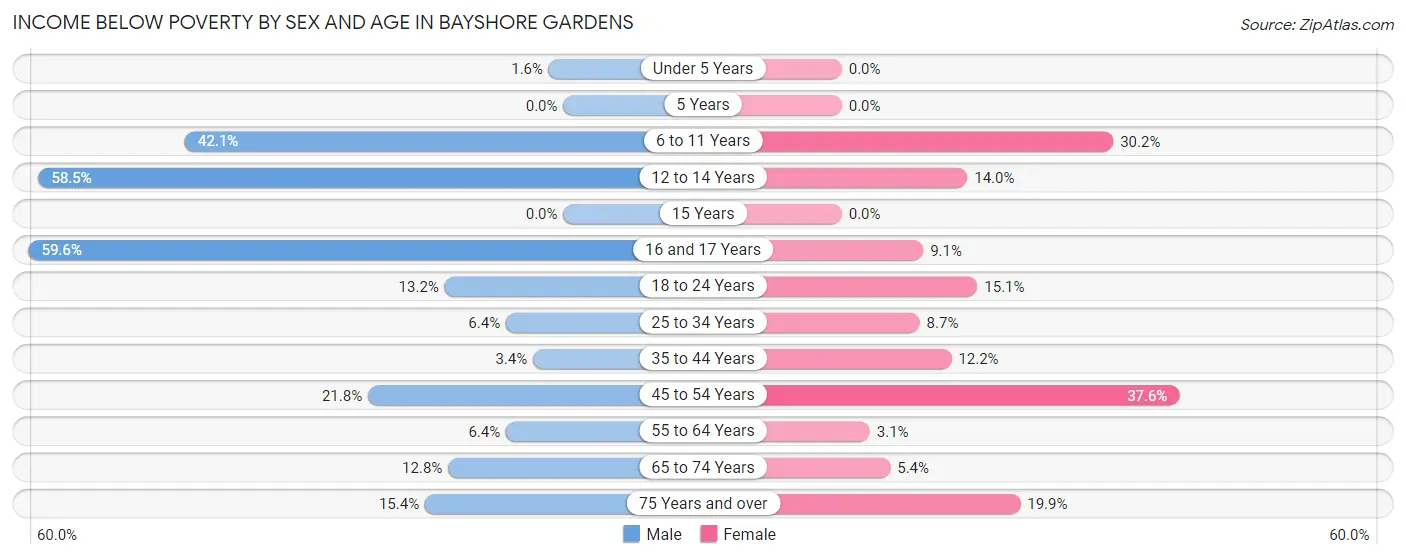
| Age Bracket | Male | Female |
| Under 5 Years | 7 (1.6%) | 0 (0.0%) |
| 5 Years | 0 (0.0%) | 0 (0.0%) |
| 6 to 11 Years | 169 (42.1%) | 198 (30.2%) |
| 12 to 14 Years | 159 (58.5%) | 59 (14.0%) |
| 15 Years | 0 (0.0%) | 0 (0.0%) |
| 16 and 17 Years | 81 (59.6%) | 34 (9.1%) |
| 18 to 24 Years | 126 (13.2%) | 130 (15.1%) |
| 25 to 34 Years | 50 (6.4%) | 82 (8.7%) |
| 35 to 44 Years | 33 (3.4%) | 104 (12.2%) |
| 45 to 54 Years | 265 (21.8%) | 358 (37.6%) |
| 55 to 64 Years | 78 (6.4%) | 37 (3.1%) |
| 65 to 74 Years | 175 (12.8%) | 78 (5.4%) |
| 75 Years and over | 151 (15.4%) | 302 (19.9%) |
| Total | 1,294 (14.3%) | 1,382 (14.5%) |
Income Above Poverty by Sex and Age in Bayshore Gardens
According to the poverty statistics in Bayshore Gardens, males aged 5 years and females aged under 5 years are the age groups that are most secure financially, with 100.0% of males and 100.0% of females in these age groups living above the poverty line.
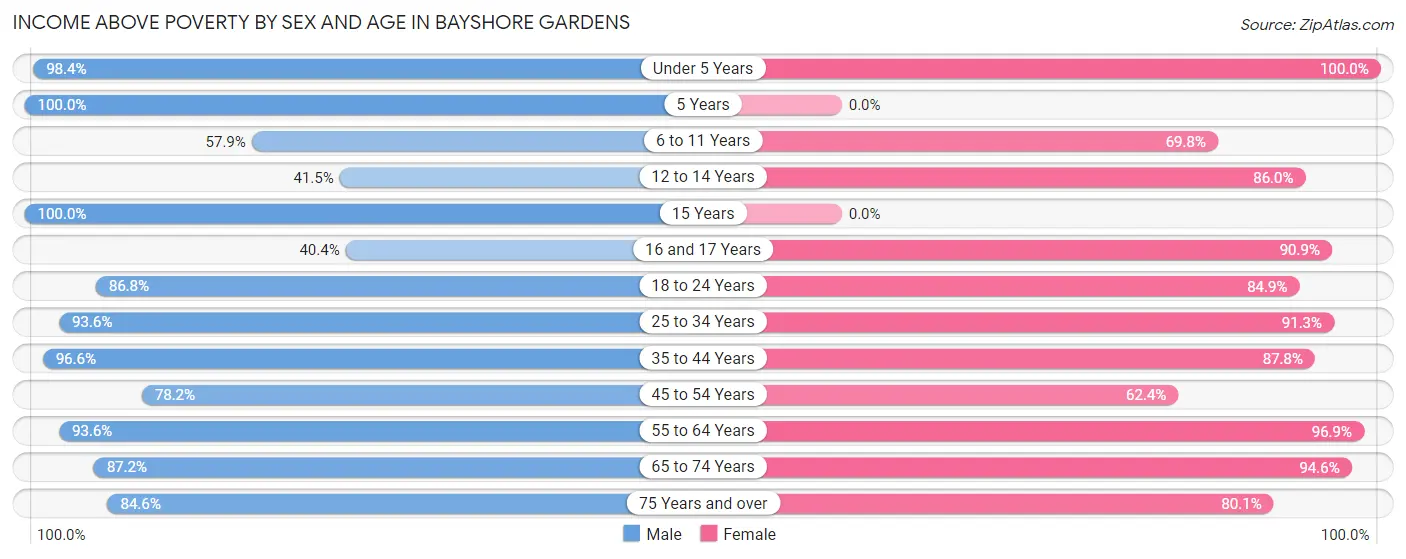
| Age Bracket | Male | Female |
| Under 5 Years | 427 (98.4%) | 325 (100.0%) |
| 5 Years | 30 (100.0%) | 0 (0.0%) |
| 6 to 11 Years | 232 (57.9%) | 457 (69.8%) |
| 12 to 14 Years | 113 (41.5%) | 363 (86.0%) |
| 15 Years | 279 (100.0%) | 0 (0.0%) |
| 16 and 17 Years | 55 (40.4%) | 341 (90.9%) |
| 18 to 24 Years | 827 (86.8%) | 731 (84.9%) |
| 25 to 34 Years | 733 (93.6%) | 864 (91.3%) |
| 35 to 44 Years | 947 (96.6%) | 748 (87.8%) |
| 45 to 54 Years | 953 (78.2%) | 595 (62.4%) |
| 55 to 64 Years | 1,145 (93.6%) | 1,149 (96.9%) |
| 65 to 74 Years | 1,189 (87.2%) | 1,366 (94.6%) |
| 75 Years and over | 829 (84.6%) | 1,217 (80.1%) |
| Total | 7,759 (85.7%) | 8,156 (85.5%) |
Income Below Poverty Among Married-Couple Families in Bayshore Gardens
The poverty statistics for married-couple families in Bayshore Gardens show that 9.6% or 252 of the total 2,630 families live below the poverty line. Families with 1 or 2 children have the highest poverty rate of 26.9%, comprising of 170 families. On the other hand, families with 3 or 4 children have the lowest poverty rate of 0.0%, which includes 0 families.
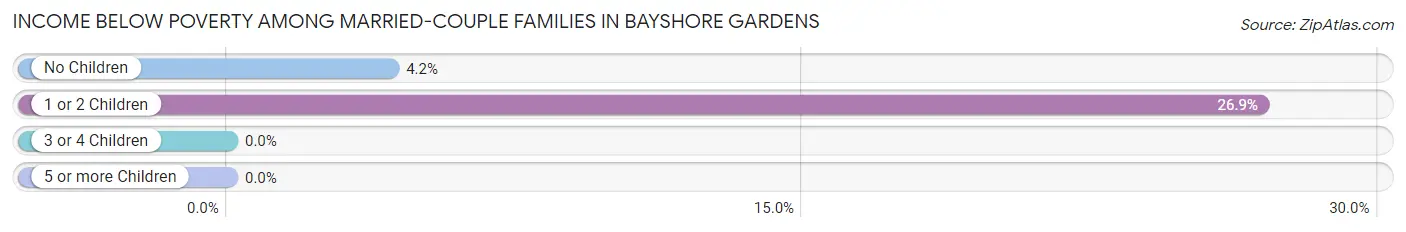
| Children | Above Poverty | Below Poverty |
| No Children | 1,864 (95.8%) | 82 (4.2%) |
| 1 or 2 Children | 461 (73.1%) | 170 (26.9%) |
| 3 or 4 Children | 53 (100.0%) | 0 (0.0%) |
| 5 or more Children | 0 (0.0%) | 0 (0.0%) |
| Total | 2,378 (90.4%) | 252 (9.6%) |
Income Below Poverty Among Single-Parent Households in Bayshore Gardens
According to the poverty data in Bayshore Gardens, 6.2% or 33 single-father households and 13.3% or 119 single-mother households are living below the poverty line. Among single-father households, those with 1 or 2 children have the highest poverty rate, with 33 households (13.4%) experiencing poverty. Likewise, among single-mother households, those with 3 or 4 children have the highest poverty rate, with 36 households (53.7%) falling below the poverty line.
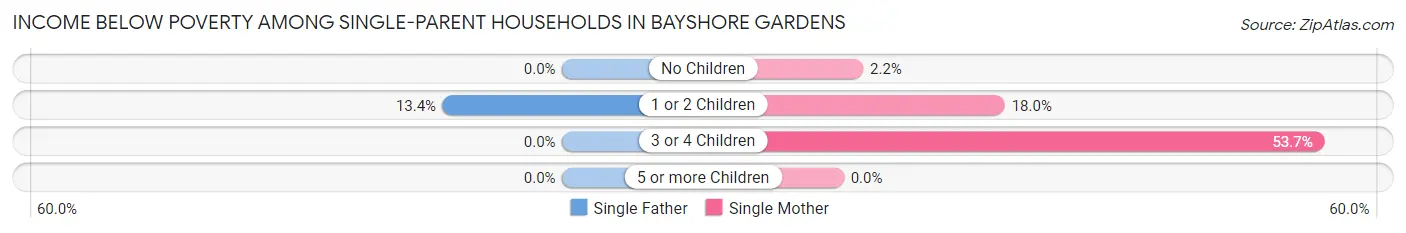
| Children | Single Father | Single Mother |
| No Children | 0 (0.0%) | 9 (2.2%) |
| 1 or 2 Children | 33 (13.4%) | 74 (18.0%) |
| 3 or 4 Children | 0 (0.0%) | 36 (53.7%) |
| 5 or more Children | 0 (0.0%) | 0 (0.0%) |
| Total | 33 (6.2%) | 119 (13.3%) |
Income Below Poverty Among Married-Couple vs Single-Parent Households in Bayshore Gardens
The poverty data for Bayshore Gardens shows that 252 of the married-couple family households (9.6%) and 152 of the single-parent households (10.7%) are living below the poverty level. Within the married-couple family households, those with 1 or 2 children have the highest poverty rate, with 170 households (26.9%) falling below the poverty line. Among the single-parent households, those with 3 or 4 children have the highest poverty rate, with 36 household (42.3%) living below poverty.
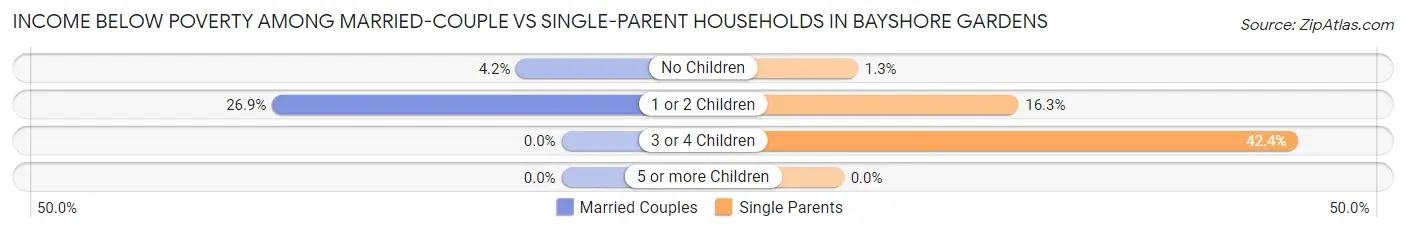
| Children | Married-Couple Families | Single-Parent Households |
| No Children | 82 (4.2%) | 9 (1.3%) |
| 1 or 2 Children | 170 (26.9%) | 107 (16.3%) |
| 3 or 4 Children | 0 (0.0%) | 36 (42.3%) |
| 5 or more Children | 0 (0.0%) | 0 (0.0%) |
| Total | 252 (9.6%) | 152 (10.7%) |
Race in Bayshore Gardens
The most populous races in Bayshore Gardens are White / Caucasian (14,484 | 77.3%), Hispanic or Latino (4,628 | 24.7%), and Black / African American (1,758 | 9.4%).
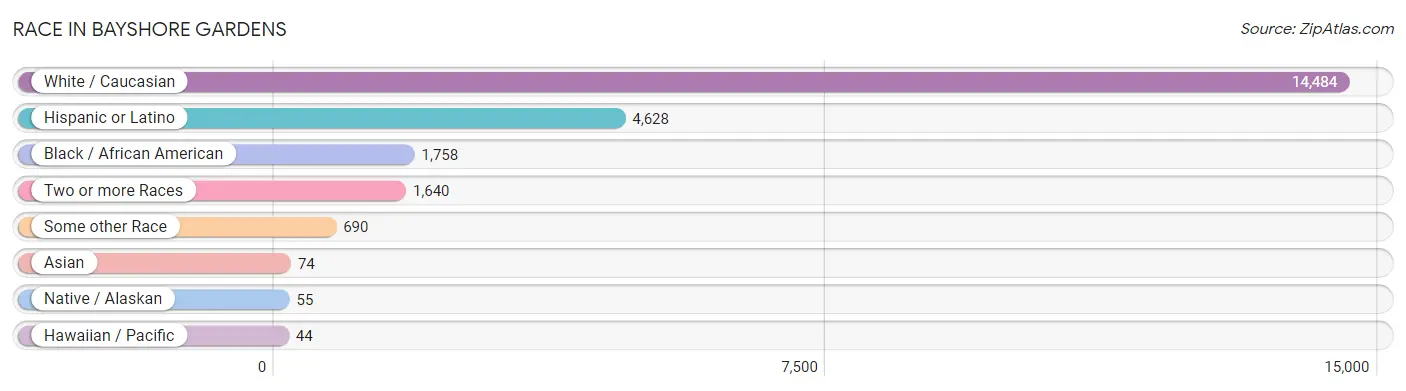
| Race | # Population | % Population |
| Asian | 74 | 0.4% |
| Black / African American | 1,758 | 9.4% |
| Hawaiian / Pacific | 44 | 0.2% |
| Hispanic or Latino | 4,628 | 24.7% |
| Native / Alaskan | 55 | 0.3% |
| White / Caucasian | 14,484 | 77.3% |
| Two or more Races | 1,640 | 8.7% |
| Some other Race | 690 | 3.7% |
| Total | 18,745 | 100.0% |
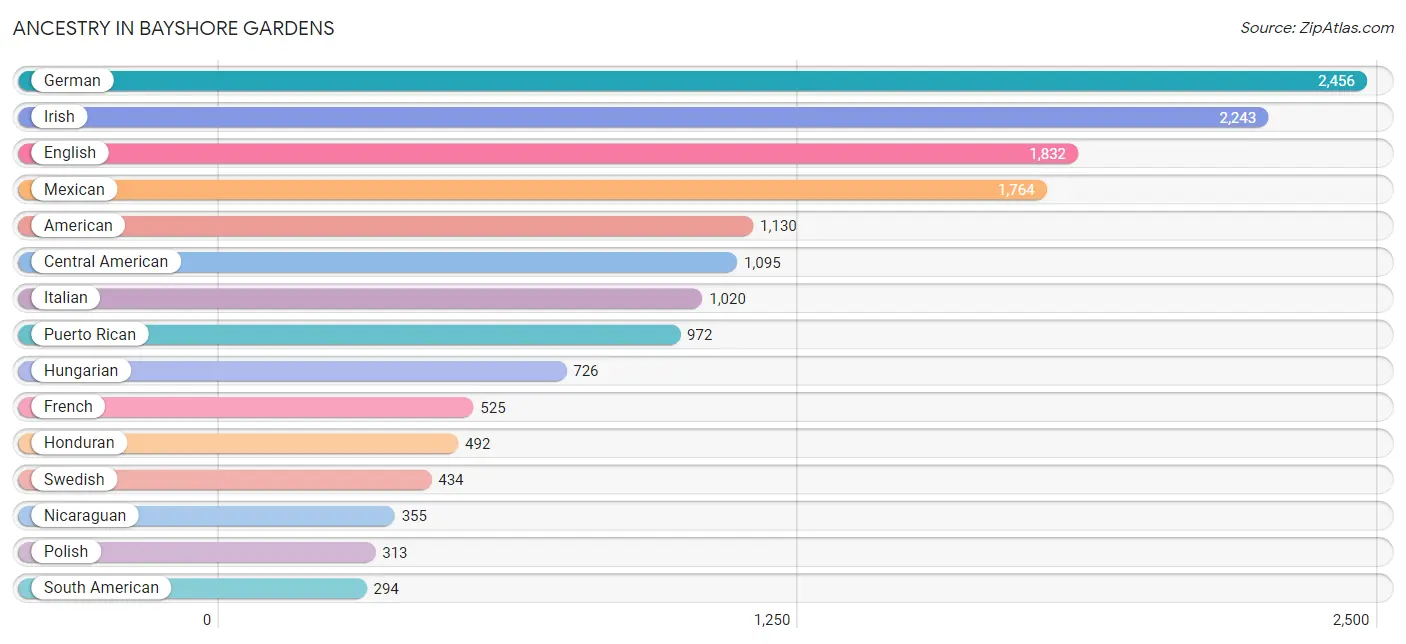
Ancestry in Bayshore Gardens
The most populous ancestries reported in Bayshore Gardens are German (2,456 | 13.1%), Irish (2,243 | 12.0%), English (1,832 | 9.8%), Mexican (1,764 | 9.4%), and American (1,130 | 6.0%), together accounting for 50.3% of all Bayshore Gardens residents.
| Ancestry | # Population | % Population |
| American | 1,130 | 6.0% |
| Apache | 19 | 0.1% |
| Arab | 27 | 0.1% |
| Australian | 19 | 0.1% |
| Barbadian | 8 | 0.0% |
| Belgian | 13 | 0.1% |
| Bhutanese | 13 | 0.1% |
| Brazilian | 13 | 0.1% |
| British | 187 | 1.0% |
| British West Indian | 20 | 0.1% |
| Bulgarian | 16 | 0.1% |
| Cajun | 15 | 0.1% |
| Canadian | 41 | 0.2% |
| Celtic | 73 | 0.4% |
| Central American | 1,095 | 5.8% |
| Central American Indian | 9 | 0.1% |
| Cherokee | 17 | 0.1% |
| Chippewa | 13 | 0.1% |
| Choctaw | 17 | 0.1% |
| Colombian | 240 | 1.3% |
| Croatian | 101 | 0.5% |
| Cuban | 276 | 1.5% |
| Czech | 79 | 0.4% |
| Danish | 17 | 0.1% |
| Dominican | 157 | 0.8% |
| Dutch | 158 | 0.8% |
| Eastern European | 24 | 0.1% |
| Ecuadorian | 30 | 0.2% |
| English | 1,832 | 9.8% |
| European | 155 | 0.8% |
| Finnish | 103 | 0.5% |
| French | 525 | 2.8% |
| French Canadian | 187 | 1.0% |
| German | 2,456 | 13.1% |
| Greek | 26 | 0.1% |
| Guatemalan | 71 | 0.4% |
| Honduran | 492 | 2.6% |
| Hungarian | 726 | 3.9% |
| Irish | 2,243 | 12.0% |
| Italian | 1,020 | 5.4% |
| Jamaican | 37 | 0.2% |
| Lebanese | 27 | 0.1% |
| Lithuanian | 28 | 0.2% |
| Luxembourger | 12 | 0.1% |
| Mexican | 1,764 | 9.4% |
| Nicaraguan | 355 | 1.9% |
| Northern European | 67 | 0.4% |
| Norwegian | 160 | 0.9% |
| Panamanian | 119 | 0.6% |
| Pennsylvania German | 39 | 0.2% |
| Peruvian | 9 | 0.1% |
| Polish | 313 | 1.7% |
| Portuguese | 23 | 0.1% |
| Puerto Rican | 972 | 5.2% |
| Romanian | 107 | 0.6% |
| Russian | 77 | 0.4% |
| Salvadoran | 58 | 0.3% |
| Samoan | 26 | 0.1% |
| Scandinavian | 18 | 0.1% |
| Scotch-Irish | 129 | 0.7% |
| Scottish | 199 | 1.1% |
| Serbian | 44 | 0.2% |
| Slovak | 91 | 0.5% |
| Slovene | 42 | 0.2% |
| South American | 294 | 1.6% |
| Sri Lankan | 16 | 0.1% |
| Swedish | 434 | 2.3% |
| Swiss | 34 | 0.2% |
| Thai | 45 | 0.2% |
| Turkish | 59 | 0.3% |
| Ukrainian | 25 | 0.1% |
| Venezuelan | 15 | 0.1% |
| Welsh | 30 | 0.2% |
| Yugoslavian | 109 | 0.6% | View All 74 Rows |
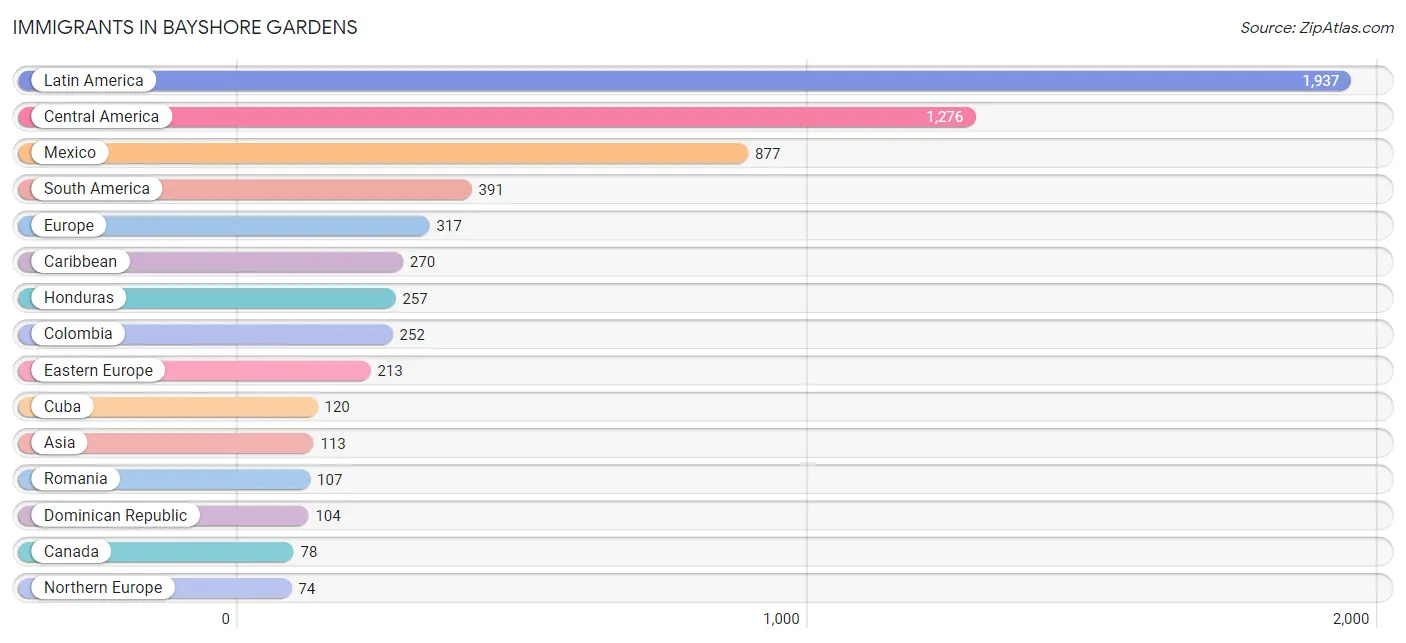
Immigrants in Bayshore Gardens
The most numerous immigrant groups reported in Bayshore Gardens came from Latin America (1,937 | 10.3%), Central America (1,276 | 6.8%), Mexico (877 | 4.7%), South America (391 | 2.1%), and Europe (317 | 1.7%), together accounting for 25.6% of all Bayshore Gardens residents.
| Immigration Origin | # Population | % Population |
| Asia | 113 | 0.6% |
| Barbados | 26 | 0.1% |
| Brazil | 13 | 0.1% |
| Canada | 78 | 0.4% |
| Caribbean | 270 | 1.4% |
| Central America | 1,276 | 6.8% |
| Colombia | 252 | 1.3% |
| Cuba | 120 | 0.6% |
| Dominican Republic | 104 | 0.5% |
| Eastern Asia | 13 | 0.1% |
| Eastern Europe | 213 | 1.1% |
| Ecuador | 66 | 0.4% |
| El Salvador | 58 | 0.3% |
| England | 34 | 0.2% |
| Europe | 317 | 1.7% |
| Germany | 22 | 0.1% |
| Guatemala | 73 | 0.4% |
| Honduras | 257 | 1.4% |
| Hungary | 48 | 0.3% |
| India | 45 | 0.2% |
| Japan | 13 | 0.1% |
| Latin America | 1,937 | 10.3% |
| Mexico | 877 | 4.7% |
| Netherlands | 8 | 0.0% |
| Northern Europe | 74 | 0.4% |
| Oceania | 18 | 0.1% |
| Panama | 11 | 0.1% |
| Peru | 60 | 0.3% |
| Romania | 107 | 0.6% |
| Serbia | 44 | 0.2% |
| South America | 391 | 2.1% |
| South Central Asia | 45 | 0.2% |
| South Eastern Asia | 16 | 0.1% |
| Sweden | 40 | 0.2% |
| Turkey | 39 | 0.2% |
| Ukraine | 14 | 0.1% |
| Vietnam | 16 | 0.1% |
| Western Asia | 39 | 0.2% |
| Western Europe | 30 | 0.2% | View All 39 Rows |
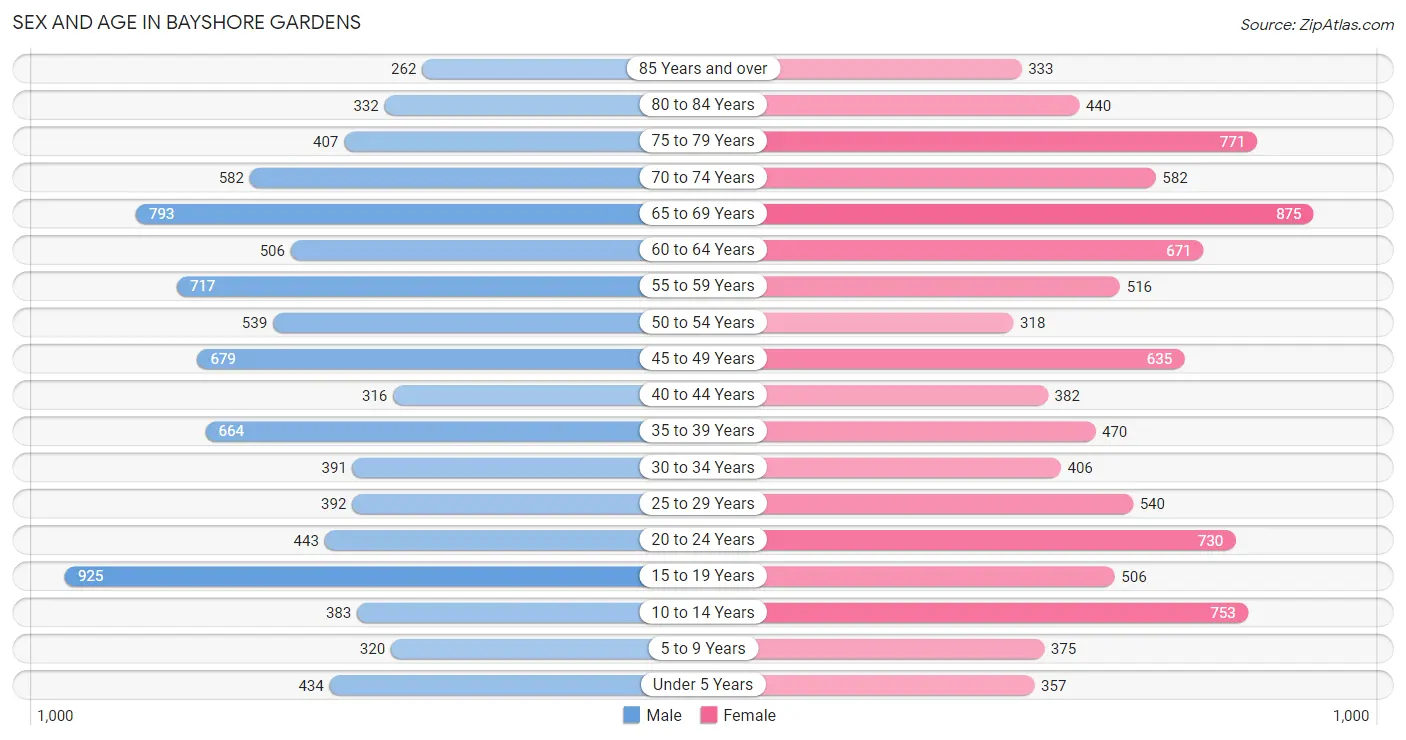
Sex and Age in Bayshore Gardens
Sex and Age in Bayshore Gardens
The most populous age groups in Bayshore Gardens are 15 to 19 Years (925 | 10.2%) for men and 65 to 69 Years (875 | 9.1%) for women.
| Age Bracket | Male | Female |
| Under 5 Years | 434 (4.8%) | 357 (3.7%) |
| 5 to 9 Years | 320 (3.5%) | 375 (3.9%) |
| 10 to 14 Years | 383 (4.2%) | 753 (7.8%) |
| 15 to 19 Years | 925 (10.2%) | 506 (5.2%) |
| 20 to 24 Years | 443 (4.9%) | 730 (7.6%) |
| 25 to 29 Years | 392 (4.3%) | 540 (5.6%) |
| 30 to 34 Years | 391 (4.3%) | 406 (4.2%) |
| 35 to 39 Years | 664 (7.3%) | 470 (4.9%) |
| 40 to 44 Years | 316 (3.5%) | 382 (4.0%) |
| 45 to 49 Years | 679 (7.5%) | 635 (6.6%) |
| 50 to 54 Years | 539 (5.9%) | 318 (3.3%) |
| 55 to 59 Years | 717 (7.9%) | 516 (5.3%) |
| 60 to 64 Years | 506 (5.6%) | 671 (7.0%) |
| 65 to 69 Years | 793 (8.7%) | 875 (9.1%) |
| 70 to 74 Years | 582 (6.4%) | 582 (6.0%) |
| 75 to 79 Years | 407 (4.5%) | 771 (8.0%) |
| 80 to 84 Years | 332 (3.6%) | 440 (4.5%) |
| 85 Years and over | 262 (2.9%) | 333 (3.5%) |
| Total | 9,085 (100.0%) | 9,660 (100.0%) |
Families and Households in Bayshore Gardens
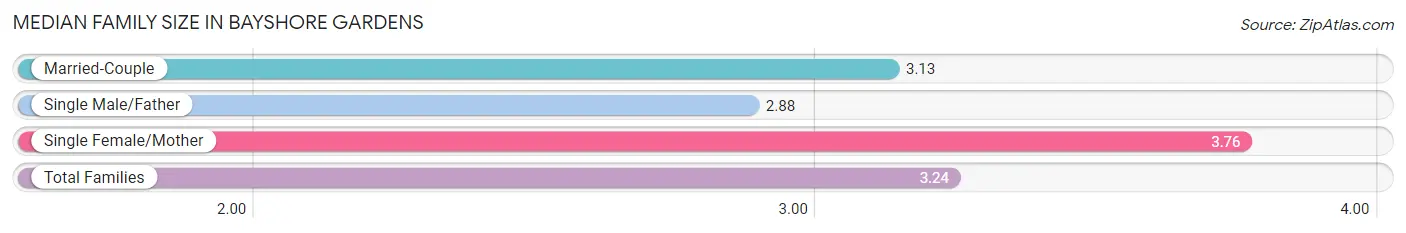
Median Family Size in Bayshore Gardens
The median family size in Bayshore Gardens is 3.24 persons per family, with single female/mother families (892 | 22.0%) accounting for the largest median family size of 3.76 persons per family. On the other hand, single male/father families (531 | 13.1%) represent the smallest median family size with 2.88 persons per family.
| Family Type | # Families | Family Size |
| Married-Couple | 2,630 (64.9%) | 3.13 |
| Single Male/Father | 531 (13.1%) | 2.88 |
| Single Female/Mother | 892 (22.0%) | 3.76 |
| Total Families | 4,053 (100.0%) | 3.24 |
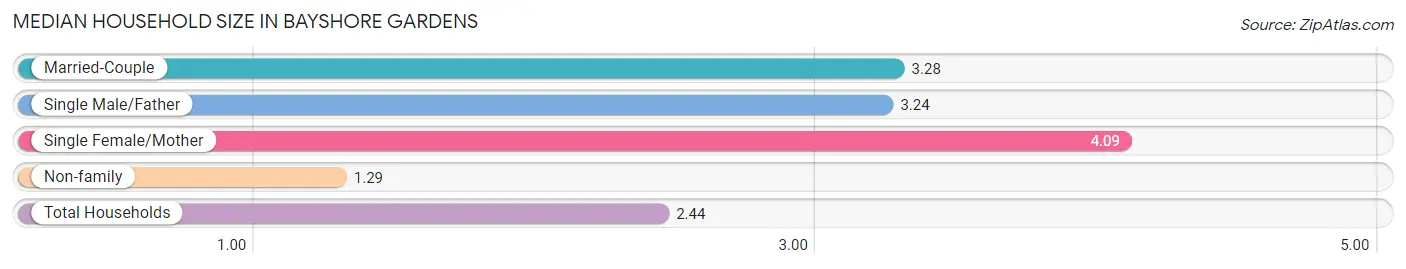
Median Household Size in Bayshore Gardens
The median household size in Bayshore Gardens is 2.44 persons per household, with single female/mother households (892 | 11.7%) accounting for the largest median household size of 4.09 persons per household. non-family households (3,583 | 46.9%) represent the smallest median household size with 1.29 persons per household.
| Household Type | # Households | Household Size |
| Married-Couple | 2,630 (34.4%) | 3.28 |
| Single Male/Father | 531 (7.0%) | 3.24 |
| Single Female/Mother | 892 (11.7%) | 4.09 |
| Non-family | 3,583 (46.9%) | 1.29 |
| Total Households | 7,636 (100.0%) | 2.44 |
Household Size by Marriage Status in Bayshore Gardens
Out of a total of 7,636 households in Bayshore Gardens, 4,053 (53.1%) are family households, while 3,583 (46.9%) are nonfamily households. The most numerous type of family households are 2-person households, comprising 2,200, and the most common type of nonfamily households are 1-person households, comprising 3,077.
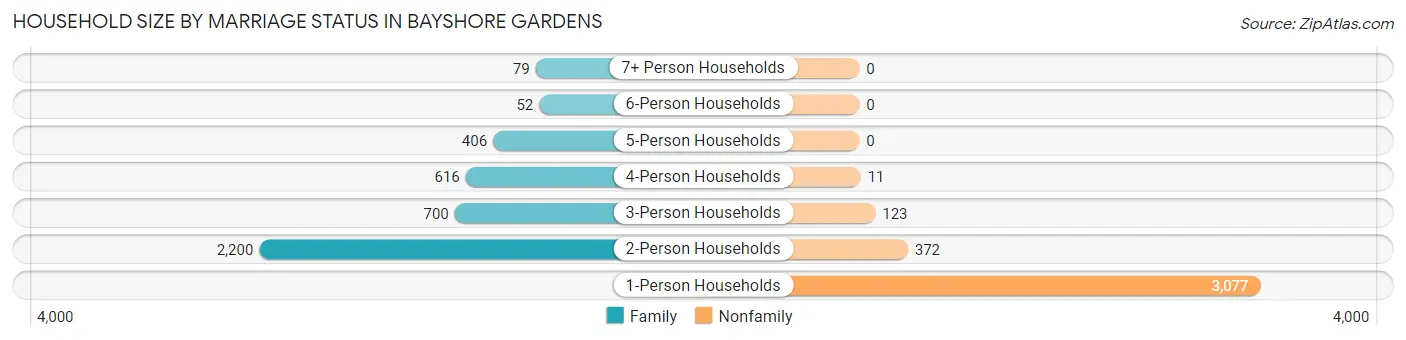
| Household Size | Family Households | Nonfamily Households |
| 1-Person Households | - | 3,077 (40.3%) |
| 2-Person Households | 2,200 (28.8%) | 372 (4.9%) |
| 3-Person Households | 700 (9.2%) | 123 (1.6%) |
| 4-Person Households | 616 (8.1%) | 11 (0.1%) |
| 5-Person Households | 406 (5.3%) | 0 (0.0%) |
| 6-Person Households | 52 (0.7%) | 0 (0.0%) |
| 7+ Person Households | 79 (1.0%) | 0 (0.0%) |
| Total | 4,053 (53.1%) | 3,583 (46.9%) |
Female Fertility in Bayshore Gardens
Fertility by Age in Bayshore Gardens
Average fertility rate in Bayshore Gardens is 70.0 births per 1,000 women. Women in the age bracket of 20 to 34 years have the highest fertility rate with 131.0 births per 1,000 women. Women in the age bracket of 20 to 34 years acount for 84.6% of all women with births.
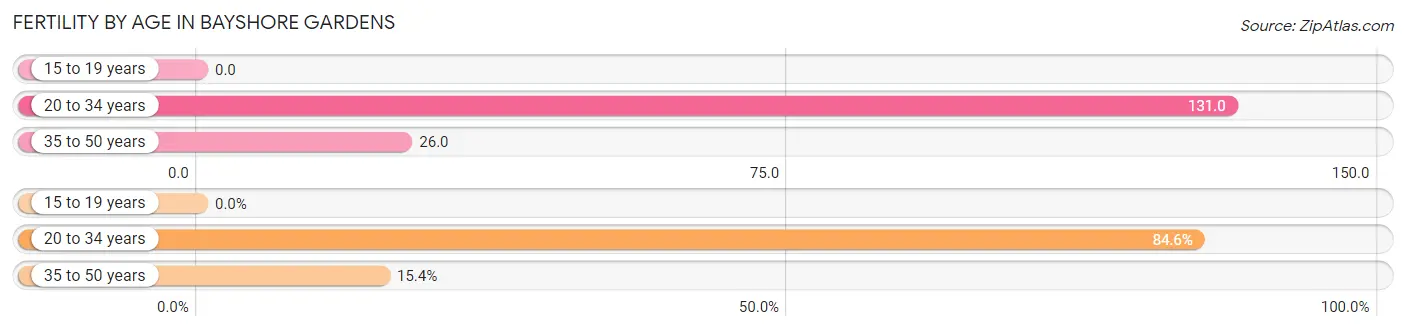
| Age Bracket | Women with Births | Births / 1,000 Women |
| 15 to 19 years | 0 (0.0%) | 0.0 |
| 20 to 34 years | 219 (84.6%) | 131.0 |
| 35 to 50 years | 40 (15.4%) | 26.0 |
| Total | 259 (100.0%) | 70.0 |
Fertility by Age by Marriage Status in Bayshore Gardens
25.5% of women with births (259) in Bayshore Gardens are married. The highest percentage of unmarried women with births falls into 35 to 50 years age bracket with 77.5% of them unmarried at the time of birth, while the lowest percentage of unmarried women with births belong to 20 to 34 years age bracket with 74.0% of them unmarried.
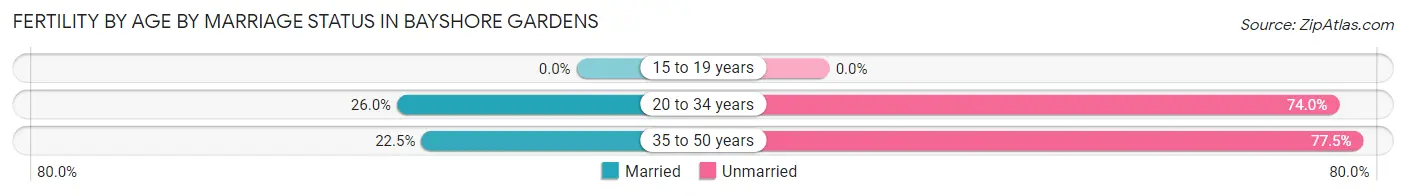
| Age Bracket | Married | Unmarried |
| 15 to 19 years | 0 (0.0%) | 0 (0.0%) |
| 20 to 34 years | 57 (26.0%) | 162 (74.0%) |
| 35 to 50 years | 9 (22.5%) | 31 (77.5%) |
| Total | 66 (25.5%) | 193 (74.5%) |
Fertility by Education in Bayshore Gardens
Average fertility rate in Bayshore Gardens is 70.0 births per 1,000 women. Women with the education attainment of graduate degree have the highest fertility rate of 278.0 births per 1,000 women, while women with the education attainment of less than high school have the lowest fertility at 24.0 births per 1,000 women. Women with the education attainment of high school diploma represent 56.0% of all women with births.
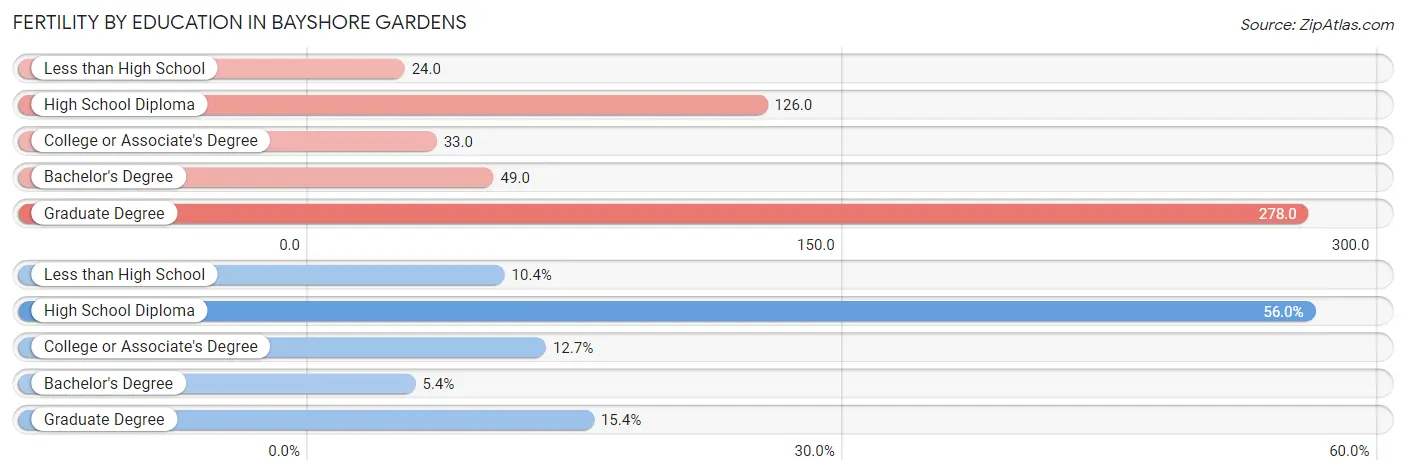
| Educational Attainment | Women with Births | Births / 1,000 Women |
| Less than High School | 27 (10.4%) | 24.0 |
| High School Diploma | 145 (56.0%) | 126.0 |
| College or Associate's Degree | 33 (12.7%) | 33.0 |
| Bachelor's Degree | 14 (5.4%) | 49.0 |
| Graduate Degree | 40 (15.4%) | 278.0 |
| Total | 259 (100.0%) | 70.0 |
Fertility by Education by Marriage Status in Bayshore Gardens
74.5% of women with births in Bayshore Gardens are unmarried. Women with the educational attainment of college or associate's degree are most likely to be married with 100.0% of them married at childbirth, while women with the educational attainment of high school diploma are least likely to be married with 100.0% of them unmarried at childbirth.
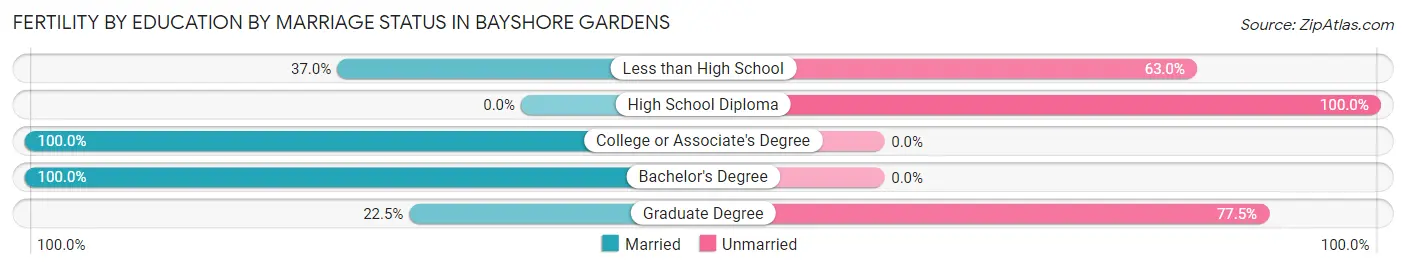
| Educational Attainment | Married | Unmarried |
| Less than High School | 10 (37.0%) | 17 (63.0%) |
| High School Diploma | 0 (0.0%) | 145 (100.0%) |
| College or Associate's Degree | 33 (100.0%) | 0 (0.0%) |
| Bachelor's Degree | 14 (100.0%) | 0 (0.0%) |
| Graduate Degree | 9 (22.5%) | 31 (77.5%) |
| Total | 66 (25.5%) | 193 (74.5%) |
Employment Characteristics in Bayshore Gardens
Employment by Class of Employer in Bayshore Gardens
Among the 7,557 employed individuals in Bayshore Gardens, private company employees (5,647 | 74.7%), not-for-profit organizations (549 | 7.3%), and self-employed (incorporated) (430 | 5.7%) make up the most common classes of employment.
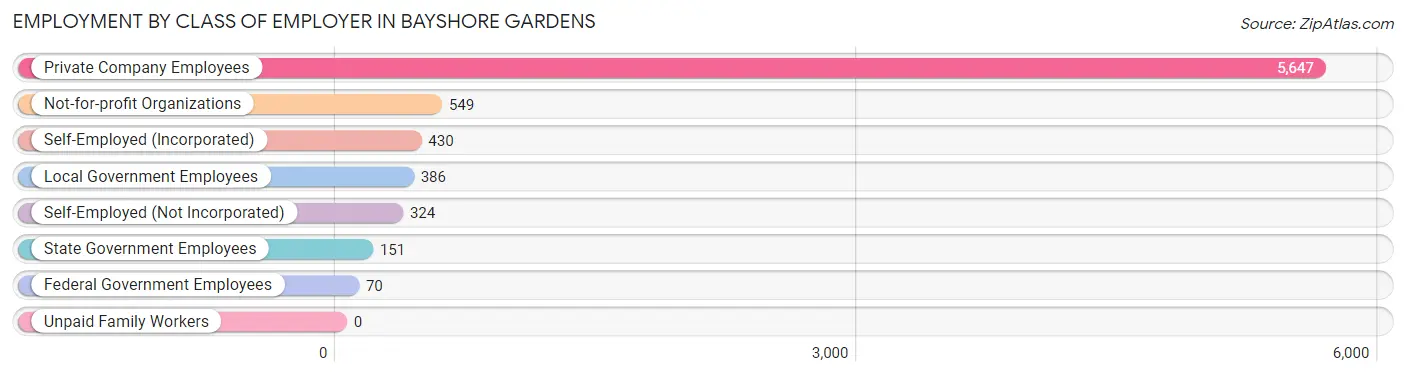
| Employer Class | # Employees | % Employees |
| Private Company Employees | 5,647 | 74.7% |
| Self-Employed (Incorporated) | 430 | 5.7% |
| Self-Employed (Not Incorporated) | 324 | 4.3% |
| Not-for-profit Organizations | 549 | 7.3% |
| Local Government Employees | 386 | 5.1% |
| State Government Employees | 151 | 2.0% |
| Federal Government Employees | 70 | 0.9% |
| Unpaid Family Workers | 0 | 0.0% |
| Total | 7,557 | 100.0% |
Employment Status by Age in Bayshore Gardens
According to the labor force statistics for Bayshore Gardens, out of the total population over 16 years of age (15,844), 54.5% or 8,635 individuals are in the labor force, with 11.7% or 1,010 of them unemployed. The age group with the highest labor force participation rate is 35 to 44 years, with 87.7% or 1,607 individuals in the labor force. Within the labor force, the 16 to 19 years age range has the highest percentage of unemployed individuals, with 52.6% or 498 of them being unemployed.
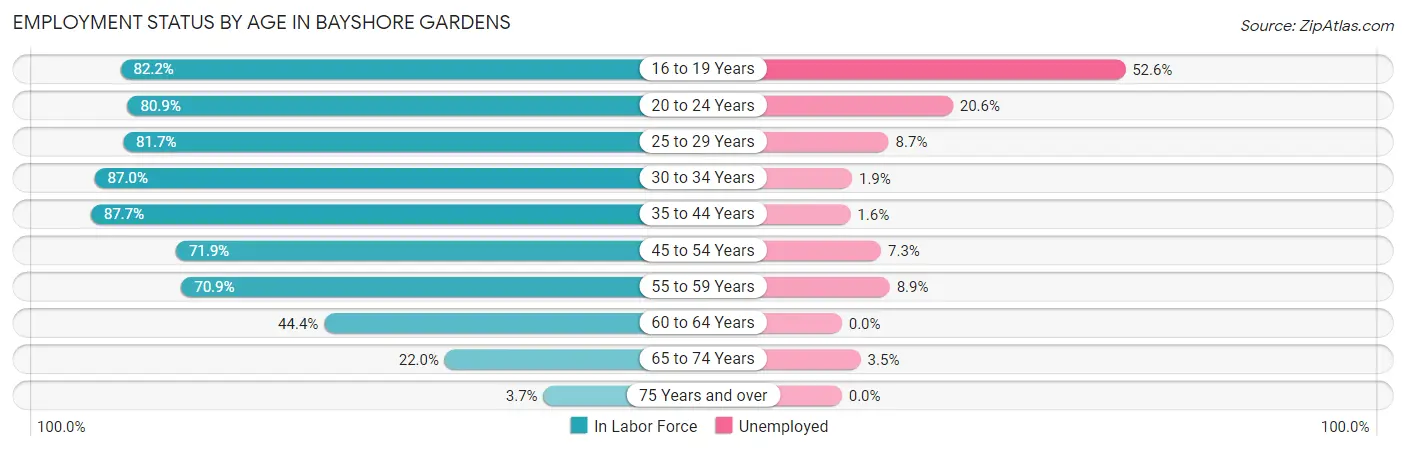
| Age Bracket | In Labor Force | Unemployed |
| 16 to 19 Years | 947 (82.2%) | 498 (52.6%) |
| 20 to 24 Years | 949 (80.9%) | 195 (20.6%) |
| 25 to 29 Years | 761 (81.7%) | 66 (8.7%) |
| 30 to 34 Years | 693 (87.0%) | 13 (1.9%) |
| 35 to 44 Years | 1,607 (87.7%) | 26 (1.6%) |
| 45 to 54 Years | 1,561 (71.9%) | 114 (7.3%) |
| 55 to 59 Years | 874 (70.9%) | 78 (8.9%) |
| 60 to 64 Years | 523 (44.4%) | 0 (0.0%) |
| 65 to 74 Years | 623 (22.0%) | 22 (3.5%) |
| 75 Years and over | 94 (3.7%) | 0 (0.0%) |
| Total | 8,635 (54.5%) | 1,010 (11.7%) |
Employment Status by Educational Attainment in Bayshore Gardens
According to labor force statistics for Bayshore Gardens, 73.9% of individuals (6,017) out of the total population between 25 and 64 years of age (8,142) are in the labor force, with 4.9% or 295 of them being unemployed. The group with the highest labor force participation rate are those with the educational attainment of bachelor's degree or higher, with 85.8% or 1,259 individuals in the labor force. Within the labor force, individuals with less than high school education have the highest percentage of unemployment, with 11.8% or 111 of them being unemployed.
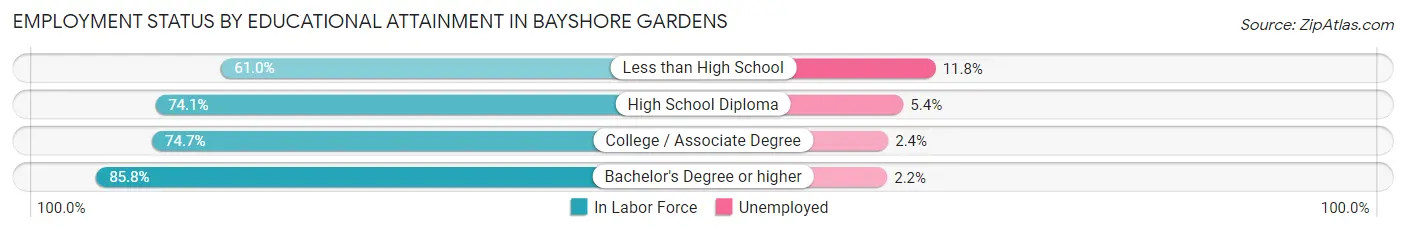
| Educational Attainment | In Labor Force | Unemployed |
| Less than High School | 939 (61.0%) | 182 (11.8%) |
| High School Diploma | 2,220 (74.1%) | 162 (5.4%) |
| College / Associate Degree | 1,598 (74.7%) | 51 (2.4%) |
| Bachelor's Degree or higher | 1,259 (85.8%) | 32 (2.2%) |
| Total | 6,017 (73.9%) | 399 (4.9%) |
Employment Occupations by Sex in Bayshore Gardens
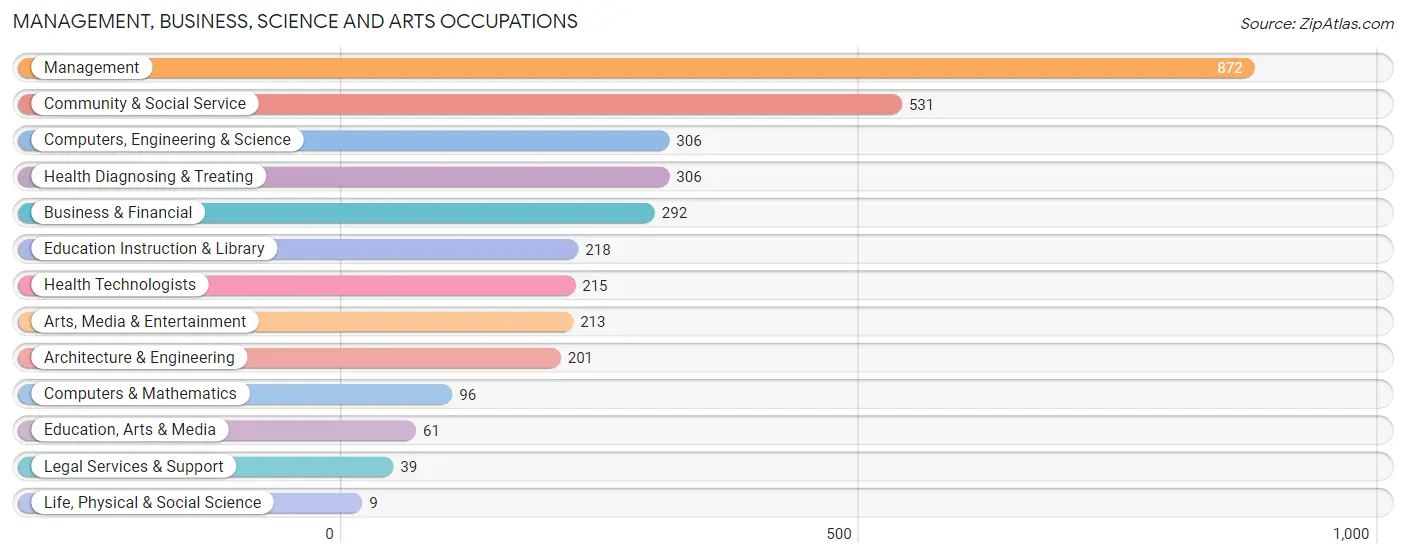
Management, Business, Science and Arts Occupations
The most common Management, Business, Science and Arts occupations in Bayshore Gardens are Management (872 | 11.5%), Community & Social Service (531 | 7.0%), Computers, Engineering & Science (306 | 4.0%), Health Diagnosing & Treating (306 | 4.0%), and Business & Financial (292 | 3.8%).
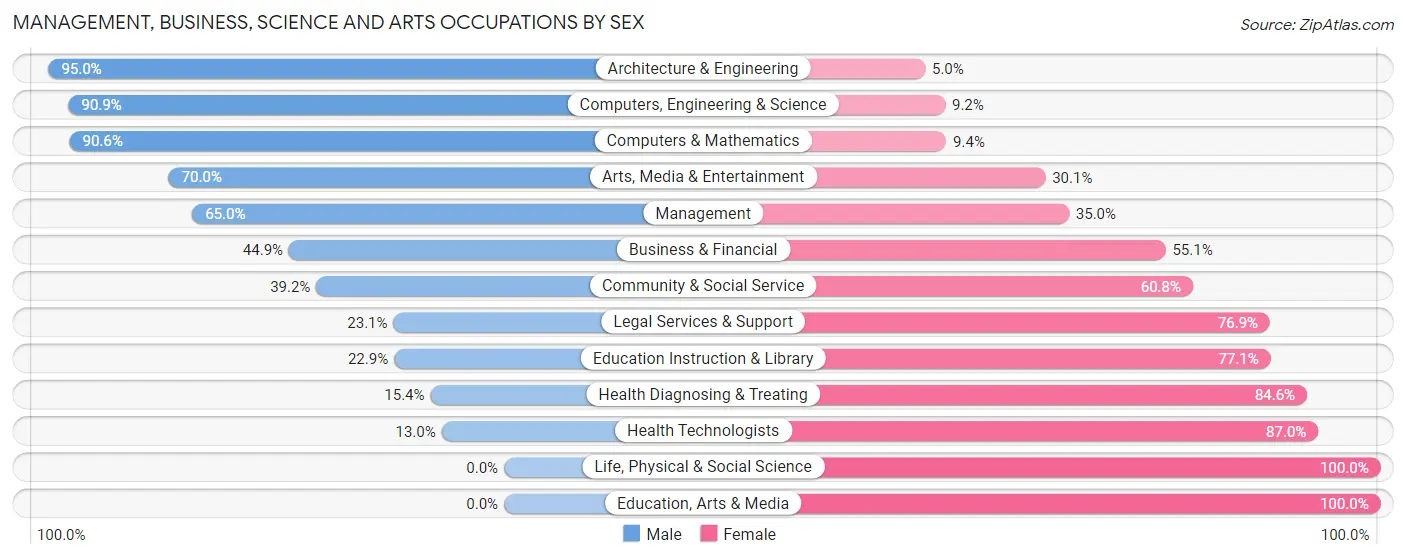
Management, Business, Science and Arts Occupations by Sex
Within the Management, Business, Science and Arts occupations in Bayshore Gardens, the most male-oriented occupations are Architecture & Engineering (95.0%), Computers, Engineering & Science (90.8%), and Computers & Mathematics (90.6%), while the most female-oriented occupations are Life, Physical & Social Science (100.0%), Education, Arts & Media (100.0%), and Health Technologists (87.0%).
| Occupation | Male | Female |
| Management | 567 (65.0%) | 305 (35.0%) |
| Business & Financial | 131 (44.9%) | 161 (55.1%) |
| Computers, Engineering & Science | 278 (90.8%) | 28 (9.1%) |
| Computers & Mathematics | 87 (90.6%) | 9 (9.4%) |
| Architecture & Engineering | 191 (95.0%) | 10 (5.0%) |
| Life, Physical & Social Science | 0 (0.0%) | 9 (100.0%) |
| Community & Social Service | 208 (39.2%) | 323 (60.8%) |
| Education, Arts & Media | 0 (0.0%) | 61 (100.0%) |
| Legal Services & Support | 9 (23.1%) | 30 (76.9%) |
| Education Instruction & Library | 50 (22.9%) | 168 (77.1%) |
| Arts, Media & Entertainment | 149 (70.0%) | 64 (30.0%) |
| Health Diagnosing & Treating | 47 (15.4%) | 259 (84.6%) |
| Health Technologists | 28 (13.0%) | 187 (87.0%) |
| Total (Category) | 1,231 (53.4%) | 1,076 (46.6%) |
| Total (Overall) | 4,252 (56.1%) | 3,327 (43.9%) |
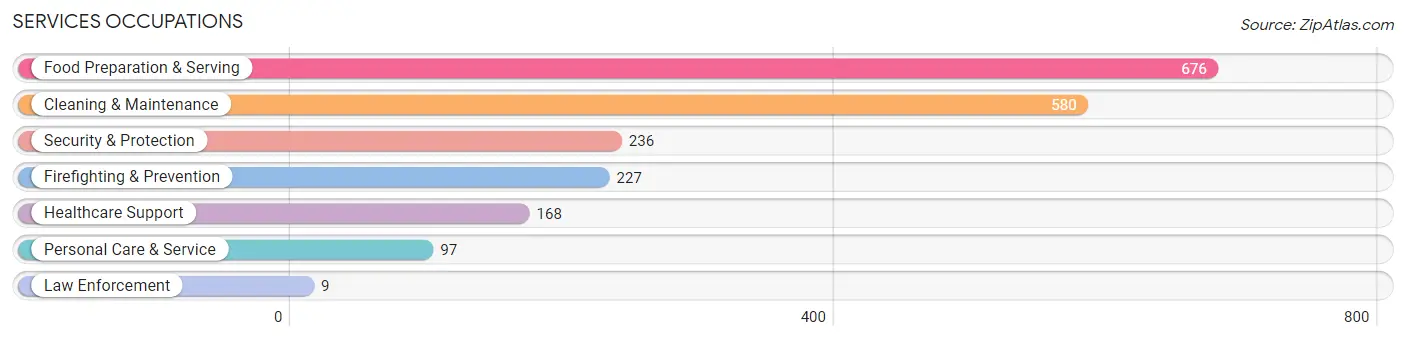
Services Occupations
The most common Services occupations in Bayshore Gardens are Food Preparation & Serving (676 | 8.9%), Cleaning & Maintenance (580 | 7.6%), Security & Protection (236 | 3.1%), Firefighting & Prevention (227 | 3.0%), and Healthcare Support (168 | 2.2%).
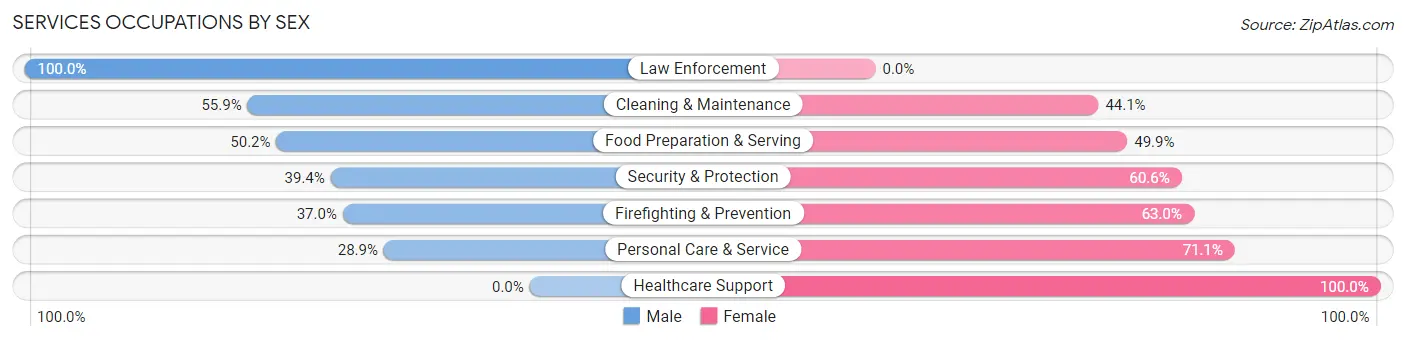
Services Occupations by Sex
Within the Services occupations in Bayshore Gardens, the most male-oriented occupations are Law Enforcement (100.0%), Cleaning & Maintenance (55.9%), and Food Preparation & Serving (50.1%), while the most female-oriented occupations are Healthcare Support (100.0%), Personal Care & Service (71.1%), and Firefighting & Prevention (63.0%).
| Occupation | Male | Female |
| Healthcare Support | 0 (0.0%) | 168 (100.0%) |
| Security & Protection | 93 (39.4%) | 143 (60.6%) |
| Firefighting & Prevention | 84 (37.0%) | 143 (63.0%) |
| Law Enforcement | 9 (100.0%) | 0 (0.0%) |
| Food Preparation & Serving | 339 (50.1%) | 337 (49.8%) |
| Cleaning & Maintenance | 324 (55.9%) | 256 (44.1%) |
| Personal Care & Service | 28 (28.9%) | 69 (71.1%) |
| Total (Category) | 784 (44.6%) | 973 (55.4%) |
| Total (Overall) | 4,252 (56.1%) | 3,327 (43.9%) |
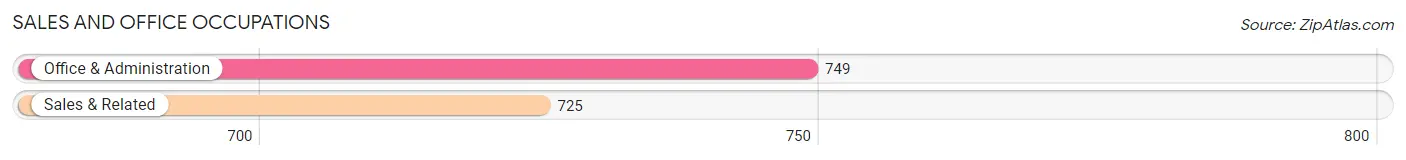
Sales and Office Occupations
The most common Sales and Office occupations in Bayshore Gardens are Office & Administration (749 | 9.9%), and Sales & Related (725 | 9.6%).
Sales and Office Occupations by Sex
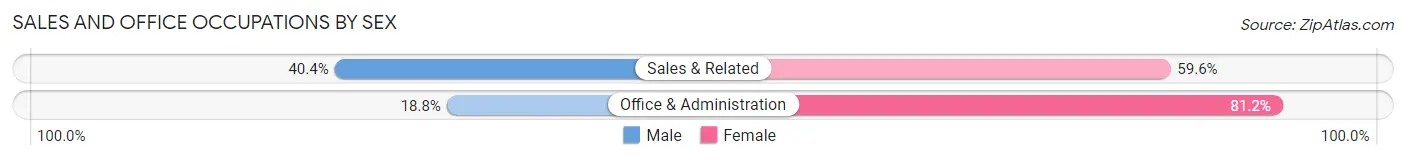
| Occupation | Male | Female |
| Sales & Related | 293 (40.4%) | 432 (59.6%) |
| Office & Administration | 141 (18.8%) | 608 (81.2%) |
| Total (Category) | 434 (29.4%) | 1,040 (70.6%) |
| Total (Overall) | 4,252 (56.1%) | 3,327 (43.9%) |
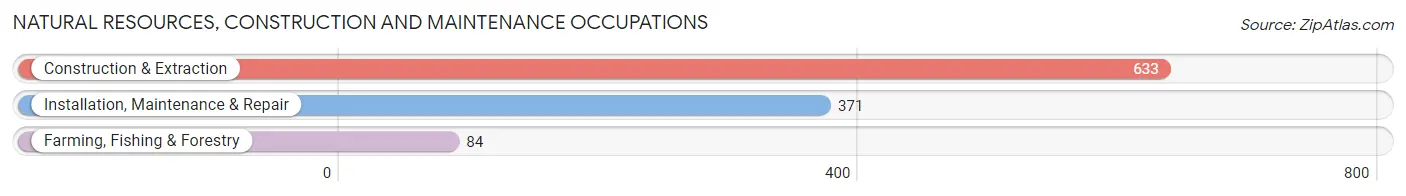
Natural Resources, Construction and Maintenance Occupations
The most common Natural Resources, Construction and Maintenance occupations in Bayshore Gardens are Construction & Extraction (633 | 8.4%), Installation, Maintenance & Repair (371 | 4.9%), and Farming, Fishing & Forestry (84 | 1.1%).
Natural Resources, Construction and Maintenance Occupations by Sex
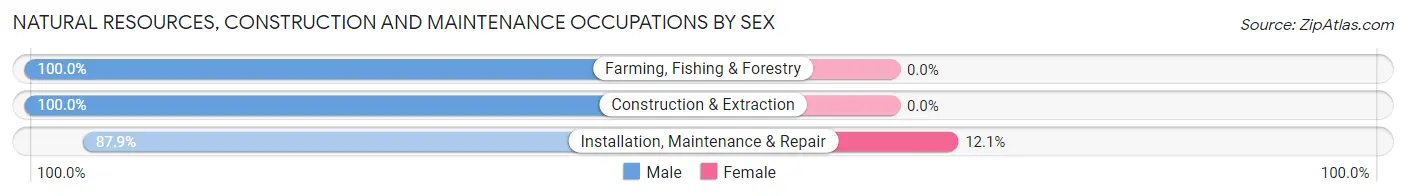
| Occupation | Male | Female |
| Farming, Fishing & Forestry | 84 (100.0%) | 0 (0.0%) |
| Construction & Extraction | 633 (100.0%) | 0 (0.0%) |
| Installation, Maintenance & Repair | 326 (87.9%) | 45 (12.1%) |
| Total (Category) | 1,043 (95.9%) | 45 (4.1%) |
| Total (Overall) | 4,252 (56.1%) | 3,327 (43.9%) |
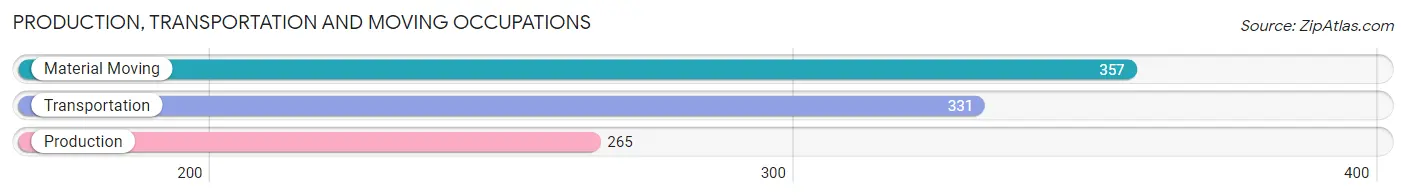
Production, Transportation and Moving Occupations
The most common Production, Transportation and Moving occupations in Bayshore Gardens are Material Moving (357 | 4.7%), Transportation (331 | 4.4%), and Production (265 | 3.5%).
Production, Transportation and Moving Occupations by Sex
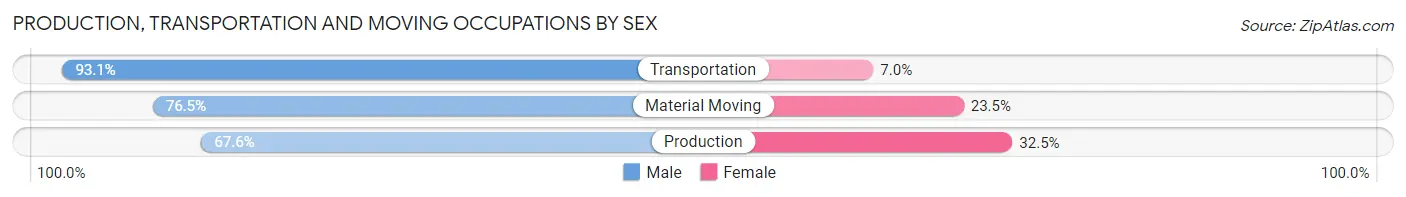
| Occupation | Male | Female |
| Production | 179 (67.5%) | 86 (32.5%) |
| Transportation | 308 (93.0%) | 23 (7.0%) |
| Material Moving | 273 (76.5%) | 84 (23.5%) |
| Total (Category) | 760 (79.7%) | 193 (20.3%) |
| Total (Overall) | 4,252 (56.1%) | 3,327 (43.9%) |
Employment Industries by Sex in Bayshore Gardens
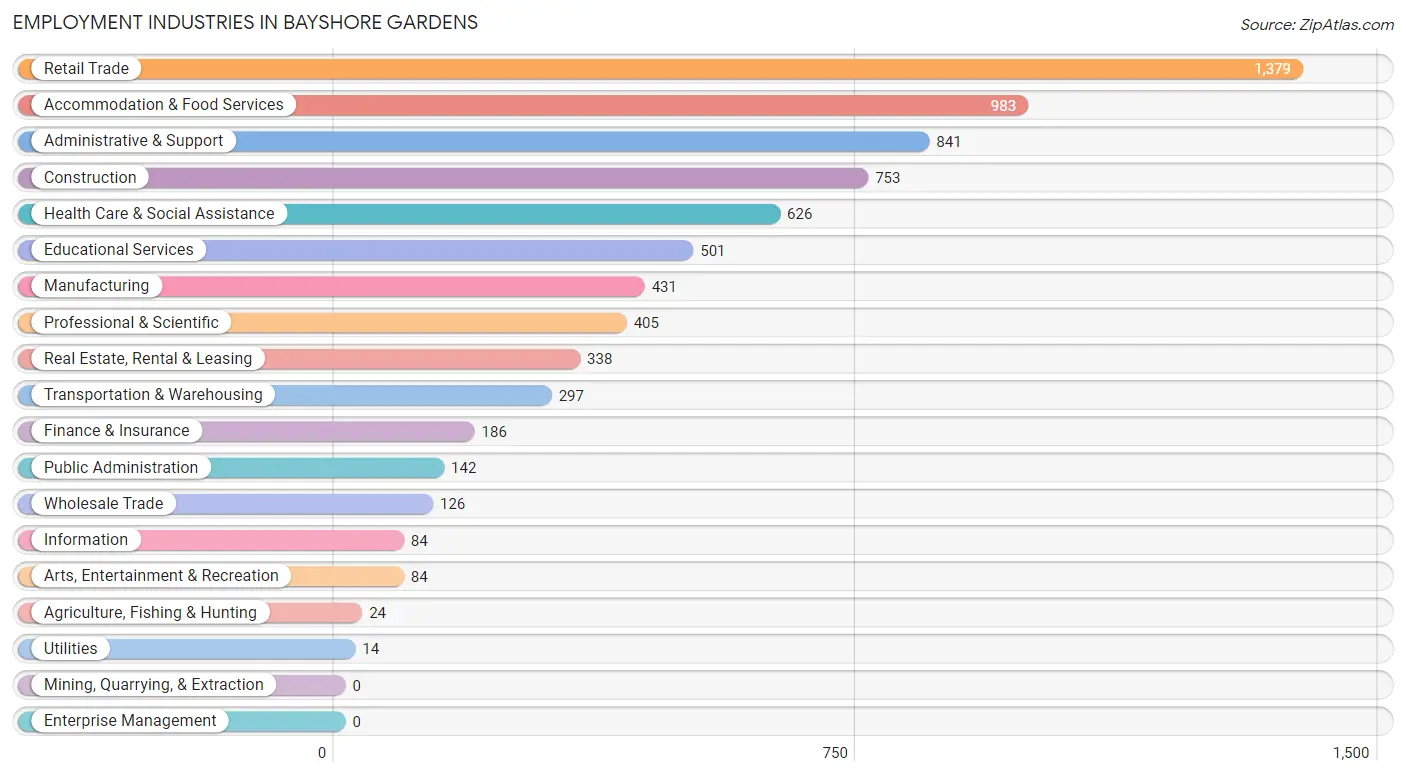
Employment Industries in Bayshore Gardens
The major employment industries in Bayshore Gardens include Retail Trade (1,379 | 18.2%), Accommodation & Food Services (983 | 13.0%), Administrative & Support (841 | 11.1%), Construction (753 | 9.9%), and Health Care & Social Assistance (626 | 8.3%).
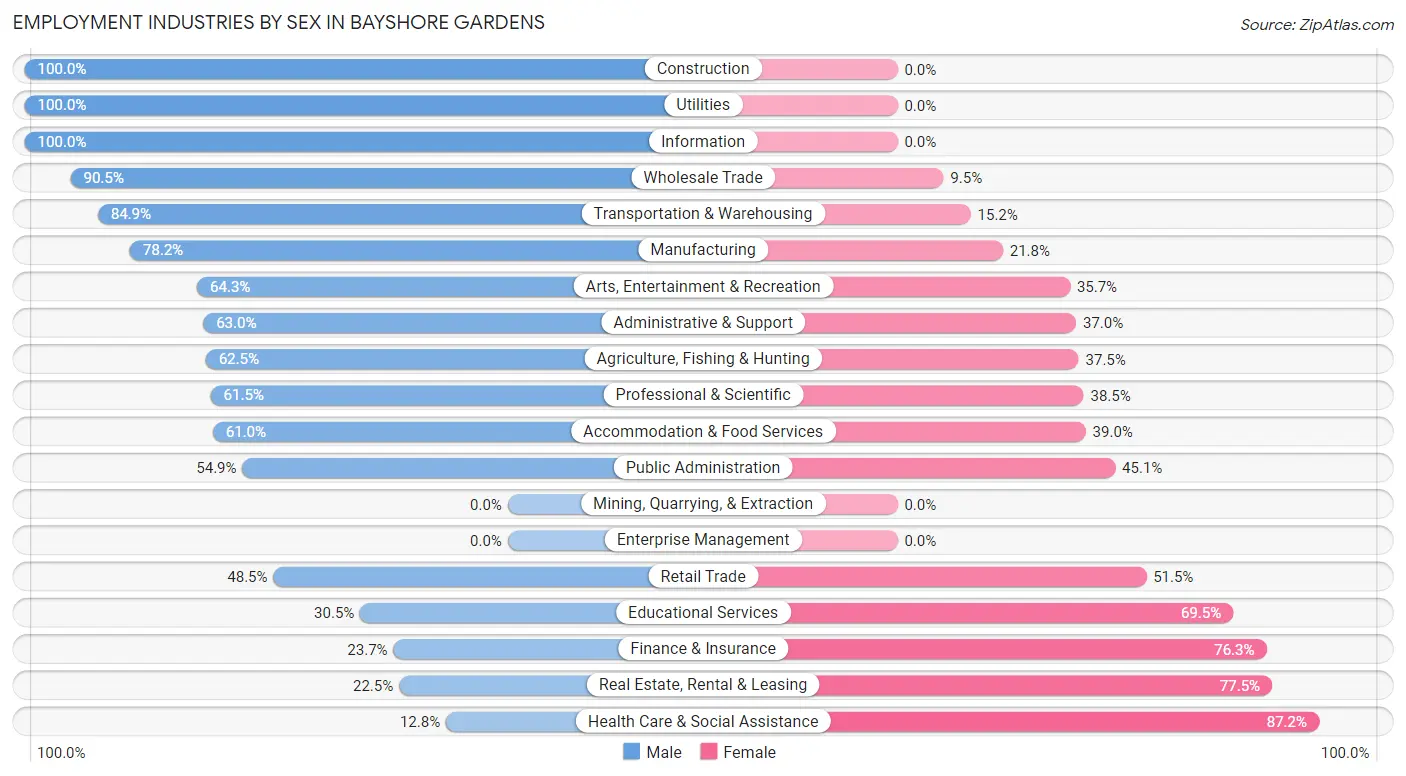
Employment Industries by Sex in Bayshore Gardens
The Bayshore Gardens industries that see more men than women are Construction (100.0%), Utilities (100.0%), and Information (100.0%), whereas the industries that tend to have a higher number of women are Health Care & Social Assistance (87.2%), Real Estate, Rental & Leasing (77.5%), and Finance & Insurance (76.3%).
| Industry | Male | Female |
| Agriculture, Fishing & Hunting | 15 (62.5%) | 9 (37.5%) |
| Mining, Quarrying, & Extraction | 0 (0.0%) | 0 (0.0%) |
| Construction | 753 (100.0%) | 0 (0.0%) |
| Manufacturing | 337 (78.2%) | 94 (21.8%) |
| Wholesale Trade | 114 (90.5%) | 12 (9.5%) |
| Retail Trade | 669 (48.5%) | 710 (51.5%) |
| Transportation & Warehousing | 252 (84.9%) | 45 (15.1%) |
| Utilities | 14 (100.0%) | 0 (0.0%) |
| Information | 84 (100.0%) | 0 (0.0%) |
| Finance & Insurance | 44 (23.7%) | 142 (76.3%) |
| Real Estate, Rental & Leasing | 76 (22.5%) | 262 (77.5%) |
| Professional & Scientific | 249 (61.5%) | 156 (38.5%) |
| Enterprise Management | 0 (0.0%) | 0 (0.0%) |
| Administrative & Support | 530 (63.0%) | 311 (37.0%) |
| Educational Services | 153 (30.5%) | 348 (69.5%) |
| Health Care & Social Assistance | 80 (12.8%) | 546 (87.2%) |
| Arts, Entertainment & Recreation | 54 (64.3%) | 30 (35.7%) |
| Accommodation & Food Services | 600 (61.0%) | 383 (39.0%) |
| Public Administration | 78 (54.9%) | 64 (45.1%) |
| Total | 4,252 (56.1%) | 3,327 (43.9%) |
Education in Bayshore Gardens
School Enrollment in Bayshore Gardens
The most common levels of schooling among the 3,449 students in Bayshore Gardens are high school (1,126 | 32.7%), middle school (970 | 28.1%), and elementary school (737 | 21.4%).
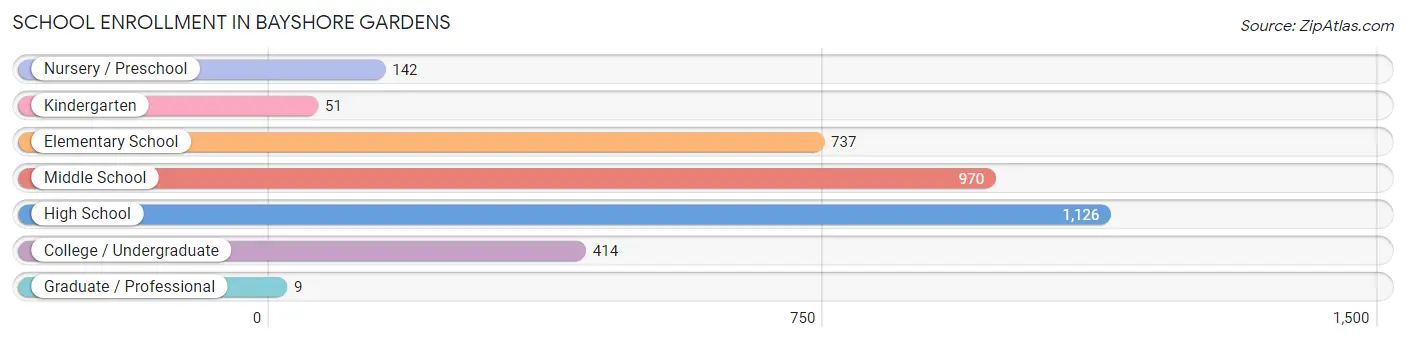
| School Level | # Students | % Students |
| Nursery / Preschool | 142 | 4.1% |
| Kindergarten | 51 | 1.5% |
| Elementary School | 737 | 21.4% |
| Middle School | 970 | 28.1% |
| High School | 1,126 | 32.7% |
| College / Undergraduate | 414 | 12.0% |
| Graduate / Professional | 9 | 0.3% |
| Total | 3,449 | 100.0% |
School Enrollment by Age by Funding Source in Bayshore Gardens
Out of a total of 3,449 students who are enrolled in schools in Bayshore Gardens, 438 (12.7%) attend a private institution, while the remaining 3,011 (87.3%) are enrolled in public schools. The age group of 3 to 4 year olds has the highest likelihood of being enrolled in private schools, with 35 (31.2% in the age bracket) enrolled. Conversely, the age group of 15 to 17 year olds has the lowest likelihood of being enrolled in a private school, with 778 (100.0% in the age bracket) attending a public institution.
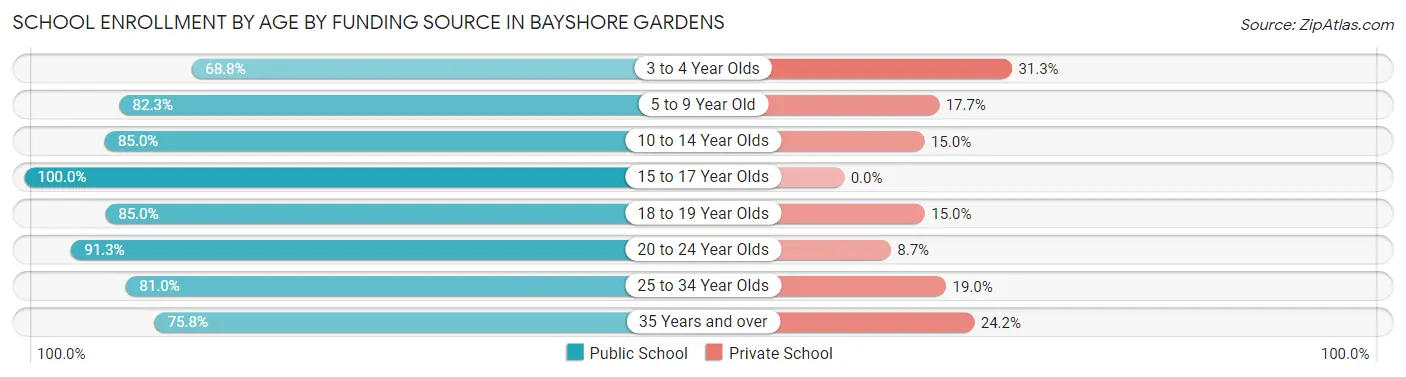
| Age Bracket | Public School | Private School |
| 3 to 4 Year Olds | 77 (68.8%) | 35 (31.2%) |
| 5 to 9 Year Old | 572 (82.3%) | 123 (17.7%) |
| 10 to 14 Year Olds | 966 (85.0%) | 170 (15.0%) |
| 15 to 17 Year Olds | 778 (100.0%) | 0 (0.0%) |
| 18 to 19 Year Olds | 260 (85.0%) | 46 (15.0%) |
| 20 to 24 Year Olds | 189 (91.3%) | 18 (8.7%) |
| 25 to 34 Year Olds | 94 (81.0%) | 22 (19.0%) |
| 35 Years and over | 75 (75.8%) | 24 (24.2%) |
| Total | 3,011 (87.3%) | 438 (12.7%) |
Educational Attainment by Field of Study in Bayshore Gardens
Business (617 | 22.6%), education (400 | 14.7%), arts & humanities (260 | 9.5%), visual & performing arts (246 | 9.0%), and science & technology (218 | 8.0%) are the most common fields of study among 2,725 individuals in Bayshore Gardens who have obtained a bachelor's degree or higher.
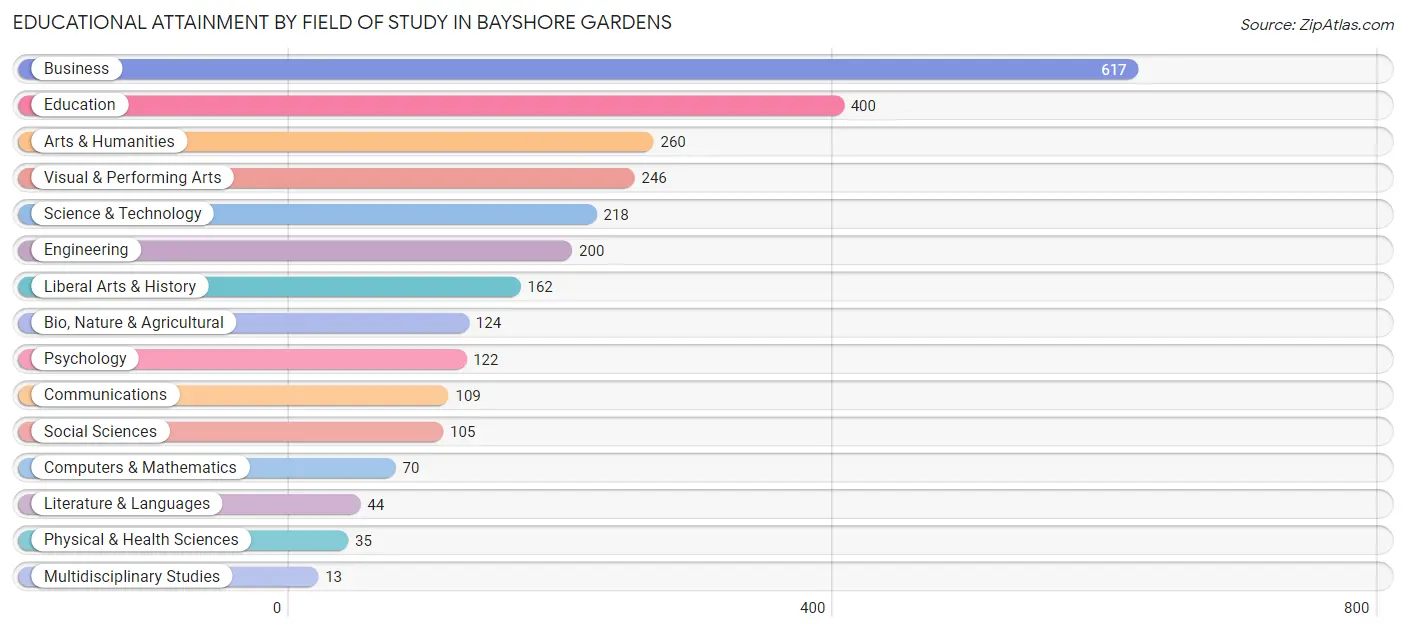
| Field of Study | # Graduates | % Graduates |
| Computers & Mathematics | 70 | 2.6% |
| Bio, Nature & Agricultural | 124 | 4.5% |
| Physical & Health Sciences | 35 | 1.3% |
| Psychology | 122 | 4.5% |
| Social Sciences | 105 | 3.8% |
| Engineering | 200 | 7.3% |
| Multidisciplinary Studies | 13 | 0.5% |
| Science & Technology | 218 | 8.0% |
| Business | 617 | 22.6% |
| Education | 400 | 14.7% |
| Literature & Languages | 44 | 1.6% |
| Liberal Arts & History | 162 | 5.9% |
| Visual & Performing Arts | 246 | 9.0% |
| Communications | 109 | 4.0% |
| Arts & Humanities | 260 | 9.5% |
| Total | 2,725 | 100.0% |
Transportation & Commute in Bayshore Gardens
Vehicle Availability by Sex in Bayshore Gardens
The most prevalent vehicle ownership categories in Bayshore Gardens are males with 2 vehicles (1,945, accounting for 45.8%) and females with 2 vehicles (1,284, making up 58.8%).
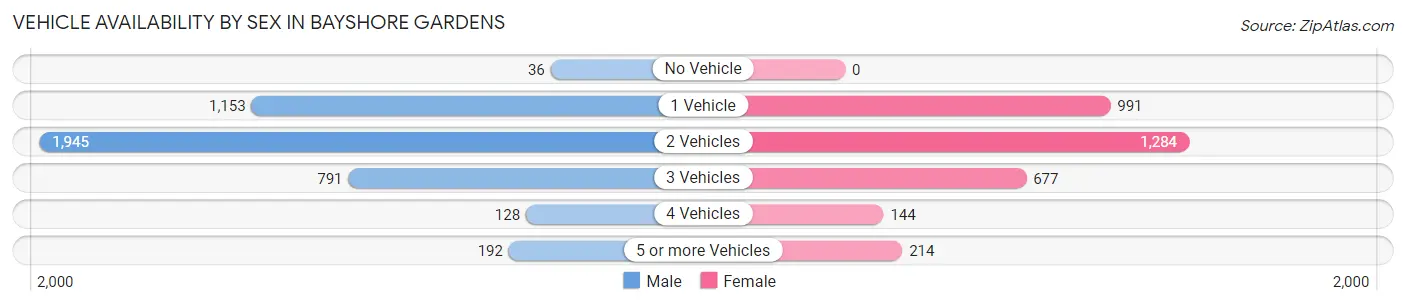
| Vehicles Available | Male | Female |
| No Vehicle | 36 (0.9%) | 0 (0.0%) |
| 1 Vehicle | 1,153 (27.2%) | 991 (29.9%) |
| 2 Vehicles | 1,945 (45.8%) | 1,284 (38.8%) |
| 3 Vehicles | 791 (18.6%) | 677 (20.4%) |
| 4 Vehicles | 128 (3.0%) | 144 (4.3%) |
| 5 or more Vehicles | 192 (4.5%) | 214 (6.5%) |
| Total | 4,245 (100.0%) | 3,310 (100.0%) |
Commute Time in Bayshore Gardens
The most frequently occuring commute durations in Bayshore Gardens are 15 to 19 minutes (1,708 commuters, 23.4%), 20 to 24 minutes (1,049 commuters, 14.4%), and 10 to 14 minutes (924 commuters, 12.7%).
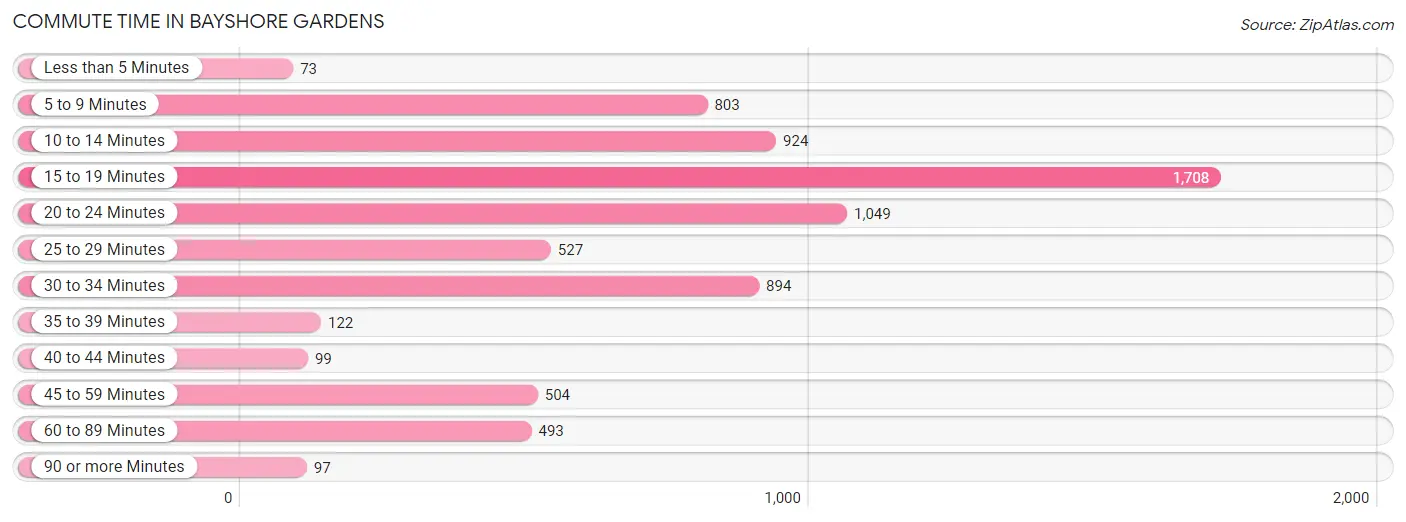
| Commute Time | # Commuters | % Commuters |
| Less than 5 Minutes | 73 | 1.0% |
| 5 to 9 Minutes | 803 | 11.0% |
| 10 to 14 Minutes | 924 | 12.7% |
| 15 to 19 Minutes | 1,708 | 23.4% |
| 20 to 24 Minutes | 1,049 | 14.4% |
| 25 to 29 Minutes | 527 | 7.2% |
| 30 to 34 Minutes | 894 | 12.3% |
| 35 to 39 Minutes | 122 | 1.7% |
| 40 to 44 Minutes | 99 | 1.4% |
| 45 to 59 Minutes | 504 | 6.9% |
| 60 to 89 Minutes | 493 | 6.8% |
| 90 or more Minutes | 97 | 1.3% |
Commute Time by Sex in Bayshore Gardens
The most common commute times in Bayshore Gardens are 15 to 19 minutes (942 commuters, 23.0%) for males and 15 to 19 minutes (766 commuters, 23.9%) for females.
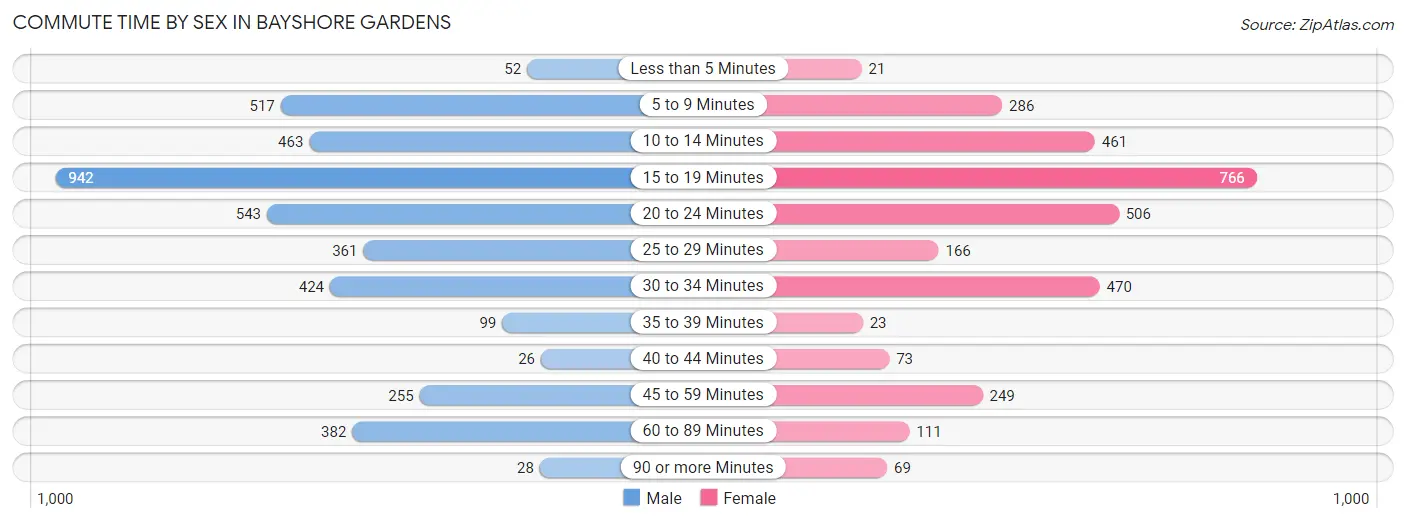
| Commute Time | Male | Female |
| Less than 5 Minutes | 52 (1.3%) | 21 (0.7%) |
| 5 to 9 Minutes | 517 (12.6%) | 286 (8.9%) |
| 10 to 14 Minutes | 463 (11.3%) | 461 (14.4%) |
| 15 to 19 Minutes | 942 (23.0%) | 766 (23.9%) |
| 20 to 24 Minutes | 543 (13.3%) | 506 (15.8%) |
| 25 to 29 Minutes | 361 (8.8%) | 166 (5.2%) |
| 30 to 34 Minutes | 424 (10.4%) | 470 (14.7%) |
| 35 to 39 Minutes | 99 (2.4%) | 23 (0.7%) |
| 40 to 44 Minutes | 26 (0.6%) | 73 (2.3%) |
| 45 to 59 Minutes | 255 (6.2%) | 249 (7.8%) |
| 60 to 89 Minutes | 382 (9.3%) | 111 (3.5%) |
| 90 or more Minutes | 28 (0.7%) | 69 (2.2%) |
Time of Departure to Work by Sex in Bayshore Gardens
The most frequent times of departure to work in Bayshore Gardens are 7:00 AM to 7:29 AM (861, 21.0%) for males and 8:00 AM to 8:29 AM (422, 13.2%) for females.
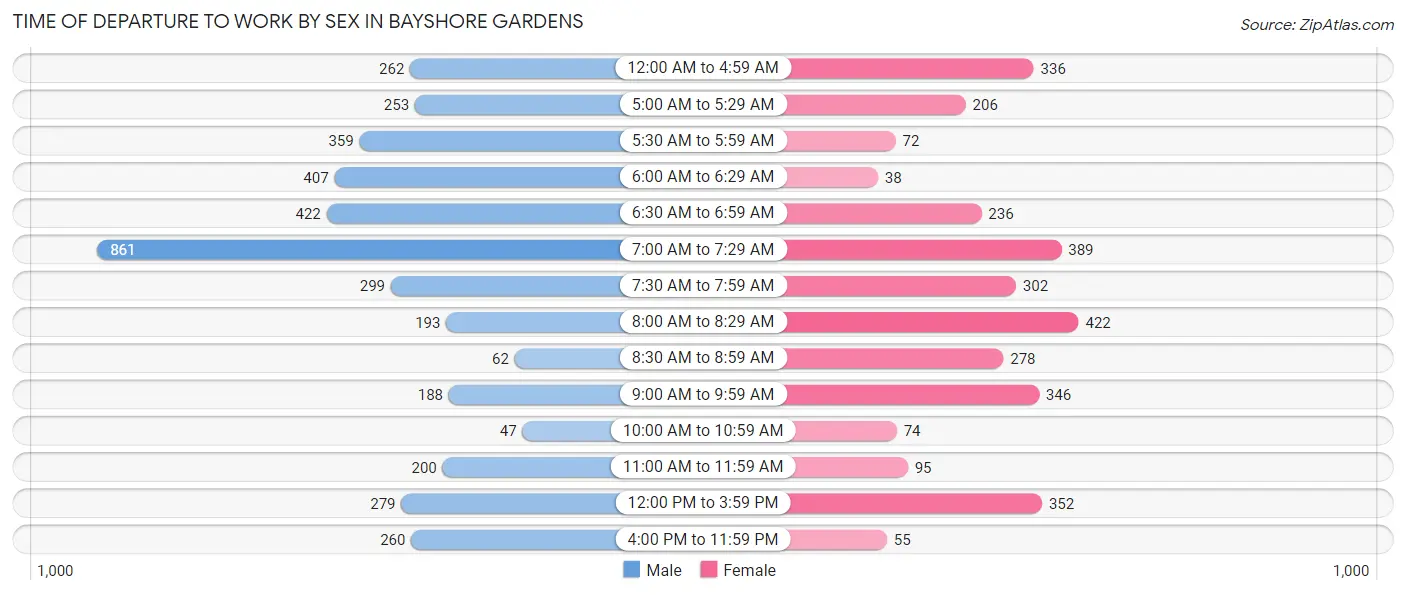
| Time of Departure | Male | Female |
| 12:00 AM to 4:59 AM | 262 (6.4%) | 336 (10.5%) |
| 5:00 AM to 5:29 AM | 253 (6.2%) | 206 (6.4%) |
| 5:30 AM to 5:59 AM | 359 (8.8%) | 72 (2.2%) |
| 6:00 AM to 6:29 AM | 407 (10.0%) | 38 (1.2%) |
| 6:30 AM to 6:59 AM | 422 (10.3%) | 236 (7.4%) |
| 7:00 AM to 7:29 AM | 861 (21.0%) | 389 (12.1%) |
| 7:30 AM to 7:59 AM | 299 (7.3%) | 302 (9.4%) |
| 8:00 AM to 8:29 AM | 193 (4.7%) | 422 (13.2%) |
| 8:30 AM to 8:59 AM | 62 (1.5%) | 278 (8.7%) |
| 9:00 AM to 9:59 AM | 188 (4.6%) | 346 (10.8%) |
| 10:00 AM to 10:59 AM | 47 (1.1%) | 74 (2.3%) |
| 11:00 AM to 11:59 AM | 200 (4.9%) | 95 (3.0%) |
| 12:00 PM to 3:59 PM | 279 (6.8%) | 352 (11.0%) |
| 4:00 PM to 11:59 PM | 260 (6.4%) | 55 (1.7%) |
| Total | 4,092 (100.0%) | 3,201 (100.0%) |
Housing Occupancy in Bayshore Gardens
Occupancy by Ownership in Bayshore Gardens
Of the total 7,636 dwellings in Bayshore Gardens, owner-occupied units account for 5,257 (68.8%), while renter-occupied units make up 2,379 (31.2%).
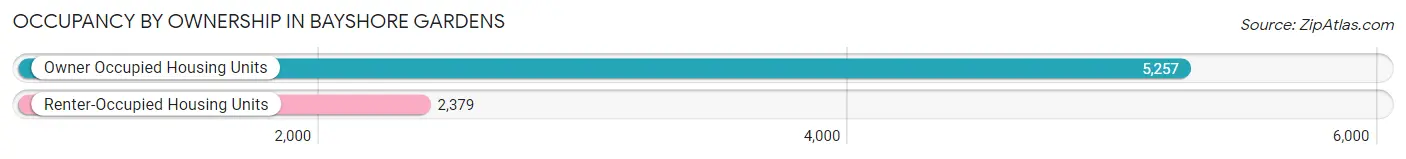
| Occupancy | # Housing Units | % Housing Units |
| Owner Occupied Housing Units | 5,257 | 68.8% |
| Renter-Occupied Housing Units | 2,379 | 31.2% |
| Total Occupied Housing Units | 7,636 | 100.0% |
Occupancy by Household Size in Bayshore Gardens
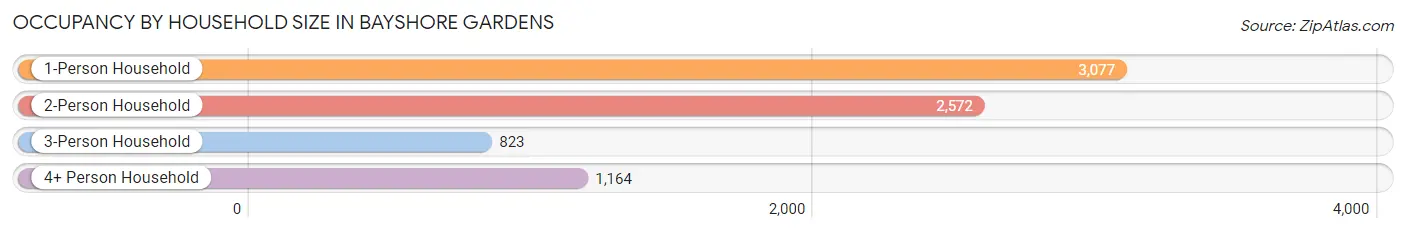
| Household Size | # Housing Units | % Housing Units |
| 1-Person Household | 3,077 | 40.3% |
| 2-Person Household | 2,572 | 33.7% |
| 3-Person Household | 823 | 10.8% |
| 4+ Person Household | 1,164 | 15.2% |
| Total Housing Units | 7,636 | 100.0% |
Occupancy by Ownership by Household Size in Bayshore Gardens
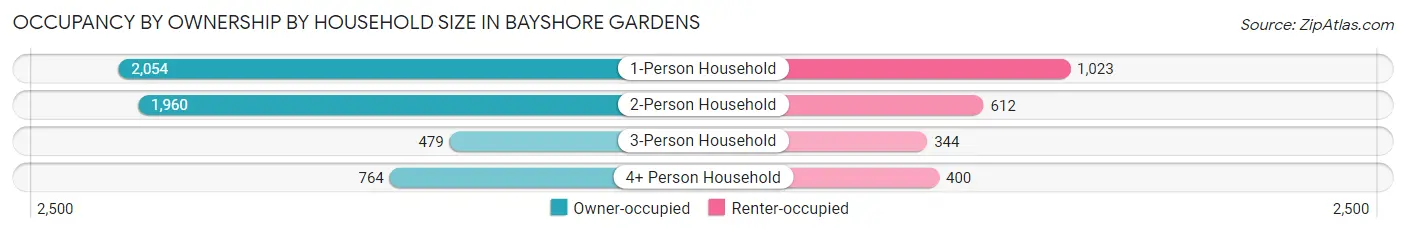
| Household Size | Owner-occupied | Renter-occupied |
| 1-Person Household | 2,054 (66.7%) | 1,023 (33.3%) |
| 2-Person Household | 1,960 (76.2%) | 612 (23.8%) |
| 3-Person Household | 479 (58.2%) | 344 (41.8%) |
| 4+ Person Household | 764 (65.6%) | 400 (34.4%) |
| Total Housing Units | 5,257 (68.8%) | 2,379 (31.2%) |
Occupancy by Educational Attainment in Bayshore Gardens
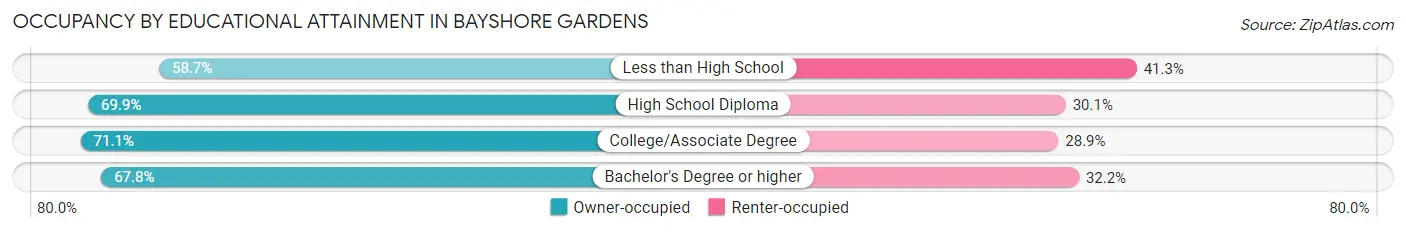
| Household Size | Owner-occupied | Renter-occupied |
| Less than High School | 396 (58.7%) | 279 (41.3%) |
| High School Diploma | 2,216 (69.9%) | 953 (30.1%) |
| College/Associate Degree | 1,584 (71.1%) | 644 (28.9%) |
| Bachelor's Degree or higher | 1,061 (67.8%) | 503 (32.2%) |
Occupancy by Age of Householder in Bayshore Gardens
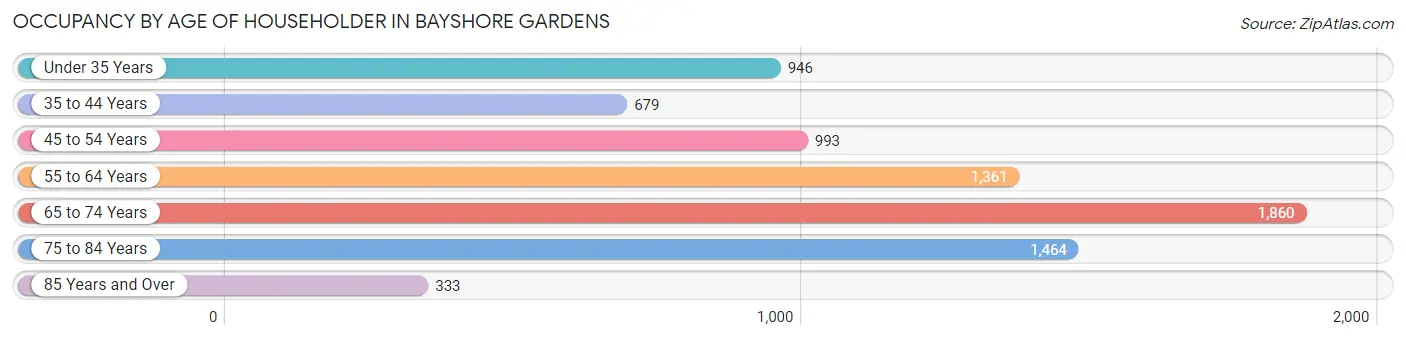
| Age Bracket | # Households | % Households |
| Under 35 Years | 946 | 12.4% |
| 35 to 44 Years | 679 | 8.9% |
| 45 to 54 Years | 993 | 13.0% |
| 55 to 64 Years | 1,361 | 17.8% |
| 65 to 74 Years | 1,860 | 24.4% |
| 75 to 84 Years | 1,464 | 19.2% |
| 85 Years and Over | 333 | 4.4% |
| Total | 7,636 | 100.0% |
Housing Finances in Bayshore Gardens
Median Income by Occupancy in Bayshore Gardens
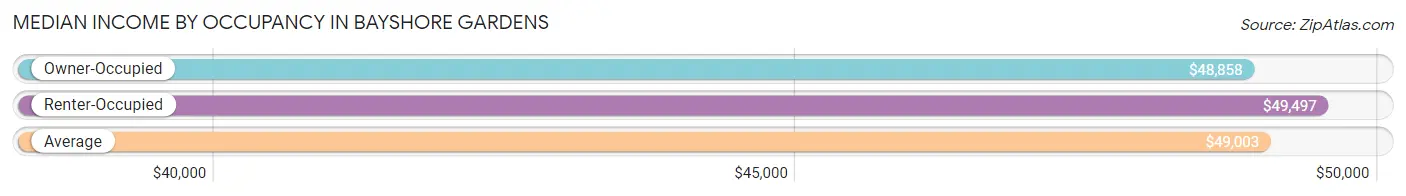
| Occupancy Type | # Households | Median Income |
| Owner-Occupied | 5,257 (68.8%) | $48,858 |
| Renter-Occupied | 2,379 (31.2%) | $49,497 |
| Average | 7,636 (100.0%) | $49,003 |
Occupancy by Householder Income Bracket in Bayshore Gardens
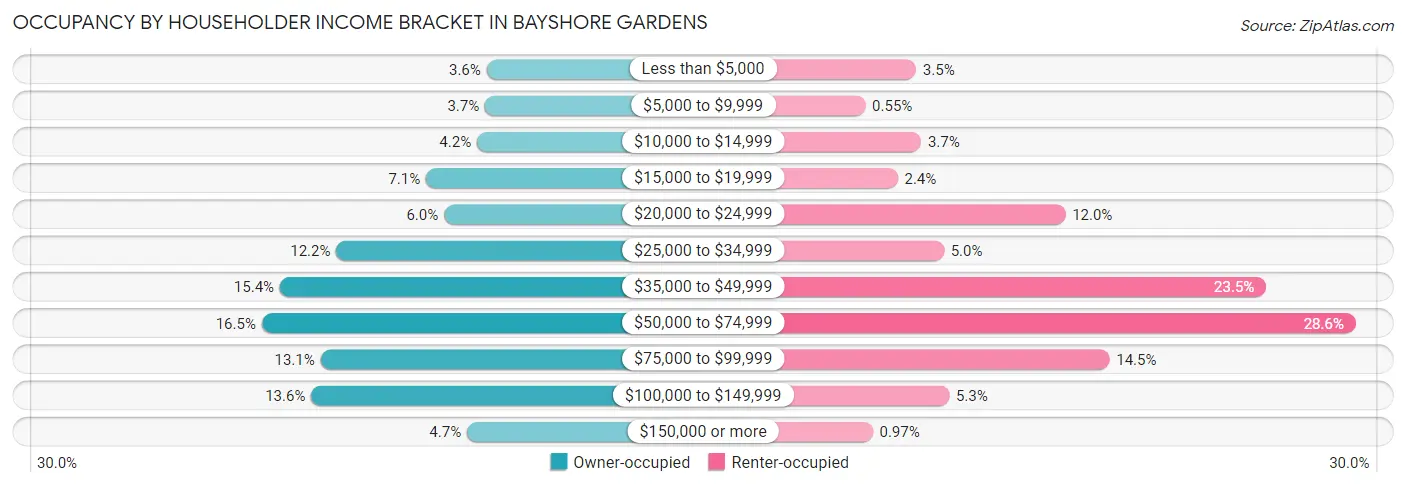
| Income Bracket | Owner-occupied | Renter-occupied |
| Less than $5,000 | 189 (3.6%) | 82 (3.5%) |
| $5,000 to $9,999 | 194 (3.7%) | 13 (0.5%) |
| $10,000 to $14,999 | 218 (4.2%) | 89 (3.7%) |
| $15,000 to $19,999 | 371 (7.1%) | 57 (2.4%) |
| $20,000 to $24,999 | 317 (6.0%) | 285 (12.0%) |
| $25,000 to $34,999 | 641 (12.2%) | 120 (5.0%) |
| $35,000 to $49,999 | 810 (15.4%) | 558 (23.5%) |
| $50,000 to $74,999 | 865 (16.5%) | 680 (28.6%) |
| $75,000 to $99,999 | 688 (13.1%) | 345 (14.5%) |
| $100,000 to $149,999 | 716 (13.6%) | 127 (5.3%) |
| $150,000 or more | 248 (4.7%) | 23 (1.0%) |
| Total | 5,257 (100.0%) | 2,379 (100.0%) |
Monthly Housing Cost Tiers in Bayshore Gardens
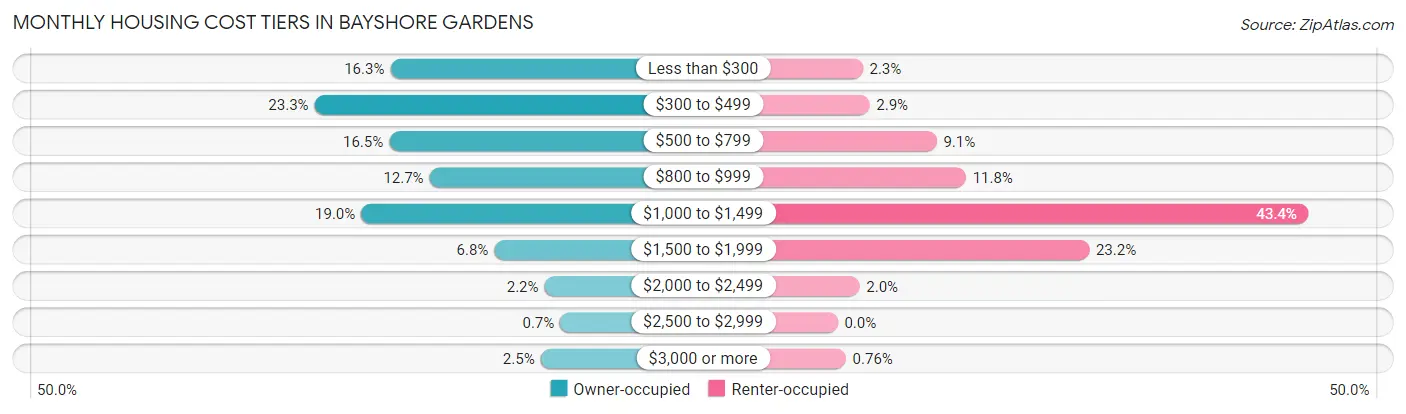
| Monthly Cost | Owner-occupied | Renter-occupied |
| Less than $300 | 859 (16.3%) | 55 (2.3%) |
| $300 to $499 | 1,226 (23.3%) | 70 (2.9%) |
| $500 to $799 | 865 (16.5%) | 217 (9.1%) |
| $800 to $999 | 669 (12.7%) | 281 (11.8%) |
| $1,000 to $1,499 | 1,000 (19.0%) | 1,032 (43.4%) |
| $1,500 to $1,999 | 356 (6.8%) | 551 (23.2%) |
| $2,000 to $2,499 | 113 (2.1%) | 48 (2.0%) |
| $2,500 to $2,999 | 37 (0.7%) | 0 (0.0%) |
| $3,000 or more | 132 (2.5%) | 18 (0.8%) |
| Total | 5,257 (100.0%) | 2,379 (100.0%) |
Physical Housing Characteristics in Bayshore Gardens
Housing Structures in Bayshore Gardens
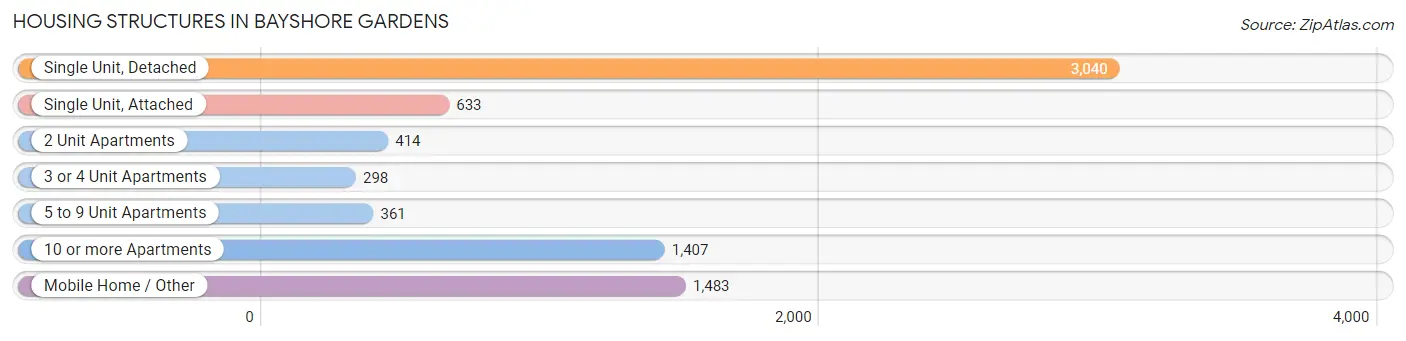
| Structure Type | # Housing Units | % Housing Units |
| Single Unit, Detached | 3,040 | 39.8% |
| Single Unit, Attached | 633 | 8.3% |
| 2 Unit Apartments | 414 | 5.4% |
| 3 or 4 Unit Apartments | 298 | 3.9% |
| 5 to 9 Unit Apartments | 361 | 4.7% |
| 10 or more Apartments | 1,407 | 18.4% |
| Mobile Home / Other | 1,483 | 19.4% |
| Total | 7,636 | 100.0% |
Housing Structures by Occupancy in Bayshore Gardens
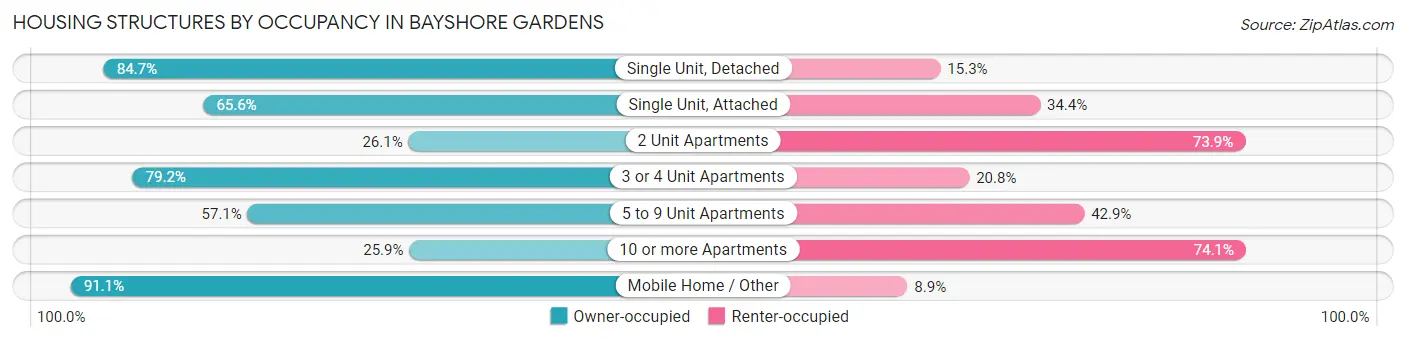
| Structure Type | Owner-occupied | Renter-occupied |
| Single Unit, Detached | 2,576 (84.7%) | 464 (15.3%) |
| Single Unit, Attached | 415 (65.6%) | 218 (34.4%) |
| 2 Unit Apartments | 108 (26.1%) | 306 (73.9%) |
| 3 or 4 Unit Apartments | 236 (79.2%) | 62 (20.8%) |
| 5 to 9 Unit Apartments | 206 (57.1%) | 155 (42.9%) |
| 10 or more Apartments | 365 (25.9%) | 1,042 (74.1%) |
| Mobile Home / Other | 1,351 (91.1%) | 132 (8.9%) |
| Total | 5,257 (68.8%) | 2,379 (31.2%) |
Housing Structures by Number of Rooms in Bayshore Gardens
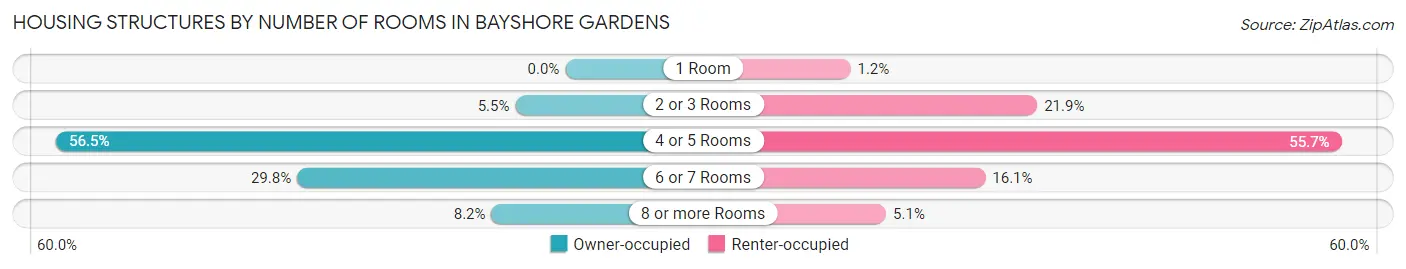
| Number of Rooms | Owner-occupied | Renter-occupied |
| 1 Room | 0 (0.0%) | 28 (1.2%) |
| 2 or 3 Rooms | 291 (5.5%) | 521 (21.9%) |
| 4 or 5 Rooms | 2,970 (56.5%) | 1,324 (55.6%) |
| 6 or 7 Rooms | 1,565 (29.8%) | 384 (16.1%) |
| 8 or more Rooms | 431 (8.2%) | 122 (5.1%) |
| Total | 5,257 (100.0%) | 2,379 (100.0%) |
Housing Structure by Heating Type in Bayshore Gardens
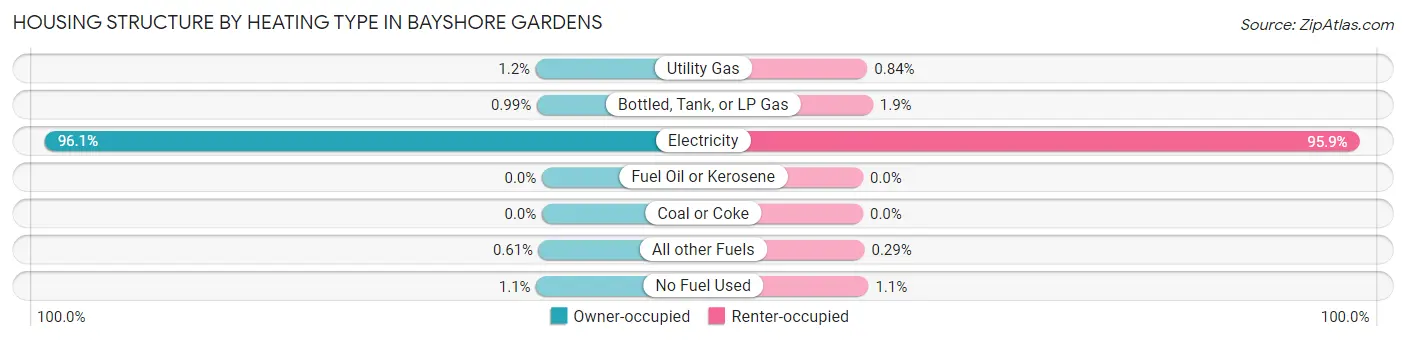
| Heating Type | Owner-occupied | Renter-occupied |
| Utility Gas | 63 (1.2%) | 20 (0.8%) |
| Bottled, Tank, or LP Gas | 52 (1.0%) | 45 (1.9%) |
| Electricity | 5,052 (96.1%) | 2,282 (95.9%) |
| Fuel Oil or Kerosene | 0 (0.0%) | 0 (0.0%) |
| Coal or Coke | 0 (0.0%) | 0 (0.0%) |
| All other Fuels | 32 (0.6%) | 7 (0.3%) |
| No Fuel Used | 58 (1.1%) | 25 (1.1%) |
| Total | 5,257 (100.0%) | 2,379 (100.0%) |
Household Vehicle Usage in Bayshore Gardens
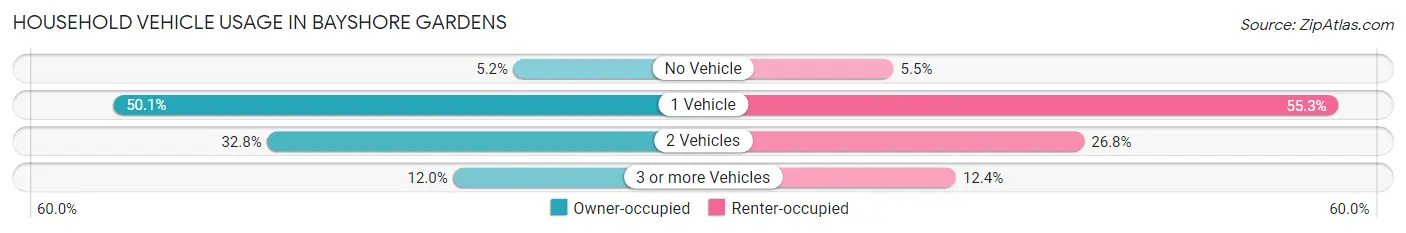
| Vehicles per Household | Owner-occupied | Renter-occupied |
| No Vehicle | 273 (5.2%) | 130 (5.5%) |
| 1 Vehicle | 2,632 (50.1%) | 1,315 (55.3%) |
| 2 Vehicles | 1,724 (32.8%) | 638 (26.8%) |
| 3 or more Vehicles | 628 (11.9%) | 296 (12.4%) |
| Total | 5,257 (100.0%) | 2,379 (100.0%) |
Real Estate & Mortgages in Bayshore Gardens
Real Estate and Mortgage Overview in Bayshore Gardens
| Characteristic | Without Mortgage | With Mortgage |
| Housing Units | 3,009 | 2,248 |
| Median Property Value | $103,700 | $203,000 |
| Median Household Income | $37,300 | $134 |
| Monthly Housing Costs | $419 | $132 |
| Real Estate Taxes | $876 | $88 |
Property Value by Mortgage Status in Bayshore Gardens
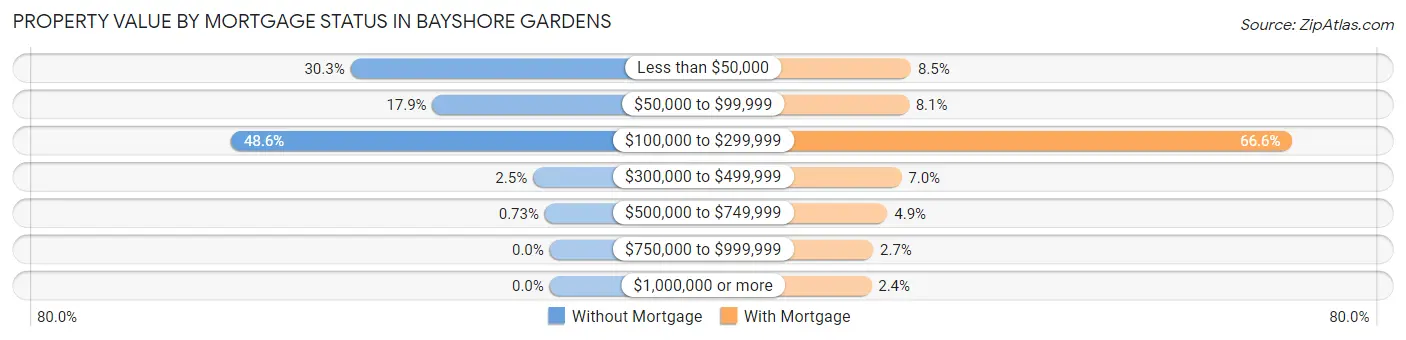
| Property Value | Without Mortgage | With Mortgage |
| Less than $50,000 | 913 (30.3%) | 190 (8.5%) |
| $50,000 to $99,999 | 537 (17.8%) | 182 (8.1%) |
| $100,000 to $299,999 | 1,461 (48.5%) | 1,496 (66.5%) |
| $300,000 to $499,999 | 76 (2.5%) | 157 (7.0%) |
| $500,000 to $749,999 | 22 (0.7%) | 109 (4.9%) |
| $750,000 to $999,999 | 0 (0.0%) | 60 (2.7%) |
| $1,000,000 or more | 0 (0.0%) | 54 (2.4%) |
| Total | 3,009 (100.0%) | 2,248 (100.0%) |
Household Income by Mortgage Status in Bayshore Gardens
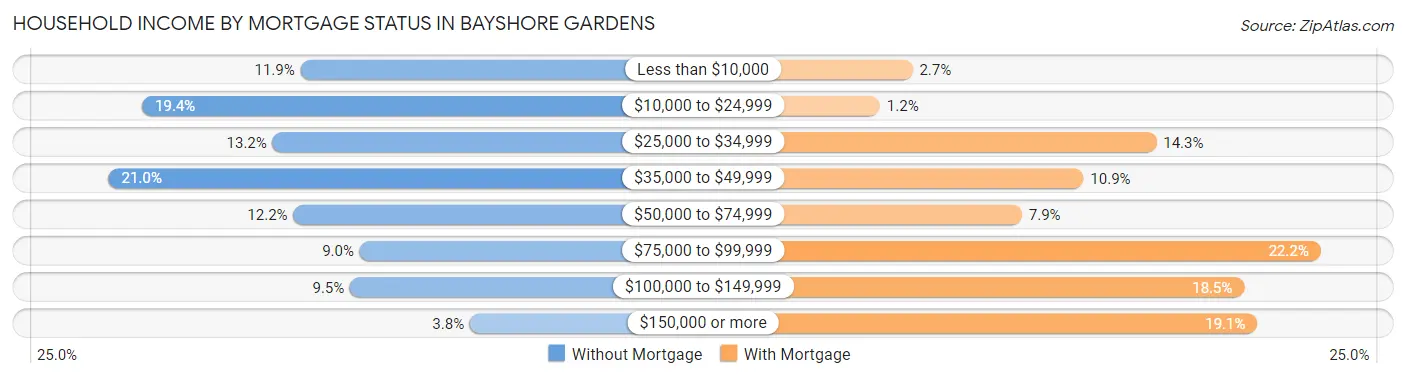
| Household Income | Without Mortgage | With Mortgage |
| Less than $10,000 | 357 (11.9%) | 61 (2.7%) |
| $10,000 to $24,999 | 584 (19.4%) | 26 (1.2%) |
| $25,000 to $34,999 | 397 (13.2%) | 322 (14.3%) |
| $35,000 to $49,999 | 632 (21.0%) | 244 (10.8%) |
| $50,000 to $74,999 | 367 (12.2%) | 178 (7.9%) |
| $75,000 to $99,999 | 272 (9.0%) | 498 (22.2%) |
| $100,000 to $149,999 | 286 (9.5%) | 416 (18.5%) |
| $150,000 or more | 114 (3.8%) | 430 (19.1%) |
| Total | 3,009 (100.0%) | 2,248 (100.0%) |
Property Value to Household Income Ratio in Bayshore Gardens
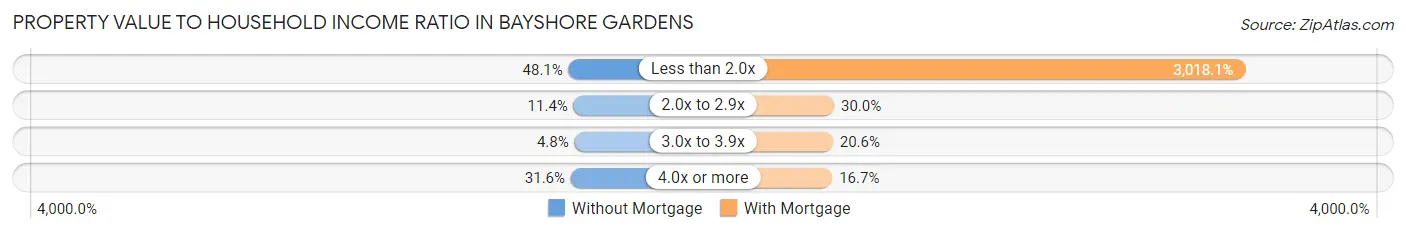
| Value-to-Income Ratio | Without Mortgage | With Mortgage |
| Less than 2.0x | 1,448 (48.1%) | 67,846 (3,018.1%) |
| 2.0x to 2.9x | 344 (11.4%) | 674 (30.0%) |
| 3.0x to 3.9x | 143 (4.8%) | 463 (20.6%) |
| 4.0x or more | 951 (31.6%) | 375 (16.7%) |
| Total | 3,009 (100.0%) | 2,248 (100.0%) |
Real Estate Taxes by Mortgage Status in Bayshore Gardens
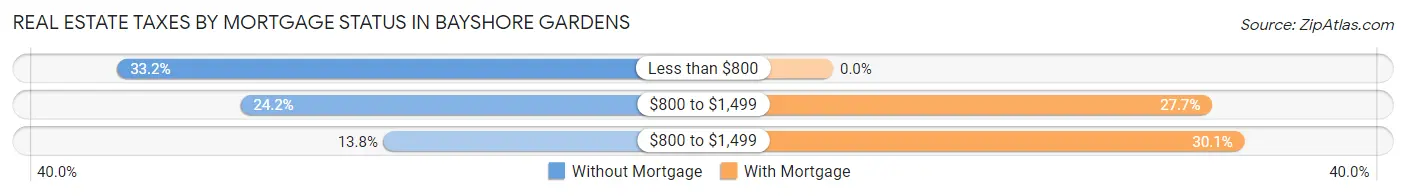
| Property Taxes | Without Mortgage | With Mortgage |
| Less than $800 | 1,000 (33.2%) | 0 (0.0%) |
| $800 to $1,499 | 729 (24.2%) | 623 (27.7%) |
| $800 to $1,499 | 414 (13.8%) | 676 (30.1%) |
| Total | 3,009 (100.0%) | 2,248 (100.0%) |
Health & Disability in Bayshore Gardens
Health Insurance Coverage by Age in Bayshore Gardens
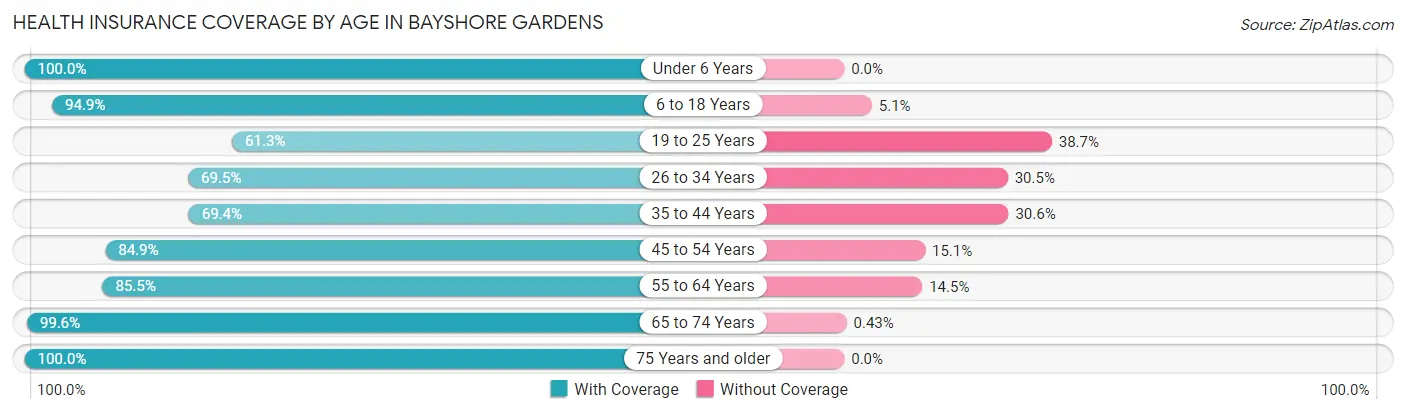
| Age Bracket | With Coverage | Without Coverage |
| Under 6 Years | 821 (100.0%) | 0 (0.0%) |
| 6 to 18 Years | 2,918 (94.9%) | 158 (5.1%) |
| 19 to 25 Years | 914 (61.3%) | 577 (38.7%) |
| 26 to 34 Years | 1,056 (69.5%) | 463 (30.5%) |
| 35 to 44 Years | 1,271 (69.4%) | 561 (30.6%) |
| 45 to 54 Years | 1,844 (84.9%) | 327 (15.1%) |
| 55 to 64 Years | 2,059 (85.5%) | 350 (14.5%) |
| 65 to 74 Years | 2,796 (99.6%) | 12 (0.4%) |
| 75 Years and older | 2,499 (100.0%) | 0 (0.0%) |
| Total | 16,178 (86.9%) | 2,448 (13.1%) |
Health Insurance Coverage by Citizenship Status in Bayshore Gardens
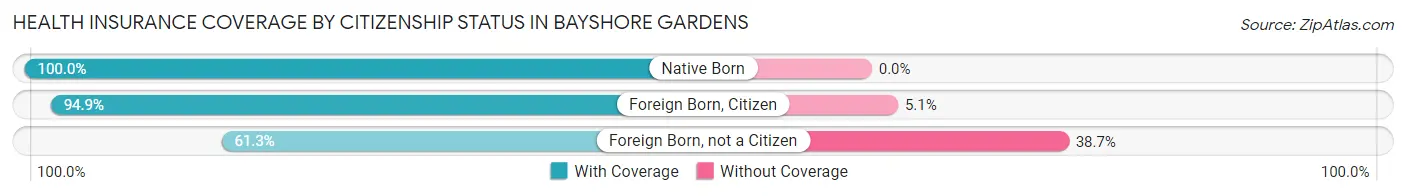
| Citizenship Status | With Coverage | Without Coverage |
| Native Born | 821 (100.0%) | 0 (0.0%) |
| Foreign Born, Citizen | 2,918 (94.9%) | 158 (5.1%) |
| Foreign Born, not a Citizen | 914 (61.3%) | 577 (38.7%) |
Health Insurance Coverage by Household Income in Bayshore Gardens
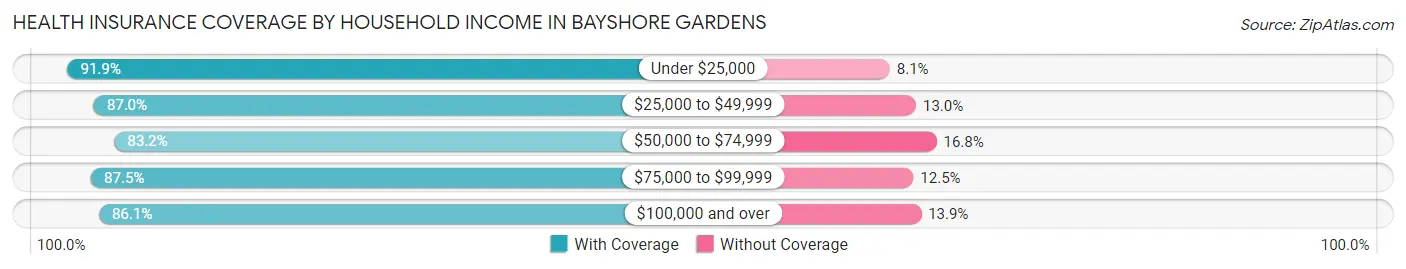
| Household Income | With Coverage | Without Coverage |
| Under $25,000 | 2,600 (91.9%) | 228 (8.1%) |
| $25,000 to $49,999 | 4,270 (87.0%) | 637 (13.0%) |
| $50,000 to $74,999 | 3,293 (83.2%) | 666 (16.8%) |
| $75,000 to $99,999 | 2,804 (87.5%) | 400 (12.5%) |
| $100,000 and over | 3,142 (86.1%) | 509 (13.9%) |
Public vs Private Health Insurance Coverage by Age in Bayshore Gardens
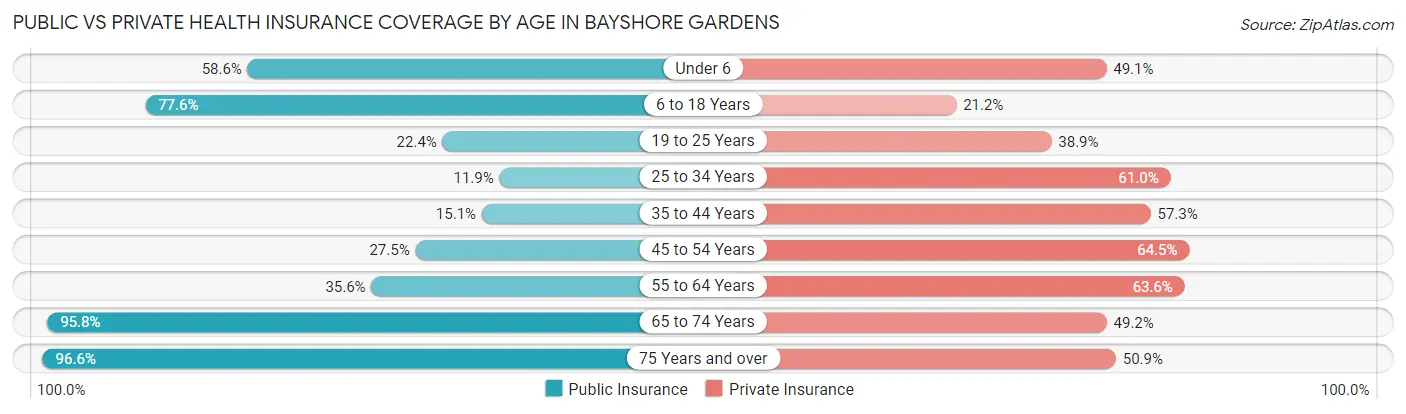
| Age Bracket | Public Insurance | Private Insurance |
| Under 6 | 481 (58.6%) | 403 (49.1%) |
| 6 to 18 Years | 2,387 (77.6%) | 653 (21.2%) |
| 19 to 25 Years | 334 (22.4%) | 580 (38.9%) |
| 25 to 34 Years | 180 (11.8%) | 927 (61.0%) |
| 35 to 44 Years | 277 (15.1%) | 1,050 (57.3%) |
| 45 to 54 Years | 596 (27.5%) | 1,400 (64.5%) |
| 55 to 64 Years | 858 (35.6%) | 1,533 (63.6%) |
| 65 to 74 Years | 2,690 (95.8%) | 1,380 (49.1%) |
| 75 Years and over | 2,415 (96.6%) | 1,271 (50.9%) |
| Total | 10,218 (54.9%) | 9,197 (49.4%) |
Disability Status by Sex by Age in Bayshore Gardens
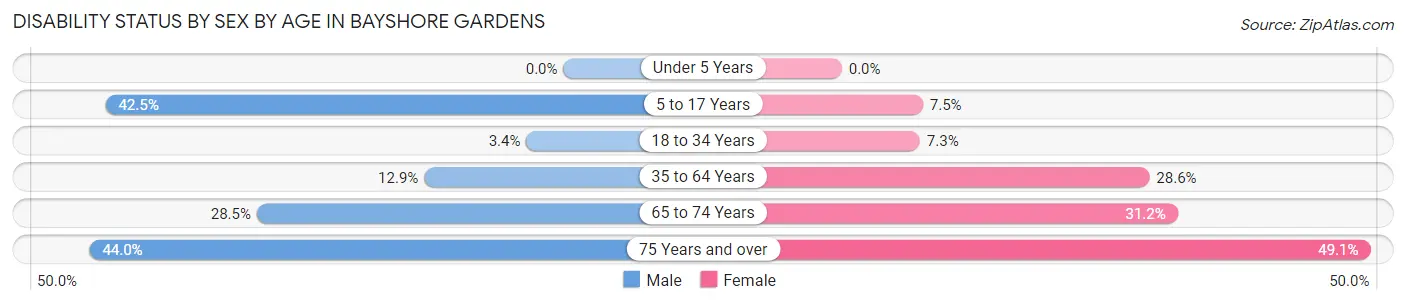
| Age Bracket | Male | Female |
| Under 5 Years | 0 (0.0%) | 0 (0.0%) |
| 5 to 17 Years | 475 (42.5%) | 113 (7.5%) |
| 18 to 34 Years | 58 (3.4%) | 131 (7.2%) |
| 35 to 64 Years | 442 (12.9%) | 854 (28.5%) |
| 65 to 74 Years | 388 (28.4%) | 450 (31.2%) |
| 75 Years and over | 431 (44.0%) | 745 (49.0%) |
Disability Class by Sex by Age in Bayshore Gardens
Disability Class: Hearing Difficulty
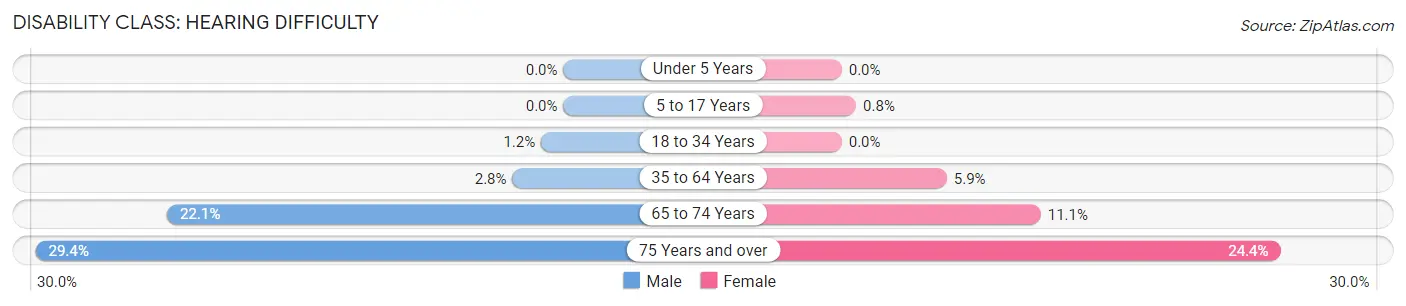
| Age Bracket | Male | Female |
| Under 5 Years | 0 (0.0%) | 0 (0.0%) |
| 5 to 17 Years | 0 (0.0%) | 12 (0.8%) |
| 18 to 34 Years | 21 (1.2%) | 0 (0.0%) |
| 35 to 64 Years | 97 (2.8%) | 175 (5.9%) |
| 65 to 74 Years | 301 (22.1%) | 160 (11.1%) |
| 75 Years and over | 288 (29.4%) | 371 (24.4%) |
Disability Class: Vision Difficulty
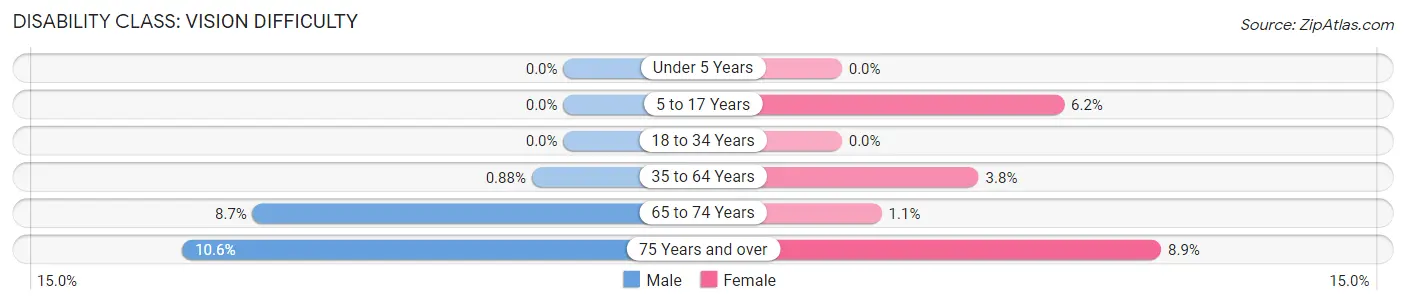
| Age Bracket | Male | Female |
| Under 5 Years | 0 (0.0%) | 0 (0.0%) |
| 5 to 17 Years | 0 (0.0%) | 93 (6.2%) |
| 18 to 34 Years | 0 (0.0%) | 0 (0.0%) |
| 35 to 64 Years | 30 (0.9%) | 114 (3.8%) |
| 65 to 74 Years | 118 (8.6%) | 16 (1.1%) |
| 75 Years and over | 104 (10.6%) | 135 (8.9%) |
Disability Class: Cognitive Difficulty
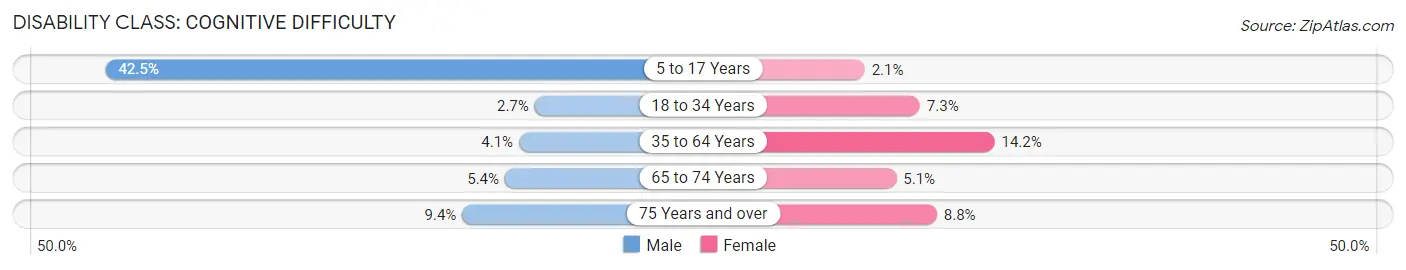
| Age Bracket | Male | Female |
| 5 to 17 Years | 475 (42.5%) | 32 (2.1%) |
| 18 to 34 Years | 45 (2.7%) | 131 (7.2%) |
| 35 to 64 Years | 141 (4.1%) | 424 (14.2%) |
| 65 to 74 Years | 74 (5.4%) | 73 (5.1%) |
| 75 Years and over | 92 (9.4%) | 134 (8.8%) |
Disability Class: Ambulatory Difficulty
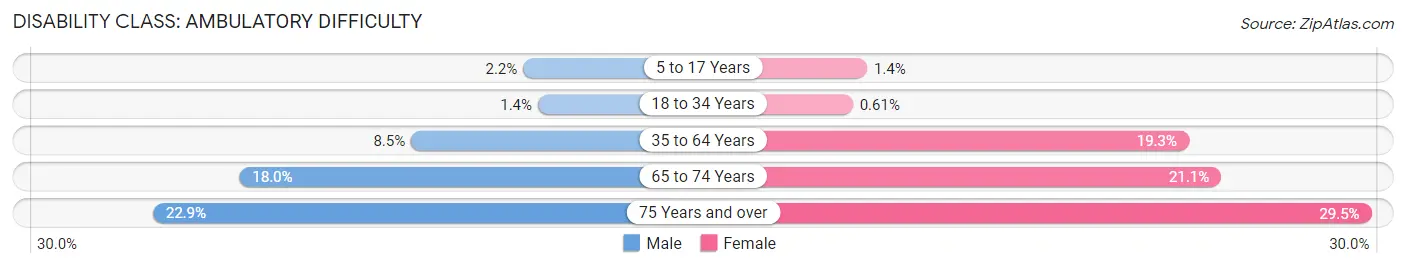
| Age Bracket | Male | Female |
| 5 to 17 Years | 25 (2.2%) | 21 (1.4%) |
| 18 to 34 Years | 24 (1.4%) | 11 (0.6%) |
| 35 to 64 Years | 290 (8.5%) | 578 (19.3%) |
| 65 to 74 Years | 246 (18.0%) | 305 (21.1%) |
| 75 Years and over | 224 (22.9%) | 448 (29.5%) |
Disability Class: Self-Care Difficulty
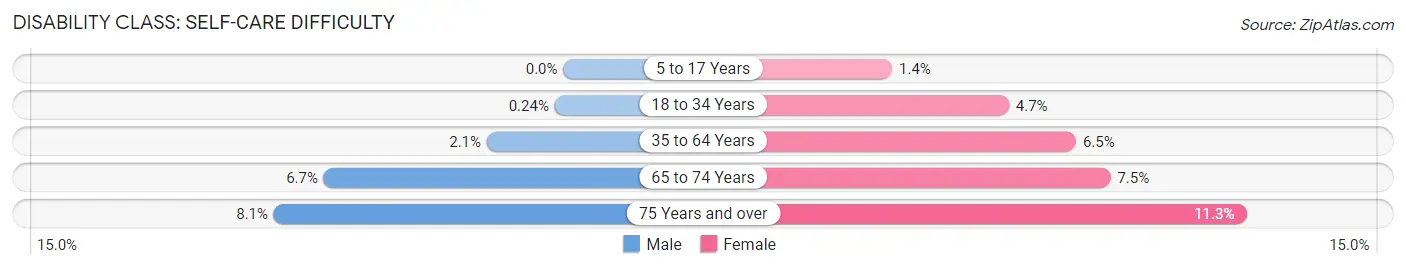
| Age Bracket | Male | Female |
| 5 to 17 Years | 0 (0.0%) | 21 (1.4%) |
| 18 to 34 Years | 4 (0.2%) | 84 (4.6%) |
| 35 to 64 Years | 73 (2.1%) | 195 (6.5%) |
| 65 to 74 Years | 91 (6.7%) | 108 (7.5%) |
| 75 Years and over | 79 (8.1%) | 171 (11.3%) |
Technology Access in Bayshore Gardens
Computing Device Access in Bayshore Gardens
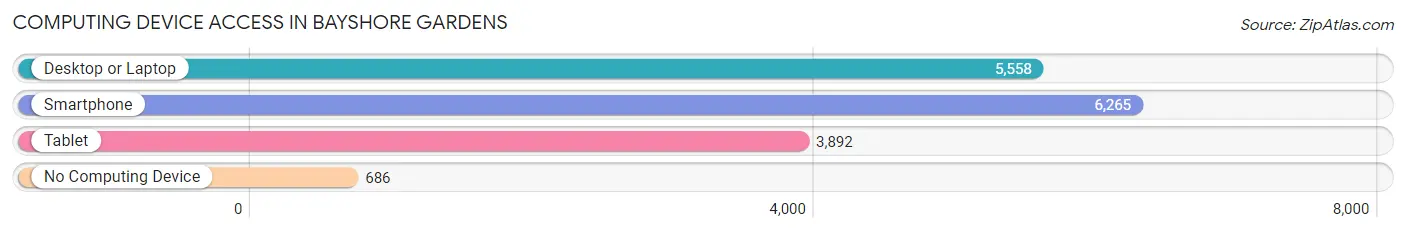
| Device Type | # Households | % Households |
| Desktop or Laptop | 5,558 | 72.8% |
| Smartphone | 6,265 | 82.1% |
| Tablet | 3,892 | 51.0% |
| No Computing Device | 686 | 9.0% |
| Total | 7,636 | 100.0% |
Internet Access in Bayshore Gardens
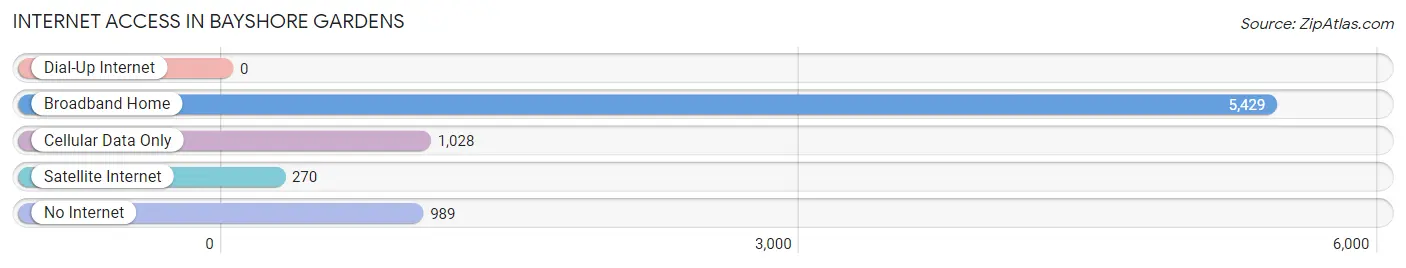
| Internet Type | # Households | % Households |
| Dial-Up Internet | 0 | 0.0% |
| Broadband Home | 5,429 | 71.1% |
| Cellular Data Only | 1,028 | 13.5% |
| Satellite Internet | 270 | 3.5% |
| No Internet | 989 | 13.0% |
| Total | 7,636 | 100.0% |
Bayshore Gardens Summary
Bayshore Gardens is a census-designated place (CDP) located in Manatee County, Florida, United States. It is part of the Bradenton–Sarasota–Venice Metropolitan Statistical Area. The population was 8,822 at the 2010 census.
History
Bayshore Gardens was founded in the 1940s as a planned community for veterans returning from World War II. The community was designed to provide affordable housing for veterans and their families. The community was built on the site of a former citrus grove and was developed by the Bayshore Gardens Corporation. The community was designed to include a variety of amenities, including a shopping center, a community center, a swimming pool, and a golf course.
Geography
Bayshore Gardens is located at 27°27'25" North, 82°33'45" West (27.456944, -82.562500). According to the United States Census Bureau, the CDP has a total area of 4.2 square miles (10.8 km2), of which 4.1 square miles (10.6 km2) is land and 0.1 square miles (0.2 km2) (2.45%) is water.
Economy
Bayshore Gardens is home to a variety of businesses, including retail stores, restaurants, and professional services. The community is also home to a number of medical facilities, including a hospital and several medical offices.
Demographics
As of the census of 2000, there were 8,822 people, 3,845 households, and 2,541 families residing in the CDP. The population density was 2,150.3 people per square mile (830.2/km2). There were 4,093 housing units at an average density of 990.2/sq mi (382.2/km2). The racial makeup of the CDP was 94.45% White, 2.45% African American, 0.25% Native American, 1.17% Asian, 0.02% Pacific Islander, 0.90% from other races, and 0.76% from two or more races. Hispanic or Latino of any race were 3.90% of the population.
There were 3,845 households, out of which 22.2% had children under the age of 18 living with them, 51.2% were married couples living together, 10.2% had a female householder with no husband present, and 34.7% were non-families. 28.7% of all households were made up of individuals, and 13.2% had someone living alone who was 65 years of age or older. The average household size was 2.30 and the average family size was 2.79.
In the CDP, the population was spread out, with 19.2% under the age of 18, 6.7% from 18 to 24, 25.2% from 25 to 44, 25.2% from 45 to 64, and 23.7% who were 65 years of age or older. The median age was 44 years. For every 100 females, there were 92.2 males. For every 100 females age 18 and over, there were 89.2 males.
The median income for a household in the CDP was $37,917, and the median income for a family was $45,938. Males had a median income of $31,912 versus $25,945 for females. The per capita income for the CDP was $20,945. About 6.2% of families and 8.7% of the population were below the poverty line, including 11.2% of those under age 18 and 6.2% of those age 65 or over.
Common Questions
What is Per Capita Income in Bayshore Gardens?
Per Capita income in Bayshore Gardens is $26,720.
What is the Median Family Income in Bayshore Gardens?
Median Family Income in Bayshore Gardens is $60,919.
What is the Median Household income in Bayshore Gardens?
Median Household Income in Bayshore Gardens is $49,003.
What is Income or Wage Gap in Bayshore Gardens?
Income or Wage Gap in Bayshore Gardens is 38.6%.
Women in Bayshore Gardens earn 61.4 cents for every dollar earned by a man.
What is Inequality or Gini Index in Bayshore Gardens?
Inequality or Gini Index in Bayshore Gardens is 0.41.
What is the Total Population of Bayshore Gardens?
Total Population of Bayshore Gardens is 18,745.
What is the Total Male Population of Bayshore Gardens?
Total Male Population of Bayshore Gardens is 9,085.
What is the Total Female Population of Bayshore Gardens?
Total Female Population of Bayshore Gardens is 9,660.
What is the Ratio of Males per 100 Females in Bayshore Gardens?
There are 94.05 Males per 100 Females in Bayshore Gardens.
What is the Ratio of Females per 100 Males in Bayshore Gardens?
There are 106.33 Females per 100 Males in Bayshore Gardens.
What is the Median Population Age in Bayshore Gardens?
Median Population Age in Bayshore Gardens is 47.5 Years.
What is the Average Family Size in Bayshore Gardens
Average Family Size in Bayshore Gardens is 3.2 People.
What is the Average Household Size in Bayshore Gardens
Average Household Size in Bayshore Gardens is 2.4 People.
How Large is the Labor Force in Bayshore Gardens?
There are 8,635 People in the Labor Forcein in Bayshore Gardens.
What is the Percentage of People in the Labor Force in Bayshore Gardens?
54.5% of People are in the Labor Force in Bayshore Gardens.
What is the Unemployment Rate in Bayshore Gardens?
Unemployment Rate in Bayshore Gardens is 11.7%.