Zip Codes with the Highest Percentage of Population Employed in Firefighting & Prevention in Delaware
RELATED REPORTS & OPTIONS
Firefighting & Prevention
Delaware
Compare Zip Codes
Map of Zip Codes with the Highest Percentage of Population Employed in Firefighting & Prevention in Delaware
0.0%
30.0%
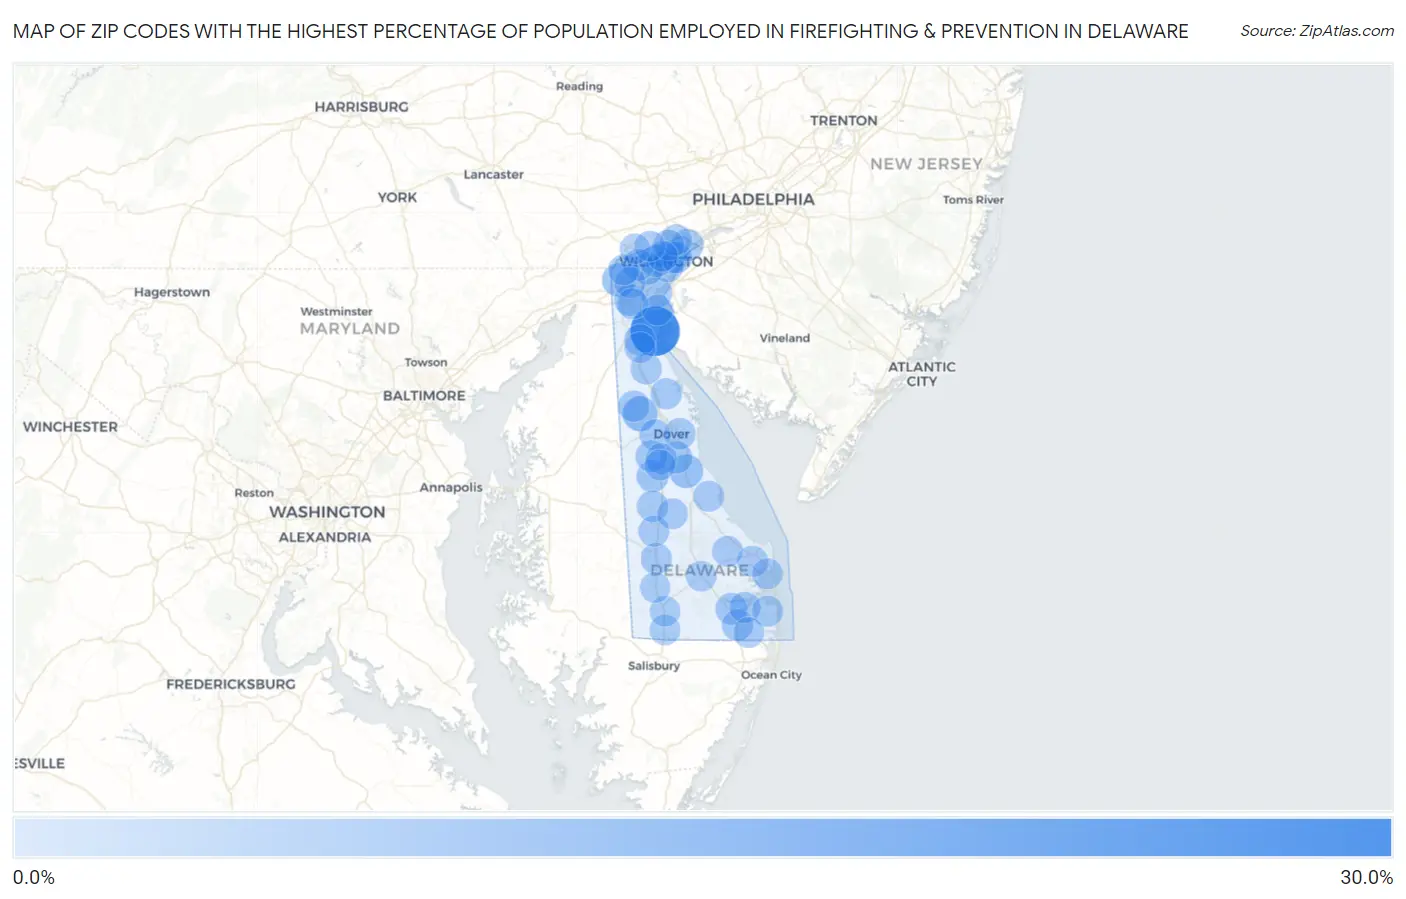
Zip Codes with the Highest Percentage of Population Employed in Firefighting & Prevention in Delaware
| Zip Code | % Employed | vs State | vs National | |
| 1. | 19731 | 29.2% | 1.4%(+27.8)#1 | 1.2%(+28.0)#46 |
| 2. | 19955 | 6.8% | 1.4%(+5.46)#2 | 1.2%(+5.66)#536 |
| 3. | 19946 | 4.9% | 1.4%(+3.53)#3 | 1.2%(+3.74)#938 |
| 4. | 19717 | 4.6% | 1.4%(+3.26)#4 | 1.2%(+3.46)#1,043 |
| 5. | 19802 | 2.6% | 1.4%(+1.22)#5 | 1.2%(+1.42)#2,883 |
| 6. | 19962 | 2.5% | 1.4%(+1.13)#6 | 1.2%(+1.33)#3,064 |
| 7. | 19703 | 2.3% | 1.4%(+0.960)#7 | 1.2%(+1.16)#3,455 |
| 8. | 19720 | 2.2% | 1.4%(+0.856)#8 | 1.2%(+1.06)#3,728 |
| 9. | 19943 | 2.2% | 1.4%(+0.853)#9 | 1.2%(+1.05)#3,742 |
| 10. | 19801 | 2.2% | 1.4%(+0.802)#10 | 1.2%(+1.00)#3,899 |
| 11. | 19804 | 2.2% | 1.4%(+0.780)#11 | 1.2%(+0.982)#3,961 |
| 12. | 19805 | 2.1% | 1.4%(+0.754)#12 | 1.2%(+0.956)#4,029 |
| 13. | 19966 | 2.0% | 1.4%(+0.651)#13 | 1.2%(+0.853)#4,377 |
| 14. | 19702 | 1.9% | 1.4%(+0.526)#14 | 1.2%(+0.728)#4,862 |
| 15. | 19709 | 1.7% | 1.4%(+0.346)#15 | 1.2%(+0.548)#5,667 |
| 16. | 19809 | 1.7% | 1.4%(+0.287)#16 | 1.2%(+0.489)#5,970 |
| 17. | 19934 | 1.6% | 1.4%(+0.254)#17 | 1.2%(+0.456)#6,153 |
| 18. | 19938 | 1.5% | 1.4%(+0.076)#18 | 1.2%(+0.278)#7,215 |
| 19. | 19734 | 1.5% | 1.4%(+0.071)#19 | 1.2%(+0.273)#7,252 |
| 20. | 19945 | 1.4% | 1.4%(+0.040)#20 | 1.2%(+0.242)#7,459 |
| 21. | 19952 | 1.4% | 1.4%(-0.013)#21 | 1.2%(+0.189)#7,809 |
| 22. | 19933 | 1.4% | 1.4%(-0.027)#22 | 1.2%(+0.175)#7,897 |
| 23. | 19901 | 1.3% | 1.4%(-0.051)#23 | 1.2%(+0.150)#8,085 |
| 24. | 19810 | 1.3% | 1.4%(-0.062)#24 | 1.2%(+0.139)#8,154 |
| 25. | 19808 | 1.3% | 1.4%(-0.120)#25 | 1.2%(+0.081)#8,610 |
| 26. | 19904 | 1.2% | 1.4%(-0.142)#26 | 1.2%(+0.060)#8,770 |
| 27. | 19713 | 1.2% | 1.4%(-0.188)#27 | 1.2%(+0.014)#9,140 |
| 28. | 19939 | 1.2% | 1.4%(-0.207)#28 | 1.2%(-0.005)#9,317 |
| 29. | 19980 | 1.0% | 1.4%(-0.346)#29 | 1.2%(-0.144)#10,670 |
| 30. | 19977 | 1.00% | 1.4%(-0.392)#30 | 1.2%(-0.190)#11,134 |
| 31. | 19701 | 0.95% | 1.4%(-0.438)#31 | 1.2%(-0.237)#11,652 |
| 32. | 19970 | 0.94% | 1.4%(-0.449)#32 | 1.2%(-0.247)#11,756 |
| 33. | 19958 | 0.91% | 1.4%(-0.474)#33 | 1.2%(-0.272)#12,007 |
| 34. | 19950 | 0.88% | 1.4%(-0.507)#34 | 1.2%(-0.306)#12,368 |
| 35. | 19963 | 0.79% | 1.4%(-0.601)#35 | 1.2%(-0.399)#13,372 |
| 36. | 19706 | 0.78% | 1.4%(-0.609)#36 | 1.2%(-0.407)#13,447 |
| 37. | 19730 | 0.76% | 1.4%(-0.624)#37 | 1.2%(-0.422)#13,625 |
| 38. | 19968 | 0.69% | 1.4%(-0.696)#38 | 1.2%(-0.494)#14,428 |
| 39. | 19979 | 0.68% | 1.4%(-0.707)#39 | 1.2%(-0.506)#14,567 |
| 40. | 19803 | 0.68% | 1.4%(-0.711)#40 | 1.2%(-0.510)#14,599 |
| 41. | 19711 | 0.66% | 1.4%(-0.725)#41 | 1.2%(-0.523)#14,757 |
| 42. | 19971 | 0.64% | 1.4%(-0.743)#42 | 1.2%(-0.541)#14,957 |
| 43. | 19806 | 0.63% | 1.4%(-0.757)#43 | 1.2%(-0.555)#15,091 |
| 44. | 19954 | 0.55% | 1.4%(-0.842)#44 | 1.2%(-0.640)#16,002 |
| 45. | 19807 | 0.53% | 1.4%(-0.853)#45 | 1.2%(-0.651)#16,143 |
| 46. | 19975 | 0.49% | 1.4%(-0.896)#46 | 1.2%(-0.695)#16,653 |
| 47. | 19940 | 0.31% | 1.4%(-1.07)#47 | 1.2%(-0.872)#18,615 |
| 48. | 19956 | 0.31% | 1.4%(-1.08)#48 | 1.2%(-0.876)#18,661 |
| 49. | 19973 | 0.23% | 1.4%(-1.16)#49 | 1.2%(-0.956)#19,418 |
| 50. | 19947 | 0.13% | 1.4%(-1.25)#50 | 1.2%(-1.05)#20,138 |
| 51. | 19707 | 0.061% | 1.4%(-1.33)#51 | 1.2%(-1.12)#20,472 |
1
Common Questions
What are the Top 10 Zip Codes with the Highest Percentage of Population Employed in Firefighting & Prevention in Delaware?
Top 10 Zip Codes with the Highest Percentage of Population Employed in Firefighting & Prevention in Delaware are:
What zip code has the Highest Percentage of Population Employed in Firefighting & Prevention in Delaware?
19731 has the Highest Percentage of Population Employed in Firefighting & Prevention in Delaware with 29.2%.
What is the Percentage of Population Employed in Firefighting & Prevention in the State of Delaware?
Percentage of Population Employed in Firefighting & Prevention in Delaware is 1.4%.
What is the Percentage of Population Employed in Firefighting & Prevention in the United States?
Percentage of Population Employed in Firefighting & Prevention in the United States is 1.2%.