Carolina, AL Map & Demographics
Carolina Map
Carolina Overview
$30,630
PER CAPITA INCOME
$78,750
AVG FAMILY INCOME
$48,750
AVG HOUSEHOLD INCOME
24.2%
WAGE / INCOME GAP [ % ]
75.8¢/ $1
WAGE / INCOME GAP [ $ ]
0.43
INEQUALITY / GINI INDEX
279
TOTAL POPULATION
132
MALE POPULATION
147
FEMALE POPULATION
89.80
MALES / 100 FEMALES
111.36
FEMALES / 100 MALES
38.6
MEDIAN AGE
3.1
AVG FAMILY SIZE
2.2
AVG HOUSEHOLD SIZE
121
LABOR FORCE [ PEOPLE ]
50.8%
PERCENT IN LABOR FORCE
Carolina Area Codes
Income in Carolina
Income Overview in Carolina
Per Capita Income in Carolina is $30,630, while median incomes of families and households are $78,750 and $48,750 respectively.
| Characteristic | Number | Measure |
| Per Capita Income | 279 | $30,630 |
| Median Family Income | 69 | $78,750 |
| Mean Family Income | 69 | $87,314 |
| Median Household Income | 128 | $48,750 |
| Mean Household Income | 128 | $64,586 |
| Income Deficit | 69 | $0 |
| Wage / Income Gap (%) | 279 | 24.19% |
| Wage / Income Gap ($) | 279 | 75.81¢ per $1 |
| Gini / Inequality Index | 279 | 0.43 |
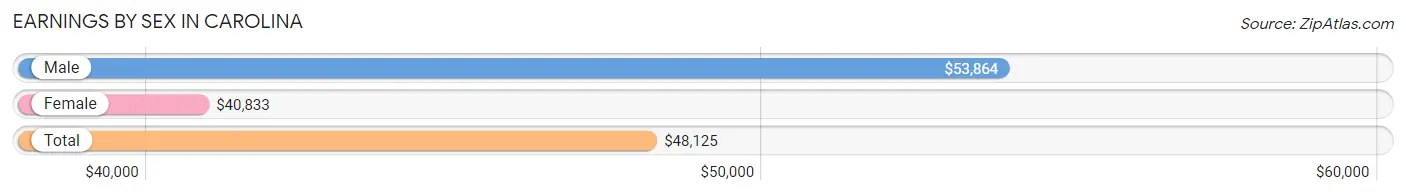
Earnings by Sex in Carolina
Average Earnings in Carolina are $48,125, $53,864 for men and $40,833 for women, a difference of 24.2%.
| Sex | Number | Average Earnings |
| Male | 76 (61.3%) | $53,864 |
| Female | 48 (38.7%) | $40,833 |
| Total | 124 (100.0%) | $48,125 |
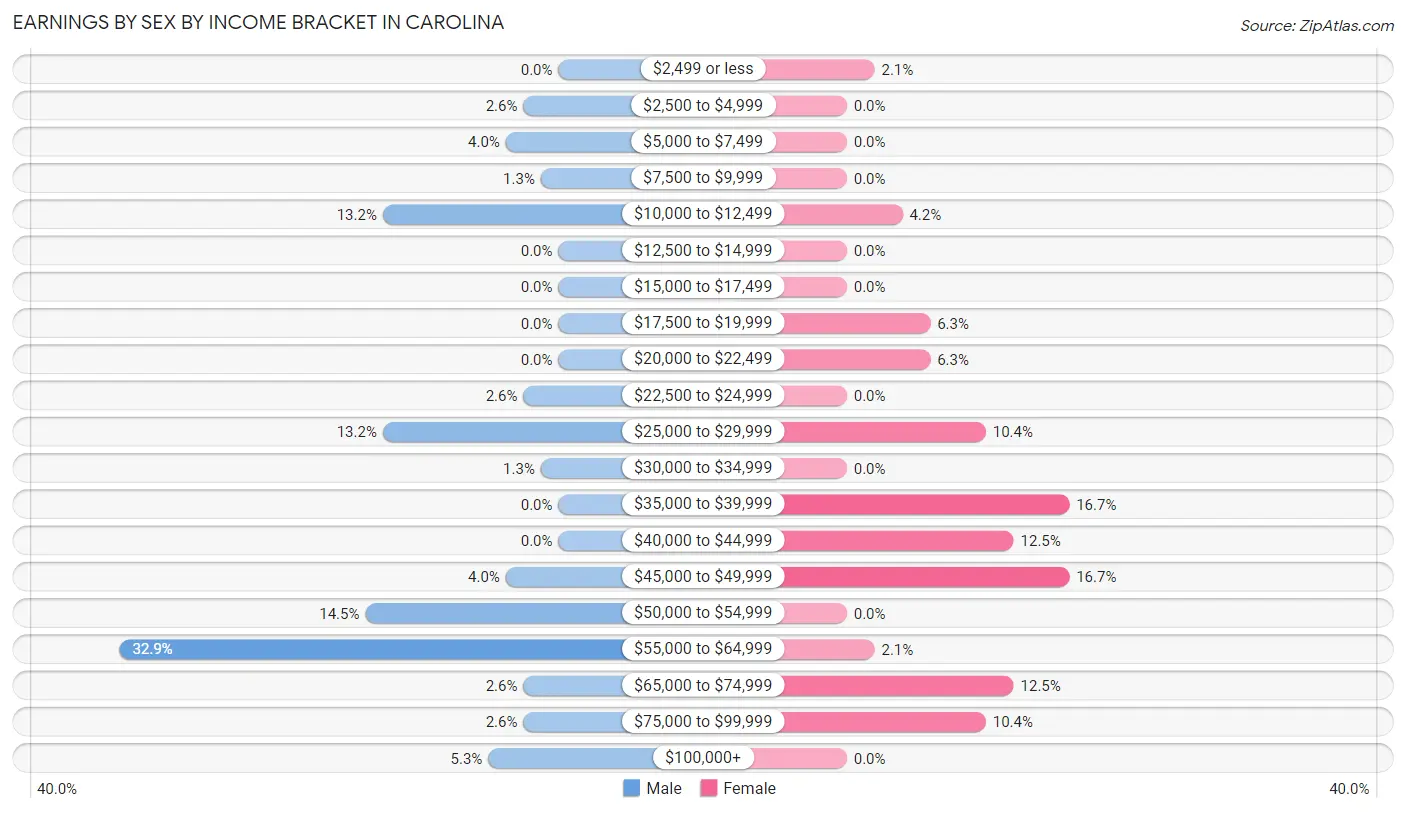
Earnings by Sex by Income Bracket in Carolina
The most common earnings brackets in Carolina are $55,000 to $64,999 for men (25 | 32.9%) and $35,000 to $39,999 for women (8 | 16.7%).
| Income | Male | Female |
| $2,499 or less | 0 (0.0%) | 1 (2.1%) |
| $2,500 to $4,999 | 2 (2.6%) | 0 (0.0%) |
| $5,000 to $7,499 | 3 (4.0%) | 0 (0.0%) |
| $7,500 to $9,999 | 1 (1.3%) | 0 (0.0%) |
| $10,000 to $12,499 | 10 (13.2%) | 2 (4.2%) |
| $12,500 to $14,999 | 0 (0.0%) | 0 (0.0%) |
| $15,000 to $17,499 | 0 (0.0%) | 0 (0.0%) |
| $17,500 to $19,999 | 0 (0.0%) | 3 (6.2%) |
| $20,000 to $22,499 | 0 (0.0%) | 3 (6.2%) |
| $22,500 to $24,999 | 2 (2.6%) | 0 (0.0%) |
| $25,000 to $29,999 | 10 (13.2%) | 5 (10.4%) |
| $30,000 to $34,999 | 1 (1.3%) | 0 (0.0%) |
| $35,000 to $39,999 | 0 (0.0%) | 8 (16.7%) |
| $40,000 to $44,999 | 0 (0.0%) | 6 (12.5%) |
| $45,000 to $49,999 | 3 (4.0%) | 8 (16.7%) |
| $50,000 to $54,999 | 11 (14.5%) | 0 (0.0%) |
| $55,000 to $64,999 | 25 (32.9%) | 1 (2.1%) |
| $65,000 to $74,999 | 2 (2.6%) | 6 (12.5%) |
| $75,000 to $99,999 | 2 (2.6%) | 5 (10.4%) |
| $100,000+ | 4 (5.3%) | 0 (0.0%) |
| Total | 76 (100.0%) | 48 (100.0%) |
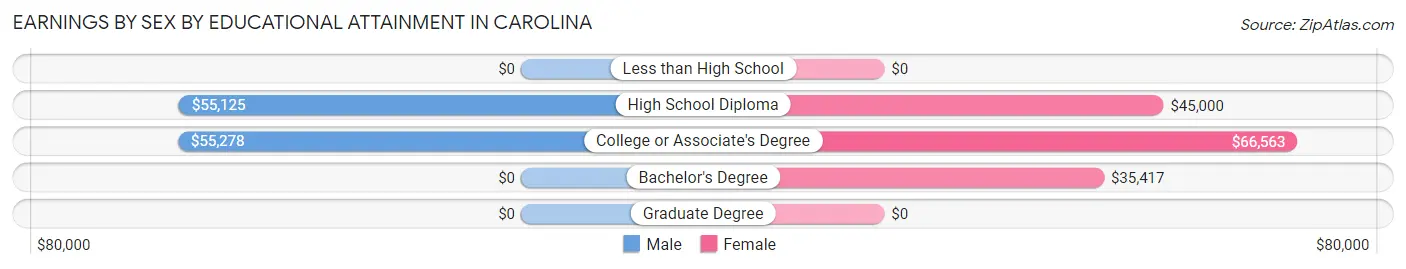
Earnings by Sex by Educational Attainment in Carolina
Average earnings in Carolina are $54,545 for men and $41,042 for women, a difference of 24.8%. Men with an educational attainment of college or associate's degree enjoy the highest average annual earnings of $55,278, while those with high school diploma education earn the least with $55,125. Women with an educational attainment of college or associate's degree earn the most with the average annual earnings of $66,563, while those with bachelor's degree education have the smallest earnings of $35,417.
| Educational Attainment | Male Income | Female Income |
| Less than High School | - | - |
| High School Diploma | $55,125 | $45,000 |
| College or Associate's Degree | $55,278 | $66,563 |
| Bachelor's Degree | - | - |
| Graduate Degree | - | - |
| Total | $54,545 | $41,042 |
Family Income in Carolina
Family Income Brackets in Carolina
According to the Carolina family income data, there are 12 families falling into the $75,000 to $99,999 income range, which is the most common income bracket and makes up 17.4% of all families.
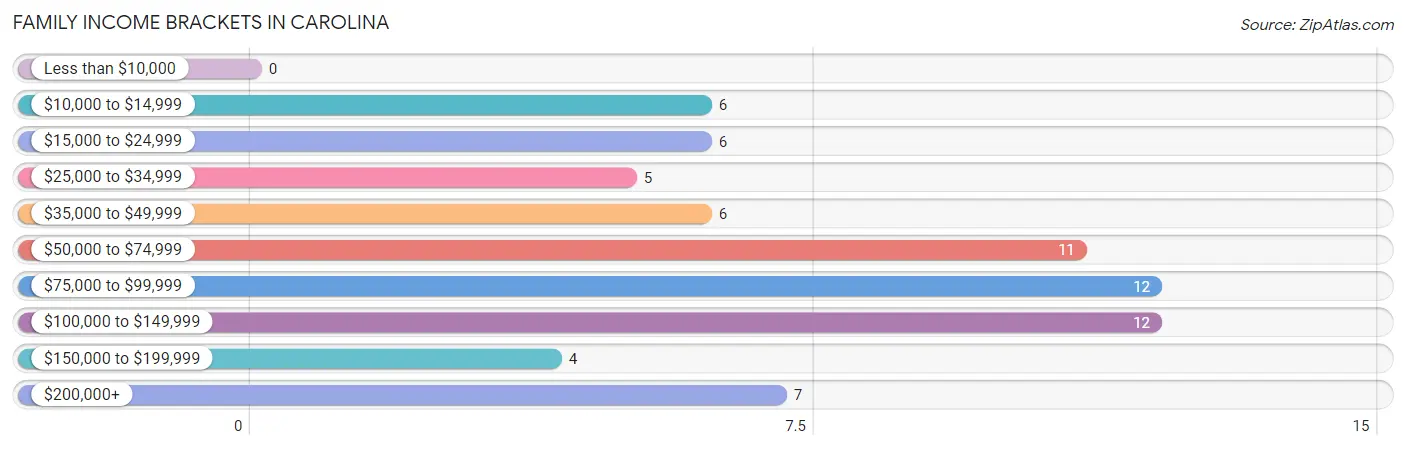
| Income Bracket | # Families | % Families |
| Less than $10,000 | 0 | 0.0% |
| $10,000 to $14,999 | 6 | 8.7% |
| $15,000 to $24,999 | 6 | 8.7% |
| $25,000 to $34,999 | 5 | 7.2% |
| $35,000 to $49,999 | 6 | 8.7% |
| $50,000 to $74,999 | 11 | 15.9% |
| $75,000 to $99,999 | 12 | 17.4% |
| $100,000 to $149,999 | 12 | 17.4% |
| $150,000 to $199,999 | 4 | 5.8% |
| $200,000+ | 7 | 10.1% |
Family Income by Famaliy Size in Carolina
4-person families (11 | 15.9%) account for the highest median family income in Carolina with $240,250 per family, while 4-person families (11 | 15.9%) have the highest median income of $60,062 per family member.
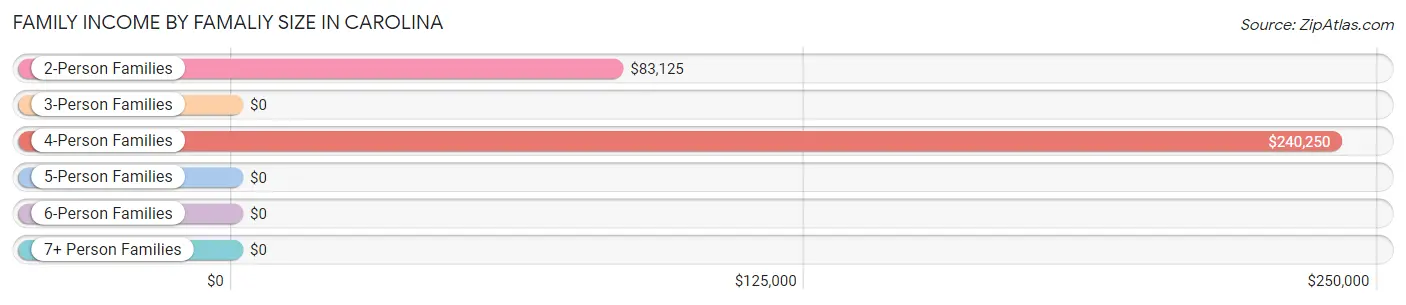
| Income Bracket | # Families | Median Income |
| 2-Person Families | 28 (40.6%) | $83,125 |
| 3-Person Families | 25 (36.2%) | $0 |
| 4-Person Families | 11 (15.9%) | $240,250 |
| 5-Person Families | 5 (7.2%) | $0 |
| 6-Person Families | 0 (0.0%) | $0 |
| 7+ Person Families | 0 (0.0%) | $0 |
| Total | 69 (100.0%) | $78,750 |
Family Income by Number of Earners in Carolina
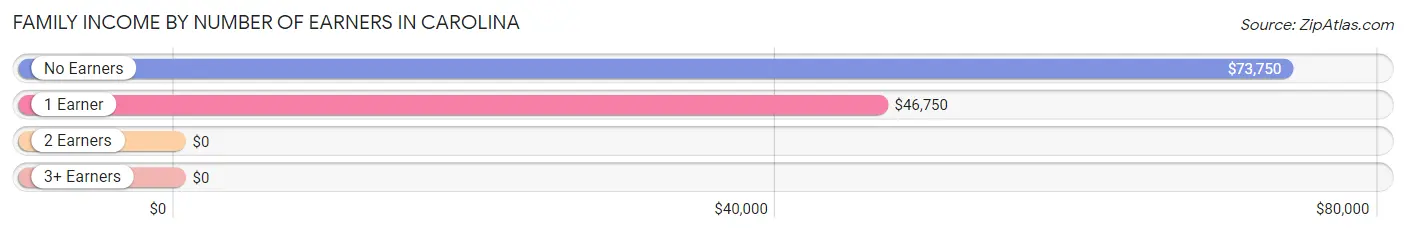
| Number of Earners | # Families | Median Income |
| No Earners | 8 (11.6%) | $73,750 |
| 1 Earner | 39 (56.5%) | $46,750 |
| 2 Earners | 18 (26.1%) | $0 |
| 3+ Earners | 4 (5.8%) | $0 |
| Total | 69 (100.0%) | $78,750 |
Household Income in Carolina
Household Income Brackets in Carolina
With 22 households falling in the category, the $50,000 to $74,999 income range is the most frequent in Carolina, accounting for 17.2% of all households. In contrast, only 4 households (3.1%) fall into the less than $10,000 income bracket, making it the least populous group.
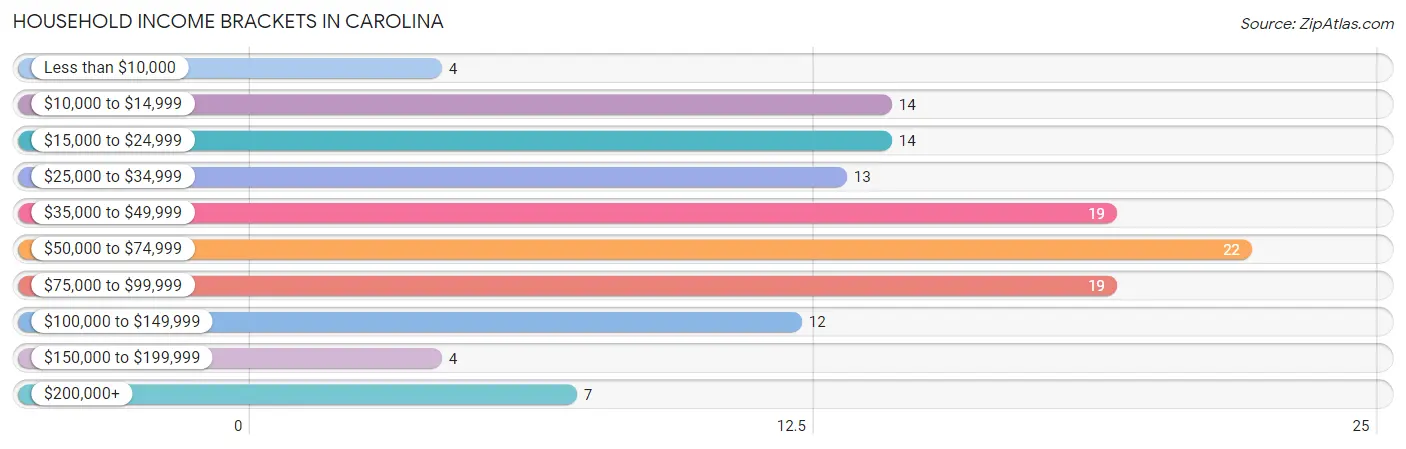
| Income Bracket | # Households | % Households |
| Less than $10,000 | 4 | 3.1% |
| $10,000 to $14,999 | 14 | 10.9% |
| $15,000 to $24,999 | 14 | 10.9% |
| $25,000 to $34,999 | 13 | 10.2% |
| $35,000 to $49,999 | 19 | 14.8% |
| $50,000 to $74,999 | 22 | 17.2% |
| $75,000 to $99,999 | 19 | 14.8% |
| $100,000 to $149,999 | 12 | 9.4% |
| $150,000 to $199,999 | 4 | 3.1% |
| $200,000+ | 7 | 5.5% |
Household Income by Householder Age in Carolina
The median household income in Carolina is $48,750, with the highest median household income of $56,932 found in the 45 to 64 years age bracket for the primary householder. A total of 63 households (49.2%) fall into this category.
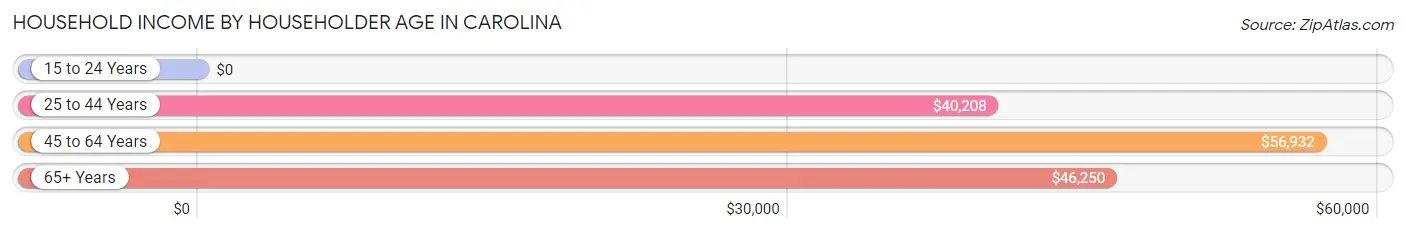
| Income Bracket | # Households | Median Income |
| 15 to 24 Years | 0 (0.0%) | $0 |
| 25 to 44 Years | 37 (28.9%) | $40,208 |
| 45 to 64 Years | 63 (49.2%) | $56,932 |
| 65+ Years | 28 (21.9%) | $46,250 |
| Total | 128 (100.0%) | $48,750 |
Poverty in Carolina
Income Below Poverty by Sex and Age in Carolina
With 17.4% poverty level for males and 17.7% for females among the residents of Carolina, under 5 year old males and 6 to 11 year old females are the most vulnerable to poverty, with 3 males (100.0%) and 6 females (75.0%) in their respective age groups living below the poverty level.
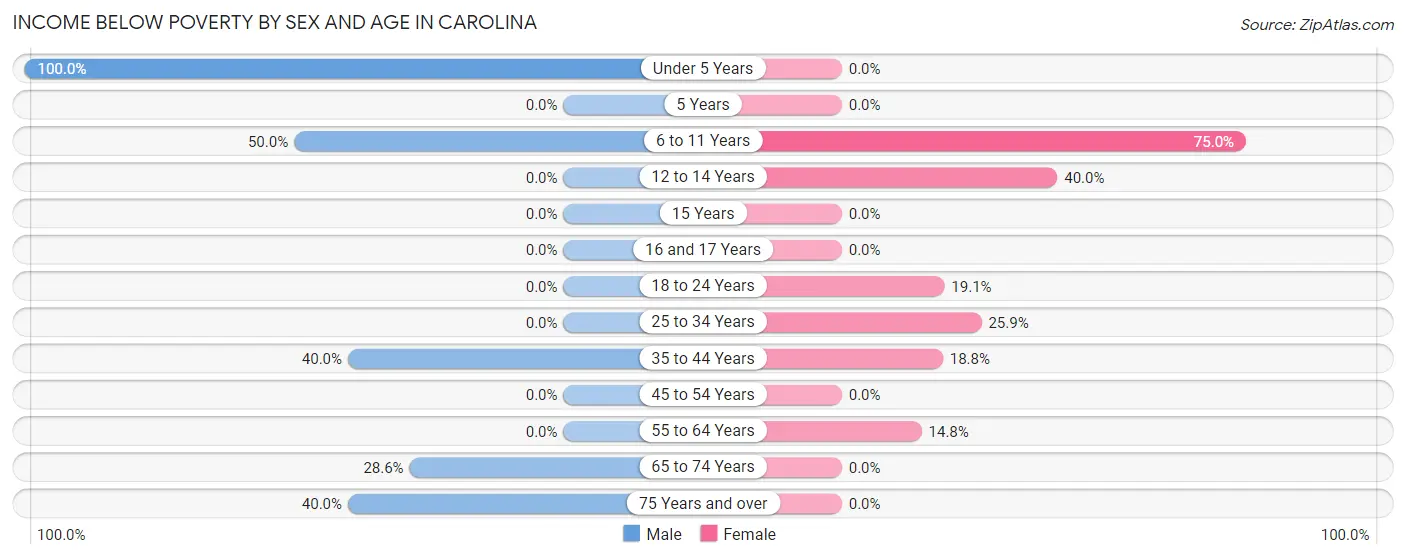
| Age Bracket | Male | Female |
| Under 5 Years | 3 (100.0%) | 0 (0.0%) |
| 5 Years | 0 (0.0%) | 0 (0.0%) |
| 6 to 11 Years | 6 (50.0%) | 6 (75.0%) |
| 12 to 14 Years | 0 (0.0%) | 2 (40.0%) |
| 15 Years | 0 (0.0%) | 0 (0.0%) |
| 16 and 17 Years | 0 (0.0%) | 0 (0.0%) |
| 18 to 24 Years | 0 (0.0%) | 4 (19.1%) |
| 25 to 34 Years | 0 (0.0%) | 7 (25.9%) |
| 35 to 44 Years | 6 (40.0%) | 3 (18.8%) |
| 45 to 54 Years | 0 (0.0%) | 0 (0.0%) |
| 55 to 64 Years | 0 (0.0%) | 4 (14.8%) |
| 65 to 74 Years | 6 (28.6%) | 0 (0.0%) |
| 75 Years and over | 2 (40.0%) | 0 (0.0%) |
| Total | 23 (17.4%) | 26 (17.7%) |
Income Above Poverty by Sex and Age in Carolina
According to the poverty statistics in Carolina, males aged 5 years and females aged under 5 years are the age groups that are most secure financially, with 100.0% of males and 100.0% of females in these age groups living above the poverty line.
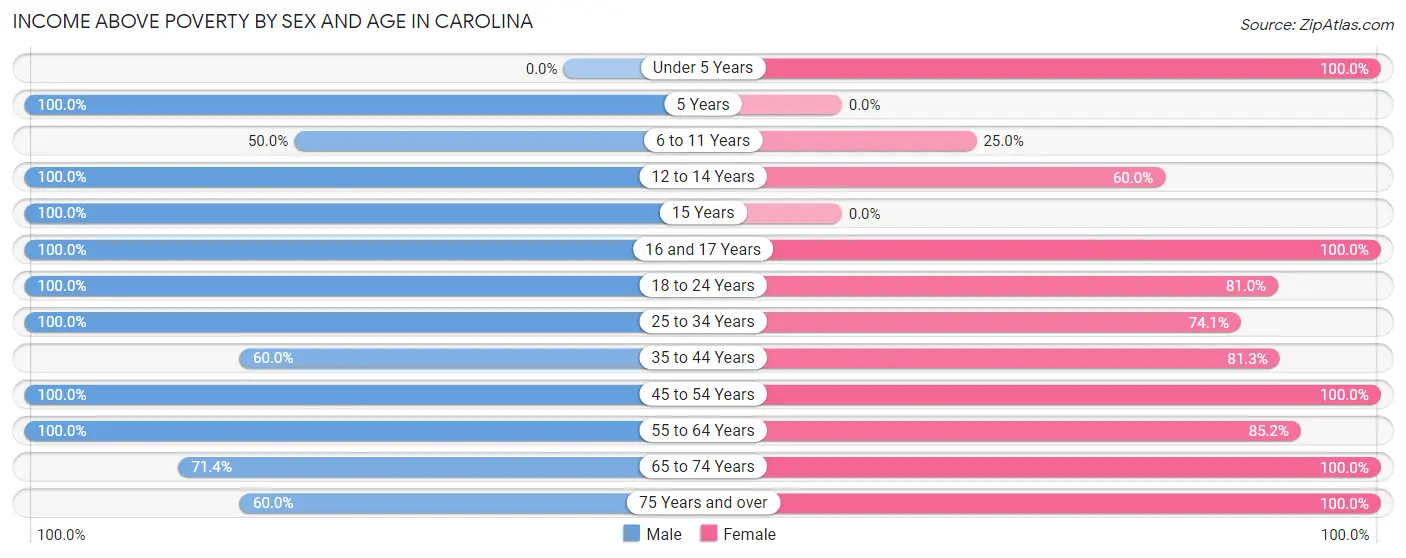
| Age Bracket | Male | Female |
| Under 5 Years | 0 (0.0%) | 4 (100.0%) |
| 5 Years | 6 (100.0%) | 0 (0.0%) |
| 6 to 11 Years | 6 (50.0%) | 2 (25.0%) |
| 12 to 14 Years | 1 (100.0%) | 3 (60.0%) |
| 15 Years | 2 (100.0%) | 0 (0.0%) |
| 16 and 17 Years | 1 (100.0%) | 1 (100.0%) |
| 18 to 24 Years | 9 (100.0%) | 17 (80.9%) |
| 25 to 34 Years | 17 (100.0%) | 20 (74.1%) |
| 35 to 44 Years | 9 (60.0%) | 13 (81.2%) |
| 45 to 54 Years | 16 (100.0%) | 21 (100.0%) |
| 55 to 64 Years | 24 (100.0%) | 23 (85.2%) |
| 65 to 74 Years | 15 (71.4%) | 13 (100.0%) |
| 75 Years and over | 3 (60.0%) | 4 (100.0%) |
| Total | 109 (82.6%) | 121 (82.3%) |
Income Below Poverty Among Married-Couple Families in Carolina
The poverty statistics for married-couple families in Carolina show that 10.5% or 6 of the total 57 families live below the poverty line. Families with 1 or 2 children have the highest poverty rate of 27.3%, comprising of 6 families. On the other hand, families with no children have the lowest poverty rate of 0.0%, which includes 0 families.
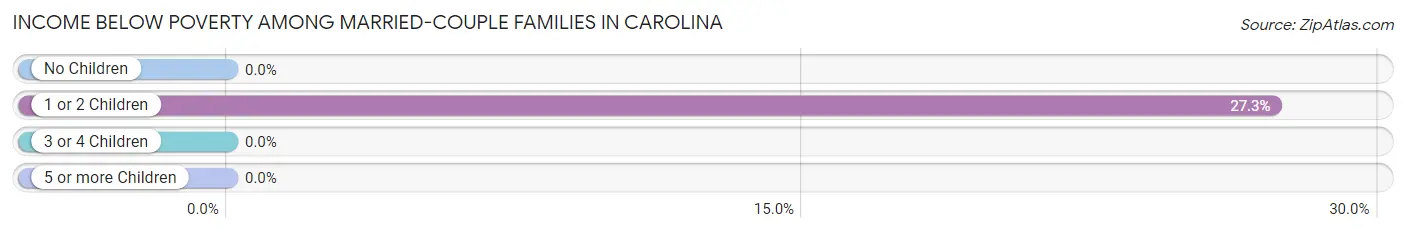
| Children | Above Poverty | Below Poverty |
| No Children | 33 (100.0%) | 0 (0.0%) |
| 1 or 2 Children | 16 (72.7%) | 6 (27.3%) |
| 3 or 4 Children | 2 (100.0%) | 0 (0.0%) |
| 5 or more Children | 0 (0.0%) | 0 (0.0%) |
| Total | 51 (89.5%) | 6 (10.5%) |
Income Below Poverty Among Single-Parent Households in Carolina
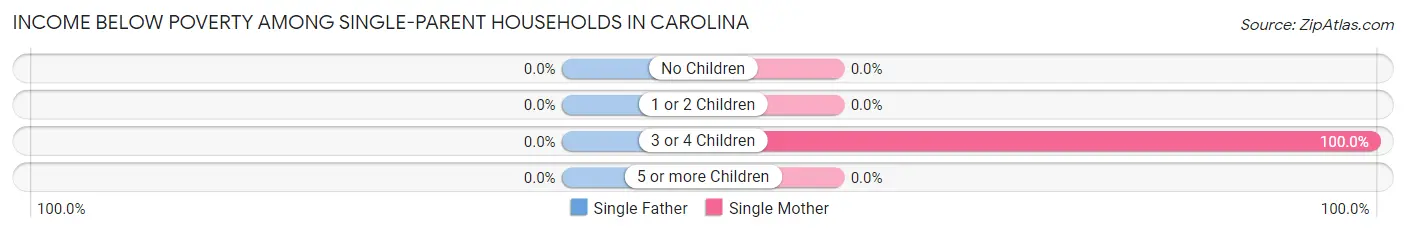
| Children | Single Father | Single Mother |
| No Children | 0 (0.0%) | 0 (0.0%) |
| 1 or 2 Children | 0 (0.0%) | 0 (0.0%) |
| 3 or 4 Children | 0 (0.0%) | 3 (100.0%) |
| 5 or more Children | 0 (0.0%) | 0 (0.0%) |
| Total | 0 (0.0%) | 3 (50.0%) |
Income Below Poverty Among Married-Couple vs Single-Parent Households in Carolina
The poverty data for Carolina shows that 6 of the married-couple family households (10.5%) and 3 of the single-parent households (25.0%) are living below the poverty level. Within the married-couple family households, those with 1 or 2 children have the highest poverty rate, with 6 households (27.3%) falling below the poverty line. Among the single-parent households, those with 3 or 4 children have the highest poverty rate, with 3 household (100.0%) living below poverty.
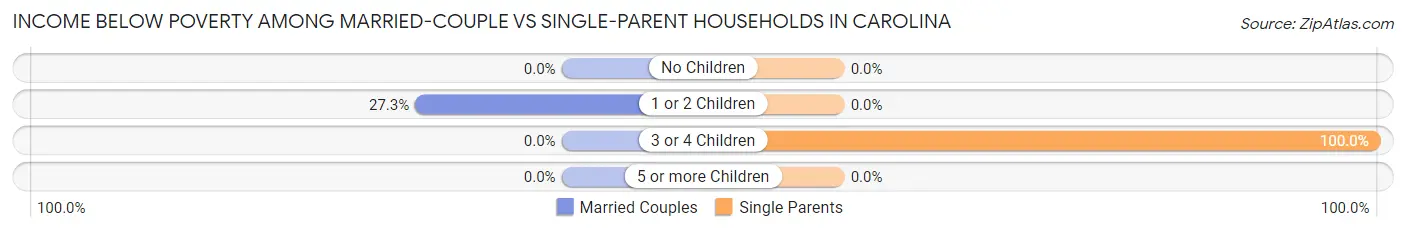
| Children | Married-Couple Families | Single-Parent Households |
| No Children | 0 (0.0%) | 0 (0.0%) |
| 1 or 2 Children | 6 (27.3%) | 0 (0.0%) |
| 3 or 4 Children | 0 (0.0%) | 3 (100.0%) |
| 5 or more Children | 0 (0.0%) | 0 (0.0%) |
| Total | 6 (10.5%) | 3 (25.0%) |
Race in Carolina
The most populous races in Carolina are White / Caucasian (233 | 83.5%), Asian (27 | 9.7%), and Two or more Races (15 | 5.4%).
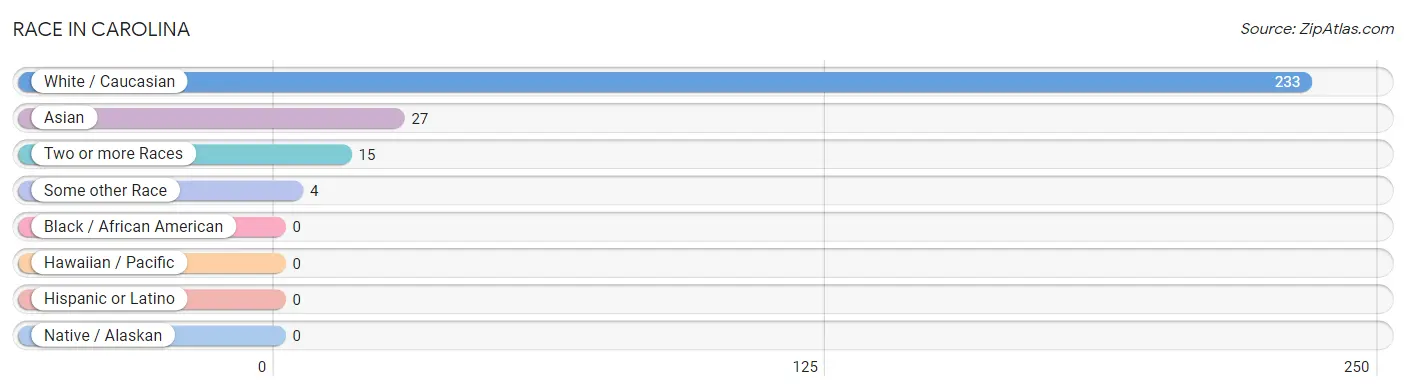
| Race | # Population | % Population |
| Asian | 27 | 9.7% |
| Black / African American | 0 | 0.0% |
| Hawaiian / Pacific | 0 | 0.0% |
| Hispanic or Latino | 0 | 0.0% |
| Native / Alaskan | 0 | 0.0% |
| White / Caucasian | 233 | 83.5% |
| Two or more Races | 15 | 5.4% |
| Some other Race | 4 | 1.4% |
| Total | 279 | 100.0% |
Ancestry in Carolina
The most populous ancestries reported in Carolina are American (51 | 18.3%), Italian (21 | 7.5%), English (14 | 5.0%), German (8 | 2.9%), and Irish (8 | 2.9%), together accounting for 36.6% of all Carolina residents.
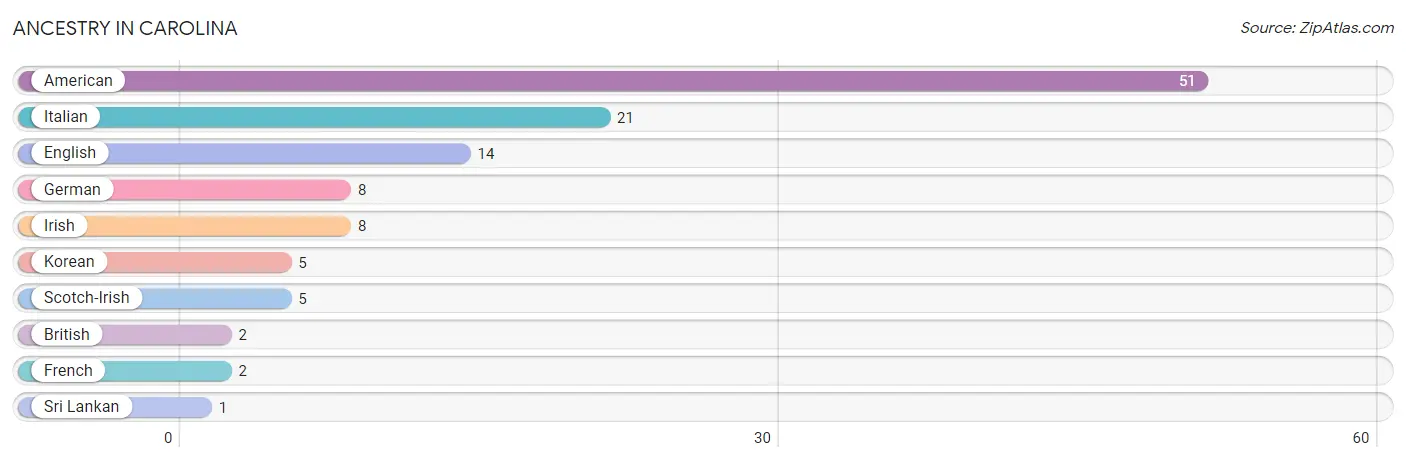
| Ancestry | # Population | % Population |
| American | 51 | 18.3% |
| British | 2 | 0.7% |
| English | 14 | 5.0% |
| French | 2 | 0.7% |
| German | 8 | 2.9% |
| Irish | 8 | 2.9% |
| Italian | 21 | 7.5% |
| Korean | 5 | 1.8% |
| Scotch-Irish | 5 | 1.8% |
| Sri Lankan | 1 | 0.4% | View All 10 Rows |
Immigrants in Carolina
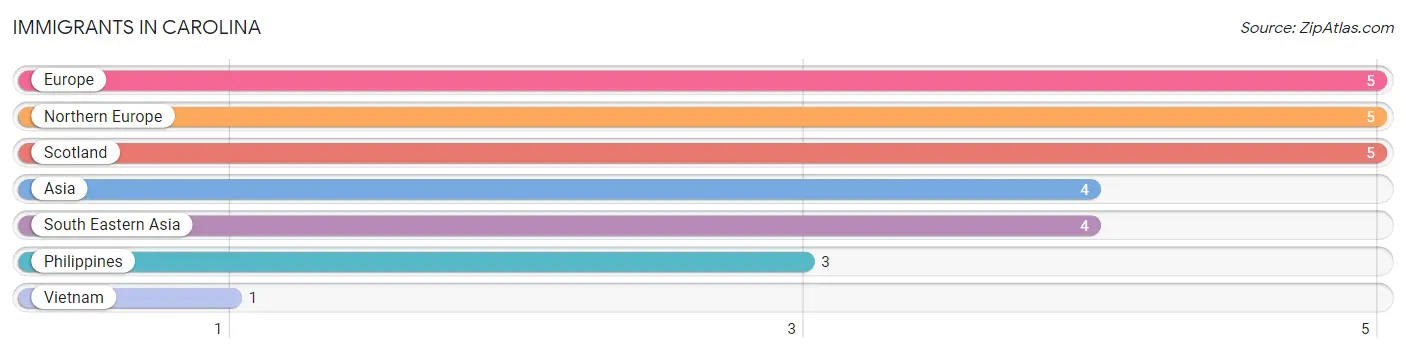
The most numerous immigrant groups reported in Carolina came from Europe (5 | 1.8%), Northern Europe (5 | 1.8%), Scotland (5 | 1.8%), Asia (4 | 1.4%), and South Eastern Asia (4 | 1.4%), together accounting for 8.2% of all Carolina residents.
| Immigration Origin | # Population | % Population |
| Asia | 4 | 1.4% |
| Europe | 5 | 1.8% |
| Northern Europe | 5 | 1.8% |
| Philippines | 3 | 1.1% |
| Scotland | 5 | 1.8% |
| South Eastern Asia | 4 | 1.4% |
| Vietnam | 1 | 0.4% | View All 7 Rows |
Sex and Age in Carolina
Sex and Age in Carolina
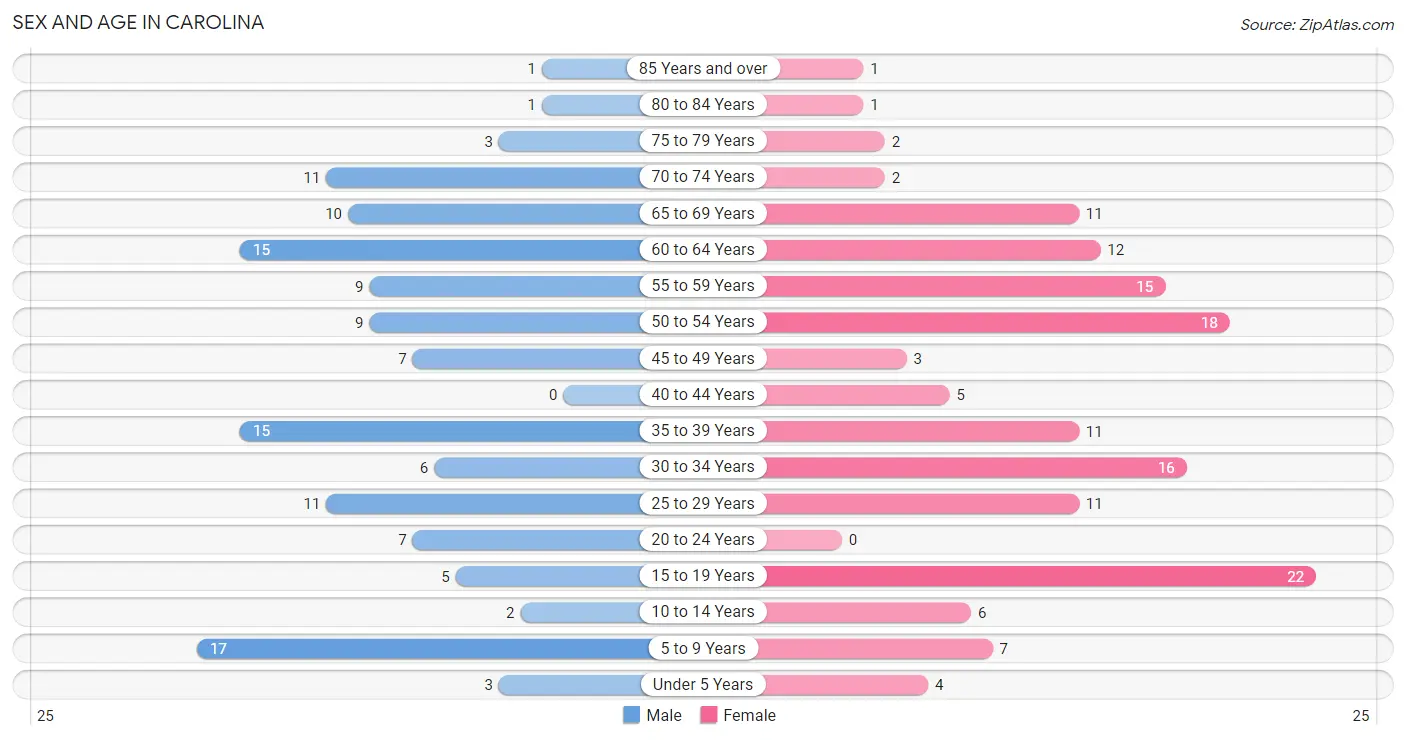
The most populous age groups in Carolina are 5 to 9 Years (17 | 12.9%) for men and 15 to 19 Years (22 | 15.0%) for women.
| Age Bracket | Male | Female |
| Under 5 Years | 3 (2.3%) | 4 (2.7%) |
| 5 to 9 Years | 17 (12.9%) | 7 (4.8%) |
| 10 to 14 Years | 2 (1.5%) | 6 (4.1%) |
| 15 to 19 Years | 5 (3.8%) | 22 (15.0%) |
| 20 to 24 Years | 7 (5.3%) | 0 (0.0%) |
| 25 to 29 Years | 11 (8.3%) | 11 (7.5%) |
| 30 to 34 Years | 6 (4.5%) | 16 (10.9%) |
| 35 to 39 Years | 15 (11.4%) | 11 (7.5%) |
| 40 to 44 Years | 0 (0.0%) | 5 (3.4%) |
| 45 to 49 Years | 7 (5.3%) | 3 (2.0%) |
| 50 to 54 Years | 9 (6.8%) | 18 (12.2%) |
| 55 to 59 Years | 9 (6.8%) | 15 (10.2%) |
| 60 to 64 Years | 15 (11.4%) | 12 (8.2%) |
| 65 to 69 Years | 10 (7.6%) | 11 (7.5%) |
| 70 to 74 Years | 11 (8.3%) | 2 (1.4%) |
| 75 to 79 Years | 3 (2.3%) | 2 (1.4%) |
| 80 to 84 Years | 1 (0.8%) | 1 (0.7%) |
| 85 Years and over | 1 (0.8%) | 1 (0.7%) |
| Total | 132 (100.0%) | 147 (100.0%) |
Families and Households in Carolina
Median Family Size in Carolina
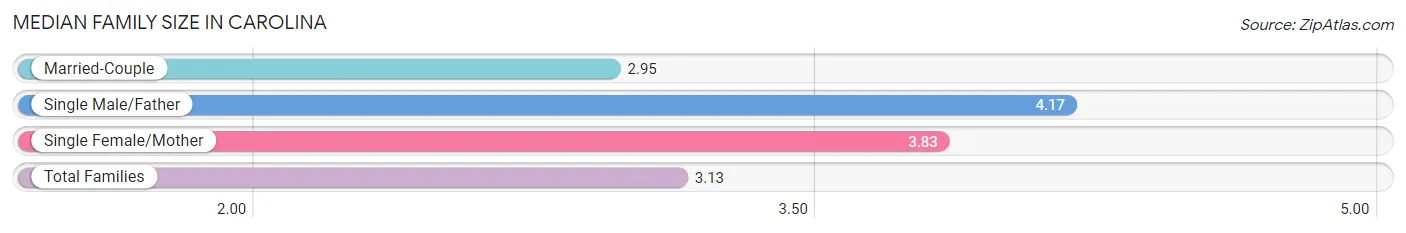
The median family size in Carolina is 3.13 persons per family, with single male/father families (6 | 8.7%) accounting for the largest median family size of 4.17 persons per family. On the other hand, married-couple families (57 | 82.6%) represent the smallest median family size with 2.95 persons per family.
| Family Type | # Families | Family Size |
| Married-Couple | 57 (82.6%) | 2.95 |
| Single Male/Father | 6 (8.7%) | 4.17 |
| Single Female/Mother | 6 (8.7%) | 3.83 |
| Total Families | 69 (100.0%) | 3.13 |
Median Household Size in Carolina
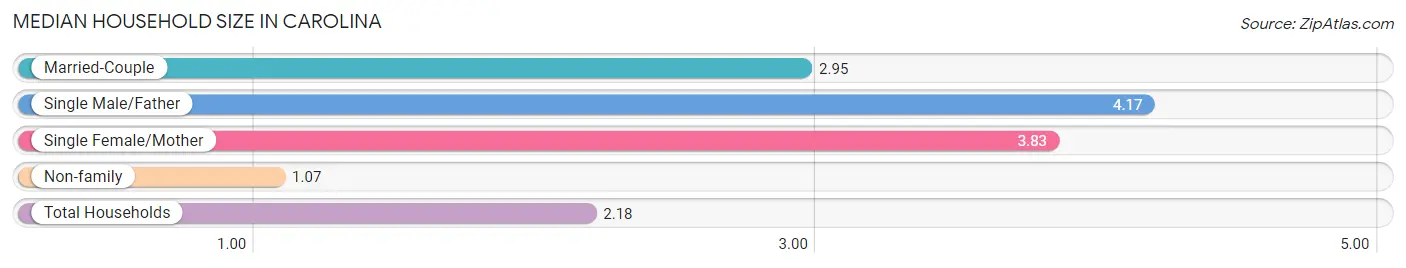
The median household size in Carolina is 2.18 persons per household, with single male/father households (6 | 4.7%) accounting for the largest median household size of 4.17 persons per household. non-family households (59 | 46.1%) represent the smallest median household size with 1.07 persons per household.
| Household Type | # Households | Household Size |
| Married-Couple | 57 (44.5%) | 2.95 |
| Single Male/Father | 6 (4.7%) | 4.17 |
| Single Female/Mother | 6 (4.7%) | 3.83 |
| Non-family | 59 (46.1%) | 1.07 |
| Total Households | 128 (100.0%) | 2.18 |
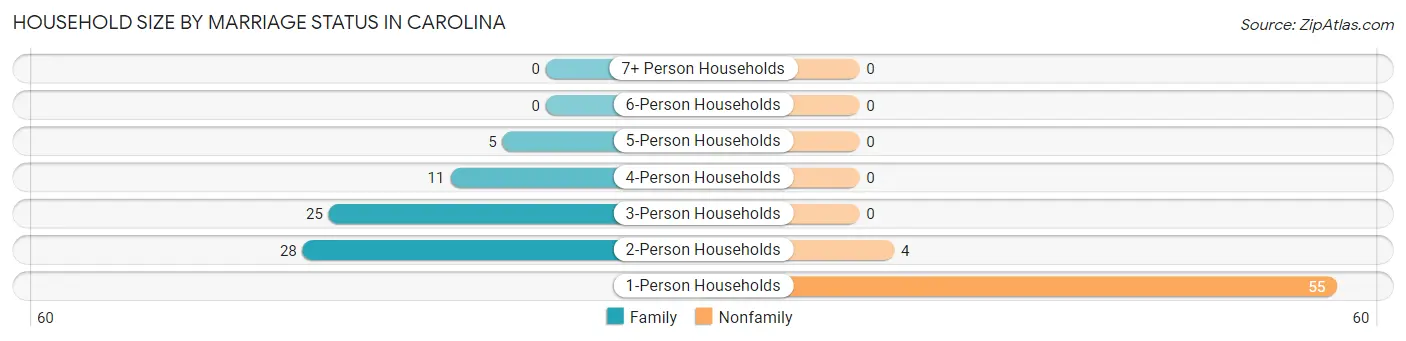
Household Size by Marriage Status in Carolina
Out of a total of 128 households in Carolina, 69 (53.9%) are family households, while 59 (46.1%) are nonfamily households. The most numerous type of family households are 2-person households, comprising 28, and the most common type of nonfamily households are 1-person households, comprising 55.
| Household Size | Family Households | Nonfamily Households |
| 1-Person Households | - | 55 (43.0%) |
| 2-Person Households | 28 (21.9%) | 4 (3.1%) |
| 3-Person Households | 25 (19.5%) | 0 (0.0%) |
| 4-Person Households | 11 (8.6%) | 0 (0.0%) |
| 5-Person Households | 5 (3.9%) | 0 (0.0%) |
| 6-Person Households | 0 (0.0%) | 0 (0.0%) |
| 7+ Person Households | 0 (0.0%) | 0 (0.0%) |
| Total | 69 (53.9%) | 59 (46.1%) |
Female Fertility in Carolina
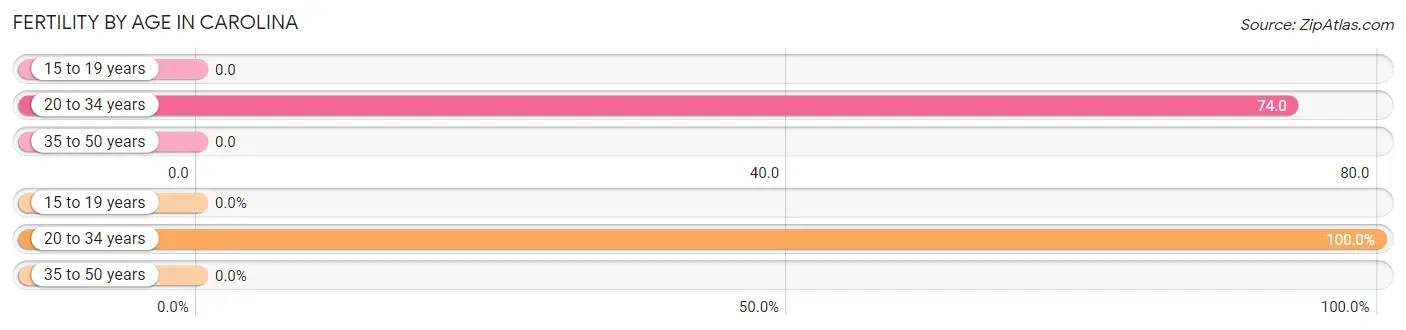
Fertility by Age in Carolina
Average fertility rate in Carolina is 29.0 births per 1,000 women. Women in the age bracket of 20 to 34 years have the highest fertility rate with 74.0 births per 1,000 women. Women in the age bracket of 20 to 34 years acount for 100.0% of all women with births.
| Age Bracket | Women with Births | Births / 1,000 Women |
| 15 to 19 years | 0 (0.0%) | 0.0 |
| 20 to 34 years | 2 (100.0%) | 74.0 |
| 35 to 50 years | 0 (0.0%) | 0.0 |
| Total | 2 (100.0%) | 29.0 |
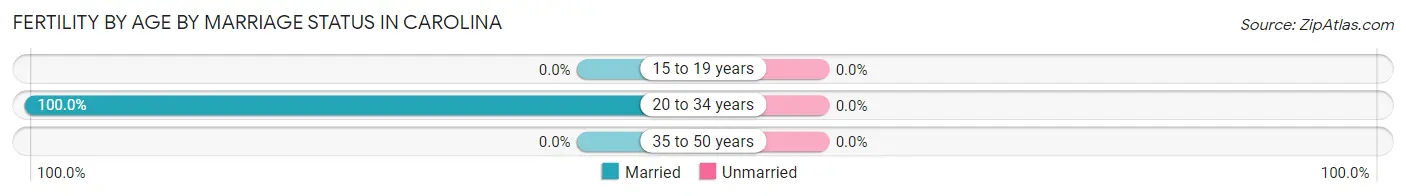
Fertility by Age by Marriage Status in Carolina
| Age Bracket | Married | Unmarried |
| 15 to 19 years | 0 (0.0%) | 0 (0.0%) |
| 20 to 34 years | 2 (100.0%) | 0 (0.0%) |
| 35 to 50 years | 0 (0.0%) | 0 (0.0%) |
| Total | 2 (100.0%) | 0 (0.0%) |
Fertility by Education in Carolina
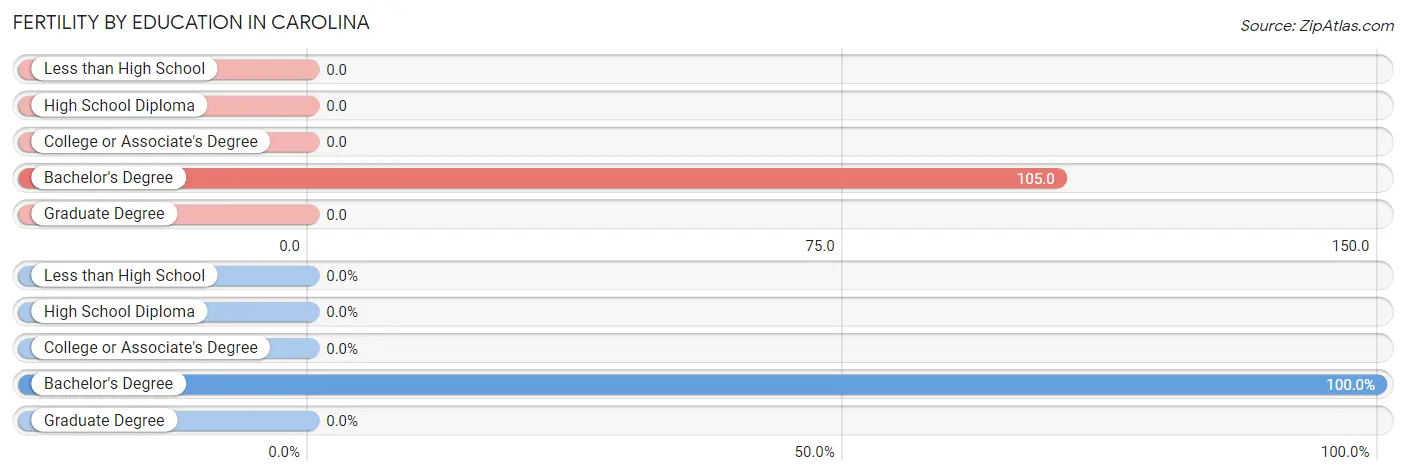
| Educational Attainment | Women with Births | Births / 1,000 Women |
| Less than High School | 0 (0.0%) | 0.0 |
| High School Diploma | 0 (0.0%) | 0.0 |
| College or Associate's Degree | 0 (0.0%) | 0.0 |
| Bachelor's Degree | 2 (100.0%) | 105.0 |
| Graduate Degree | 0 (0.0%) | 0.0 |
| Total | 2 (100.0%) | 29.0 |
Fertility by Education by Marriage Status in Carolina
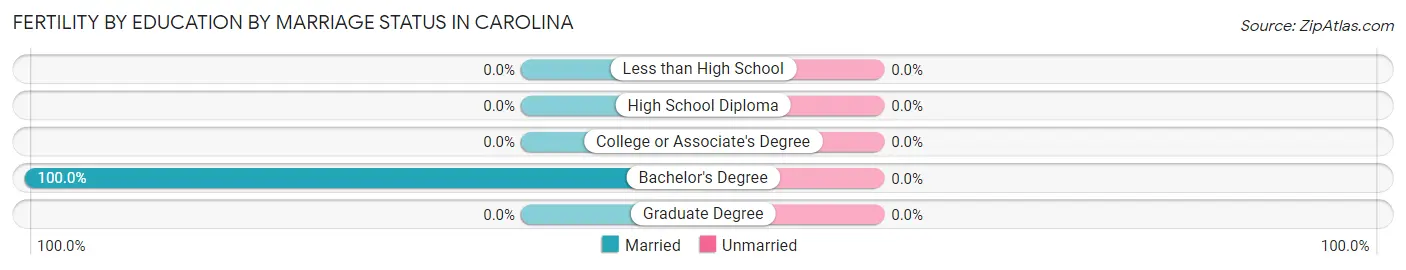
| Educational Attainment | Married | Unmarried |
| Less than High School | 0 (0.0%) | 0 (0.0%) |
| High School Diploma | 0 (0.0%) | 0 (0.0%) |
| College or Associate's Degree | 0 (0.0%) | 0 (0.0%) |
| Bachelor's Degree | 2 (100.0%) | 0 (0.0%) |
| Graduate Degree | 0 (0.0%) | 0 (0.0%) |
| Total | 2 (100.0%) | 0 (0.0%) |
Employment Characteristics in Carolina
Employment by Class of Employer in Carolina
Among the 120 employed individuals in Carolina, private company employees (75 | 62.5%), not-for-profit organizations (14 | 11.7%), and local government employees (14 | 11.7%) make up the most common classes of employment.
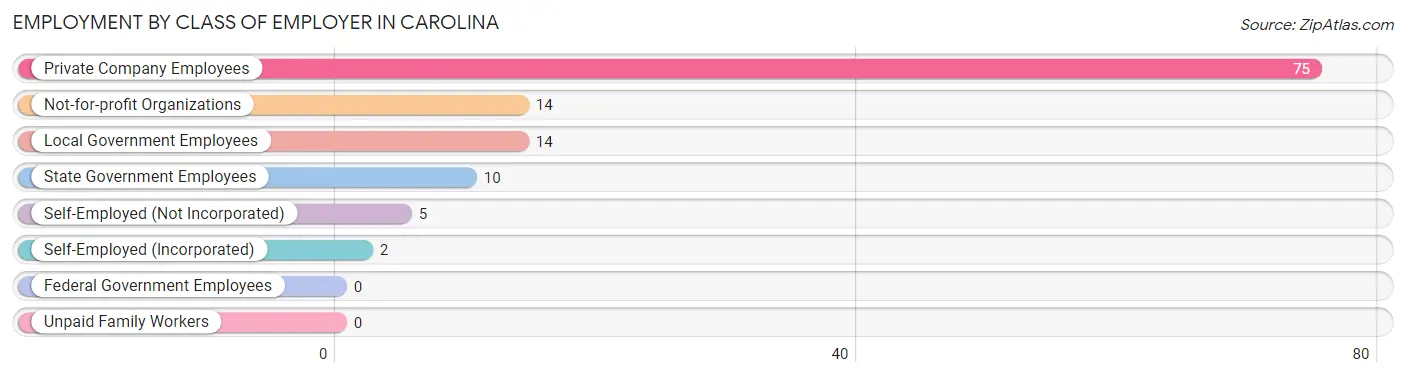
| Employer Class | # Employees | % Employees |
| Private Company Employees | 75 | 62.5% |
| Self-Employed (Incorporated) | 2 | 1.7% |
| Self-Employed (Not Incorporated) | 5 | 4.2% |
| Not-for-profit Organizations | 14 | 11.7% |
| Local Government Employees | 14 | 11.7% |
| State Government Employees | 10 | 8.3% |
| Federal Government Employees | 0 | 0.0% |
| Unpaid Family Workers | 0 | 0.0% |
| Total | 120 | 100.0% |
Employment Status by Age in Carolina
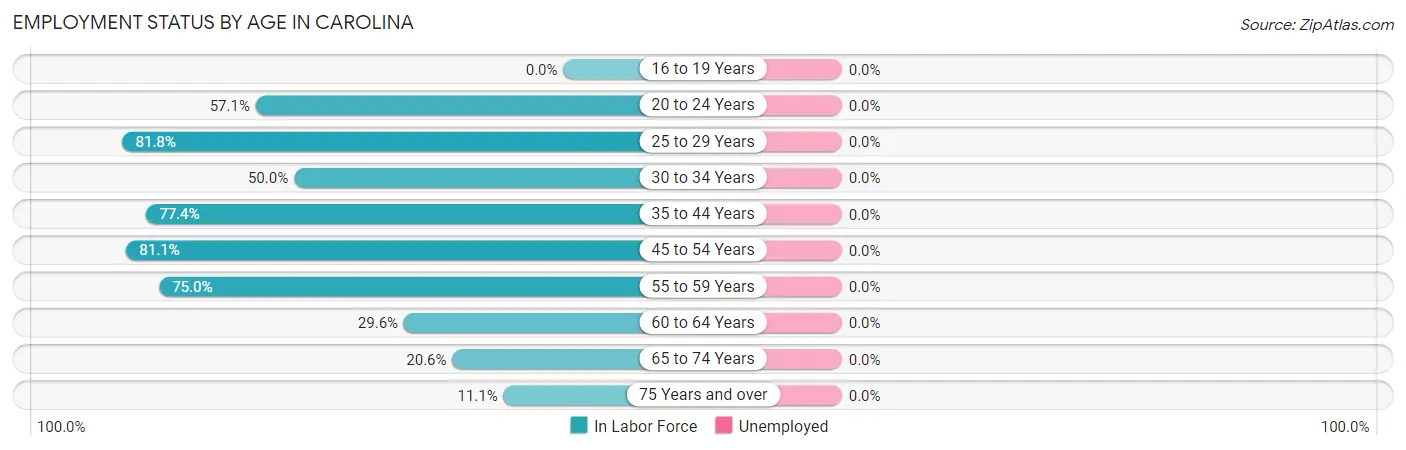
| Age Bracket | In Labor Force | Unemployed |
| 16 to 19 Years | 0 (0.0%) | 0 (0.0%) |
| 20 to 24 Years | 4 (57.1%) | 0 (0.0%) |
| 25 to 29 Years | 18 (81.8%) | 0 (0.0%) |
| 30 to 34 Years | 11 (50.0%) | 0 (0.0%) |
| 35 to 44 Years | 24 (77.4%) | 0 (0.0%) |
| 45 to 54 Years | 30 (81.1%) | 0 (0.0%) |
| 55 to 59 Years | 18 (75.0%) | 0 (0.0%) |
| 60 to 64 Years | 8 (29.6%) | 0 (0.0%) |
| 65 to 74 Years | 7 (20.6%) | 0 (0.0%) |
| 75 Years and over | 1 (11.1%) | 0 (0.0%) |
| Total | 121 (50.8%) | 0 (0.0%) |
Employment Status by Educational Attainment in Carolina
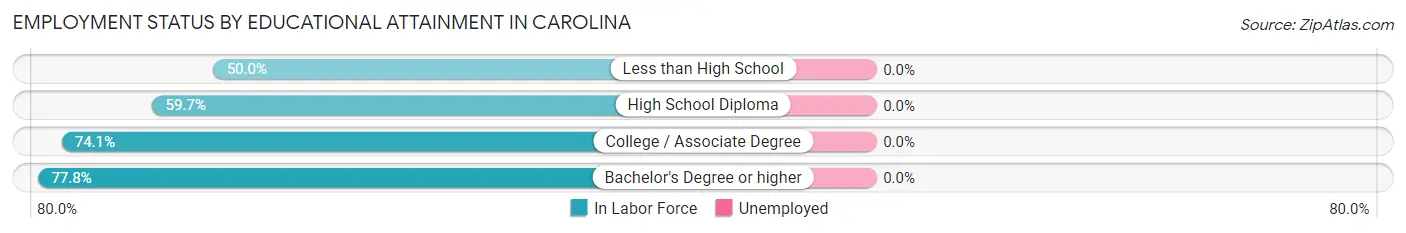
| Educational Attainment | In Labor Force | Unemployed |
| Less than High School | 8 (50.0%) | 0 (0.0%) |
| High School Diploma | 37 (59.7%) | 0 (0.0%) |
| College / Associate Degree | 43 (74.1%) | 0 (0.0%) |
| Bachelor's Degree or higher | 21 (77.8%) | 0 (0.0%) |
| Total | 109 (66.9%) | 0 (0.0%) |
Employment Occupations by Sex in Carolina
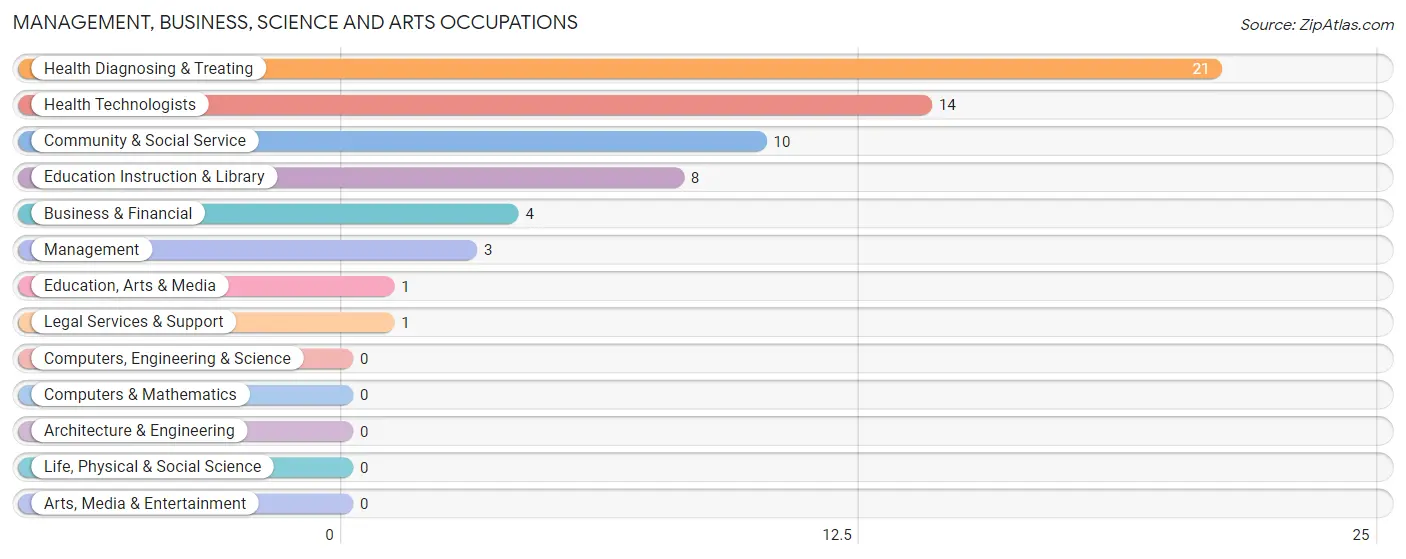
Management, Business, Science and Arts Occupations
The most common Management, Business, Science and Arts occupations in Carolina are Health Diagnosing & Treating (21 | 17.4%), Health Technologists (14 | 11.6%), Community & Social Service (10 | 8.3%), Education Instruction & Library (8 | 6.6%), and Business & Financial (4 | 3.3%).
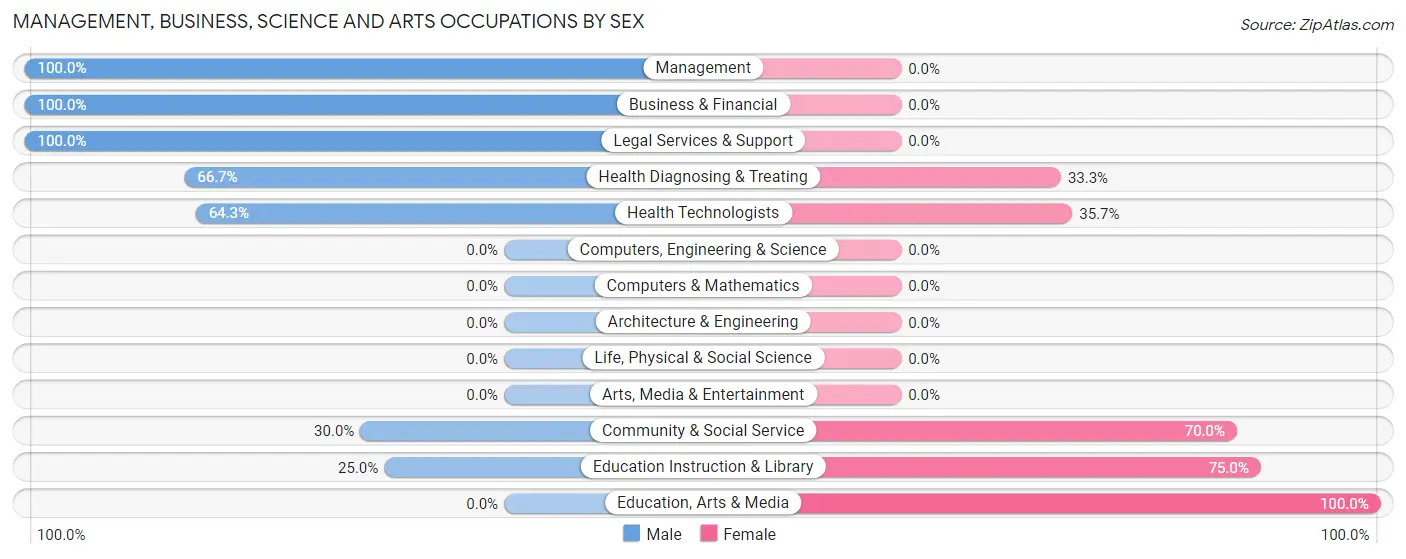
Management, Business, Science and Arts Occupations by Sex
Within the Management, Business, Science and Arts occupations in Carolina, the most male-oriented occupations are Management (100.0%), Business & Financial (100.0%), and Legal Services & Support (100.0%), while the most female-oriented occupations are Education, Arts & Media (100.0%), Education Instruction & Library (75.0%), and Community & Social Service (70.0%).
| Occupation | Male | Female |
| Management | 3 (100.0%) | 0 (0.0%) |
| Business & Financial | 4 (100.0%) | 0 (0.0%) |
| Computers, Engineering & Science | 0 (0.0%) | 0 (0.0%) |
| Computers & Mathematics | 0 (0.0%) | 0 (0.0%) |
| Architecture & Engineering | 0 (0.0%) | 0 (0.0%) |
| Life, Physical & Social Science | 0 (0.0%) | 0 (0.0%) |
| Community & Social Service | 3 (30.0%) | 7 (70.0%) |
| Education, Arts & Media | 0 (0.0%) | 1 (100.0%) |
| Legal Services & Support | 1 (100.0%) | 0 (0.0%) |
| Education Instruction & Library | 2 (25.0%) | 6 (75.0%) |
| Arts, Media & Entertainment | 0 (0.0%) | 0 (0.0%) |
| Health Diagnosing & Treating | 14 (66.7%) | 7 (33.3%) |
| Health Technologists | 9 (64.3%) | 5 (35.7%) |
| Total (Category) | 24 (63.2%) | 14 (36.8%) |
| Total (Overall) | 74 (61.2%) | 47 (38.8%) |
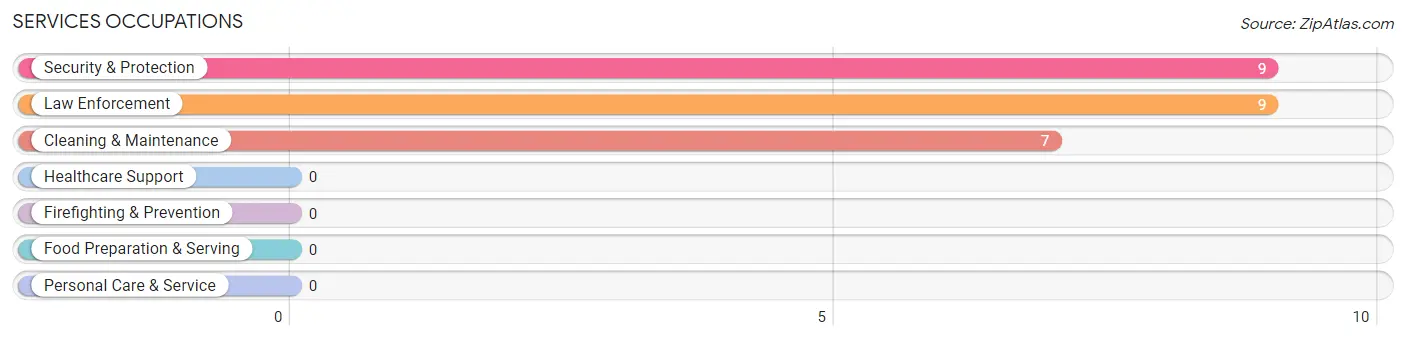
Services Occupations
The most common Services occupations in Carolina are Security & Protection (9 | 7.4%), Law Enforcement (9 | 7.4%), and Cleaning & Maintenance (7 | 5.8%).
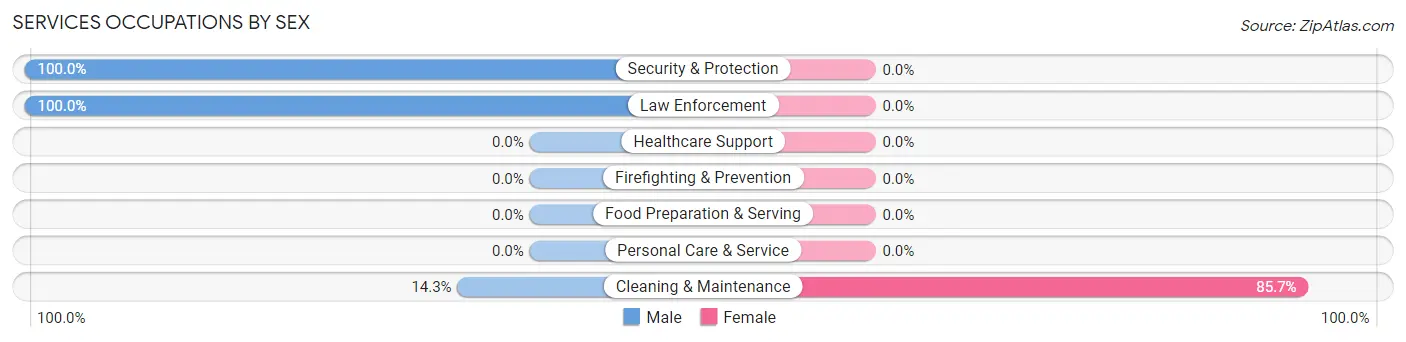
Services Occupations by Sex
| Occupation | Male | Female |
| Healthcare Support | 0 (0.0%) | 0 (0.0%) |
| Security & Protection | 9 (100.0%) | 0 (0.0%) |
| Firefighting & Prevention | 0 (0.0%) | 0 (0.0%) |
| Law Enforcement | 9 (100.0%) | 0 (0.0%) |
| Food Preparation & Serving | 0 (0.0%) | 0 (0.0%) |
| Cleaning & Maintenance | 1 (14.3%) | 6 (85.7%) |
| Personal Care & Service | 0 (0.0%) | 0 (0.0%) |
| Total (Category) | 10 (62.5%) | 6 (37.5%) |
| Total (Overall) | 74 (61.2%) | 47 (38.8%) |
Sales and Office Occupations
The most common Sales and Office occupations in Carolina are Office & Administration (16 | 13.2%), and Sales & Related (2 | 1.7%).
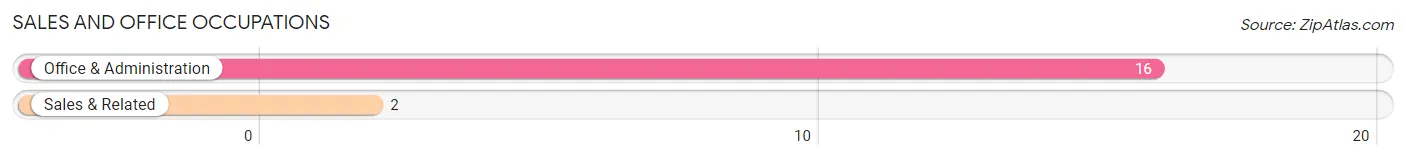
Sales and Office Occupations by Sex

| Occupation | Male | Female |
| Sales & Related | 2 (100.0%) | 0 (0.0%) |
| Office & Administration | 0 (0.0%) | 16 (100.0%) |
| Total (Category) | 2 (11.1%) | 16 (88.9%) |
| Total (Overall) | 74 (61.2%) | 47 (38.8%) |
Natural Resources, Construction and Maintenance Occupations
The most common Natural Resources, Construction and Maintenance occupations in Carolina are , and Installation, Maintenance & Repair (2 | 1.7%).
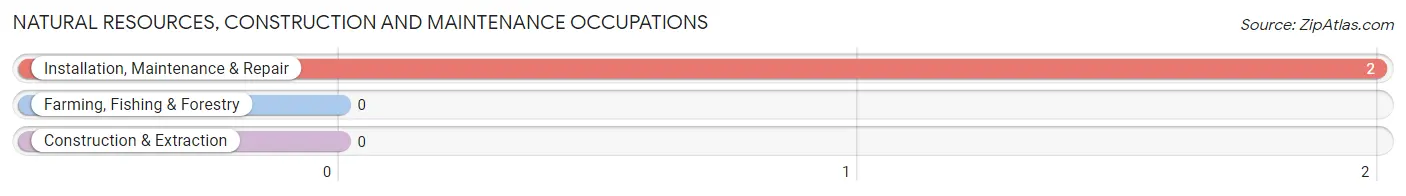
Natural Resources, Construction and Maintenance Occupations by Sex
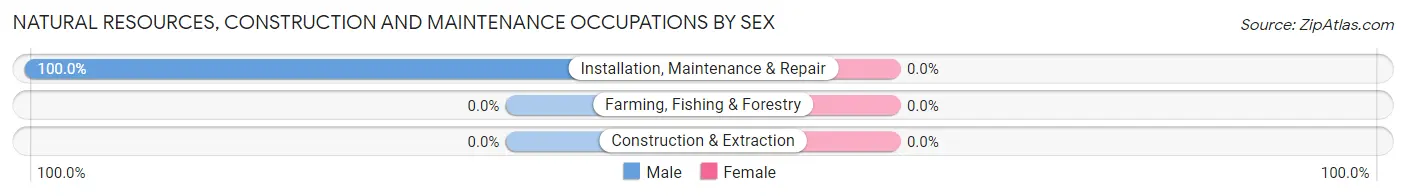
| Occupation | Male | Female |
| Farming, Fishing & Forestry | 0 (0.0%) | 0 (0.0%) |
| Construction & Extraction | 0 (0.0%) | 0 (0.0%) |
| Installation, Maintenance & Repair | 2 (100.0%) | 0 (0.0%) |
| Total (Category) | 2 (100.0%) | 0 (0.0%) |
| Total (Overall) | 74 (61.2%) | 47 (38.8%) |
Production, Transportation and Moving Occupations
The most common Production, Transportation and Moving occupations in Carolina are Production (33 | 27.3%), Transportation (8 | 6.6%), and Material Moving (6 | 5.0%).
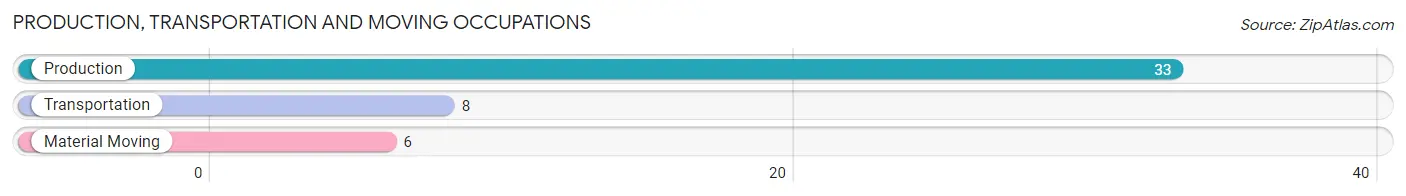
Production, Transportation and Moving Occupations by Sex
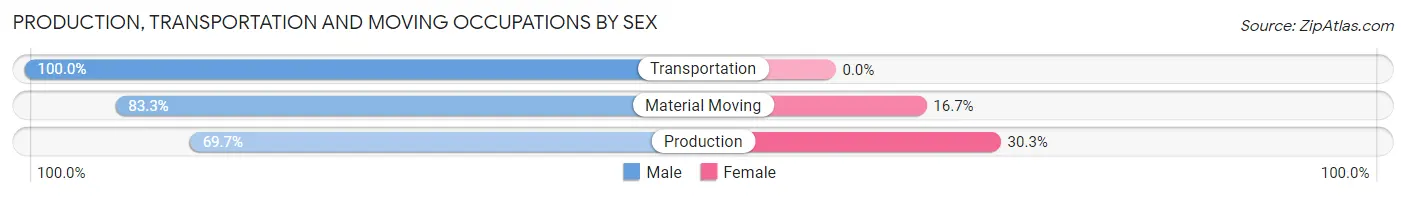
| Occupation | Male | Female |
| Production | 23 (69.7%) | 10 (30.3%) |
| Transportation | 8 (100.0%) | 0 (0.0%) |
| Material Moving | 5 (83.3%) | 1 (16.7%) |
| Total (Category) | 36 (76.6%) | 11 (23.4%) |
| Total (Overall) | 74 (61.2%) | 47 (38.8%) |
Employment Industries by Sex in Carolina
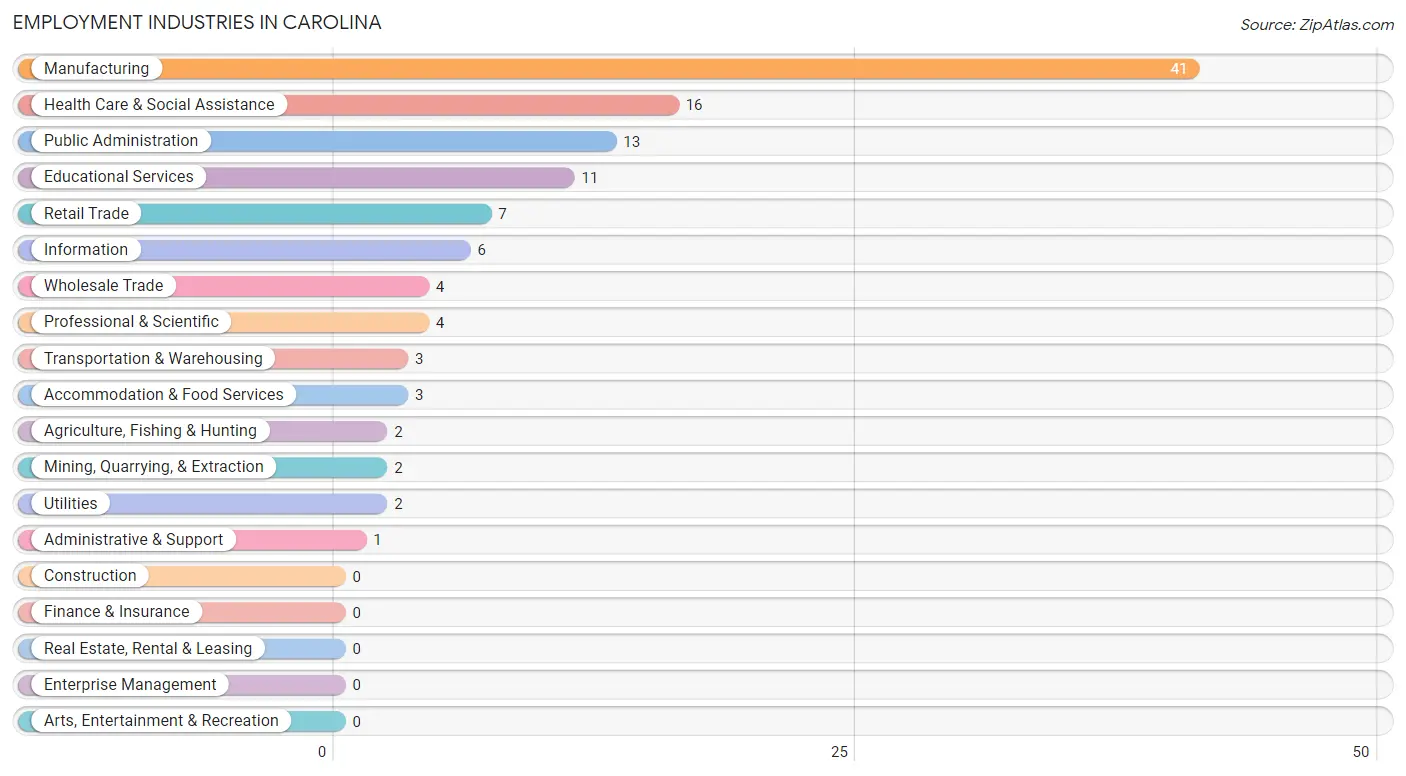
Employment Industries in Carolina
The major employment industries in Carolina include Manufacturing (41 | 33.9%), Health Care & Social Assistance (16 | 13.2%), Public Administration (13 | 10.7%), Educational Services (11 | 9.1%), and Retail Trade (7 | 5.8%).
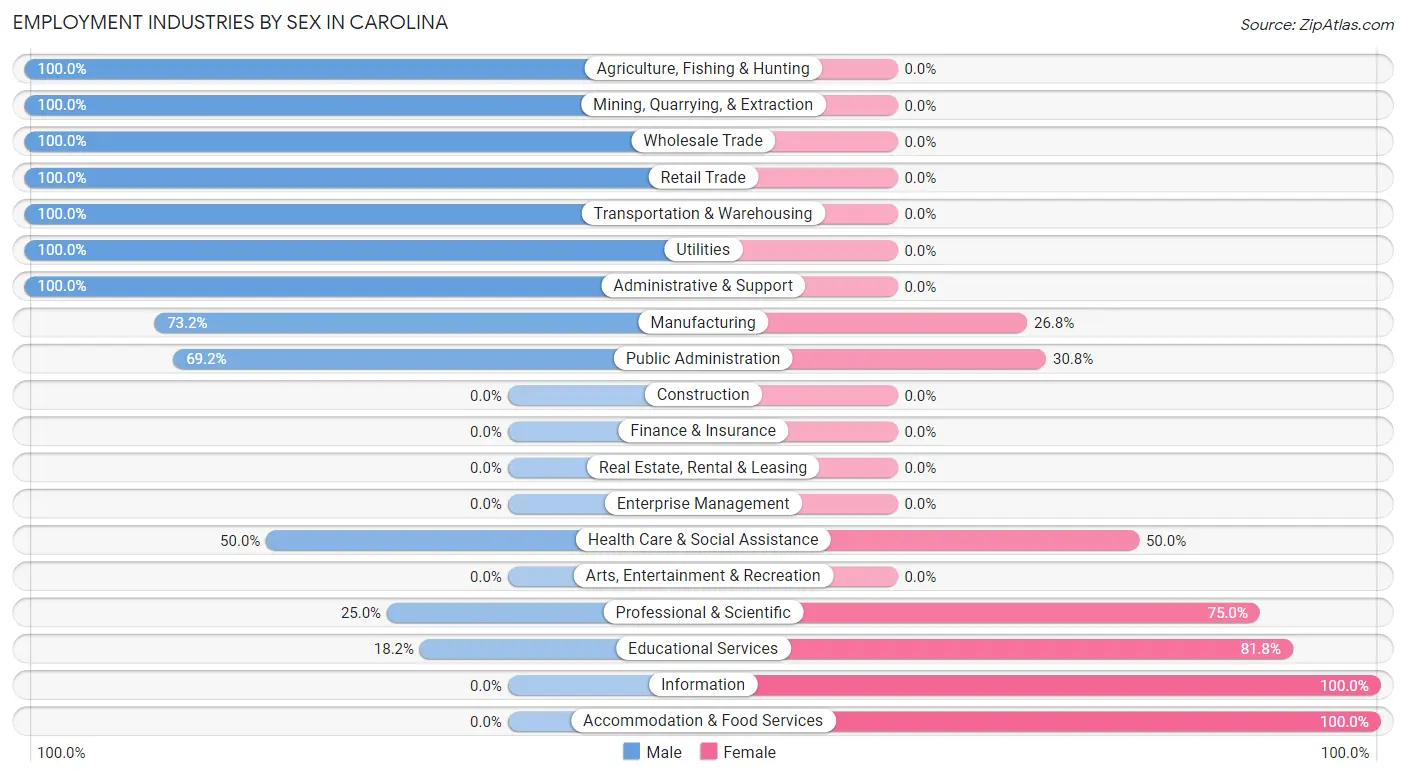
Employment Industries by Sex in Carolina
The Carolina industries that see more men than women are Agriculture, Fishing & Hunting (100.0%), Mining, Quarrying, & Extraction (100.0%), and Wholesale Trade (100.0%), whereas the industries that tend to have a higher number of women are Information (100.0%), Accommodation & Food Services (100.0%), and Educational Services (81.8%).
| Industry | Male | Female |
| Agriculture, Fishing & Hunting | 2 (100.0%) | 0 (0.0%) |
| Mining, Quarrying, & Extraction | 2 (100.0%) | 0 (0.0%) |
| Construction | 0 (0.0%) | 0 (0.0%) |
| Manufacturing | 30 (73.2%) | 11 (26.8%) |
| Wholesale Trade | 4 (100.0%) | 0 (0.0%) |
| Retail Trade | 7 (100.0%) | 0 (0.0%) |
| Transportation & Warehousing | 3 (100.0%) | 0 (0.0%) |
| Utilities | 2 (100.0%) | 0 (0.0%) |
| Information | 0 (0.0%) | 6 (100.0%) |
| Finance & Insurance | 0 (0.0%) | 0 (0.0%) |
| Real Estate, Rental & Leasing | 0 (0.0%) | 0 (0.0%) |
| Professional & Scientific | 1 (25.0%) | 3 (75.0%) |
| Enterprise Management | 0 (0.0%) | 0 (0.0%) |
| Administrative & Support | 1 (100.0%) | 0 (0.0%) |
| Educational Services | 2 (18.2%) | 9 (81.8%) |
| Health Care & Social Assistance | 8 (50.0%) | 8 (50.0%) |
| Arts, Entertainment & Recreation | 0 (0.0%) | 0 (0.0%) |
| Accommodation & Food Services | 0 (0.0%) | 3 (100.0%) |
| Public Administration | 9 (69.2%) | 4 (30.8%) |
| Total | 74 (61.2%) | 47 (38.8%) |
Education in Carolina
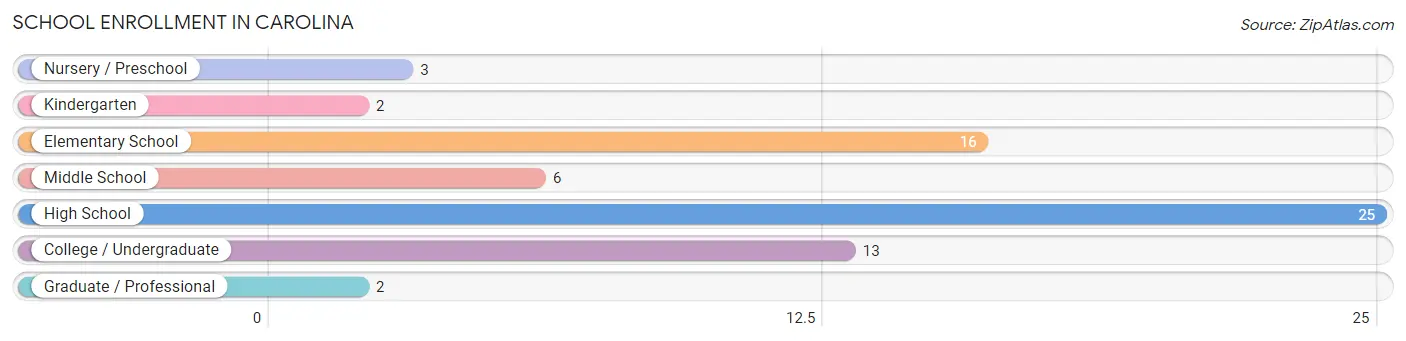
School Enrollment in Carolina
The most common levels of schooling among the 67 students in Carolina are high school (25 | 37.3%), elementary school (16 | 23.9%), and college / undergraduate (13 | 19.4%).
| School Level | # Students | % Students |
| Nursery / Preschool | 3 | 4.5% |
| Kindergarten | 2 | 3.0% |
| Elementary School | 16 | 23.9% |
| Middle School | 6 | 9.0% |
| High School | 25 | 37.3% |
| College / Undergraduate | 13 | 19.4% |
| Graduate / Professional | 2 | 3.0% |
| Total | 67 | 100.0% |
School Enrollment by Age by Funding Source in Carolina
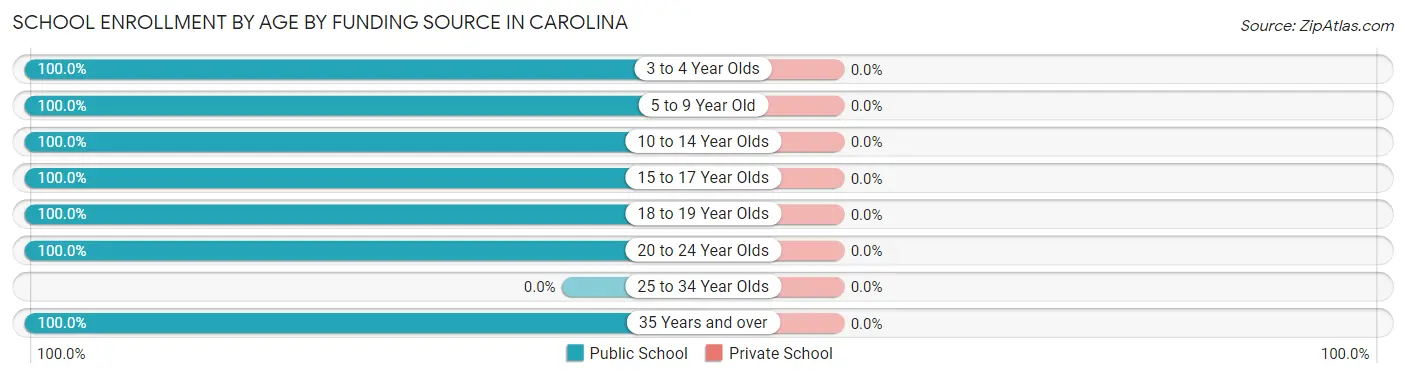
| Age Bracket | Public School | Private School |
| 3 to 4 Year Olds | 3 (100.0%) | 0 (0.0%) |
| 5 to 9 Year Old | 18 (100.0%) | 0 (0.0%) |
| 10 to 14 Year Olds | 8 (100.0%) | 0 (0.0%) |
| 15 to 17 Year Olds | 4 (100.0%) | 0 (0.0%) |
| 18 to 19 Year Olds | 23 (100.0%) | 0 (0.0%) |
| 20 to 24 Year Olds | 7 (100.0%) | 0 (0.0%) |
| 25 to 34 Year Olds | 0 (0.0%) | 0 (0.0%) |
| 35 Years and over | 4 (100.0%) | 0 (0.0%) |
| Total | 67 (100.0%) | 0 (0.0%) |
Educational Attainment by Field of Study in Carolina
Education (17 | 40.5%), business (8 | 19.1%), science & technology (5 | 11.9%), psychology (3 | 7.1%), and social sciences (3 | 7.1%) are the most common fields of study among 42 individuals in Carolina who have obtained a bachelor's degree or higher.
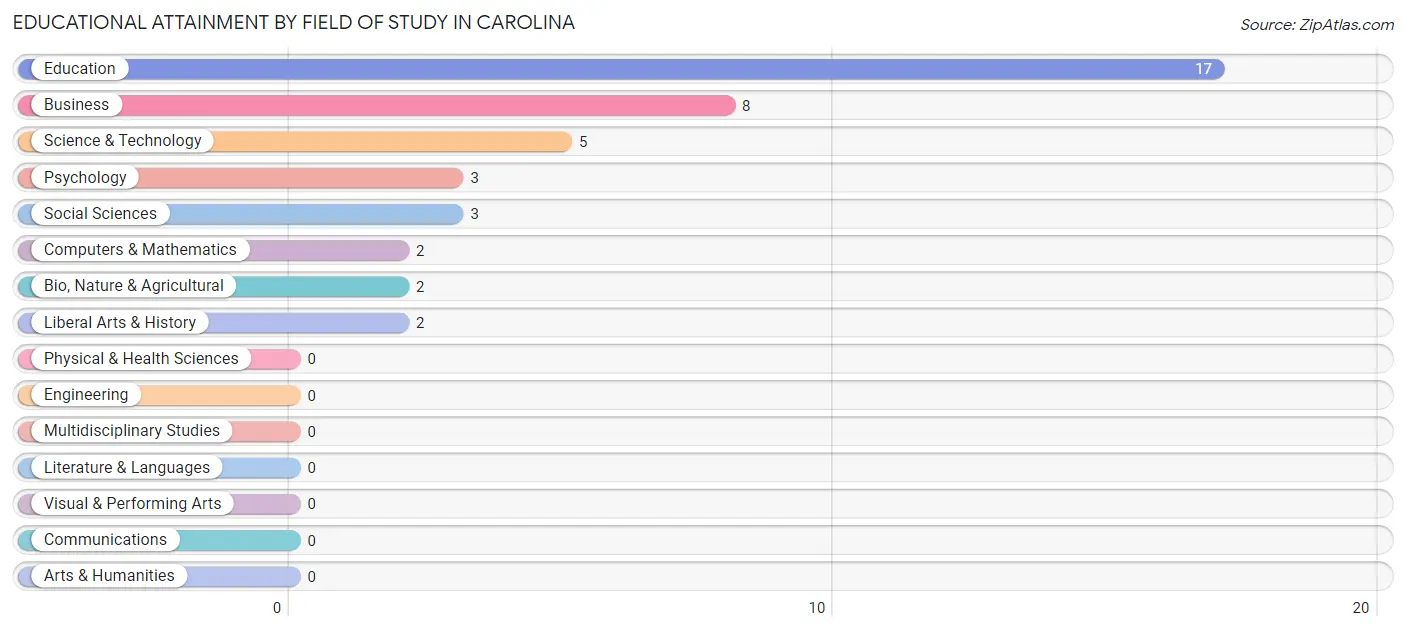
| Field of Study | # Graduates | % Graduates |
| Computers & Mathematics | 2 | 4.8% |
| Bio, Nature & Agricultural | 2 | 4.8% |
| Physical & Health Sciences | 0 | 0.0% |
| Psychology | 3 | 7.1% |
| Social Sciences | 3 | 7.1% |
| Engineering | 0 | 0.0% |
| Multidisciplinary Studies | 0 | 0.0% |
| Science & Technology | 5 | 11.9% |
| Business | 8 | 19.1% |
| Education | 17 | 40.5% |
| Literature & Languages | 0 | 0.0% |
| Liberal Arts & History | 2 | 4.8% |
| Visual & Performing Arts | 0 | 0.0% |
| Communications | 0 | 0.0% |
| Arts & Humanities | 0 | 0.0% |
| Total | 42 | 100.0% |
Transportation & Commute in Carolina
Vehicle Availability by Sex in Carolina
The most prevalent vehicle ownership categories in Carolina are males with 2 vehicles (44, accounting for 60.3%) and females with 2 vehicles (31, making up 93.6%).
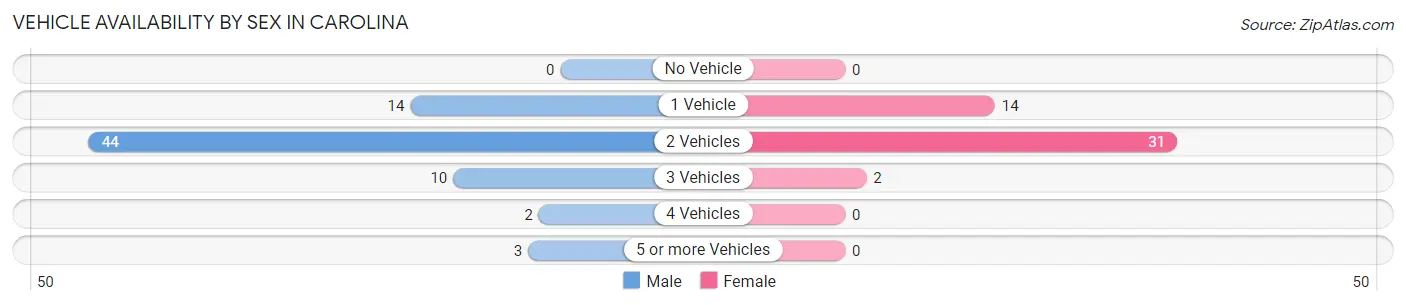
| Vehicles Available | Male | Female |
| No Vehicle | 0 (0.0%) | 0 (0.0%) |
| 1 Vehicle | 14 (19.2%) | 14 (29.8%) |
| 2 Vehicles | 44 (60.3%) | 31 (66.0%) |
| 3 Vehicles | 10 (13.7%) | 2 (4.3%) |
| 4 Vehicles | 2 (2.7%) | 0 (0.0%) |
| 5 or more Vehicles | 3 (4.1%) | 0 (0.0%) |
| Total | 73 (100.0%) | 47 (100.0%) |
Commute Time in Carolina
The most frequently occuring commute durations in Carolina are 15 to 19 minutes (44 commuters, 36.7%), 30 to 34 minutes (28 commuters, 23.3%), and 5 to 9 minutes (12 commuters, 10.0%).
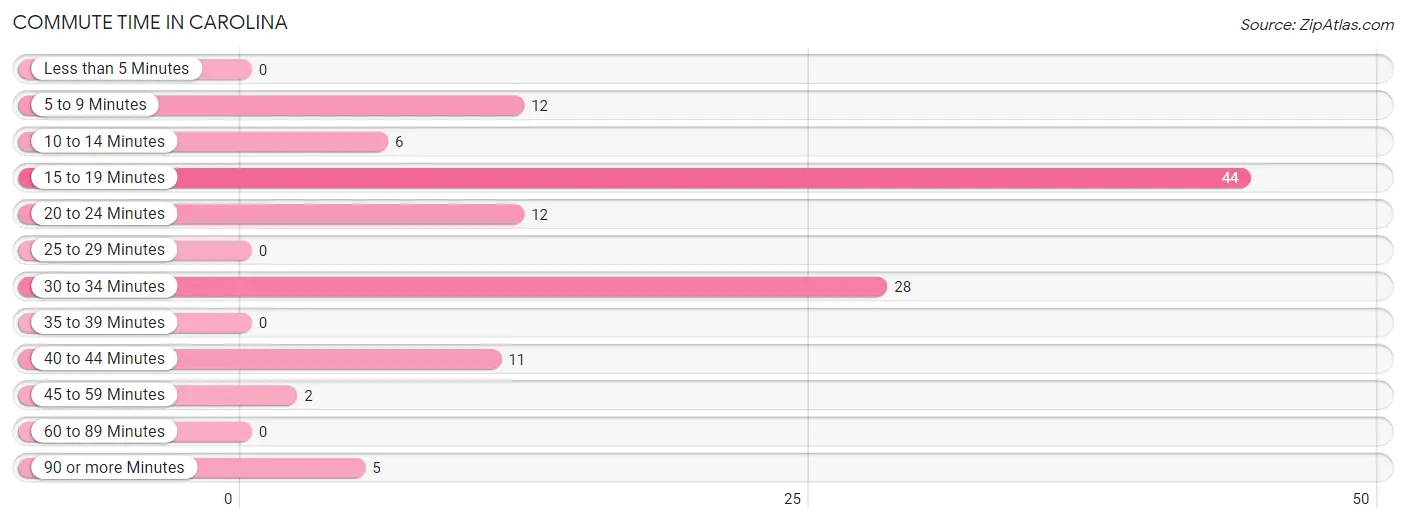
| Commute Time | # Commuters | % Commuters |
| Less than 5 Minutes | 0 | 0.0% |
| 5 to 9 Minutes | 12 | 10.0% |
| 10 to 14 Minutes | 6 | 5.0% |
| 15 to 19 Minutes | 44 | 36.7% |
| 20 to 24 Minutes | 12 | 10.0% |
| 25 to 29 Minutes | 0 | 0.0% |
| 30 to 34 Minutes | 28 | 23.3% |
| 35 to 39 Minutes | 0 | 0.0% |
| 40 to 44 Minutes | 11 | 9.2% |
| 45 to 59 Minutes | 2 | 1.7% |
| 60 to 89 Minutes | 0 | 0.0% |
| 90 or more Minutes | 5 | 4.2% |
Commute Time by Sex in Carolina
The most common commute times in Carolina are 15 to 19 minutes (35 commuters, 47.9%) for males and 30 to 34 minutes (13 commuters, 27.7%) for females.
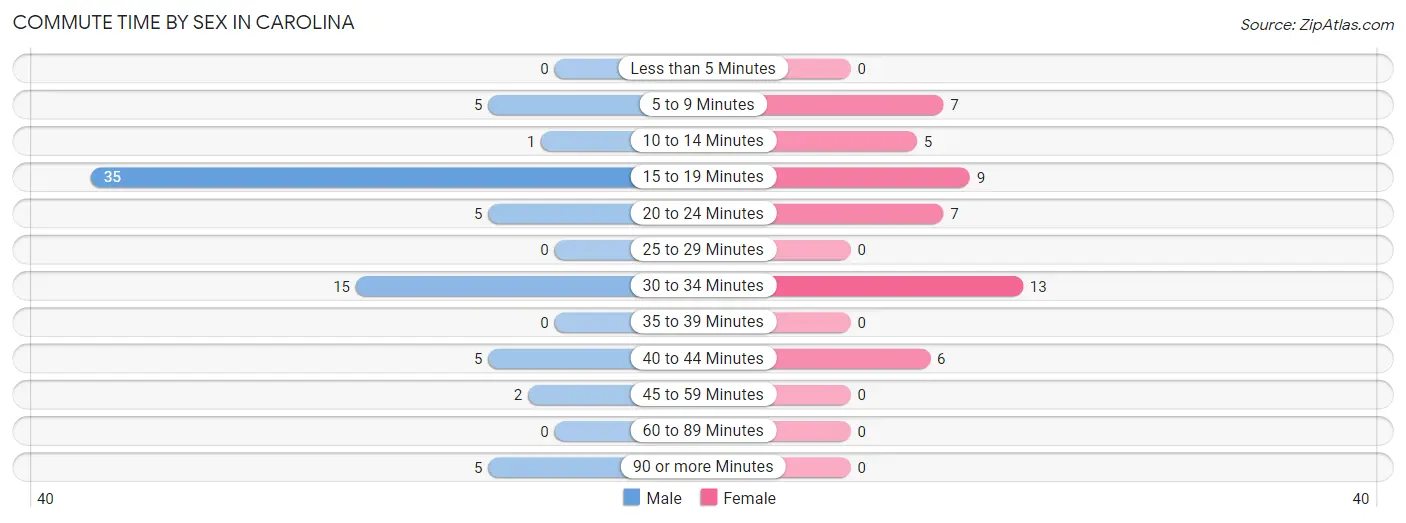
| Commute Time | Male | Female |
| Less than 5 Minutes | 0 (0.0%) | 0 (0.0%) |
| 5 to 9 Minutes | 5 (6.9%) | 7 (14.9%) |
| 10 to 14 Minutes | 1 (1.4%) | 5 (10.6%) |
| 15 to 19 Minutes | 35 (47.9%) | 9 (19.2%) |
| 20 to 24 Minutes | 5 (6.9%) | 7 (14.9%) |
| 25 to 29 Minutes | 0 (0.0%) | 0 (0.0%) |
| 30 to 34 Minutes | 15 (20.5%) | 13 (27.7%) |
| 35 to 39 Minutes | 0 (0.0%) | 0 (0.0%) |
| 40 to 44 Minutes | 5 (6.9%) | 6 (12.8%) |
| 45 to 59 Minutes | 2 (2.7%) | 0 (0.0%) |
| 60 to 89 Minutes | 0 (0.0%) | 0 (0.0%) |
| 90 or more Minutes | 5 (6.9%) | 0 (0.0%) |
Time of Departure to Work by Sex in Carolina
The most frequent times of departure to work in Carolina are 7:00 AM to 7:29 AM (23, 31.5%) for males and 5:00 AM to 5:29 AM (11, 23.4%) for females.
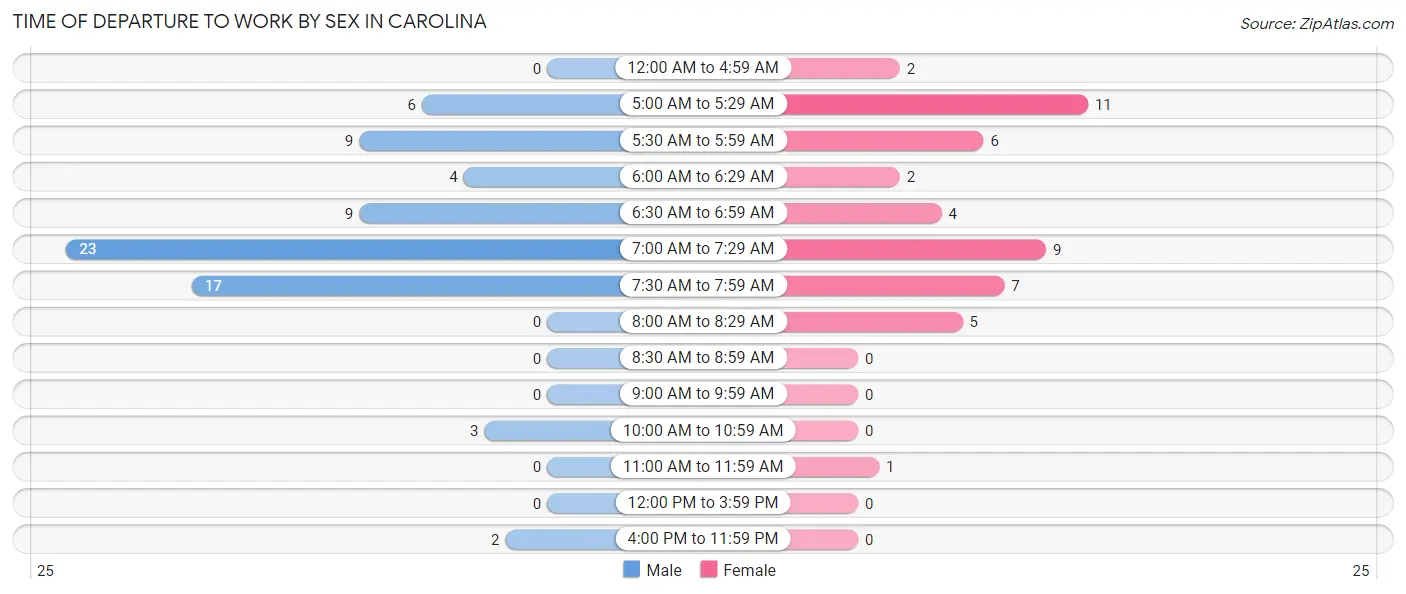
| Time of Departure | Male | Female |
| 12:00 AM to 4:59 AM | 0 (0.0%) | 2 (4.3%) |
| 5:00 AM to 5:29 AM | 6 (8.2%) | 11 (23.4%) |
| 5:30 AM to 5:59 AM | 9 (12.3%) | 6 (12.8%) |
| 6:00 AM to 6:29 AM | 4 (5.5%) | 2 (4.3%) |
| 6:30 AM to 6:59 AM | 9 (12.3%) | 4 (8.5%) |
| 7:00 AM to 7:29 AM | 23 (31.5%) | 9 (19.2%) |
| 7:30 AM to 7:59 AM | 17 (23.3%) | 7 (14.9%) |
| 8:00 AM to 8:29 AM | 0 (0.0%) | 5 (10.6%) |
| 8:30 AM to 8:59 AM | 0 (0.0%) | 0 (0.0%) |
| 9:00 AM to 9:59 AM | 0 (0.0%) | 0 (0.0%) |
| 10:00 AM to 10:59 AM | 3 (4.1%) | 0 (0.0%) |
| 11:00 AM to 11:59 AM | 0 (0.0%) | 1 (2.1%) |
| 12:00 PM to 3:59 PM | 0 (0.0%) | 0 (0.0%) |
| 4:00 PM to 11:59 PM | 2 (2.7%) | 0 (0.0%) |
| Total | 73 (100.0%) | 47 (100.0%) |
Housing Occupancy in Carolina
Occupancy by Ownership in Carolina
Of the total 128 dwellings in Carolina, owner-occupied units account for 93 (72.7%), while renter-occupied units make up 35 (27.3%).
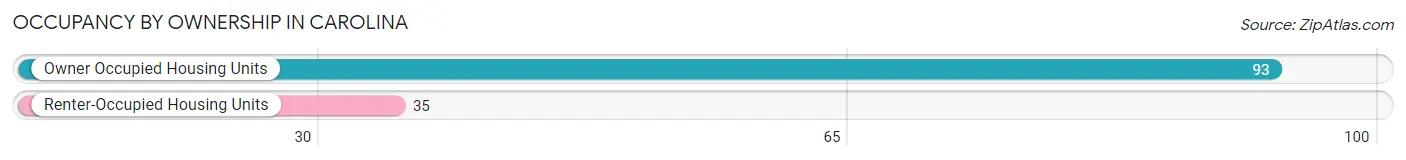
| Occupancy | # Housing Units | % Housing Units |
| Owner Occupied Housing Units | 93 | 72.7% |
| Renter-Occupied Housing Units | 35 | 27.3% |
| Total Occupied Housing Units | 128 | 100.0% |
Occupancy by Household Size in Carolina
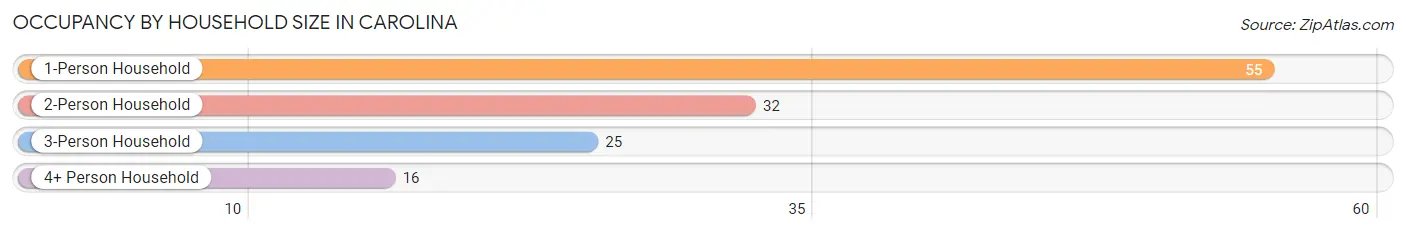
| Household Size | # Housing Units | % Housing Units |
| 1-Person Household | 55 | 43.0% |
| 2-Person Household | 32 | 25.0% |
| 3-Person Household | 25 | 19.5% |
| 4+ Person Household | 16 | 12.5% |
| Total Housing Units | 128 | 100.0% |
Occupancy by Ownership by Household Size in Carolina
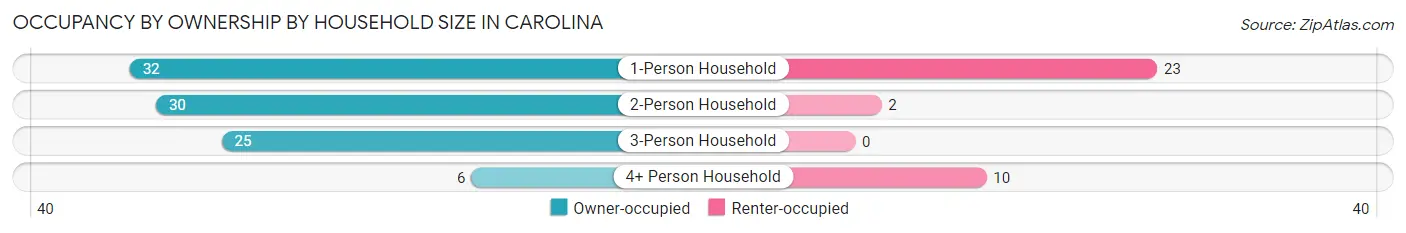
| Household Size | Owner-occupied | Renter-occupied |
| 1-Person Household | 32 (58.2%) | 23 (41.8%) |
| 2-Person Household | 30 (93.8%) | 2 (6.2%) |
| 3-Person Household | 25 (100.0%) | 0 (0.0%) |
| 4+ Person Household | 6 (37.5%) | 10 (62.5%) |
| Total Housing Units | 93 (72.7%) | 35 (27.3%) |
Occupancy by Educational Attainment in Carolina
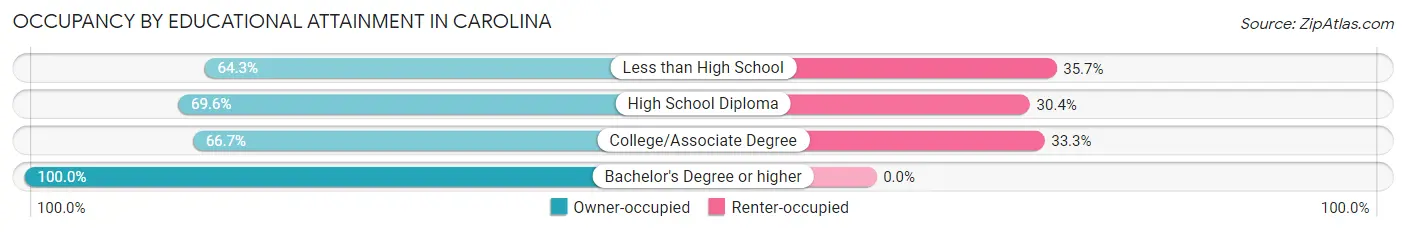
| Household Size | Owner-occupied | Renter-occupied |
| Less than High School | 9 (64.3%) | 5 (35.7%) |
| High School Diploma | 32 (69.6%) | 14 (30.4%) |
| College/Associate Degree | 32 (66.7%) | 16 (33.3%) |
| Bachelor's Degree or higher | 20 (100.0%) | 0 (0.0%) |
Occupancy by Age of Householder in Carolina
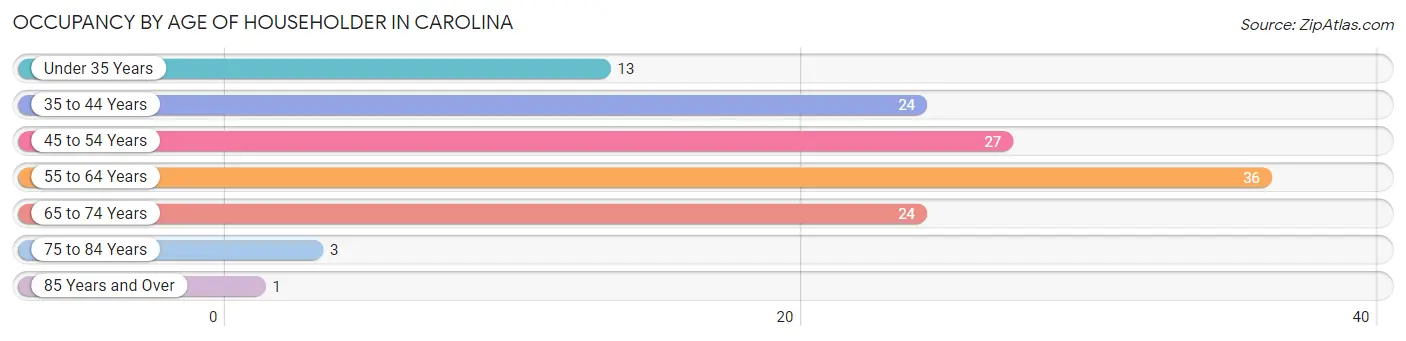
| Age Bracket | # Households | % Households |
| Under 35 Years | 13 | 10.2% |
| 35 to 44 Years | 24 | 18.8% |
| 45 to 54 Years | 27 | 21.1% |
| 55 to 64 Years | 36 | 28.1% |
| 65 to 74 Years | 24 | 18.8% |
| 75 to 84 Years | 3 | 2.3% |
| 85 Years and Over | 1 | 0.8% |
| Total | 128 | 100.0% |
Housing Finances in Carolina
Median Income by Occupancy in Carolina
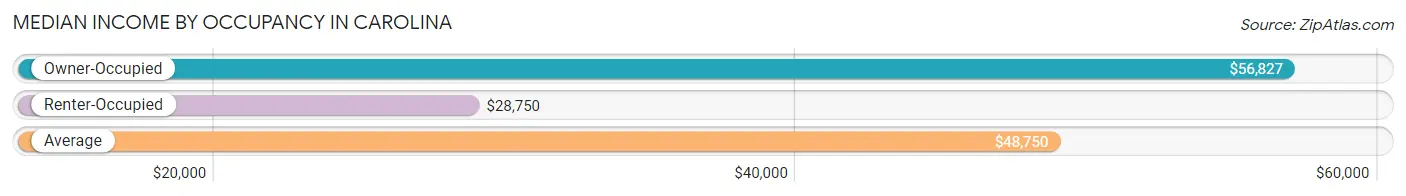
| Occupancy Type | # Households | Median Income |
| Owner-Occupied | 93 (72.7%) | $56,827 |
| Renter-Occupied | 35 (27.3%) | $28,750 |
| Average | 128 (100.0%) | $48,750 |
Occupancy by Householder Income Bracket in Carolina
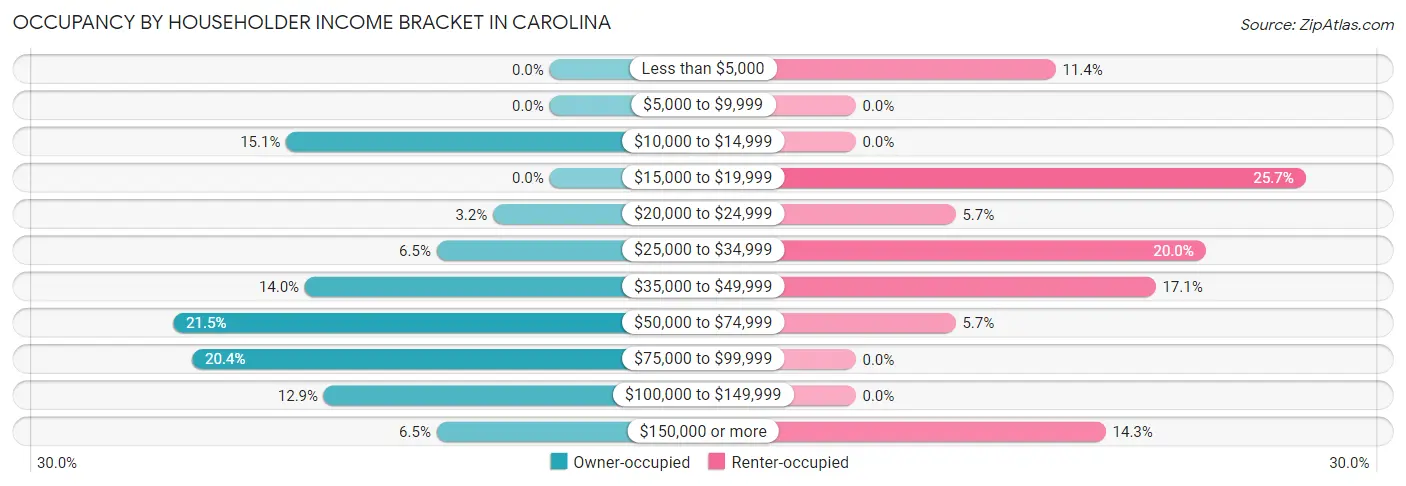
| Income Bracket | Owner-occupied | Renter-occupied |
| Less than $5,000 | 0 (0.0%) | 4 (11.4%) |
| $5,000 to $9,999 | 0 (0.0%) | 0 (0.0%) |
| $10,000 to $14,999 | 14 (15.0%) | 0 (0.0%) |
| $15,000 to $19,999 | 0 (0.0%) | 9 (25.7%) |
| $20,000 to $24,999 | 3 (3.2%) | 2 (5.7%) |
| $25,000 to $34,999 | 6 (6.5%) | 7 (20.0%) |
| $35,000 to $49,999 | 13 (14.0%) | 6 (17.1%) |
| $50,000 to $74,999 | 20 (21.5%) | 2 (5.7%) |
| $75,000 to $99,999 | 19 (20.4%) | 0 (0.0%) |
| $100,000 to $149,999 | 12 (12.9%) | 0 (0.0%) |
| $150,000 or more | 6 (6.5%) | 5 (14.3%) |
| Total | 93 (100.0%) | 35 (100.0%) |
Monthly Housing Cost Tiers in Carolina
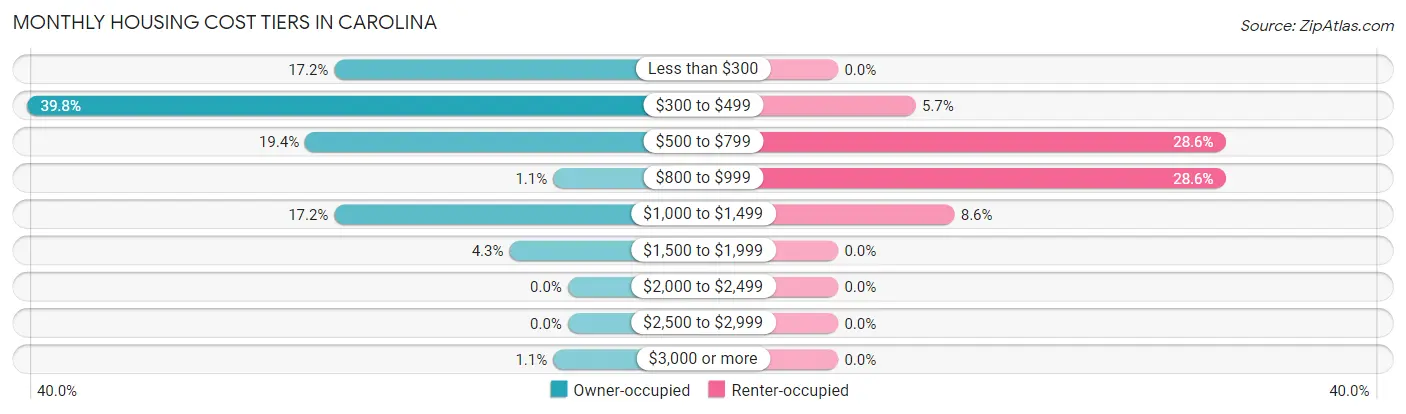
| Monthly Cost | Owner-occupied | Renter-occupied |
| Less than $300 | 16 (17.2%) | 0 (0.0%) |
| $300 to $499 | 37 (39.8%) | 2 (5.7%) |
| $500 to $799 | 18 (19.4%) | 10 (28.6%) |
| $800 to $999 | 1 (1.1%) | 10 (28.6%) |
| $1,000 to $1,499 | 16 (17.2%) | 3 (8.6%) |
| $1,500 to $1,999 | 4 (4.3%) | 0 (0.0%) |
| $2,000 to $2,499 | 0 (0.0%) | 0 (0.0%) |
| $2,500 to $2,999 | 0 (0.0%) | 0 (0.0%) |
| $3,000 or more | 1 (1.1%) | 0 (0.0%) |
| Total | 93 (100.0%) | 35 (100.0%) |
Physical Housing Characteristics in Carolina
Housing Structures in Carolina
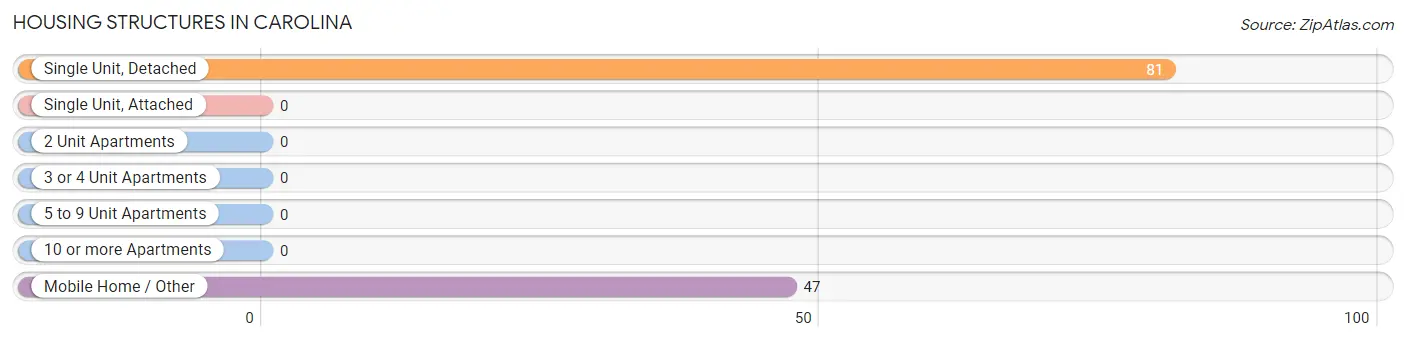
| Structure Type | # Housing Units | % Housing Units |
| Single Unit, Detached | 81 | 63.3% |
| Single Unit, Attached | 0 | 0.0% |
| 2 Unit Apartments | 0 | 0.0% |
| 3 or 4 Unit Apartments | 0 | 0.0% |
| 5 to 9 Unit Apartments | 0 | 0.0% |
| 10 or more Apartments | 0 | 0.0% |
| Mobile Home / Other | 47 | 36.7% |
| Total | 128 | 100.0% |
Housing Structures by Occupancy in Carolina
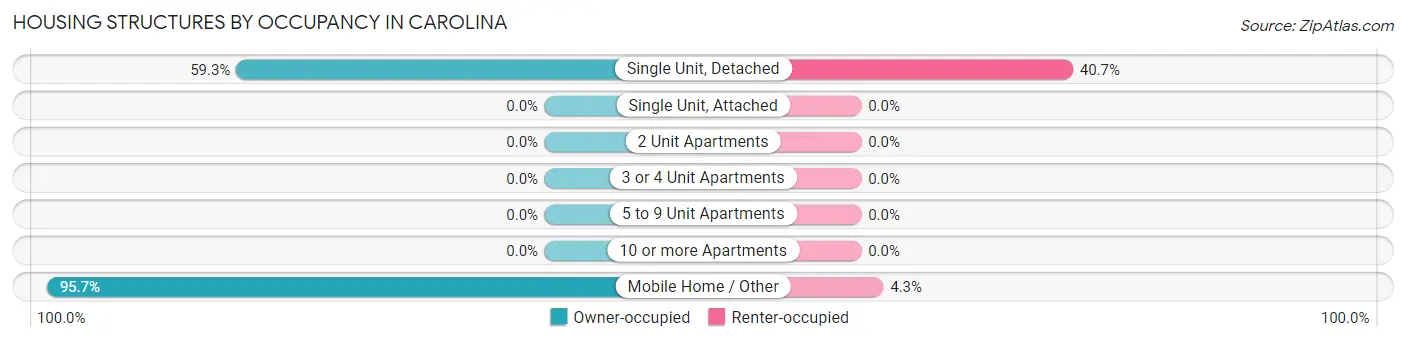
| Structure Type | Owner-occupied | Renter-occupied |
| Single Unit, Detached | 48 (59.3%) | 33 (40.7%) |
| Single Unit, Attached | 0 (0.0%) | 0 (0.0%) |
| 2 Unit Apartments | 0 (0.0%) | 0 (0.0%) |
| 3 or 4 Unit Apartments | 0 (0.0%) | 0 (0.0%) |
| 5 to 9 Unit Apartments | 0 (0.0%) | 0 (0.0%) |
| 10 or more Apartments | 0 (0.0%) | 0 (0.0%) |
| Mobile Home / Other | 45 (95.7%) | 2 (4.3%) |
| Total | 93 (72.7%) | 35 (27.3%) |
Housing Structures by Number of Rooms in Carolina
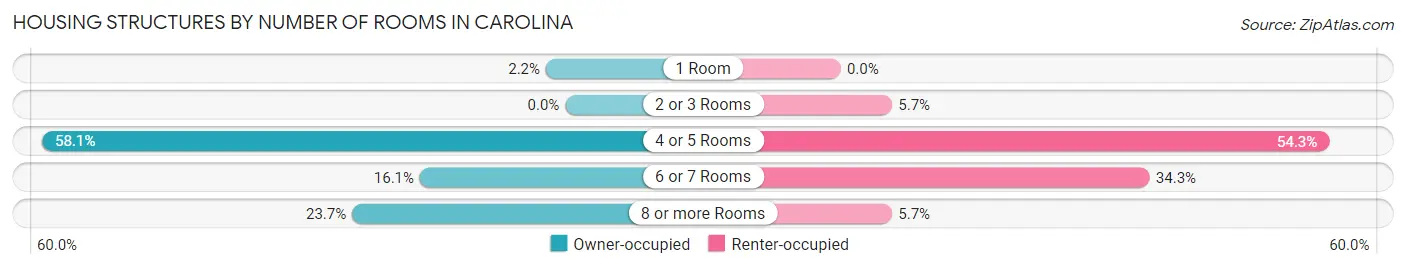
| Number of Rooms | Owner-occupied | Renter-occupied |
| 1 Room | 2 (2.1%) | 0 (0.0%) |
| 2 or 3 Rooms | 0 (0.0%) | 2 (5.7%) |
| 4 or 5 Rooms | 54 (58.1%) | 19 (54.3%) |
| 6 or 7 Rooms | 15 (16.1%) | 12 (34.3%) |
| 8 or more Rooms | 22 (23.7%) | 2 (5.7%) |
| Total | 93 (100.0%) | 35 (100.0%) |
Housing Structure by Heating Type in Carolina
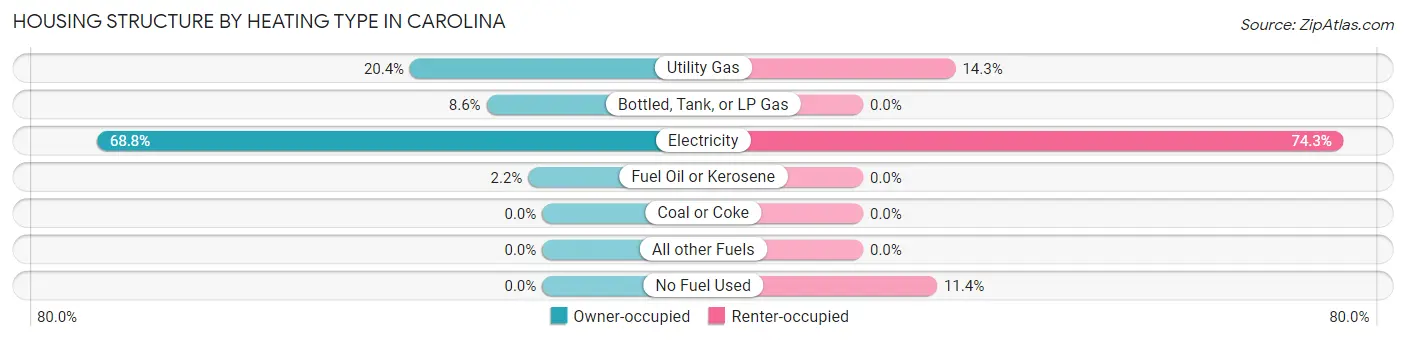
| Heating Type | Owner-occupied | Renter-occupied |
| Utility Gas | 19 (20.4%) | 5 (14.3%) |
| Bottled, Tank, or LP Gas | 8 (8.6%) | 0 (0.0%) |
| Electricity | 64 (68.8%) | 26 (74.3%) |
| Fuel Oil or Kerosene | 2 (2.1%) | 0 (0.0%) |
| Coal or Coke | 0 (0.0%) | 0 (0.0%) |
| All other Fuels | 0 (0.0%) | 0 (0.0%) |
| No Fuel Used | 0 (0.0%) | 4 (11.4%) |
| Total | 93 (100.0%) | 35 (100.0%) |
Household Vehicle Usage in Carolina
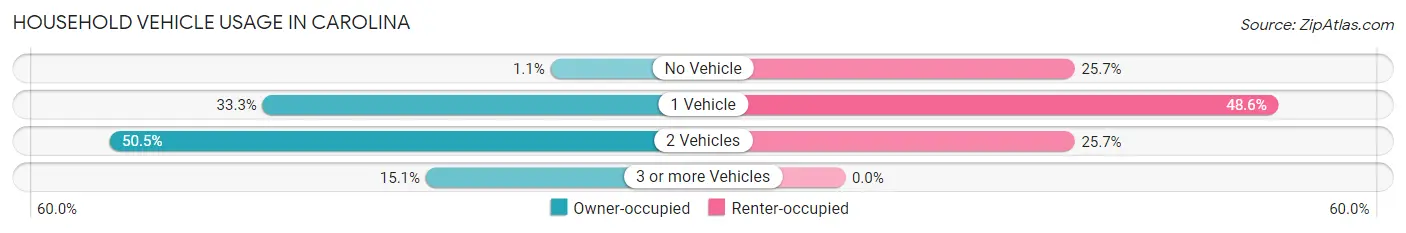
| Vehicles per Household | Owner-occupied | Renter-occupied |
| No Vehicle | 1 (1.1%) | 9 (25.7%) |
| 1 Vehicle | 31 (33.3%) | 17 (48.6%) |
| 2 Vehicles | 47 (50.5%) | 9 (25.7%) |
| 3 or more Vehicles | 14 (15.0%) | 0 (0.0%) |
| Total | 93 (100.0%) | 35 (100.0%) |
Real Estate & Mortgages in Carolina
Real Estate and Mortgage Overview in Carolina
| Characteristic | Without Mortgage | With Mortgage |
| Housing Units | 67 | 26 |
| Median Property Value | $97,500 | $98,800 |
| Median Household Income | $55,673 | $2 |
| Monthly Housing Costs | $403 | $1 |
| Real Estate Taxes | $314 | $0 |
Property Value by Mortgage Status in Carolina
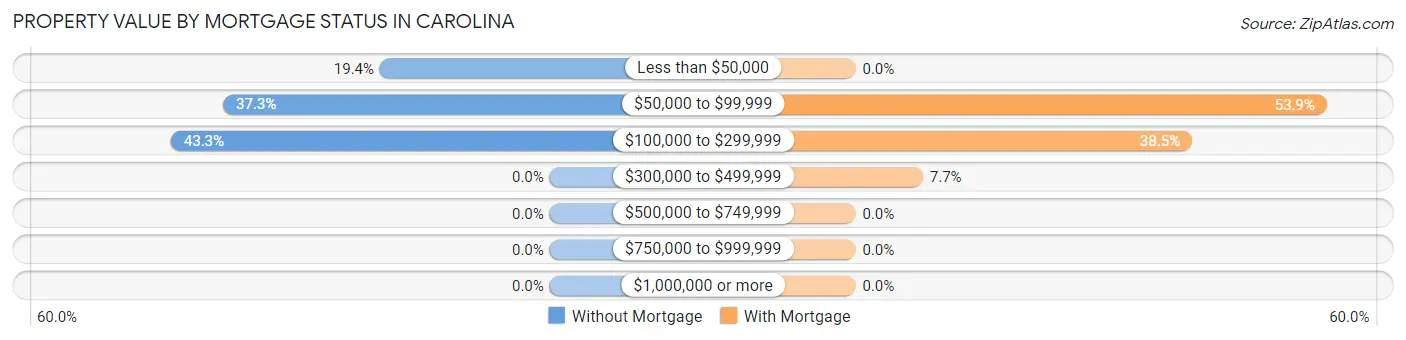
| Property Value | Without Mortgage | With Mortgage |
| Less than $50,000 | 13 (19.4%) | 0 (0.0%) |
| $50,000 to $99,999 | 25 (37.3%) | 14 (53.8%) |
| $100,000 to $299,999 | 29 (43.3%) | 10 (38.5%) |
| $300,000 to $499,999 | 0 (0.0%) | 2 (7.7%) |
| $500,000 to $749,999 | 0 (0.0%) | 0 (0.0%) |
| $750,000 to $999,999 | 0 (0.0%) | 0 (0.0%) |
| $1,000,000 or more | 0 (0.0%) | 0 (0.0%) |
| Total | 67 (100.0%) | 26 (100.0%) |
Household Income by Mortgage Status in Carolina
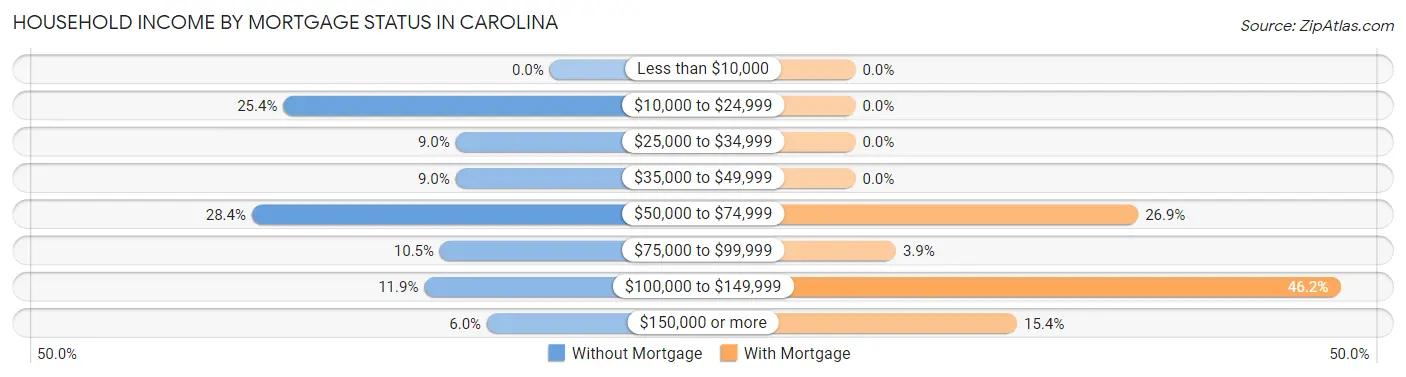
| Household Income | Without Mortgage | With Mortgage |
| Less than $10,000 | 0 (0.0%) | 0 (0.0%) |
| $10,000 to $24,999 | 17 (25.4%) | 0 (0.0%) |
| $25,000 to $34,999 | 6 (9.0%) | 0 (0.0%) |
| $35,000 to $49,999 | 6 (9.0%) | 0 (0.0%) |
| $50,000 to $74,999 | 19 (28.4%) | 7 (26.9%) |
| $75,000 to $99,999 | 7 (10.4%) | 1 (3.8%) |
| $100,000 to $149,999 | 8 (11.9%) | 12 (46.2%) |
| $150,000 or more | 4 (6.0%) | 4 (15.4%) |
| Total | 67 (100.0%) | 26 (100.0%) |
Property Value to Household Income Ratio in Carolina
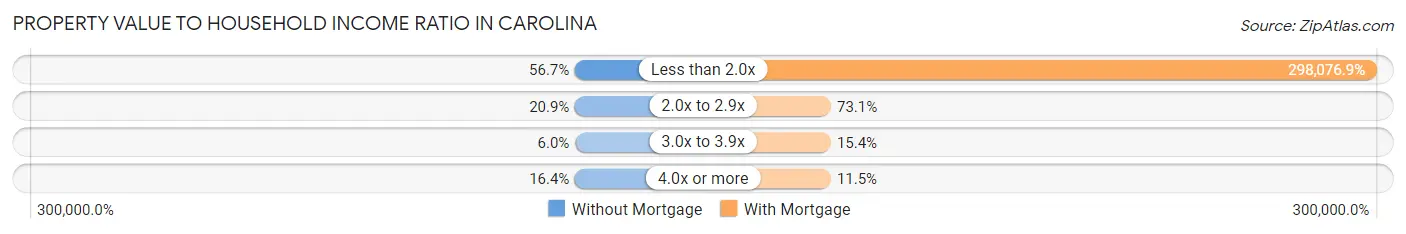
| Value-to-Income Ratio | Without Mortgage | With Mortgage |
| Less than 2.0x | 38 (56.7%) | 77,500 (298,076.9%) |
| 2.0x to 2.9x | 14 (20.9%) | 19 (73.1%) |
| 3.0x to 3.9x | 4 (6.0%) | 4 (15.4%) |
| 4.0x or more | 11 (16.4%) | 3 (11.5%) |
| Total | 67 (100.0%) | 26 (100.0%) |
Real Estate Taxes by Mortgage Status in Carolina
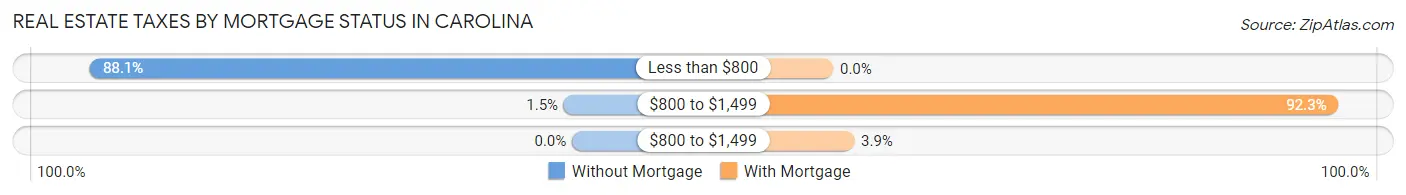
| Property Taxes | Without Mortgage | With Mortgage |
| Less than $800 | 59 (88.1%) | 0 (0.0%) |
| $800 to $1,499 | 1 (1.5%) | 24 (92.3%) |
| $800 to $1,499 | 0 (0.0%) | 1 (3.8%) |
| Total | 67 (100.0%) | 26 (100.0%) |
Health & Disability in Carolina
Health Insurance Coverage by Age in Carolina
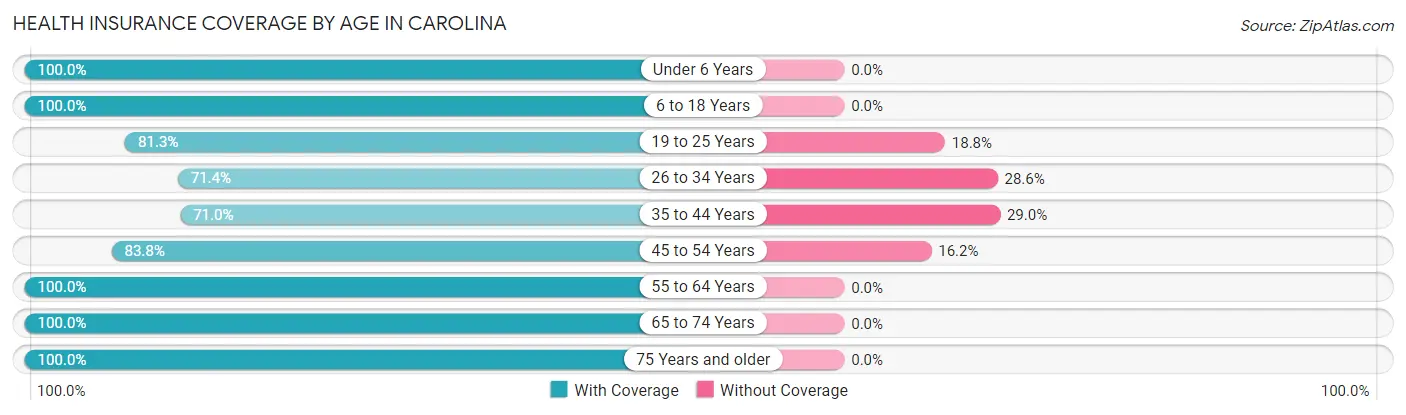
| Age Bracket | With Coverage | Without Coverage |
| Under 6 Years | 13 (100.0%) | 0 (0.0%) |
| 6 to 18 Years | 53 (100.0%) | 0 (0.0%) |
| 19 to 25 Years | 13 (81.2%) | 3 (18.8%) |
| 26 to 34 Years | 25 (71.4%) | 10 (28.6%) |
| 35 to 44 Years | 22 (71.0%) | 9 (29.0%) |
| 45 to 54 Years | 31 (83.8%) | 6 (16.2%) |
| 55 to 64 Years | 51 (100.0%) | 0 (0.0%) |
| 65 to 74 Years | 34 (100.0%) | 0 (0.0%) |
| 75 Years and older | 9 (100.0%) | 0 (0.0%) |
| Total | 251 (90.0%) | 28 (10.0%) |
Health Insurance Coverage by Citizenship Status in Carolina
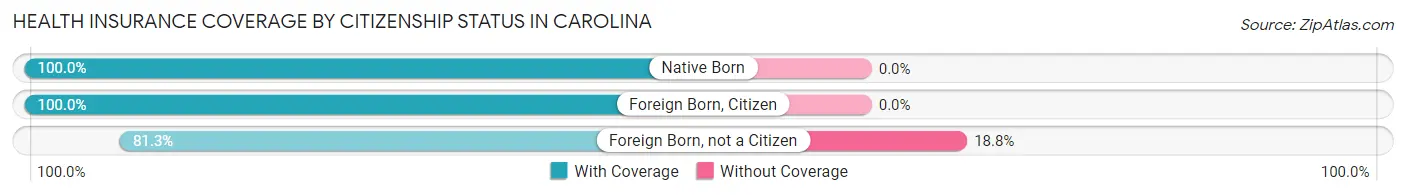
| Citizenship Status | With Coverage | Without Coverage |
| Native Born | 13 (100.0%) | 0 (0.0%) |
| Foreign Born, Citizen | 53 (100.0%) | 0 (0.0%) |
| Foreign Born, not a Citizen | 13 (81.2%) | 3 (18.8%) |
Health Insurance Coverage by Household Income in Carolina
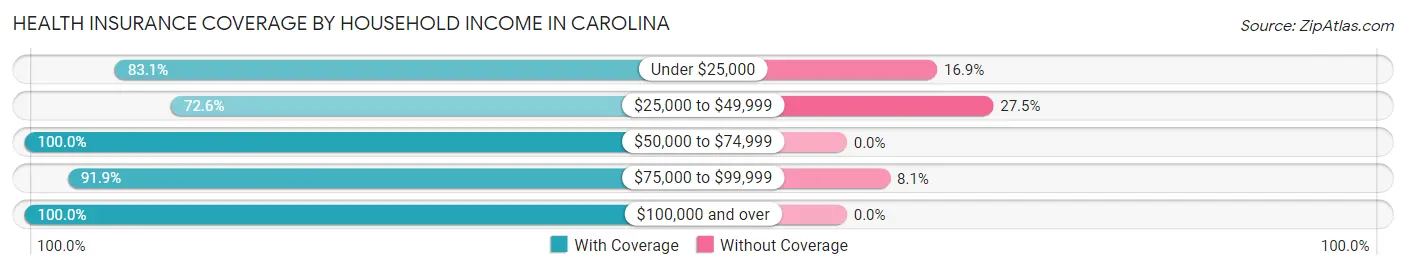
| Household Income | With Coverage | Without Coverage |
| Under $25,000 | 54 (83.1%) | 11 (16.9%) |
| $25,000 to $49,999 | 37 (72.6%) | 14 (27.5%) |
| $50,000 to $74,999 | 41 (100.0%) | 0 (0.0%) |
| $75,000 to $99,999 | 34 (91.9%) | 3 (8.1%) |
| $100,000 and over | 85 (100.0%) | 0 (0.0%) |
Public vs Private Health Insurance Coverage by Age in Carolina
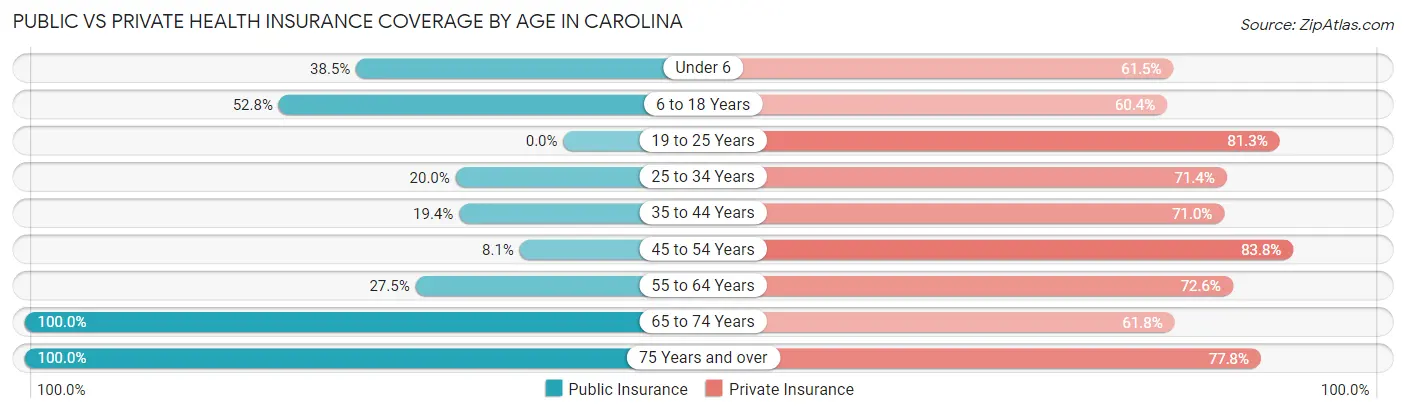
| Age Bracket | Public Insurance | Private Insurance |
| Under 6 | 5 (38.5%) | 8 (61.5%) |
| 6 to 18 Years | 28 (52.8%) | 32 (60.4%) |
| 19 to 25 Years | 0 (0.0%) | 13 (81.2%) |
| 25 to 34 Years | 7 (20.0%) | 25 (71.4%) |
| 35 to 44 Years | 6 (19.4%) | 22 (71.0%) |
| 45 to 54 Years | 3 (8.1%) | 31 (83.8%) |
| 55 to 64 Years | 14 (27.5%) | 37 (72.6%) |
| 65 to 74 Years | 34 (100.0%) | 21 (61.8%) |
| 75 Years and over | 9 (100.0%) | 7 (77.8%) |
| Total | 106 (38.0%) | 196 (70.3%) |
Disability Status by Sex by Age in Carolina
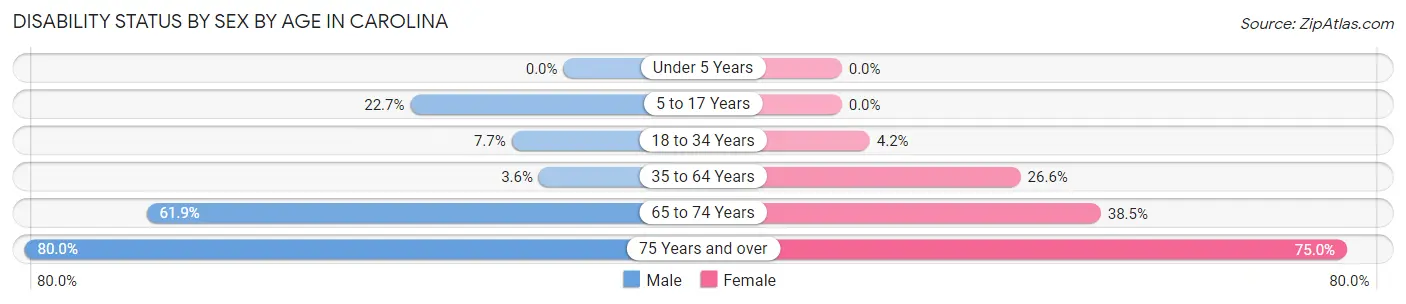
| Age Bracket | Male | Female |
| Under 5 Years | 0 (0.0%) | 0 (0.0%) |
| 5 to 17 Years | 5 (22.7%) | 0 (0.0%) |
| 18 to 34 Years | 2 (7.7%) | 2 (4.2%) |
| 35 to 64 Years | 2 (3.6%) | 17 (26.6%) |
| 65 to 74 Years | 13 (61.9%) | 5 (38.5%) |
| 75 Years and over | 4 (80.0%) | 3 (75.0%) |
Disability Class by Sex by Age in Carolina
Disability Class: Hearing Difficulty
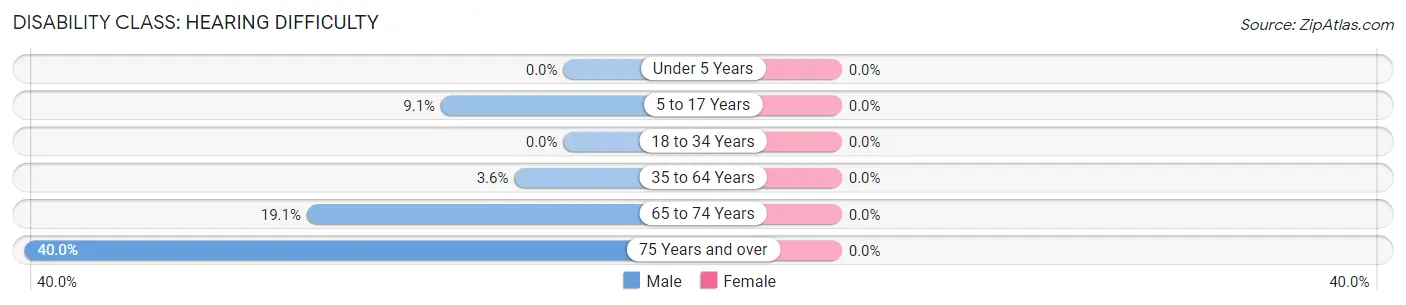
| Age Bracket | Male | Female |
| Under 5 Years | 0 (0.0%) | 0 (0.0%) |
| 5 to 17 Years | 2 (9.1%) | 0 (0.0%) |
| 18 to 34 Years | 0 (0.0%) | 0 (0.0%) |
| 35 to 64 Years | 2 (3.6%) | 0 (0.0%) |
| 65 to 74 Years | 4 (19.1%) | 0 (0.0%) |
| 75 Years and over | 2 (40.0%) | 0 (0.0%) |
Disability Class: Vision Difficulty
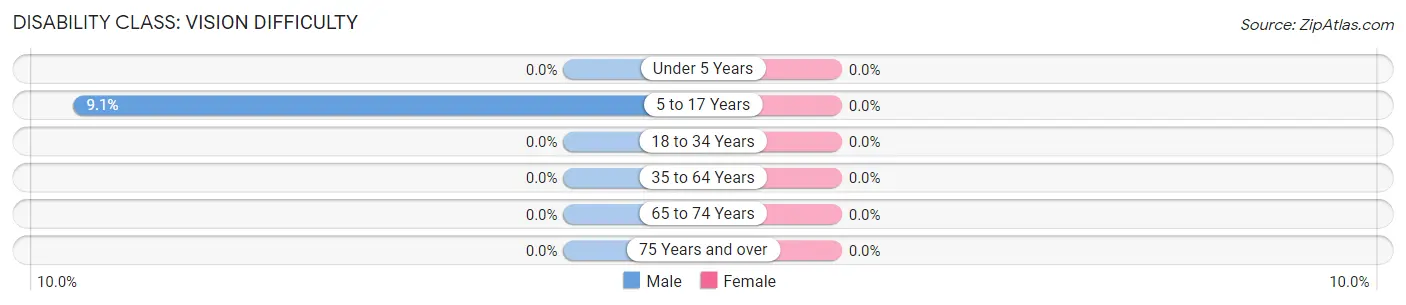
| Age Bracket | Male | Female |
| Under 5 Years | 0 (0.0%) | 0 (0.0%) |
| 5 to 17 Years | 2 (9.1%) | 0 (0.0%) |
| 18 to 34 Years | 0 (0.0%) | 0 (0.0%) |
| 35 to 64 Years | 0 (0.0%) | 0 (0.0%) |
| 65 to 74 Years | 0 (0.0%) | 0 (0.0%) |
| 75 Years and over | 0 (0.0%) | 0 (0.0%) |
Disability Class: Cognitive Difficulty
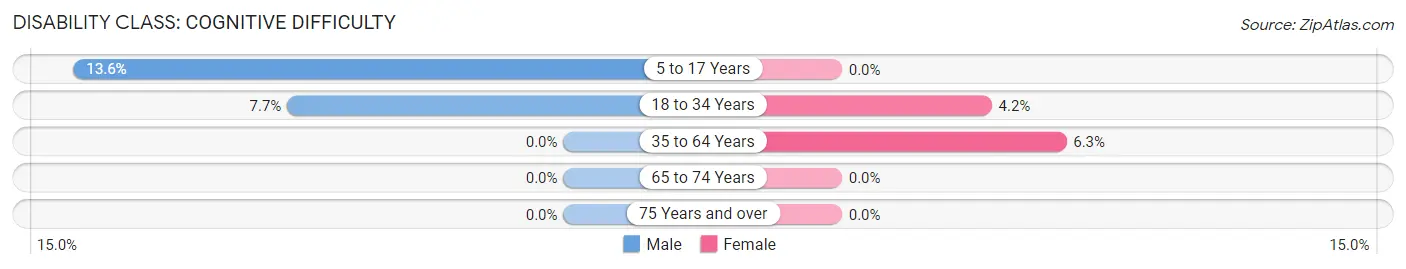
| Age Bracket | Male | Female |
| 5 to 17 Years | 3 (13.6%) | 0 (0.0%) |
| 18 to 34 Years | 2 (7.7%) | 2 (4.2%) |
| 35 to 64 Years | 0 (0.0%) | 4 (6.2%) |
| 65 to 74 Years | 0 (0.0%) | 0 (0.0%) |
| 75 Years and over | 0 (0.0%) | 0 (0.0%) |
Disability Class: Ambulatory Difficulty
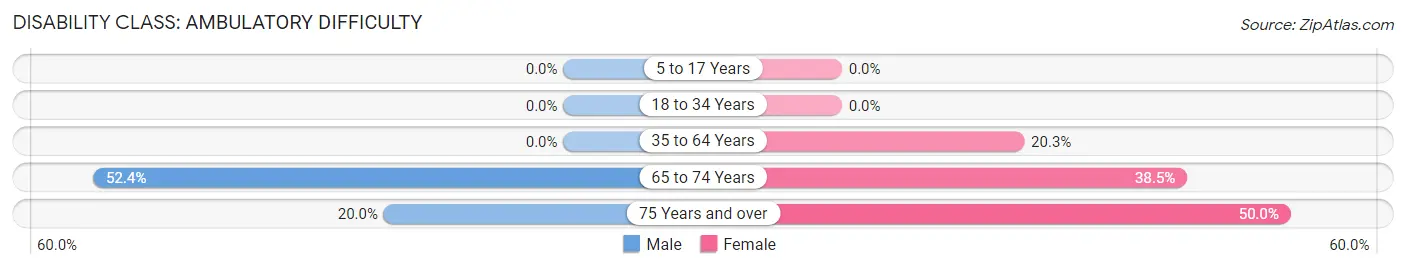
| Age Bracket | Male | Female |
| 5 to 17 Years | 0 (0.0%) | 0 (0.0%) |
| 18 to 34 Years | 0 (0.0%) | 0 (0.0%) |
| 35 to 64 Years | 0 (0.0%) | 13 (20.3%) |
| 65 to 74 Years | 11 (52.4%) | 5 (38.5%) |
| 75 Years and over | 1 (20.0%) | 2 (50.0%) |
Disability Class: Self-Care Difficulty
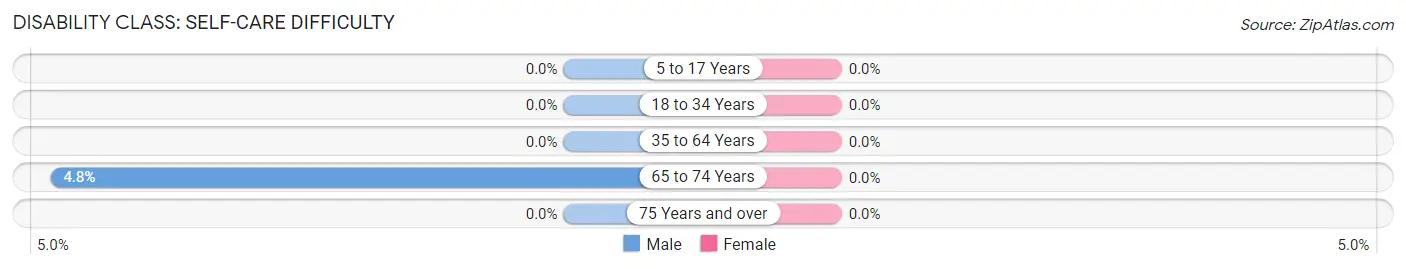
| Age Bracket | Male | Female |
| 5 to 17 Years | 0 (0.0%) | 0 (0.0%) |
| 18 to 34 Years | 0 (0.0%) | 0 (0.0%) |
| 35 to 64 Years | 0 (0.0%) | 0 (0.0%) |
| 65 to 74 Years | 1 (4.8%) | 0 (0.0%) |
| 75 Years and over | 0 (0.0%) | 0 (0.0%) |
Technology Access in Carolina
Computing Device Access in Carolina
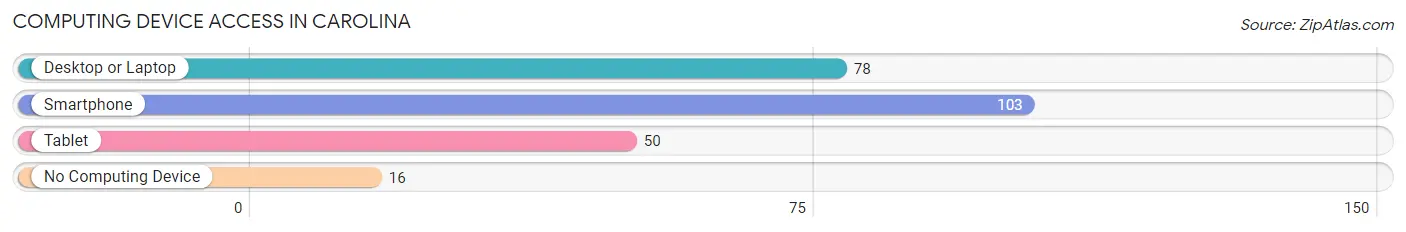
| Device Type | # Households | % Households |
| Desktop or Laptop | 78 | 60.9% |
| Smartphone | 103 | 80.5% |
| Tablet | 50 | 39.1% |
| No Computing Device | 16 | 12.5% |
| Total | 128 | 100.0% |
Internet Access in Carolina
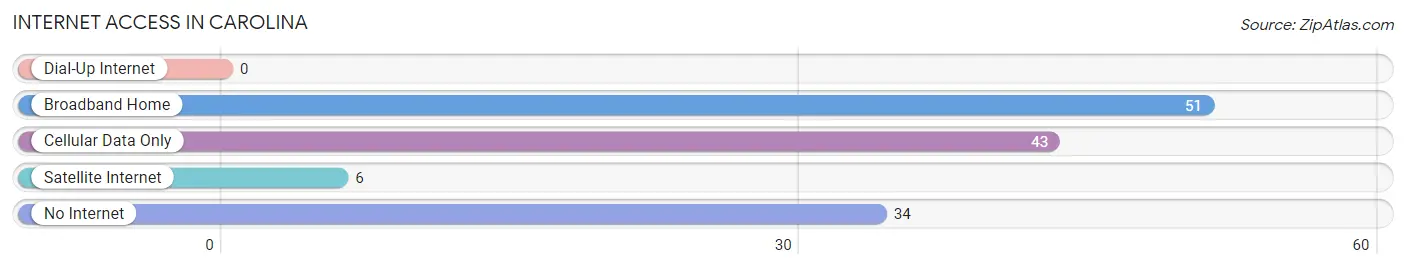
| Internet Type | # Households | % Households |
| Dial-Up Internet | 0 | 0.0% |
| Broadband Home | 51 | 39.8% |
| Cellular Data Only | 43 | 33.6% |
| Satellite Internet | 6 | 4.7% |
| No Internet | 34 | 26.6% |
| Total | 128 | 100.0% |
Carolina Summary
Carolina is a state located in the southeastern region of the United States. It is bordered by Virginia to the north, Tennessee to the west, Georgia to the south, and the Atlantic Ocean to the east. Carolina is the 28th most extensive and the 9th most populous of the 50 United States. The state is divided into 100 counties and contains the state capital of Raleigh.
History
Carolina was first inhabited by Native Americans, including the Cherokee, Catawba, and Tuscarora tribes. The first European settlers arrived in the late 16th century, and the area was eventually colonized by the English in the 17th century. The Province of Carolina was established in 1663, and the colony was divided into North and South Carolina in 1712. The American Revolution saw the two colonies join forces to fight against the British, and the state of Carolina was officially established in 1789.
Geography
Carolina is located in the southeastern United States, and is bordered by Virginia to the north, Tennessee to the west, Georgia to the south, and the Atlantic Ocean to the east. The state is divided into three distinct geographic regions: the Coastal Plain, the Piedmont, and the Mountains. The Coastal Plain is a flat, low-lying area that is home to the state’s beaches and barrier islands. The Piedmont is a hilly region that is home to the state’s largest cities, including Raleigh, Charlotte, and Greensboro. The Mountains are located in the western part of the state and are home to the Great Smoky Mountains National Park.
Economy
Carolina’s economy is largely driven by agriculture, manufacturing, and tourism. The state is a major producer of tobacco, cotton, and soybeans, and is home to a number of large manufacturing companies, including Dell, IBM, and Goodyear. Tourism is also a major industry in the state, with visitors drawn to the state’s beaches, mountains, and cities.
Demographics
As of the 2010 census, Carolina had a population of 9,535,483. The state is home to a diverse population, with the largest ethnic groups being White (68.5%), African American (21.5%), and Hispanic or Latino (8.3%). The state’s largest cities are Charlotte (827,097), Raleigh (463,298), and Greensboro (285,342). The state’s median household income is $48,256, and the poverty rate is 16.4%.
Common Questions
What is Per Capita Income in Carolina?
Per Capita income in Carolina is $30,630.
What is the Median Family Income in Carolina?
Median Family Income in Carolina is $78,750.
What is the Median Household income in Carolina?
Median Household Income in Carolina is $48,750.
What is Income or Wage Gap in Carolina?
Income or Wage Gap in Carolina is 24.2%.
Women in Carolina earn 75.8 cents for every dollar earned by a man.
What is Inequality or Gini Index in Carolina?
Inequality or Gini Index in Carolina is 0.43.
What is the Total Population of Carolina?
Total Population of Carolina is 279.
What is the Total Male Population of Carolina?
Total Male Population of Carolina is 132.
What is the Total Female Population of Carolina?
Total Female Population of Carolina is 147.
What is the Ratio of Males per 100 Females in Carolina?
There are 89.80 Males per 100 Females in Carolina.
What is the Ratio of Females per 100 Males in Carolina?
There are 111.36 Females per 100 Males in Carolina.
What is the Median Population Age in Carolina?
Median Population Age in Carolina is 38.6 Years.
What is the Average Family Size in Carolina
Average Family Size in Carolina is 3.1 People.
What is the Average Household Size in Carolina
Average Household Size in Carolina is 2.2 People.
How Large is the Labor Force in Carolina?
There are 121 People in the Labor Forcein in Carolina.
What is the Percentage of People in the Labor Force in Carolina?
50.8% of People are in the Labor Force in Carolina.