St Florian, AL Map & Demographics
St Florian Map
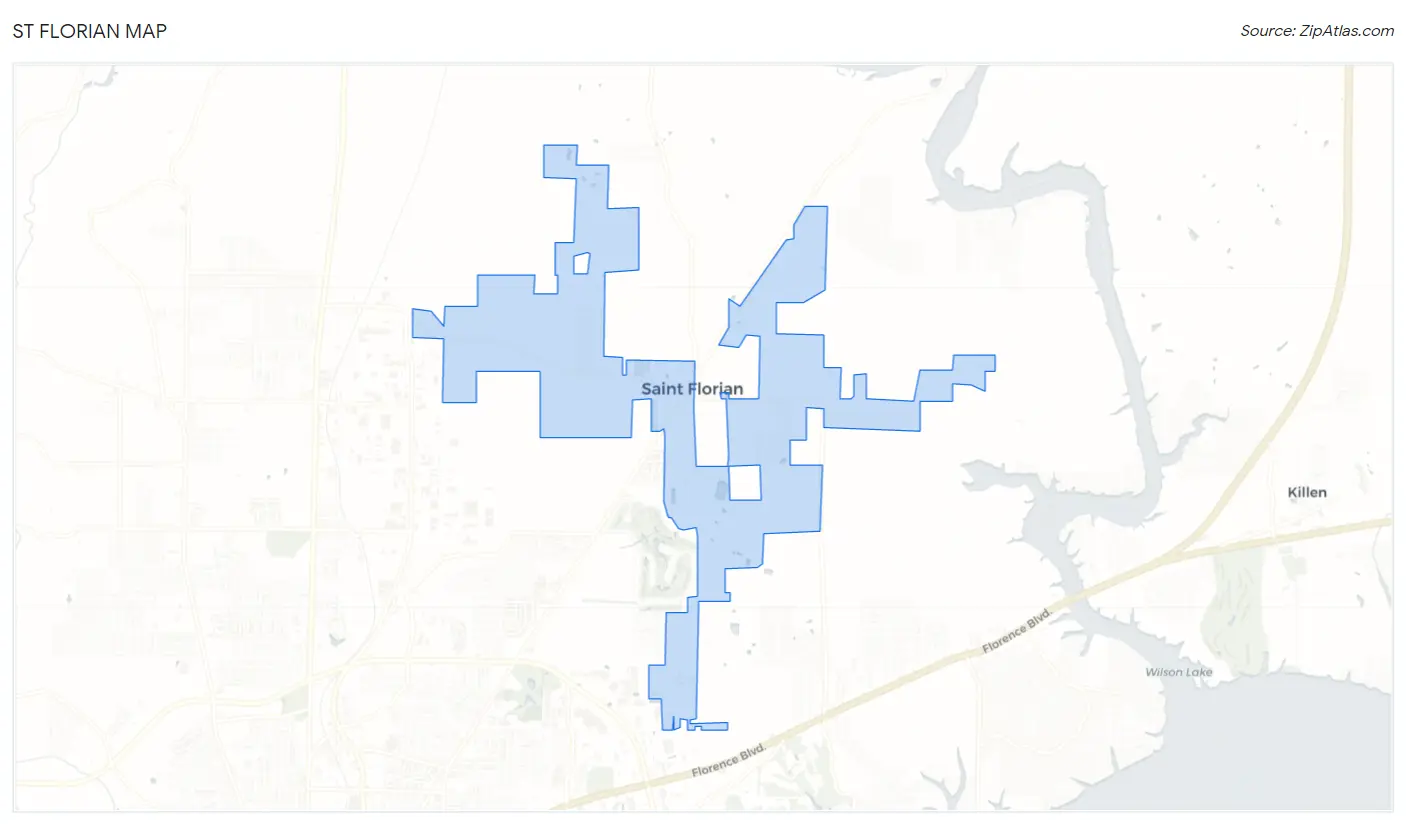
St Florian Overview
$37,678
PER CAPITA INCOME
$93,472
AVG FAMILY INCOME
$50,000
AVG HOUSEHOLD INCOME
33.6%
WAGE / INCOME GAP [ % ]
66.4¢/ $1
WAGE / INCOME GAP [ $ ]
0.48
INEQUALITY / GINI INDEX
636
TOTAL POPULATION
313
MALE POPULATION
323
FEMALE POPULATION
96.90
MALES / 100 FEMALES
103.19
FEMALES / 100 MALES
55.8
MEDIAN AGE
3.1
AVG FAMILY SIZE
2.2
AVG HOUSEHOLD SIZE
290
LABOR FORCE [ PEOPLE ]
51.9%
PERCENT IN LABOR FORCE
4.5%
UNEMPLOYMENT RATE
Income in St Florian
Income Overview in St Florian
Per Capita Income in St Florian is $37,678, while median incomes of families and households are $93,472 and $50,000 respectively.
| Characteristic | Number | Measure |
| Per Capita Income | 636 | $37,678 |
| Median Family Income | 165 | $93,472 |
| Mean Family Income | 165 | $110,483 |
| Median Household Income | 286 | $50,000 |
| Mean Household Income | 286 | $80,028 |
| Income Deficit | 165 | $0 |
| Wage / Income Gap (%) | 636 | 33.57% |
| Wage / Income Gap ($) | 636 | 66.43¢ per $1 |
| Gini / Inequality Index | 636 | 0.48 |
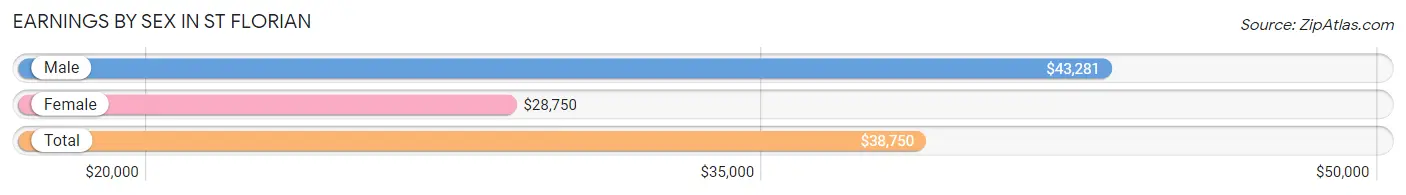
Earnings by Sex in St Florian
Average Earnings in St Florian are $38,750, $43,281 for men and $28,750 for women, a difference of 33.6%.
| Sex | Number | Average Earnings |
| Male | 161 (54.2%) | $43,281 |
| Female | 136 (45.8%) | $28,750 |
| Total | 297 (100.0%) | $38,750 |
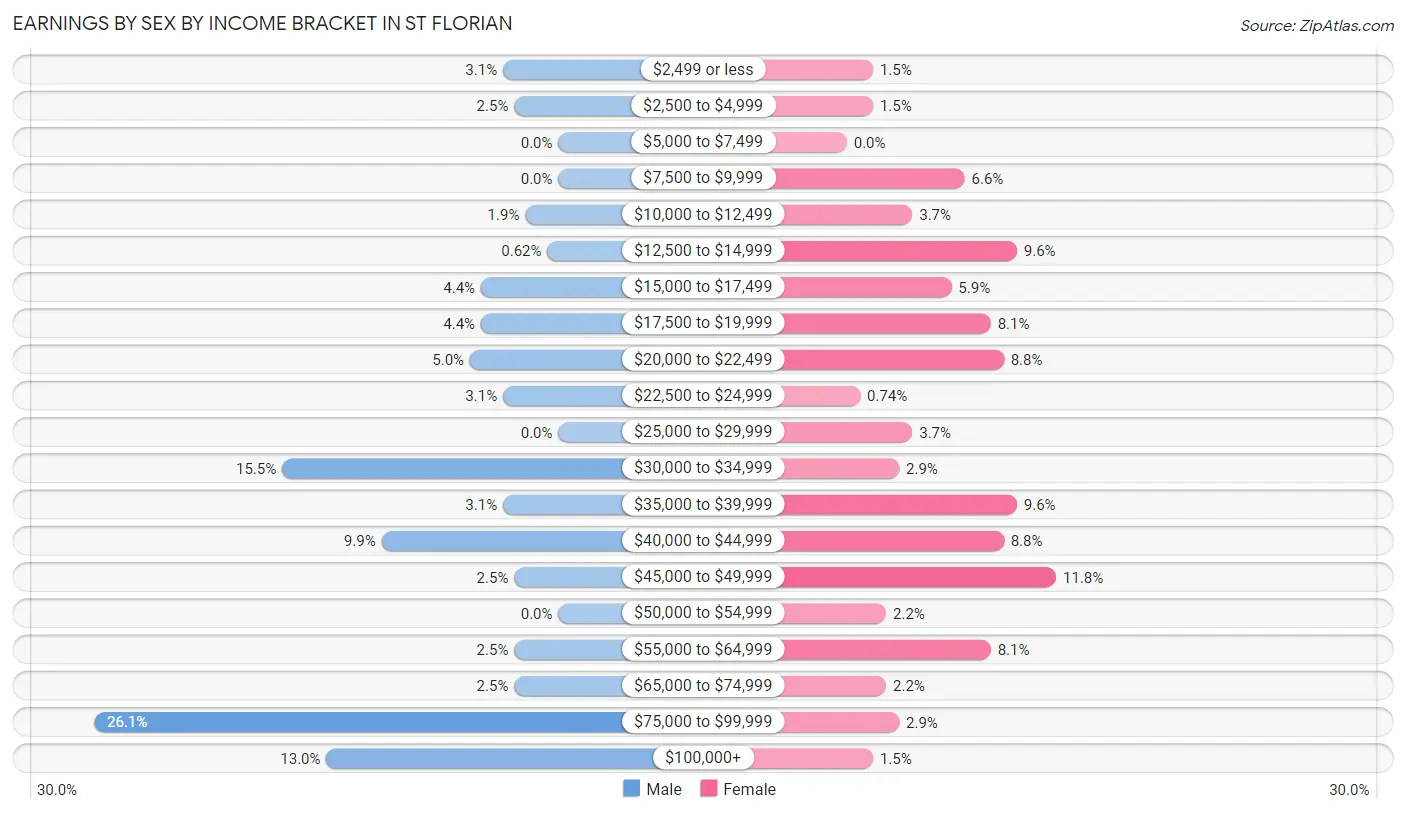
Earnings by Sex by Income Bracket in St Florian
The most common earnings brackets in St Florian are $75,000 to $99,999 for men (42 | 26.1%) and $45,000 to $49,999 for women (16 | 11.8%).
| Income | Male | Female |
| $2,499 or less | 5 (3.1%) | 2 (1.5%) |
| $2,500 to $4,999 | 4 (2.5%) | 2 (1.5%) |
| $5,000 to $7,499 | 0 (0.0%) | 0 (0.0%) |
| $7,500 to $9,999 | 0 (0.0%) | 9 (6.6%) |
| $10,000 to $12,499 | 3 (1.9%) | 5 (3.7%) |
| $12,500 to $14,999 | 1 (0.6%) | 13 (9.6%) |
| $15,000 to $17,499 | 7 (4.3%) | 8 (5.9%) |
| $17,500 to $19,999 | 7 (4.3%) | 11 (8.1%) |
| $20,000 to $22,499 | 8 (5.0%) | 12 (8.8%) |
| $22,500 to $24,999 | 5 (3.1%) | 1 (0.7%) |
| $25,000 to $29,999 | 0 (0.0%) | 5 (3.7%) |
| $30,000 to $34,999 | 25 (15.5%) | 4 (2.9%) |
| $35,000 to $39,999 | 5 (3.1%) | 13 (9.6%) |
| $40,000 to $44,999 | 16 (9.9%) | 12 (8.8%) |
| $45,000 to $49,999 | 4 (2.5%) | 16 (11.8%) |
| $50,000 to $54,999 | 0 (0.0%) | 3 (2.2%) |
| $55,000 to $64,999 | 4 (2.5%) | 11 (8.1%) |
| $65,000 to $74,999 | 4 (2.5%) | 3 (2.2%) |
| $75,000 to $99,999 | 42 (26.1%) | 4 (2.9%) |
| $100,000+ | 21 (13.0%) | 2 (1.5%) |
| Total | 161 (100.0%) | 136 (100.0%) |
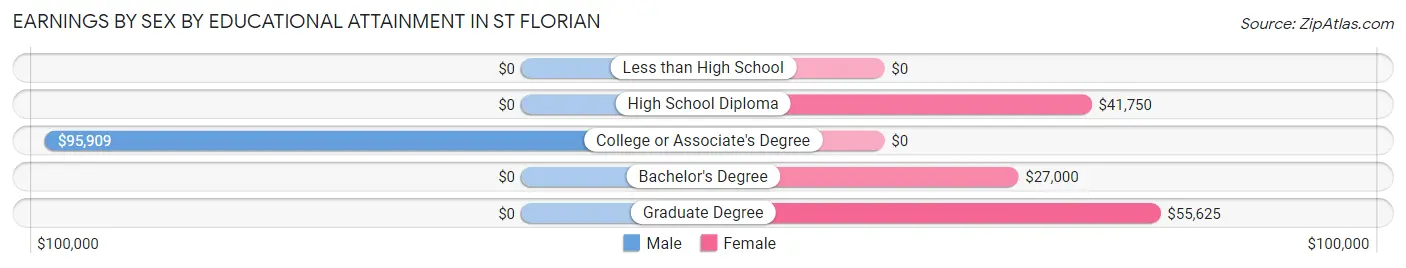
Earnings by Sex by Educational Attainment in St Florian
Average earnings in St Florian are $71,250 for men and $38,750 for women, a difference of 45.6%. Men with an educational attainment of college or associate's degree enjoy the highest average annual earnings of $95,909, while those with college or associate's degree education earn the least with $95,909. Women with an educational attainment of graduate degree earn the most with the average annual earnings of $55,625, while those with bachelor's degree education have the smallest earnings of $27,000.
| Educational Attainment | Male Income | Female Income |
| Less than High School | - | - |
| High School Diploma | - | - |
| College or Associate's Degree | $95,909 | $0 |
| Bachelor's Degree | - | - |
| Graduate Degree | - | - |
| Total | $71,250 | $38,750 |
Family Income in St Florian
Family Income Brackets in St Florian
According to the St Florian family income data, there are 32 families falling into the $50,000 to $74,999 income range, which is the most common income bracket and makes up 19.4% of all families.
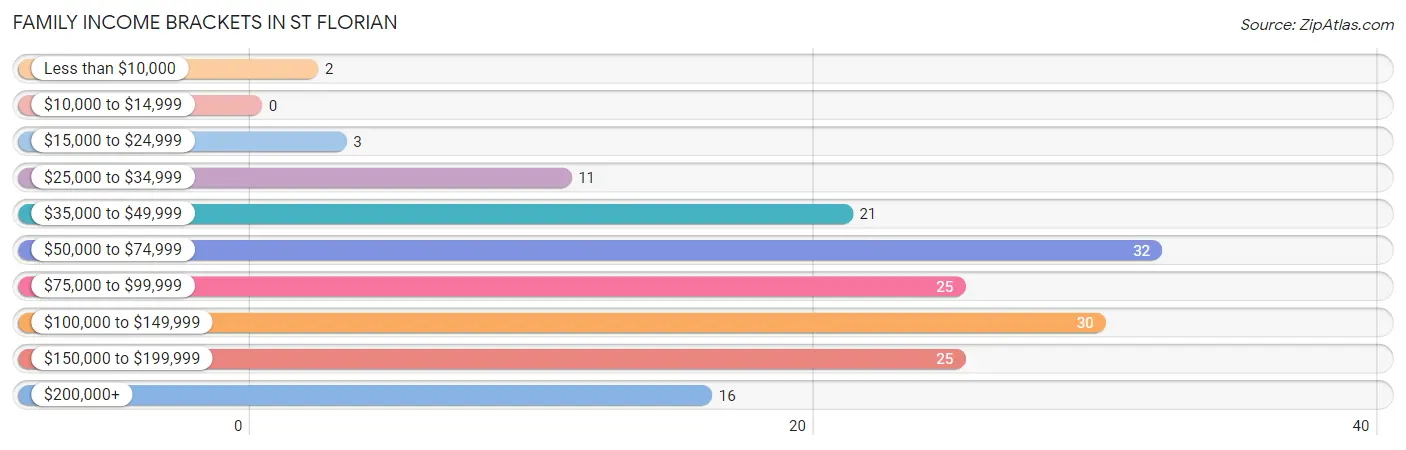
| Income Bracket | # Families | % Families |
| Less than $10,000 | 2 | 1.2% |
| $10,000 to $14,999 | 0 | 0.0% |
| $15,000 to $24,999 | 3 | 1.8% |
| $25,000 to $34,999 | 11 | 6.7% |
| $35,000 to $49,999 | 21 | 12.7% |
| $50,000 to $74,999 | 32 | 19.4% |
| $75,000 to $99,999 | 25 | 15.2% |
| $100,000 to $149,999 | 30 | 18.2% |
| $150,000 to $199,999 | 25 | 15.2% |
| $200,000+ | 16 | 9.7% |
Family Income by Famaliy Size in St Florian
3-person families (18 | 10.9%) account for the highest median family income in St Florian with $165,455 per family, while 3-person families (18 | 10.9%) have the highest median income of $55,152 per family member.
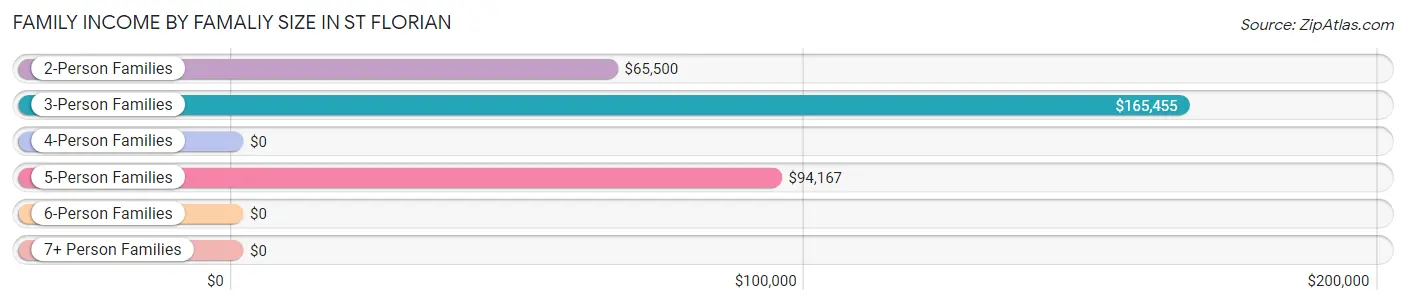
| Income Bracket | # Families | Median Income |
| 2-Person Families | 96 (58.2%) | $65,500 |
| 3-Person Families | 18 (10.9%) | $165,455 |
| 4-Person Families | 29 (17.6%) | $0 |
| 5-Person Families | 18 (10.9%) | $94,167 |
| 6-Person Families | 4 (2.4%) | $0 |
| 7+ Person Families | 0 (0.0%) | $0 |
| Total | 165 (100.0%) | $93,472 |
Family Income by Number of Earners in St Florian
The median family income in St Florian is $93,472, with families comprising 3+ earners (23) having the highest median family income of $165,341, while families with no earners (37) have the lowest median family income of $48,750, accounting for 13.9% and 22.4% of families, respectively.
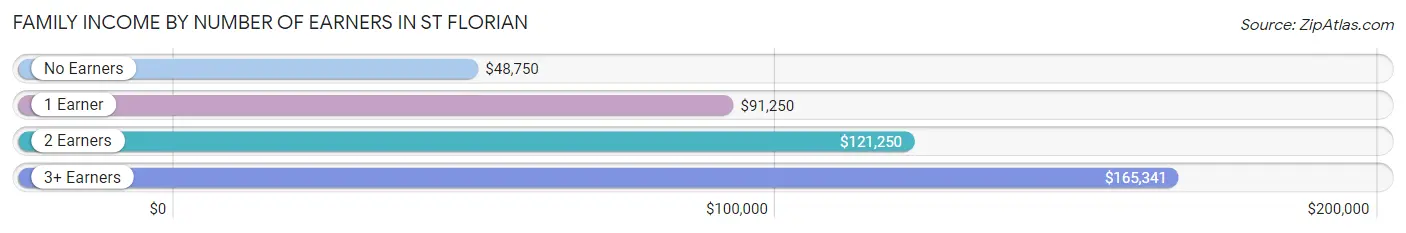
| Number of Earners | # Families | Median Income |
| No Earners | 37 (22.4%) | $48,750 |
| 1 Earner | 60 (36.4%) | $91,250 |
| 2 Earners | 45 (27.3%) | $121,250 |
| 3+ Earners | 23 (13.9%) | $165,341 |
| Total | 165 (100.0%) | $93,472 |
Household Income in St Florian
Household Income Brackets in St Florian
With 75 households falling in the category, the $15,000 to $24,999 income range is the most frequent in St Florian, accounting for 26.2% of all households. In contrast, only 4 households (1.4%) fall into the less than $10,000 income bracket, making it the least populous group.
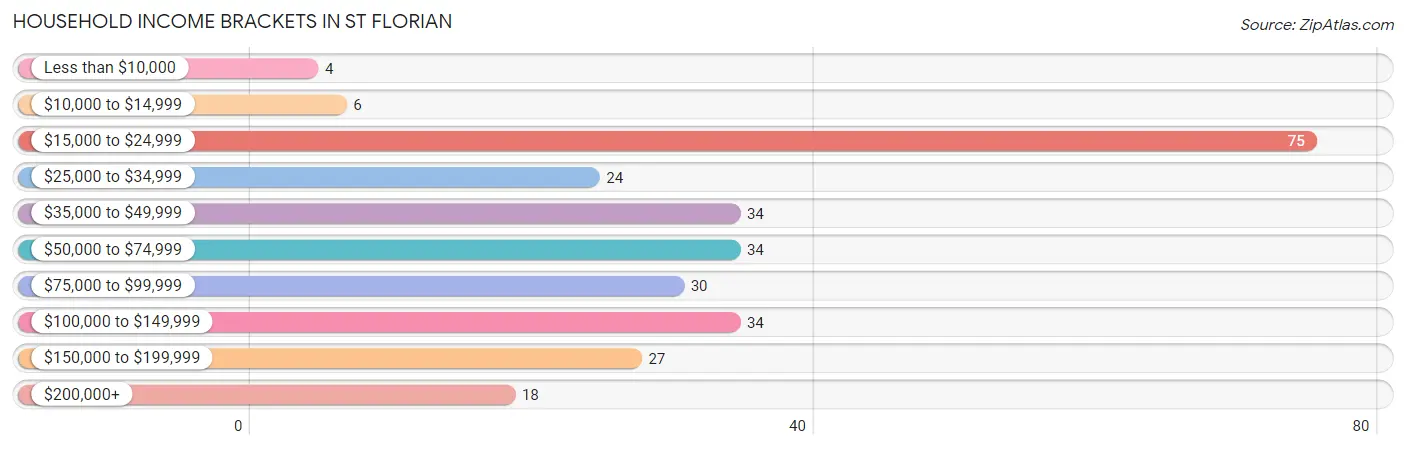
| Income Bracket | # Households | % Households |
| Less than $10,000 | 4 | 1.4% |
| $10,000 to $14,999 | 6 | 2.1% |
| $15,000 to $24,999 | 75 | 26.2% |
| $25,000 to $34,999 | 24 | 8.4% |
| $35,000 to $49,999 | 34 | 11.9% |
| $50,000 to $74,999 | 34 | 11.9% |
| $75,000 to $99,999 | 30 | 10.5% |
| $100,000 to $149,999 | 34 | 11.9% |
| $150,000 to $199,999 | 27 | 9.4% |
| $200,000+ | 18 | 6.3% |
Household Income by Householder Age in St Florian
The median household income in St Florian is $50,000, with the highest median household income of $120,000 found in the 45 to 64 years age bracket for the primary householder. A total of 68 households (23.8%) fall into this category.
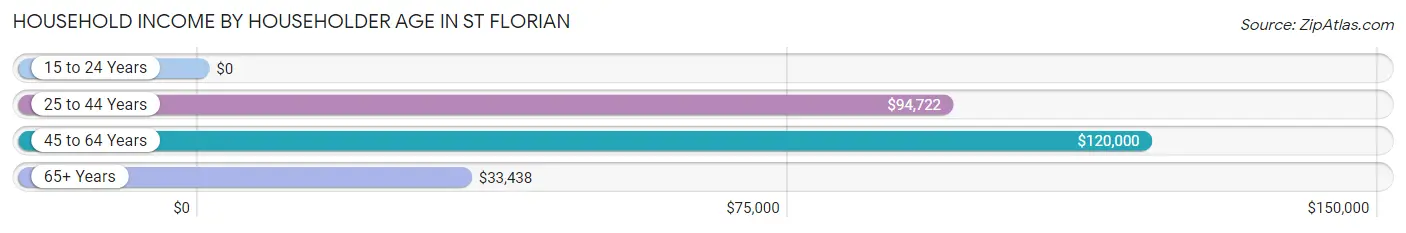
| Income Bracket | # Households | Median Income |
| 15 to 24 Years | 0 (0.0%) | $0 |
| 25 to 44 Years | 44 (15.4%) | $94,722 |
| 45 to 64 Years | 68 (23.8%) | $120,000 |
| 65+ Years | 174 (60.8%) | $33,438 |
| Total | 286 (100.0%) | $50,000 |
Poverty in St Florian
Income Below Poverty by Sex and Age in St Florian
With 1.0% poverty level for males and 2.2% for females among the residents of St Florian, under 5 year old males and 75 year old and over females are the most vulnerable to poverty, with 1 males (100.0%) and 5 females (8.9%) in their respective age groups living below the poverty level.
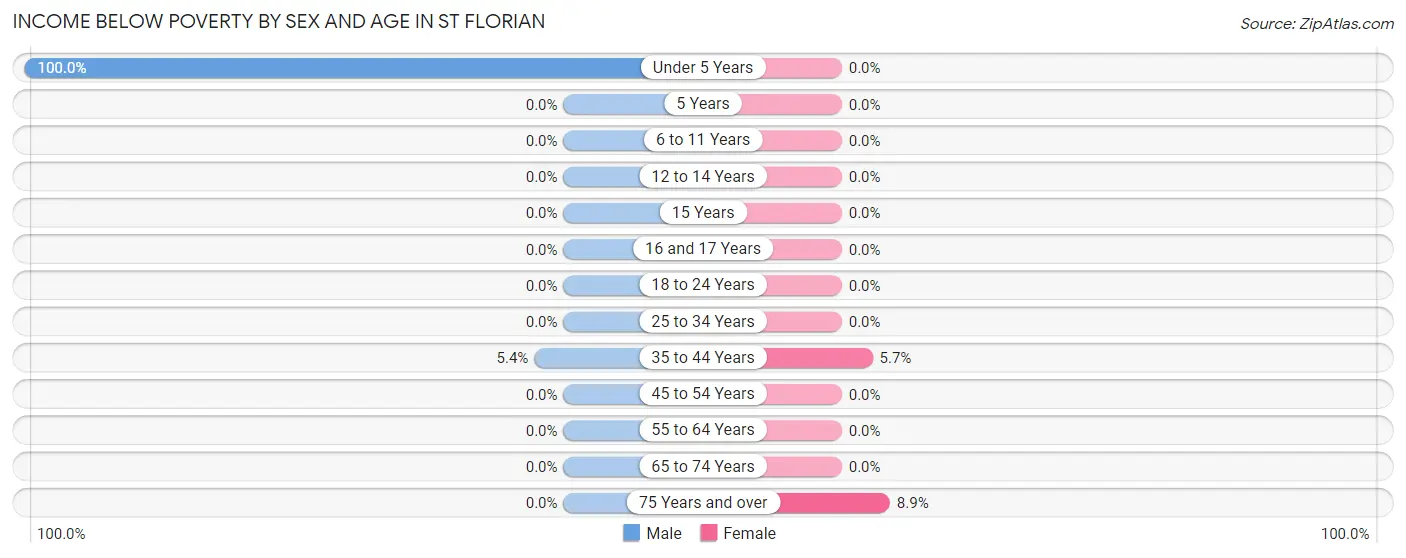
| Age Bracket | Male | Female |
| Under 5 Years | 1 (100.0%) | 0 (0.0%) |
| 5 Years | 0 (0.0%) | 0 (0.0%) |
| 6 to 11 Years | 0 (0.0%) | 0 (0.0%) |
| 12 to 14 Years | 0 (0.0%) | 0 (0.0%) |
| 15 Years | 0 (0.0%) | 0 (0.0%) |
| 16 and 17 Years | 0 (0.0%) | 0 (0.0%) |
| 18 to 24 Years | 0 (0.0%) | 0 (0.0%) |
| 25 to 34 Years | 0 (0.0%) | 0 (0.0%) |
| 35 to 44 Years | 2 (5.4%) | 2 (5.7%) |
| 45 to 54 Years | 0 (0.0%) | 0 (0.0%) |
| 55 to 64 Years | 0 (0.0%) | 0 (0.0%) |
| 65 to 74 Years | 0 (0.0%) | 0 (0.0%) |
| 75 Years and over | 0 (0.0%) | 5 (8.9%) |
| Total | 3 (1.0%) | 7 (2.2%) |
Income Above Poverty by Sex and Age in St Florian
According to the poverty statistics in St Florian, males aged 5 years and females aged 6 to 11 years are the age groups that are most secure financially, with 100.0% of males and 100.0% of females in these age groups living above the poverty line.
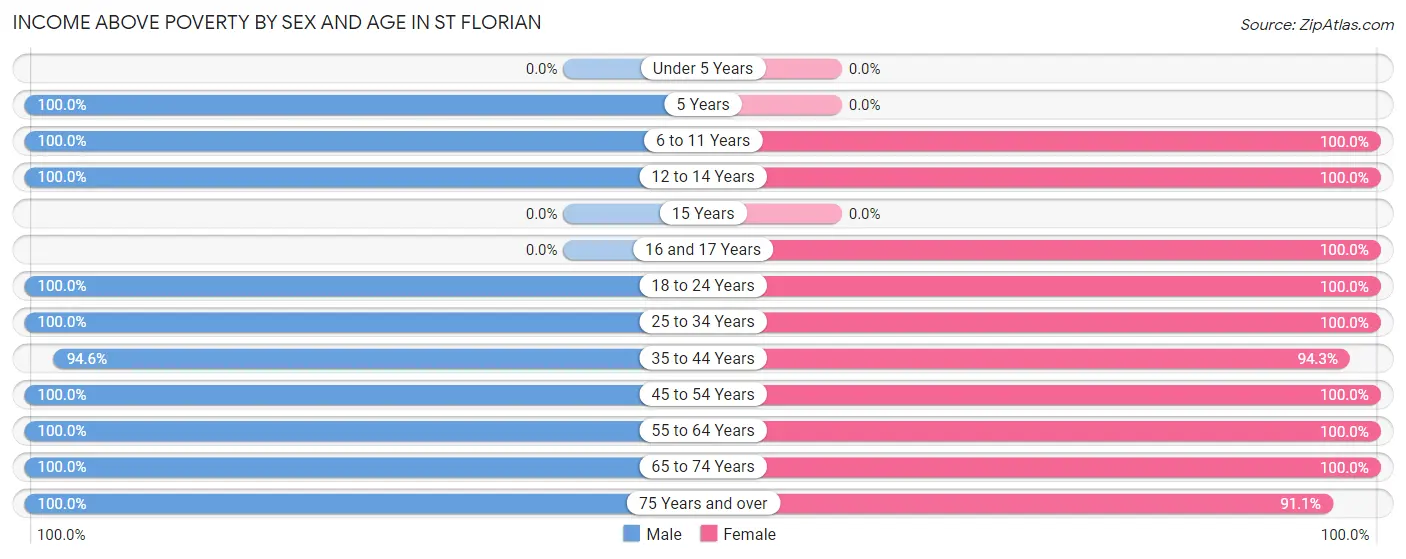
| Age Bracket | Male | Female |
| Under 5 Years | 0 (0.0%) | 0 (0.0%) |
| 5 Years | 7 (100.0%) | 0 (0.0%) |
| 6 to 11 Years | 30 (100.0%) | 27 (100.0%) |
| 12 to 14 Years | 2 (100.0%) | 10 (100.0%) |
| 15 Years | 0 (0.0%) | 0 (0.0%) |
| 16 and 17 Years | 0 (0.0%) | 7 (100.0%) |
| 18 to 24 Years | 31 (100.0%) | 28 (100.0%) |
| 25 to 34 Years | 19 (100.0%) | 16 (100.0%) |
| 35 to 44 Years | 35 (94.6%) | 33 (94.3%) |
| 45 to 54 Years | 29 (100.0%) | 24 (100.0%) |
| 55 to 64 Years | 55 (100.0%) | 37 (100.0%) |
| 65 to 74 Years | 45 (100.0%) | 83 (100.0%) |
| 75 Years and over | 57 (100.0%) | 51 (91.1%) |
| Total | 310 (99.0%) | 316 (97.8%) |
Income Below Poverty Among Married-Couple Families in St Florian
The poverty statistics for married-couple families in St Florian show that 1.4% or 2 of the total 140 families live below the poverty line. Families with 1 or 2 children have the highest poverty rate of 8.0%, comprising of 2 families. On the other hand, families with no children have the lowest poverty rate of 0.0%, which includes 0 families.
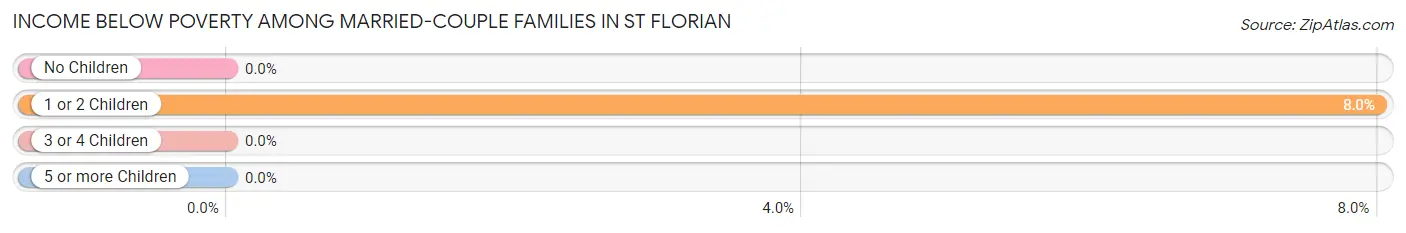
| Children | Above Poverty | Below Poverty |
| No Children | 103 (100.0%) | 0 (0.0%) |
| 1 or 2 Children | 23 (92.0%) | 2 (8.0%) |
| 3 or 4 Children | 12 (100.0%) | 0 (0.0%) |
| 5 or more Children | 0 (0.0%) | 0 (0.0%) |
| Total | 138 (98.6%) | 2 (1.4%) |
Income Below Poverty Among Single-Parent Households in St Florian
| Children | Single Father | Single Mother |
| No Children | 0 (0.0%) | 0 (0.0%) |
| 1 or 2 Children | 0 (0.0%) | 0 (0.0%) |
| 3 or 4 Children | 0 (0.0%) | 0 (0.0%) |
| 5 or more Children | 0 (0.0%) | 0 (0.0%) |
| Total | 0 (0.0%) | 0 (0.0%) |
Income Below Poverty Among Married-Couple vs Single-Parent Households in St Florian
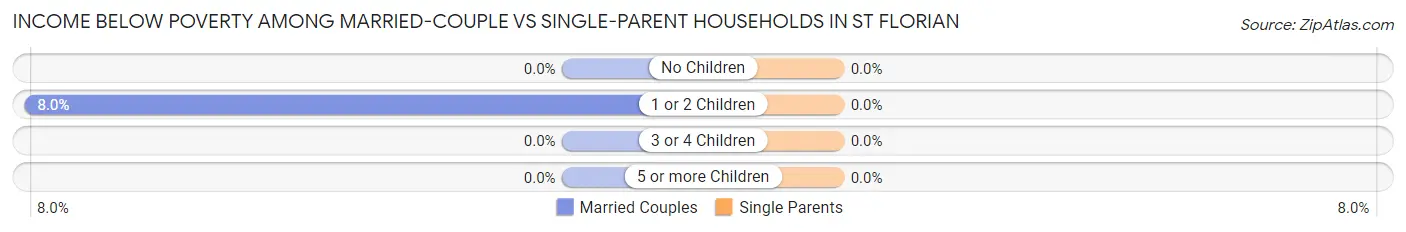
| Children | Married-Couple Families | Single-Parent Households |
| No Children | 0 (0.0%) | 0 (0.0%) |
| 1 or 2 Children | 2 (8.0%) | 0 (0.0%) |
| 3 or 4 Children | 0 (0.0%) | 0 (0.0%) |
| 5 or more Children | 0 (0.0%) | 0 (0.0%) |
| Total | 2 (1.4%) | 0 (0.0%) |
Race in St Florian
The most populous races in St Florian are White / Caucasian (621 | 97.6%), Hispanic or Latino (13 | 2.0%), and Two or more Races (11 | 1.7%).
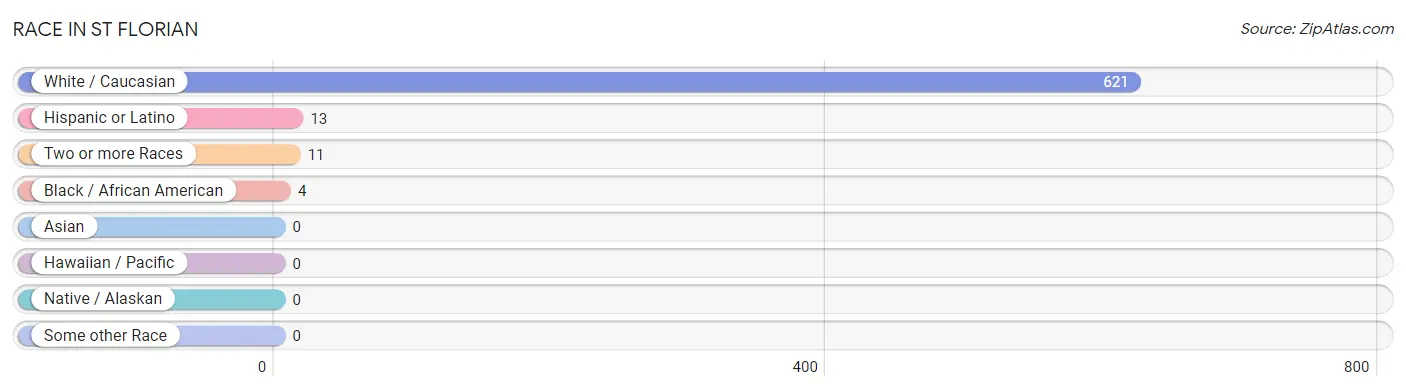
| Race | # Population | % Population |
| Asian | 0 | 0.0% |
| Black / African American | 4 | 0.6% |
| Hawaiian / Pacific | 0 | 0.0% |
| Hispanic or Latino | 13 | 2.0% |
| Native / Alaskan | 0 | 0.0% |
| White / Caucasian | 621 | 97.6% |
| Two or more Races | 11 | 1.7% |
| Some other Race | 0 | 0.0% |
| Total | 636 | 100.0% |
Ancestry in St Florian
The most populous ancestries reported in St Florian are German (137 | 21.5%), Irish (134 | 21.1%), English (112 | 17.6%), American (75 | 11.8%), and Welsh (25 | 3.9%), together accounting for 75.9% of all St Florian residents.
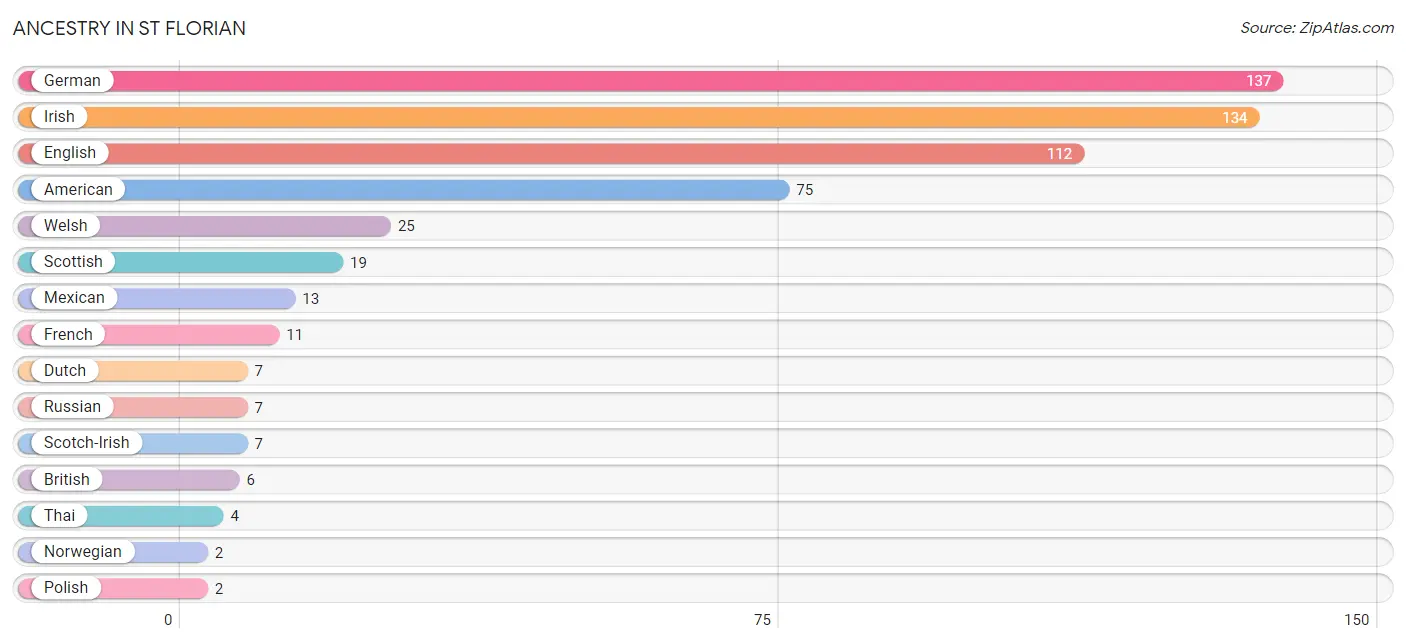
| Ancestry | # Population | % Population |
| American | 75 | 11.8% |
| British | 6 | 0.9% |
| Dutch | 7 | 1.1% |
| Eastern European | 1 | 0.2% |
| English | 112 | 17.6% |
| French | 11 | 1.7% |
| German | 137 | 21.5% |
| Irish | 134 | 21.1% |
| Italian | 1 | 0.2% |
| Mexican | 13 | 2.0% |
| Norwegian | 2 | 0.3% |
| Polish | 2 | 0.3% |
| Russian | 7 | 1.1% |
| Scotch-Irish | 7 | 1.1% |
| Scottish | 19 | 3.0% |
| Thai | 4 | 0.6% |
| Welsh | 25 | 3.9% | View All 17 Rows |
Immigrants in St Florian
The most numerous immigrant groups reported in St Florian came from Asia (2 | 0.3%), South Eastern Asia (2 | 0.3%), and Thailand (2 | 0.3%), together accounting for 0.9% of all St Florian residents.
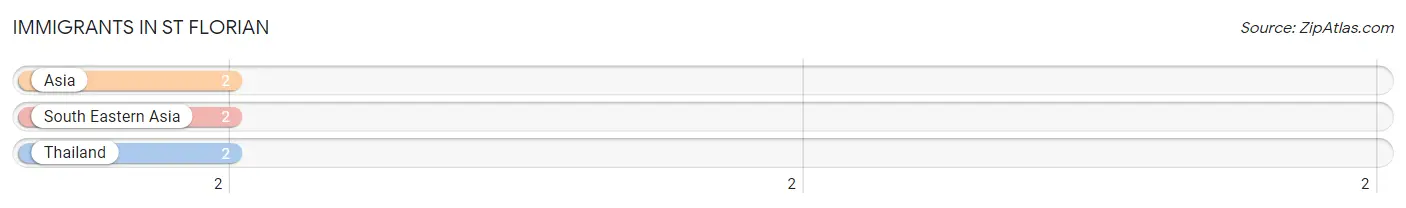
| Immigration Origin | # Population | % Population |
| Asia | 2 | 0.3% |
| South Eastern Asia | 2 | 0.3% |
| Thailand | 2 | 0.3% | View All 3 Rows |
Sex and Age in St Florian
Sex and Age in St Florian
The most populous age groups in St Florian are 55 to 59 Years (35 | 11.2%) for men and 70 to 74 Years (53 | 16.4%) for women.
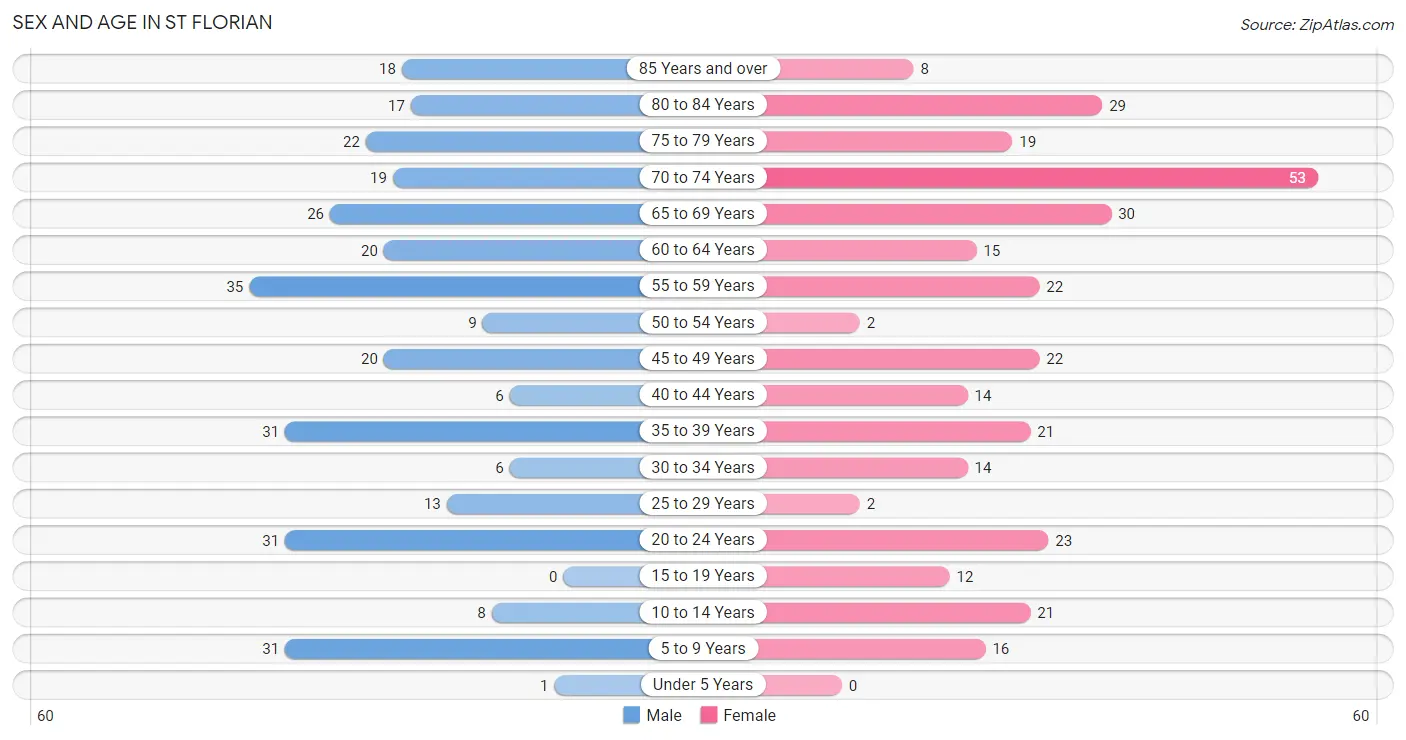
| Age Bracket | Male | Female |
| Under 5 Years | 1 (0.3%) | 0 (0.0%) |
| 5 to 9 Years | 31 (9.9%) | 16 (5.0%) |
| 10 to 14 Years | 8 (2.6%) | 21 (6.5%) |
| 15 to 19 Years | 0 (0.0%) | 12 (3.7%) |
| 20 to 24 Years | 31 (9.9%) | 23 (7.1%) |
| 25 to 29 Years | 13 (4.2%) | 2 (0.6%) |
| 30 to 34 Years | 6 (1.9%) | 14 (4.3%) |
| 35 to 39 Years | 31 (9.9%) | 21 (6.5%) |
| 40 to 44 Years | 6 (1.9%) | 14 (4.3%) |
| 45 to 49 Years | 20 (6.4%) | 22 (6.8%) |
| 50 to 54 Years | 9 (2.9%) | 2 (0.6%) |
| 55 to 59 Years | 35 (11.2%) | 22 (6.8%) |
| 60 to 64 Years | 20 (6.4%) | 15 (4.6%) |
| 65 to 69 Years | 26 (8.3%) | 30 (9.3%) |
| 70 to 74 Years | 19 (6.1%) | 53 (16.4%) |
| 75 to 79 Years | 22 (7.0%) | 19 (5.9%) |
| 80 to 84 Years | 17 (5.4%) | 29 (9.0%) |
| 85 Years and over | 18 (5.8%) | 8 (2.5%) |
| Total | 313 (100.0%) | 323 (100.0%) |
Families and Households in St Florian
Median Family Size in St Florian
The median family size in St Florian is 3.06 persons per family, with married-couple families (140 | 84.9%) accounting for the largest median family size of 3.19 persons per family. On the other hand, single female/mother families (23 | 13.9%) represent the smallest median family size with 2.30 persons per family.
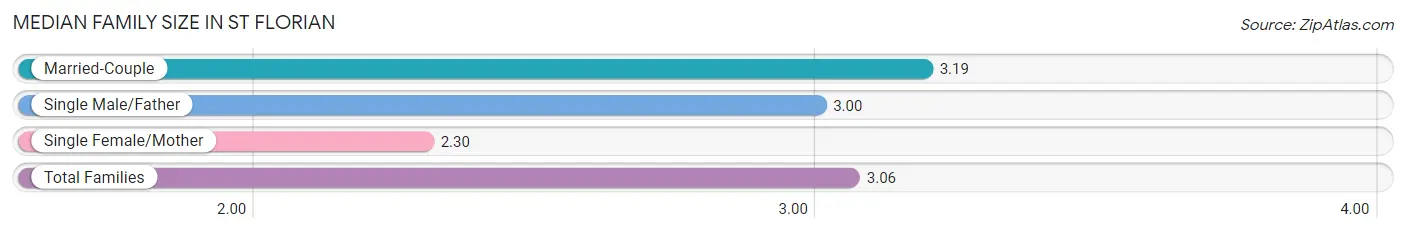
| Family Type | # Families | Family Size |
| Married-Couple | 140 (84.9%) | 3.19 |
| Single Male/Father | 2 (1.2%) | 3.00 |
| Single Female/Mother | 23 (13.9%) | 2.30 |
| Total Families | 165 (100.0%) | 3.06 |
Median Household Size in St Florian
The median household size in St Florian is 2.22 persons per household, with married-couple households (140 | 48.9%) accounting for the largest median household size of 3.19 persons per household. non-family households (121 | 42.3%) represent the smallest median household size with 1.05 persons per household.
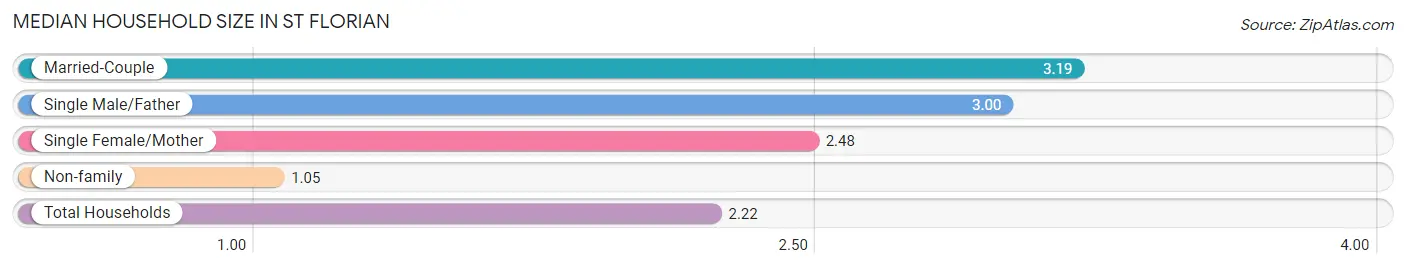
| Household Type | # Households | Household Size |
| Married-Couple | 140 (48.9%) | 3.19 |
| Single Male/Father | 2 (0.7%) | 3.00 |
| Single Female/Mother | 23 (8.0%) | 2.48 |
| Non-family | 121 (42.3%) | 1.05 |
| Total Households | 286 (100.0%) | 2.22 |
Household Size by Marriage Status in St Florian
Out of a total of 286 households in St Florian, 165 (57.7%) are family households, while 121 (42.3%) are nonfamily households. The most numerous type of family households are 2-person households, comprising 93, and the most common type of nonfamily households are 1-person households, comprising 115.
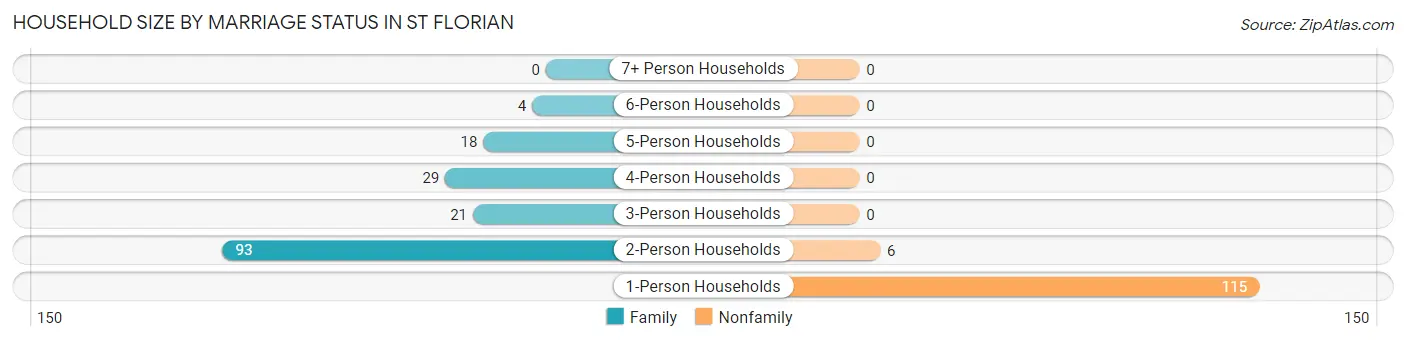
| Household Size | Family Households | Nonfamily Households |
| 1-Person Households | - | 115 (40.2%) |
| 2-Person Households | 93 (32.5%) | 6 (2.1%) |
| 3-Person Households | 21 (7.3%) | 0 (0.0%) |
| 4-Person Households | 29 (10.1%) | 0 (0.0%) |
| 5-Person Households | 18 (6.3%) | 0 (0.0%) |
| 6-Person Households | 4 (1.4%) | 0 (0.0%) |
| 7+ Person Households | 0 (0.0%) | 0 (0.0%) |
| Total | 165 (57.7%) | 121 (42.3%) |
Female Fertility in St Florian
Fertility by Age in St Florian
| Age Bracket | Women with Births | Births / 1,000 Women |
| 15 to 19 years | 0 (0.0%) | 0.0 |
| 20 to 34 years | 0 (0.0%) | 0.0 |
| 35 to 50 years | 0 (0.0%) | 0.0 |
| Total | 0 (0.0%) | 0.0 |
Fertility by Age by Marriage Status in St Florian
| Age Bracket | Married | Unmarried |
| 15 to 19 years | 0 (0.0%) | 0 (0.0%) |
| 20 to 34 years | 0 (0.0%) | 0 (0.0%) |
| 35 to 50 years | 0 (0.0%) | 0 (0.0%) |
| Total | 0 (0.0%) | 0 (0.0%) |
Fertility by Education in St Florian
| Educational Attainment | Women with Births | Births / 1,000 Women |
| Less than High School | 0 (0.0%) | 0.0 |
| High School Diploma | 0 (0.0%) | 0.0 |
| College or Associate's Degree | 0 (0.0%) | 0.0 |
| Bachelor's Degree | 0 (0.0%) | 0.0 |
| Graduate Degree | 0 (0.0%) | 0.0 |
| Total | 0 (0.0%) | 0.0 |
Fertility by Education by Marriage Status in St Florian
| Educational Attainment | Married | Unmarried |
| Less than High School | 0 (0.0%) | 0 (0.0%) |
| High School Diploma | 0 (0.0%) | 0 (0.0%) |
| College or Associate's Degree | 0 (0.0%) | 0 (0.0%) |
| Bachelor's Degree | 0 (0.0%) | 0 (0.0%) |
| Graduate Degree | 0 (0.0%) | 0 (0.0%) |
| Total | 0 (0.0%) | 0 (0.0%) |
Employment Characteristics in St Florian
Employment by Class of Employer in St Florian
Among the 277 employed individuals in St Florian, private company employees (203 | 73.3%), local government employees (30 | 10.8%), and self-employed (not incorporated) (17 | 6.1%) make up the most common classes of employment.
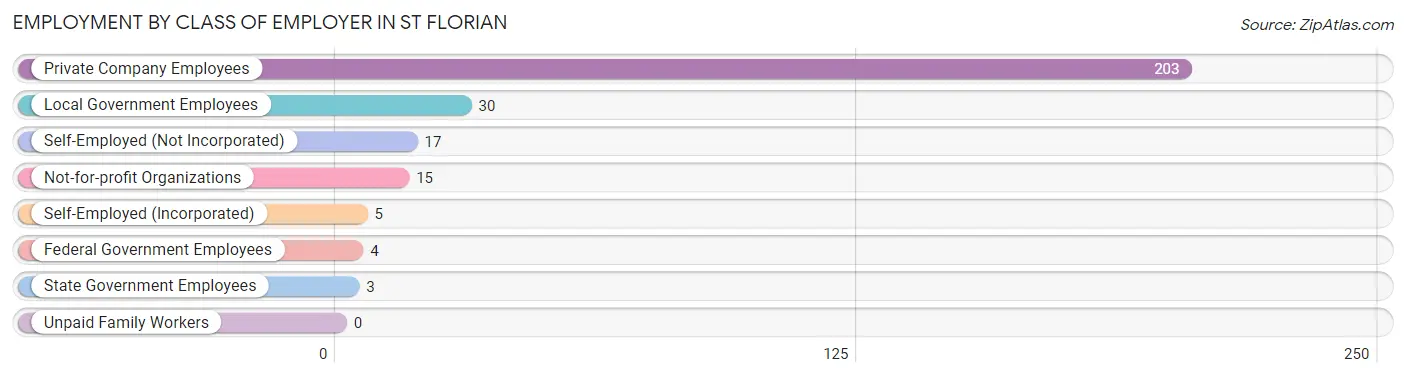
| Employer Class | # Employees | % Employees |
| Private Company Employees | 203 | 73.3% |
| Self-Employed (Incorporated) | 5 | 1.8% |
| Self-Employed (Not Incorporated) | 17 | 6.1% |
| Not-for-profit Organizations | 15 | 5.4% |
| Local Government Employees | 30 | 10.8% |
| State Government Employees | 3 | 1.1% |
| Federal Government Employees | 4 | 1.4% |
| Unpaid Family Workers | 0 | 0.0% |
| Total | 277 | 100.0% |
Employment Status by Age in St Florian
According to the labor force statistics for St Florian, out of the total population over 16 years of age (559), 51.9% or 290 individuals are in the labor force, with 4.5% or 13 of them unemployed. The age group with the highest labor force participation rate is 20 to 24 years, with 100.0% or 54 individuals in the labor force. Within the labor force, the 35 to 44 years age range has the highest percentage of unemployed individuals, with 26.0% or 13 of them being unemployed.
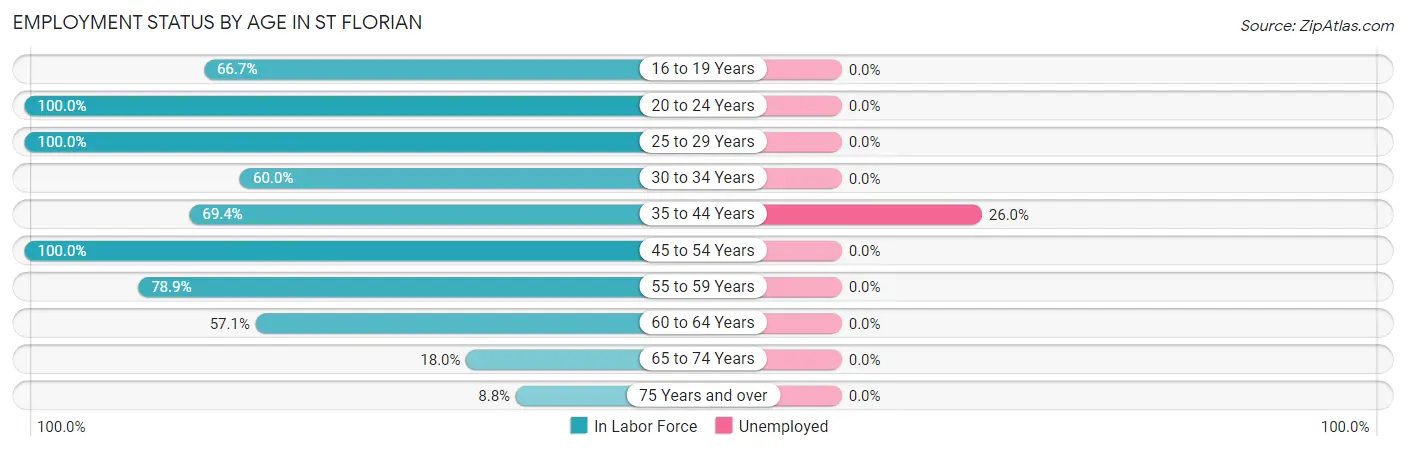
| Age Bracket | In Labor Force | Unemployed |
| 16 to 19 Years | 8 (66.7%) | 0 (0.0%) |
| 20 to 24 Years | 54 (100.0%) | 0 (0.0%) |
| 25 to 29 Years | 15 (100.0%) | 0 (0.0%) |
| 30 to 34 Years | 12 (60.0%) | 0 (0.0%) |
| 35 to 44 Years | 50 (69.4%) | 13 (26.0%) |
| 45 to 54 Years | 53 (100.0%) | 0 (0.0%) |
| 55 to 59 Years | 45 (78.9%) | 0 (0.0%) |
| 60 to 64 Years | 20 (57.1%) | 0 (0.0%) |
| 65 to 74 Years | 23 (18.0%) | 0 (0.0%) |
| 75 Years and over | 10 (8.8%) | 0 (0.0%) |
| Total | 290 (51.9%) | 13 (4.5%) |
Employment Status by Educational Attainment in St Florian
According to labor force statistics for St Florian, 77.4% of individuals (195) out of the total population between 25 and 64 years of age (252) are in the labor force, with 6.7% or 13 of them being unemployed. The group with the highest labor force participation rate are those with the educational attainment of college / associate degree, with 93.6% or 44 individuals in the labor force. Within the labor force, individuals with high school diploma education have the highest percentage of unemployment, with 15.0% or 9 of them being unemployed.
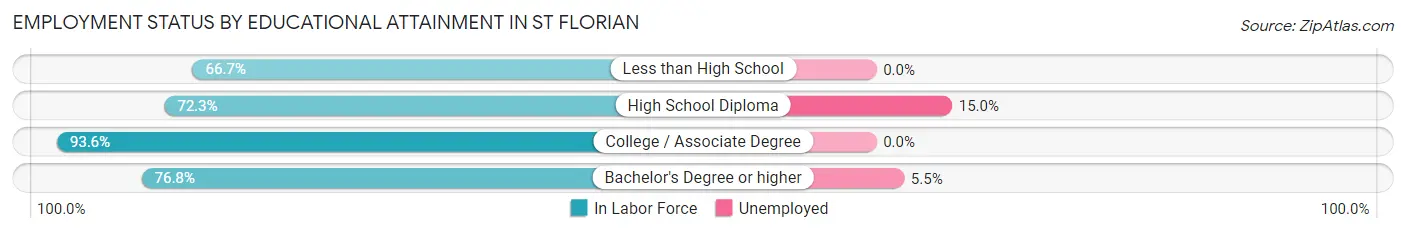
| Educational Attainment | In Labor Force | Unemployed |
| Less than High School | 18 (66.7%) | 0 (0.0%) |
| High School Diploma | 60 (72.3%) | 12 (15.0%) |
| College / Associate Degree | 44 (93.6%) | 0 (0.0%) |
| Bachelor's Degree or higher | 73 (76.8%) | 5 (5.5%) |
| Total | 195 (77.4%) | 17 (6.7%) |
Employment Occupations by Sex in St Florian
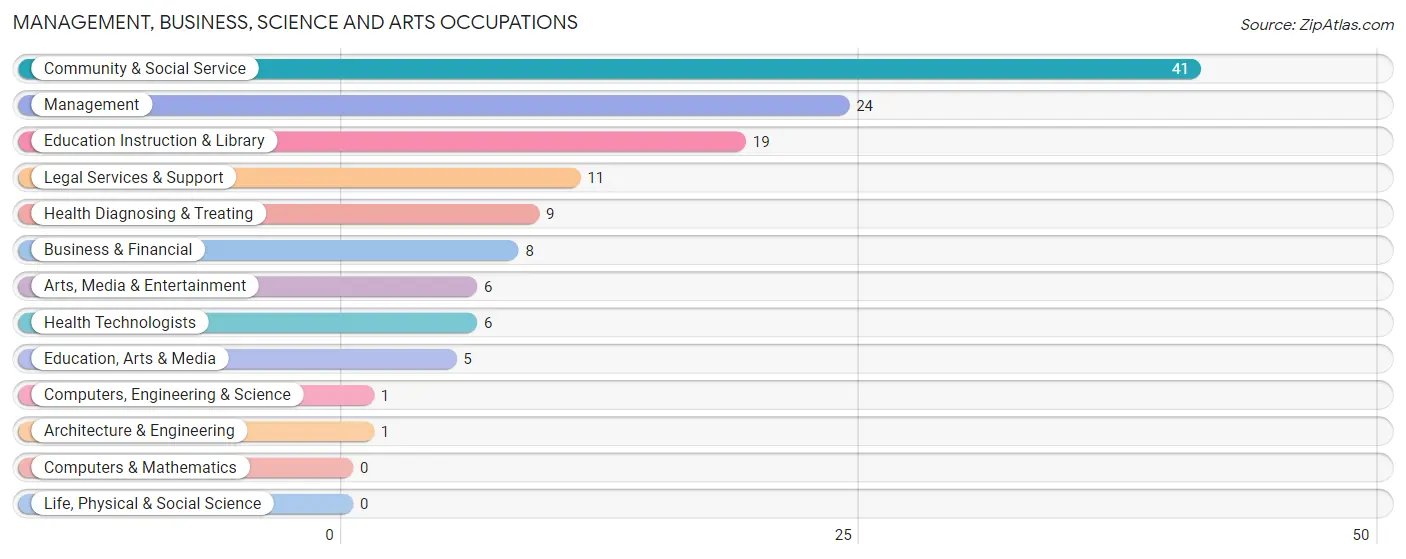
Management, Business, Science and Arts Occupations
The most common Management, Business, Science and Arts occupations in St Florian are Community & Social Service (41 | 14.8%), Management (24 | 8.7%), Education Instruction & Library (19 | 6.9%), Legal Services & Support (11 | 4.0%), and Health Diagnosing & Treating (9 | 3.3%).
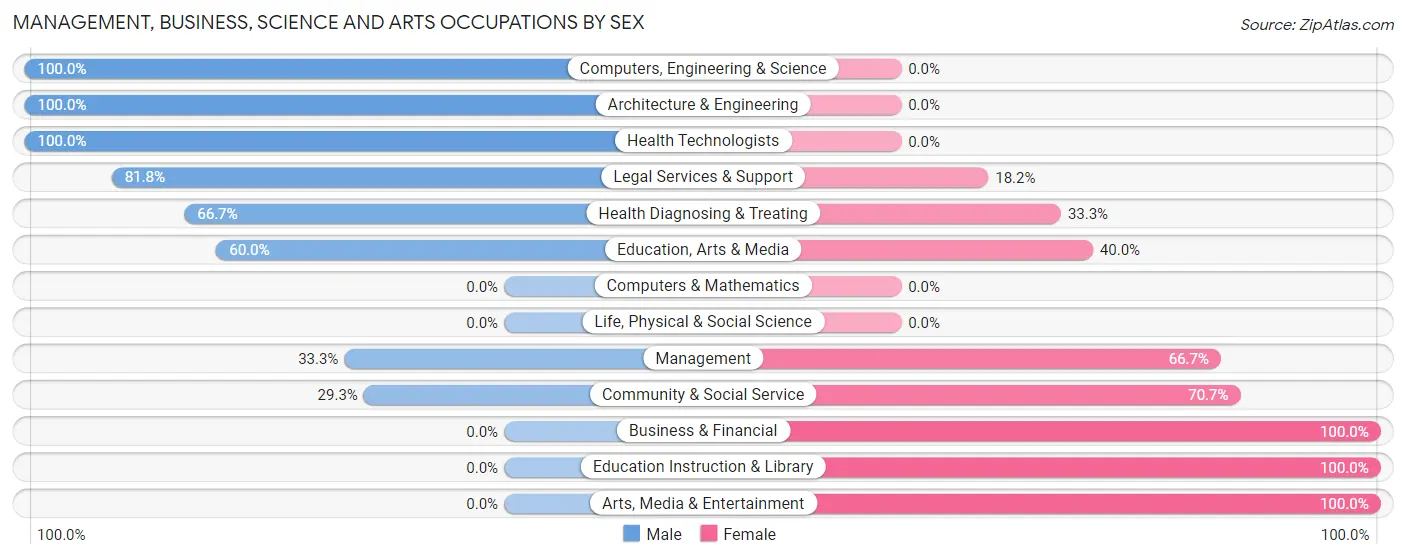
Management, Business, Science and Arts Occupations by Sex
Within the Management, Business, Science and Arts occupations in St Florian, the most male-oriented occupations are Computers, Engineering & Science (100.0%), Architecture & Engineering (100.0%), and Health Technologists (100.0%), while the most female-oriented occupations are Business & Financial (100.0%), Education Instruction & Library (100.0%), and Arts, Media & Entertainment (100.0%).
| Occupation | Male | Female |
| Management | 8 (33.3%) | 16 (66.7%) |
| Business & Financial | 0 (0.0%) | 8 (100.0%) |
| Computers, Engineering & Science | 1 (100.0%) | 0 (0.0%) |
| Computers & Mathematics | 0 (0.0%) | 0 (0.0%) |
| Architecture & Engineering | 1 (100.0%) | 0 (0.0%) |
| Life, Physical & Social Science | 0 (0.0%) | 0 (0.0%) |
| Community & Social Service | 12 (29.3%) | 29 (70.7%) |
| Education, Arts & Media | 3 (60.0%) | 2 (40.0%) |
| Legal Services & Support | 9 (81.8%) | 2 (18.2%) |
| Education Instruction & Library | 0 (0.0%) | 19 (100.0%) |
| Arts, Media & Entertainment | 0 (0.0%) | 6 (100.0%) |
| Health Diagnosing & Treating | 6 (66.7%) | 3 (33.3%) |
| Health Technologists | 6 (100.0%) | 0 (0.0%) |
| Total (Category) | 27 (32.5%) | 56 (67.5%) |
| Total (Overall) | 144 (52.0%) | 133 (48.0%) |
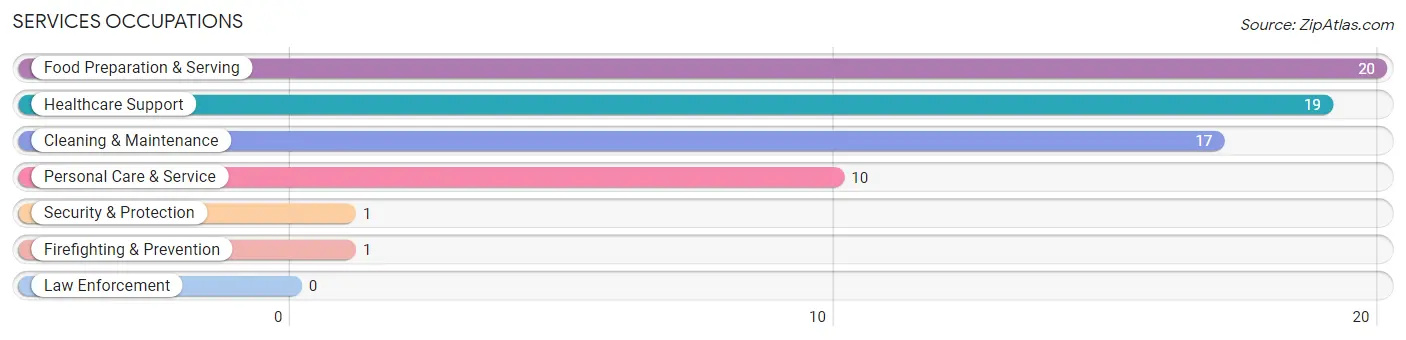
Services Occupations
The most common Services occupations in St Florian are Food Preparation & Serving (20 | 7.2%), Healthcare Support (19 | 6.9%), Cleaning & Maintenance (17 | 6.1%), Personal Care & Service (10 | 3.6%), and Security & Protection (1 | 0.4%).
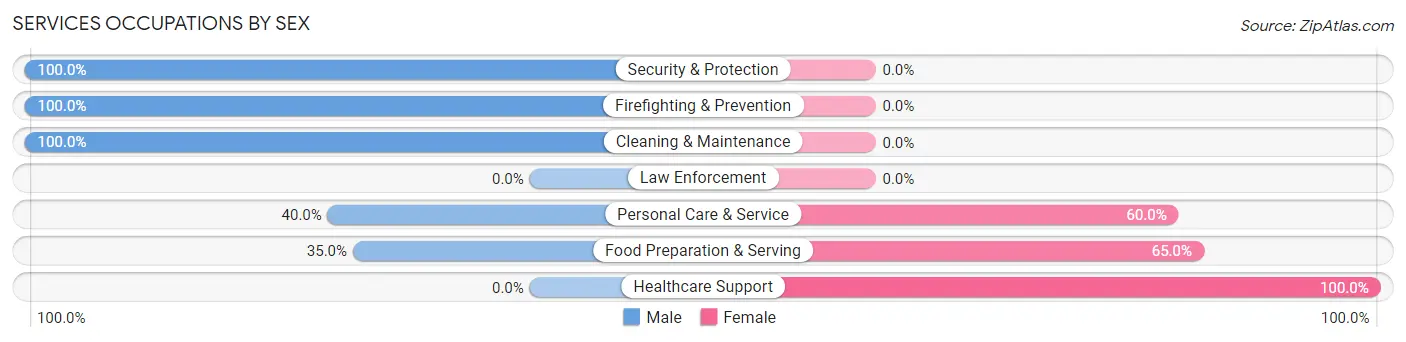
Services Occupations by Sex
Within the Services occupations in St Florian, the most male-oriented occupations are Security & Protection (100.0%), Firefighting & Prevention (100.0%), and Cleaning & Maintenance (100.0%), while the most female-oriented occupations are Healthcare Support (100.0%), Food Preparation & Serving (65.0%), and Personal Care & Service (60.0%).
| Occupation | Male | Female |
| Healthcare Support | 0 (0.0%) | 19 (100.0%) |
| Security & Protection | 1 (100.0%) | 0 (0.0%) |
| Firefighting & Prevention | 1 (100.0%) | 0 (0.0%) |
| Law Enforcement | 0 (0.0%) | 0 (0.0%) |
| Food Preparation & Serving | 7 (35.0%) | 13 (65.0%) |
| Cleaning & Maintenance | 17 (100.0%) | 0 (0.0%) |
| Personal Care & Service | 4 (40.0%) | 6 (60.0%) |
| Total (Category) | 29 (43.3%) | 38 (56.7%) |
| Total (Overall) | 144 (52.0%) | 133 (48.0%) |
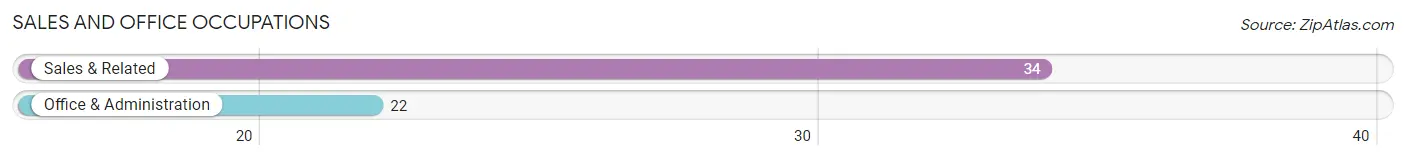
Sales and Office Occupations
The most common Sales and Office occupations in St Florian are Sales & Related (34 | 12.3%), and Office & Administration (22 | 7.9%).
Sales and Office Occupations by Sex
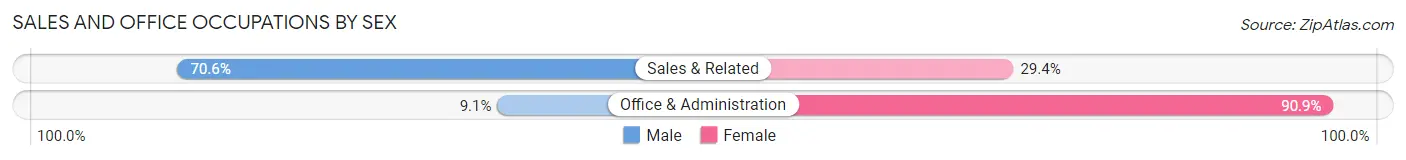
| Occupation | Male | Female |
| Sales & Related | 24 (70.6%) | 10 (29.4%) |
| Office & Administration | 2 (9.1%) | 20 (90.9%) |
| Total (Category) | 26 (46.4%) | 30 (53.6%) |
| Total (Overall) | 144 (52.0%) | 133 (48.0%) |
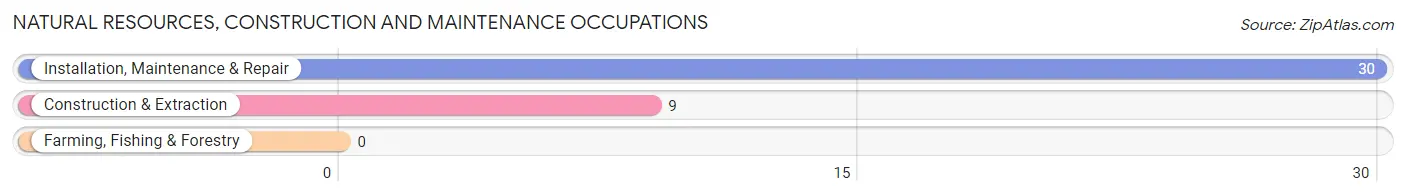
Natural Resources, Construction and Maintenance Occupations
The most common Natural Resources, Construction and Maintenance occupations in St Florian are Installation, Maintenance & Repair (30 | 10.8%), and Construction & Extraction (9 | 3.3%).
Natural Resources, Construction and Maintenance Occupations by Sex
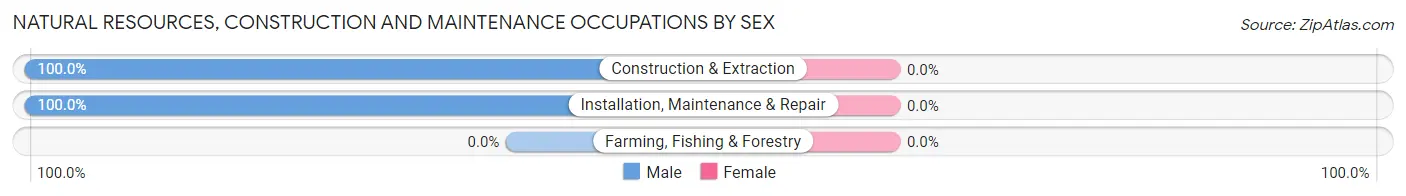
| Occupation | Male | Female |
| Farming, Fishing & Forestry | 0 (0.0%) | 0 (0.0%) |
| Construction & Extraction | 9 (100.0%) | 0 (0.0%) |
| Installation, Maintenance & Repair | 30 (100.0%) | 0 (0.0%) |
| Total (Category) | 39 (100.0%) | 0 (0.0%) |
| Total (Overall) | 144 (52.0%) | 133 (48.0%) |
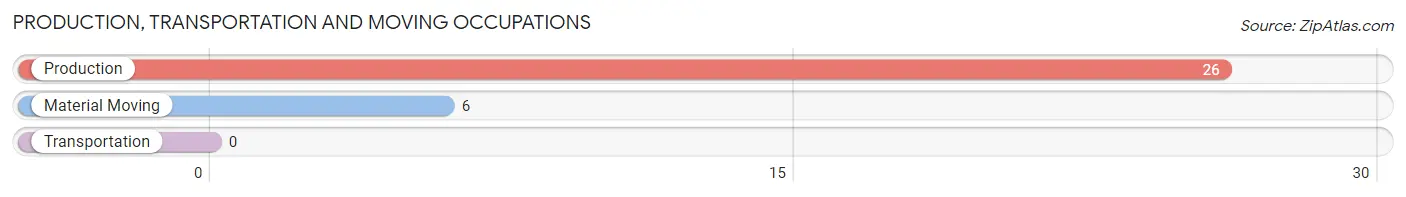
Production, Transportation and Moving Occupations
The most common Production, Transportation and Moving occupations in St Florian are Production (26 | 9.4%), and Material Moving (6 | 2.2%).
Production, Transportation and Moving Occupations by Sex
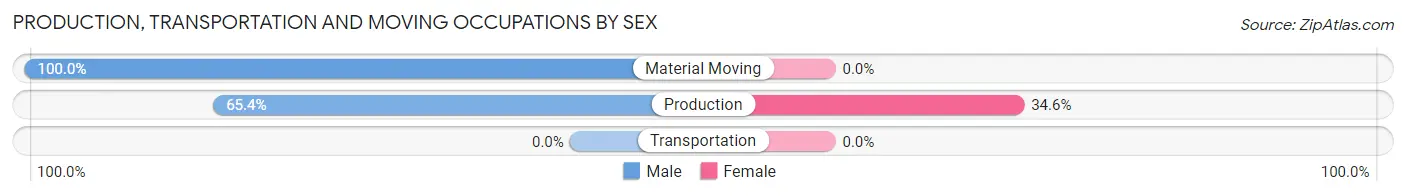
| Occupation | Male | Female |
| Production | 17 (65.4%) | 9 (34.6%) |
| Transportation | 0 (0.0%) | 0 (0.0%) |
| Material Moving | 6 (100.0%) | 0 (0.0%) |
| Total (Category) | 23 (71.9%) | 9 (28.1%) |
| Total (Overall) | 144 (52.0%) | 133 (48.0%) |
Employment Industries by Sex in St Florian
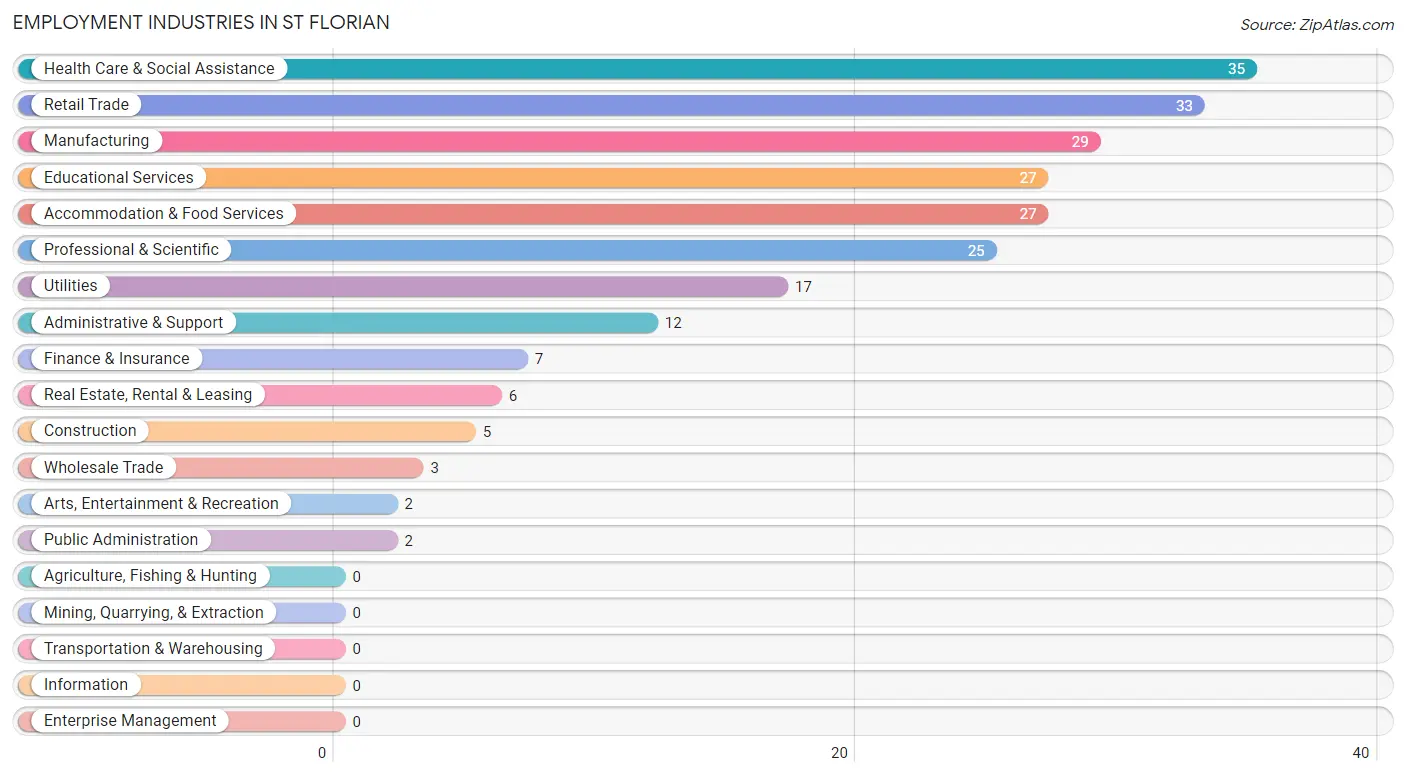
Employment Industries in St Florian
The major employment industries in St Florian include Health Care & Social Assistance (35 | 12.6%), Retail Trade (33 | 11.9%), Manufacturing (29 | 10.5%), Educational Services (27 | 9.8%), and Accommodation & Food Services (27 | 9.8%).
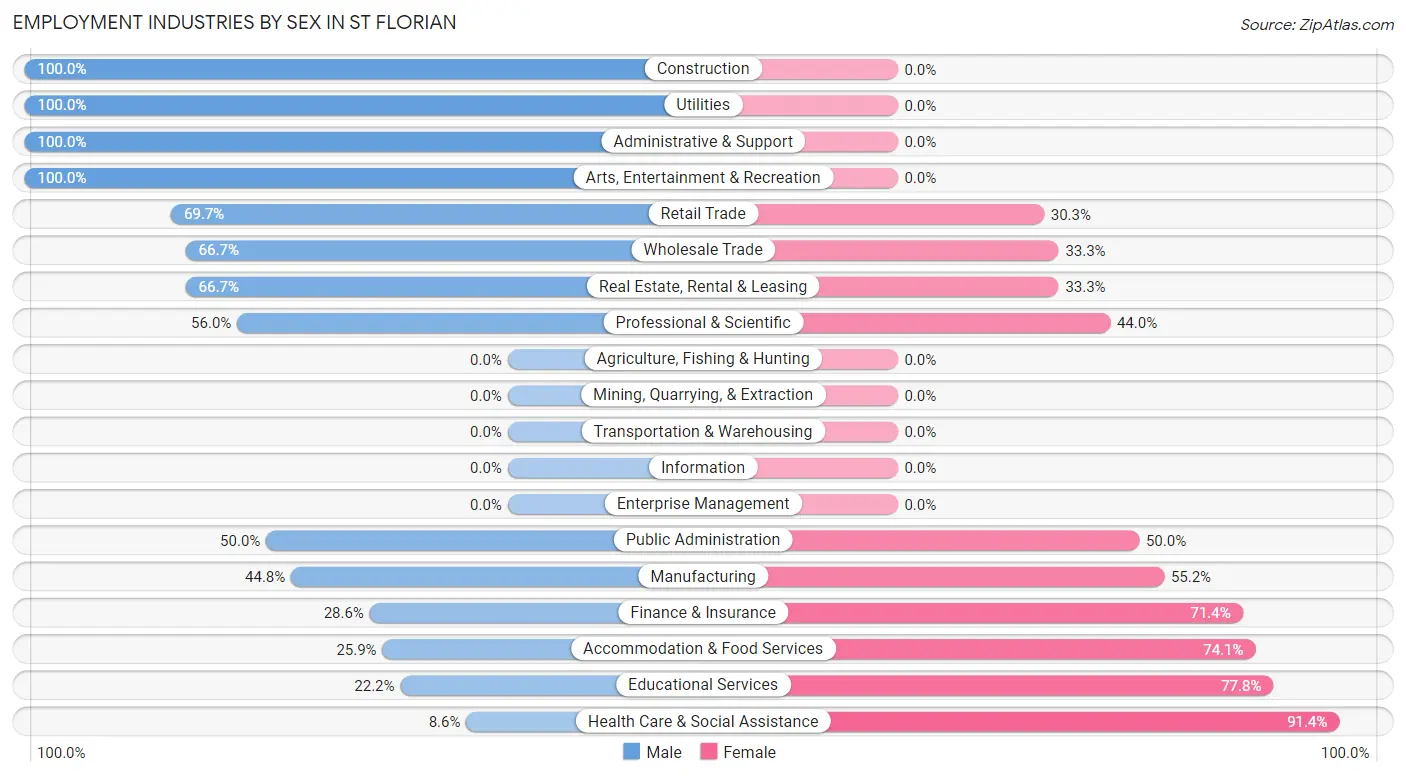
Employment Industries by Sex in St Florian
The St Florian industries that see more men than women are Construction (100.0%), Utilities (100.0%), and Administrative & Support (100.0%), whereas the industries that tend to have a higher number of women are Health Care & Social Assistance (91.4%), Educational Services (77.8%), and Accommodation & Food Services (74.1%).
| Industry | Male | Female |
| Agriculture, Fishing & Hunting | 0 (0.0%) | 0 (0.0%) |
| Mining, Quarrying, & Extraction | 0 (0.0%) | 0 (0.0%) |
| Construction | 5 (100.0%) | 0 (0.0%) |
| Manufacturing | 13 (44.8%) | 16 (55.2%) |
| Wholesale Trade | 2 (66.7%) | 1 (33.3%) |
| Retail Trade | 23 (69.7%) | 10 (30.3%) |
| Transportation & Warehousing | 0 (0.0%) | 0 (0.0%) |
| Utilities | 17 (100.0%) | 0 (0.0%) |
| Information | 0 (0.0%) | 0 (0.0%) |
| Finance & Insurance | 2 (28.6%) | 5 (71.4%) |
| Real Estate, Rental & Leasing | 4 (66.7%) | 2 (33.3%) |
| Professional & Scientific | 14 (56.0%) | 11 (44.0%) |
| Enterprise Management | 0 (0.0%) | 0 (0.0%) |
| Administrative & Support | 12 (100.0%) | 0 (0.0%) |
| Educational Services | 6 (22.2%) | 21 (77.8%) |
| Health Care & Social Assistance | 3 (8.6%) | 32 (91.4%) |
| Arts, Entertainment & Recreation | 2 (100.0%) | 0 (0.0%) |
| Accommodation & Food Services | 7 (25.9%) | 20 (74.1%) |
| Public Administration | 1 (50.0%) | 1 (50.0%) |
| Total | 144 (52.0%) | 133 (48.0%) |
Education in St Florian
School Enrollment in St Florian
The most common levels of schooling among the 100 students in St Florian are elementary school (46 | 46.0%), middle school (25 | 25.0%), and college / undergraduate (17 | 17.0%).
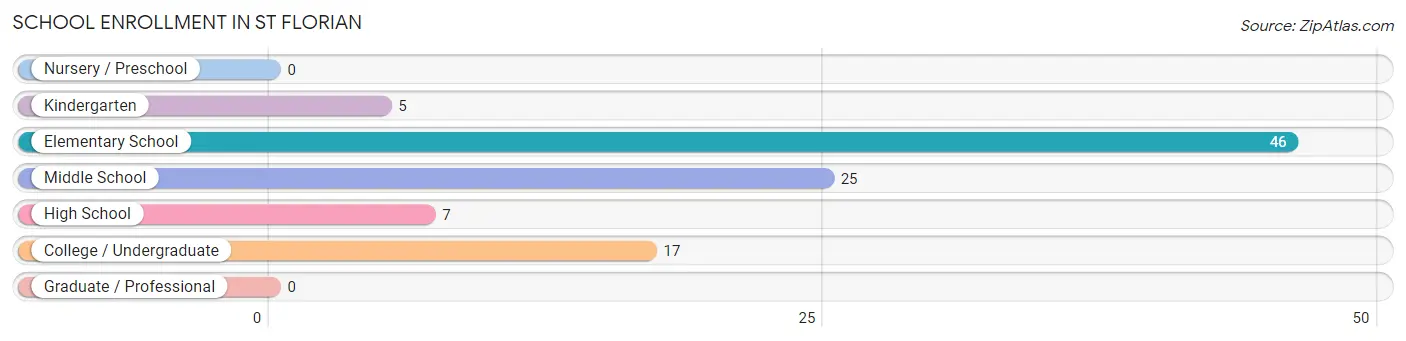
| School Level | # Students | % Students |
| Nursery / Preschool | 0 | 0.0% |
| Kindergarten | 5 | 5.0% |
| Elementary School | 46 | 46.0% |
| Middle School | 25 | 25.0% |
| High School | 7 | 7.0% |
| College / Undergraduate | 17 | 17.0% |
| Graduate / Professional | 0 | 0.0% |
| Total | 100 | 100.0% |
School Enrollment by Age by Funding Source in St Florian
Out of a total of 100 students who are enrolled in schools in St Florian, 28 (28.0%) attend a private institution, while the remaining 72 (72.0%) are enrolled in public schools. The age group of 10 to 14 year olds has the highest likelihood of being enrolled in private schools, with 16 (55.2% in the age bracket) enrolled. Conversely, the age group of 18 to 19 year olds has the lowest likelihood of being enrolled in a private school, with 5 (100.0% in the age bracket) attending a public institution.
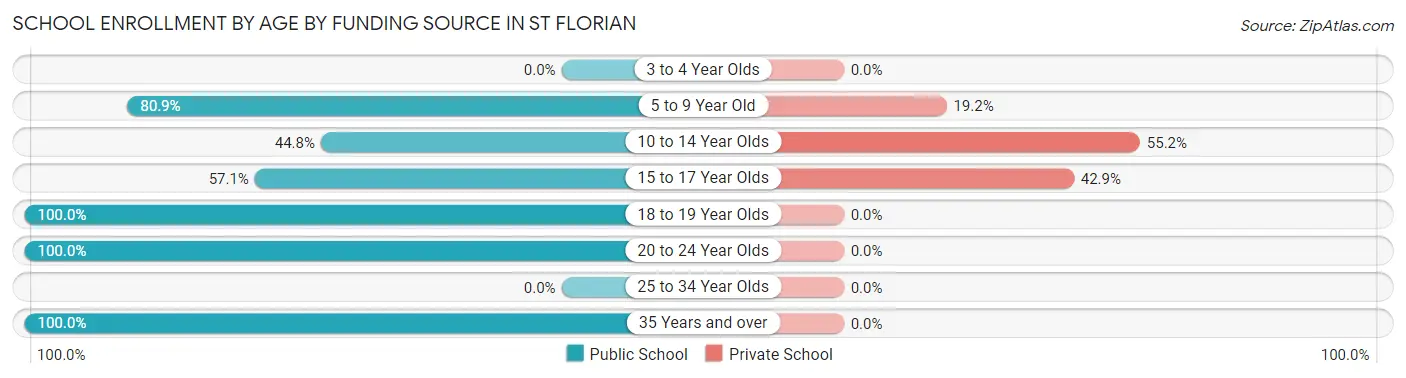
| Age Bracket | Public School | Private School |
| 3 to 4 Year Olds | 0 (0.0%) | 0 (0.0%) |
| 5 to 9 Year Old | 38 (80.8%) | 9 (19.2%) |
| 10 to 14 Year Olds | 13 (44.8%) | 16 (55.2%) |
| 15 to 17 Year Olds | 4 (57.1%) | 3 (42.9%) |
| 18 to 19 Year Olds | 5 (100.0%) | 0 (0.0%) |
| 20 to 24 Year Olds | 9 (100.0%) | 0 (0.0%) |
| 25 to 34 Year Olds | 0 (0.0%) | 0 (0.0%) |
| 35 Years and over | 3 (100.0%) | 0 (0.0%) |
| Total | 72 (72.0%) | 28 (28.0%) |
Educational Attainment by Field of Study in St Florian
Business (47 | 31.1%), education (30 | 19.9%), communications (20 | 13.3%), bio, nature & agricultural (14 | 9.3%), and visual & performing arts (10 | 6.6%) are the most common fields of study among 151 individuals in St Florian who have obtained a bachelor's degree or higher.
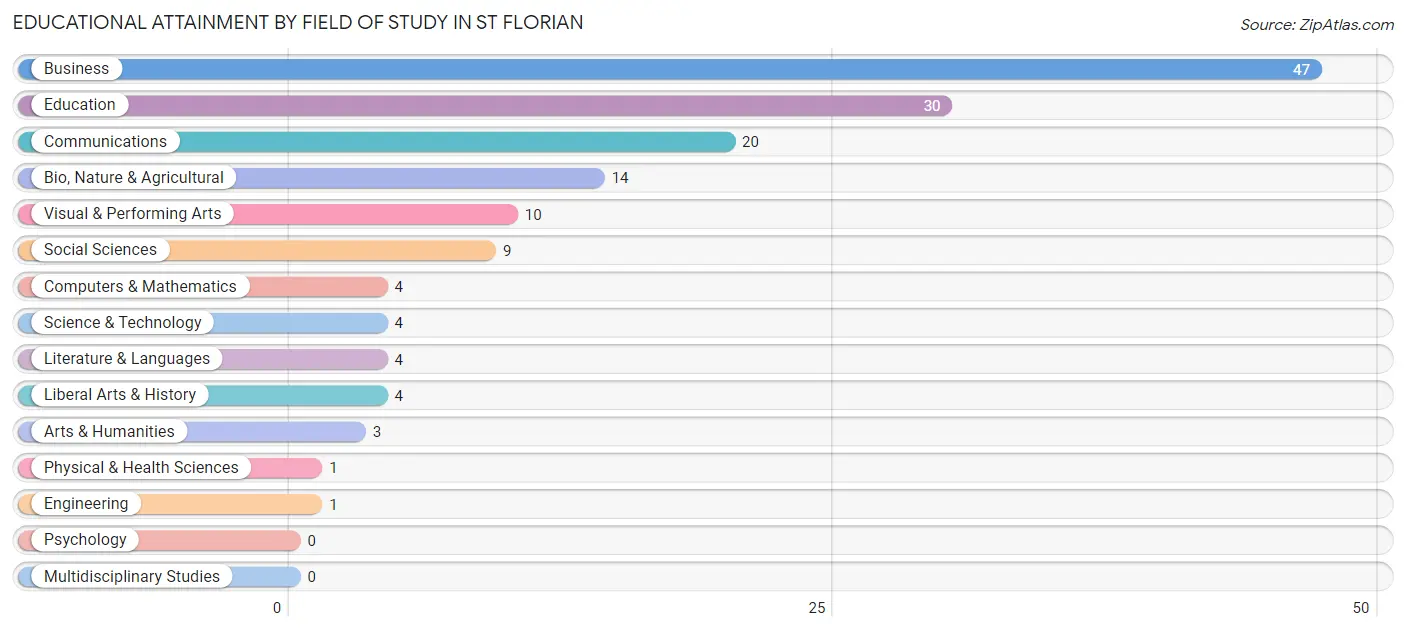
| Field of Study | # Graduates | % Graduates |
| Computers & Mathematics | 4 | 2.6% |
| Bio, Nature & Agricultural | 14 | 9.3% |
| Physical & Health Sciences | 1 | 0.7% |
| Psychology | 0 | 0.0% |
| Social Sciences | 9 | 6.0% |
| Engineering | 1 | 0.7% |
| Multidisciplinary Studies | 0 | 0.0% |
| Science & Technology | 4 | 2.6% |
| Business | 47 | 31.1% |
| Education | 30 | 19.9% |
| Literature & Languages | 4 | 2.6% |
| Liberal Arts & History | 4 | 2.6% |
| Visual & Performing Arts | 10 | 6.6% |
| Communications | 20 | 13.3% |
| Arts & Humanities | 3 | 2.0% |
| Total | 151 | 100.0% |
Transportation & Commute in St Florian
Vehicle Availability by Sex in St Florian
The most prevalent vehicle ownership categories in St Florian are males with 3 vehicles (65, accounting for 45.1%) and females with 3 vehicles (33, making up 48.9%).
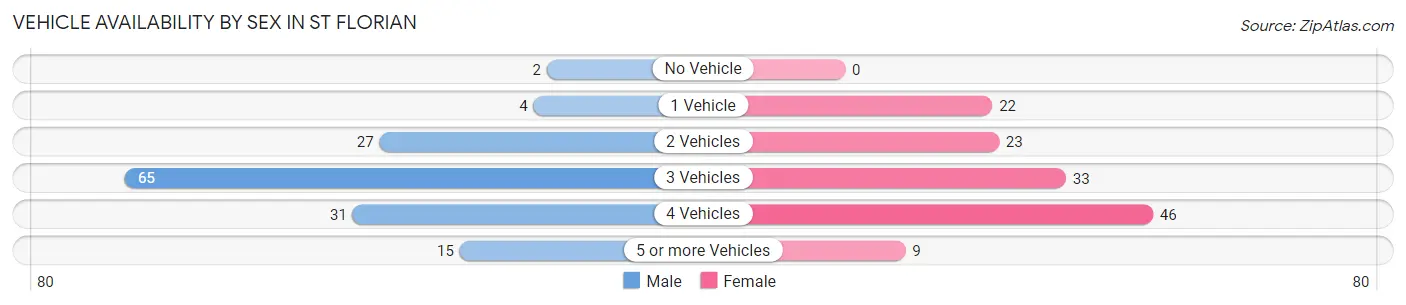
| Vehicles Available | Male | Female |
| No Vehicle | 2 (1.4%) | 0 (0.0%) |
| 1 Vehicle | 4 (2.8%) | 22 (16.5%) |
| 2 Vehicles | 27 (18.8%) | 23 (17.3%) |
| 3 Vehicles | 65 (45.1%) | 33 (24.8%) |
| 4 Vehicles | 31 (21.5%) | 46 (34.6%) |
| 5 or more Vehicles | 15 (10.4%) | 9 (6.8%) |
| Total | 144 (100.0%) | 133 (100.0%) |
Commute Time in St Florian
The most frequently occuring commute durations in St Florian are 10 to 14 minutes (95 commuters, 37.2%), 15 to 19 minutes (51 commuters, 20.0%), and 30 to 34 minutes (40 commuters, 15.7%).
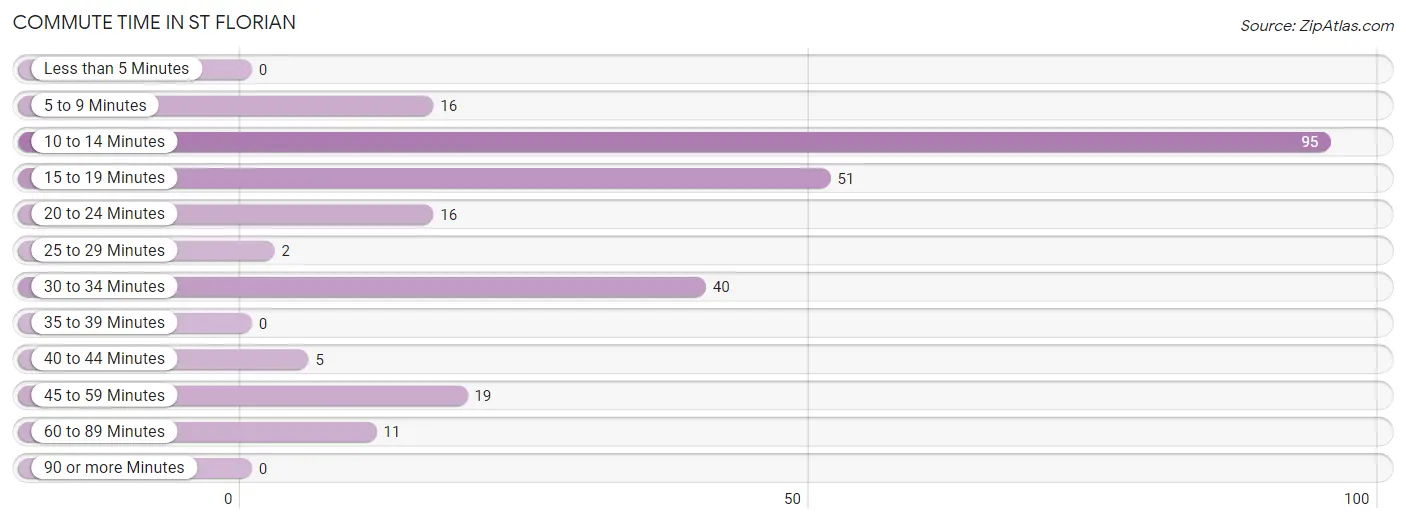
| Commute Time | # Commuters | % Commuters |
| Less than 5 Minutes | 0 | 0.0% |
| 5 to 9 Minutes | 16 | 6.3% |
| 10 to 14 Minutes | 95 | 37.2% |
| 15 to 19 Minutes | 51 | 20.0% |
| 20 to 24 Minutes | 16 | 6.3% |
| 25 to 29 Minutes | 2 | 0.8% |
| 30 to 34 Minutes | 40 | 15.7% |
| 35 to 39 Minutes | 0 | 0.0% |
| 40 to 44 Minutes | 5 | 2.0% |
| 45 to 59 Minutes | 19 | 7.4% |
| 60 to 89 Minutes | 11 | 4.3% |
| 90 or more Minutes | 0 | 0.0% |
Commute Time by Sex in St Florian
The most common commute times in St Florian are 10 to 14 minutes (48 commuters, 35.0%) for males and 10 to 14 minutes (47 commuters, 39.8%) for females.
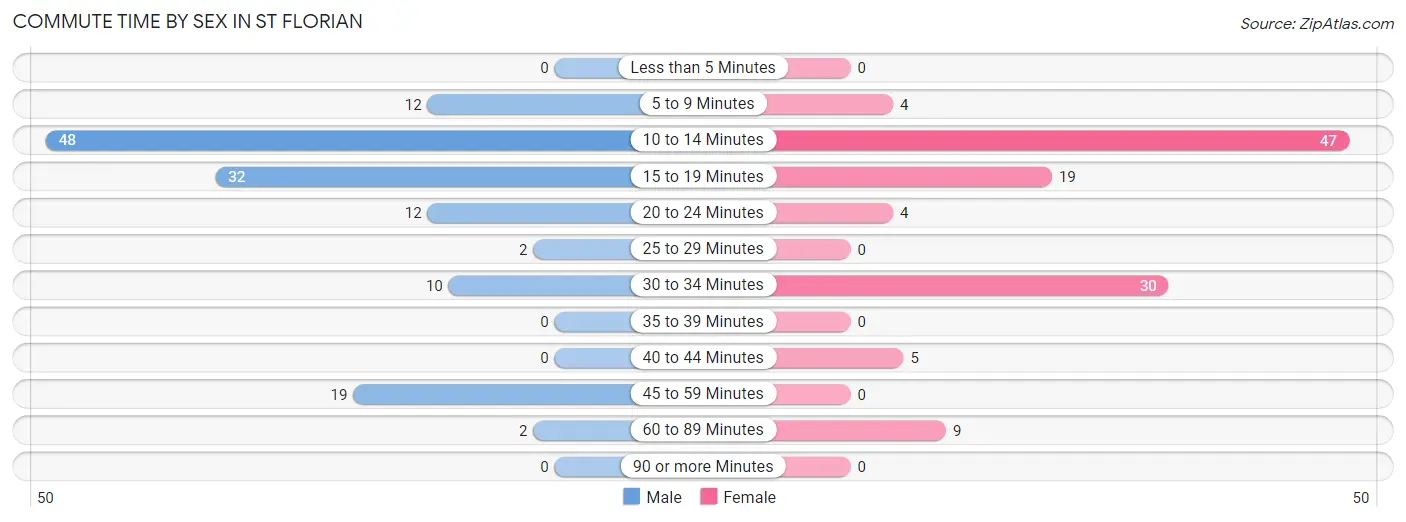
| Commute Time | Male | Female |
| Less than 5 Minutes | 0 (0.0%) | 0 (0.0%) |
| 5 to 9 Minutes | 12 (8.8%) | 4 (3.4%) |
| 10 to 14 Minutes | 48 (35.0%) | 47 (39.8%) |
| 15 to 19 Minutes | 32 (23.4%) | 19 (16.1%) |
| 20 to 24 Minutes | 12 (8.8%) | 4 (3.4%) |
| 25 to 29 Minutes | 2 (1.5%) | 0 (0.0%) |
| 30 to 34 Minutes | 10 (7.3%) | 30 (25.4%) |
| 35 to 39 Minutes | 0 (0.0%) | 0 (0.0%) |
| 40 to 44 Minutes | 0 (0.0%) | 5 (4.2%) |
| 45 to 59 Minutes | 19 (13.9%) | 0 (0.0%) |
| 60 to 89 Minutes | 2 (1.5%) | 9 (7.6%) |
| 90 or more Minutes | 0 (0.0%) | 0 (0.0%) |
Time of Departure to Work by Sex in St Florian
The most frequent times of departure to work in St Florian are 6:00 AM to 6:29 AM (39, 28.5%) for males and 8:00 AM to 8:29 AM (39, 33.1%) for females.
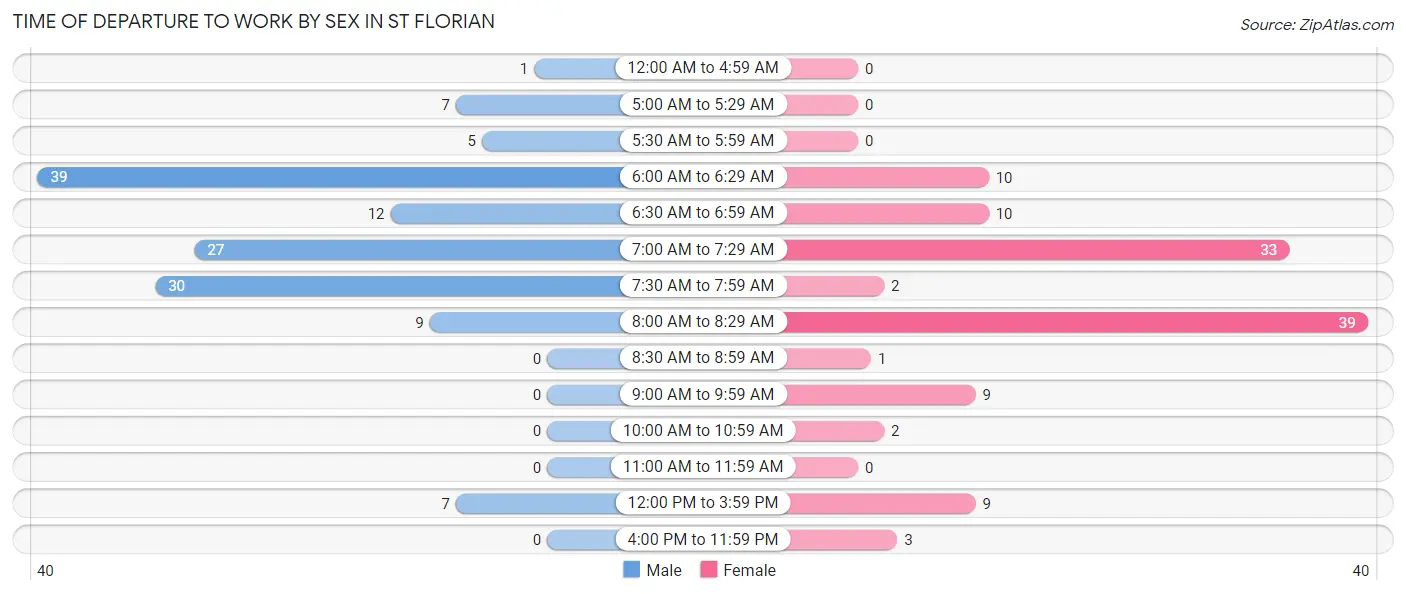
| Time of Departure | Male | Female |
| 12:00 AM to 4:59 AM | 1 (0.7%) | 0 (0.0%) |
| 5:00 AM to 5:29 AM | 7 (5.1%) | 0 (0.0%) |
| 5:30 AM to 5:59 AM | 5 (3.6%) | 0 (0.0%) |
| 6:00 AM to 6:29 AM | 39 (28.5%) | 10 (8.5%) |
| 6:30 AM to 6:59 AM | 12 (8.8%) | 10 (8.5%) |
| 7:00 AM to 7:29 AM | 27 (19.7%) | 33 (28.0%) |
| 7:30 AM to 7:59 AM | 30 (21.9%) | 2 (1.7%) |
| 8:00 AM to 8:29 AM | 9 (6.6%) | 39 (33.1%) |
| 8:30 AM to 8:59 AM | 0 (0.0%) | 1 (0.9%) |
| 9:00 AM to 9:59 AM | 0 (0.0%) | 9 (7.6%) |
| 10:00 AM to 10:59 AM | 0 (0.0%) | 2 (1.7%) |
| 11:00 AM to 11:59 AM | 0 (0.0%) | 0 (0.0%) |
| 12:00 PM to 3:59 PM | 7 (5.1%) | 9 (7.6%) |
| 4:00 PM to 11:59 PM | 0 (0.0%) | 3 (2.5%) |
| Total | 137 (100.0%) | 118 (100.0%) |
Housing Occupancy in St Florian
Occupancy by Ownership in St Florian
Of the total 286 dwellings in St Florian, owner-occupied units account for 201 (70.3%), while renter-occupied units make up 85 (29.7%).
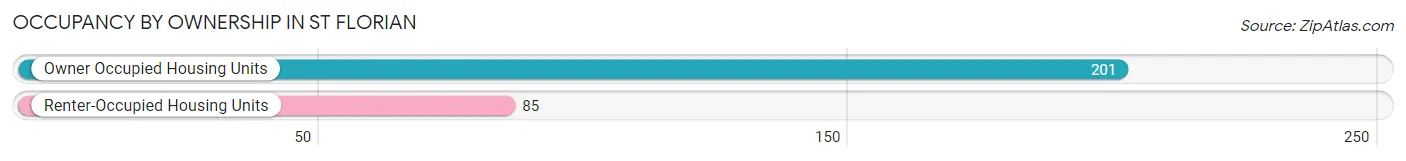
| Occupancy | # Housing Units | % Housing Units |
| Owner Occupied Housing Units | 201 | 70.3% |
| Renter-Occupied Housing Units | 85 | 29.7% |
| Total Occupied Housing Units | 286 | 100.0% |
Occupancy by Household Size in St Florian
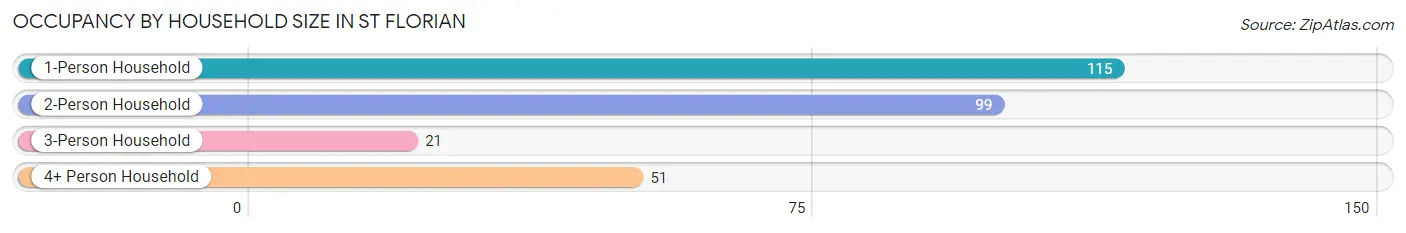
| Household Size | # Housing Units | % Housing Units |
| 1-Person Household | 115 | 40.2% |
| 2-Person Household | 99 | 34.6% |
| 3-Person Household | 21 | 7.3% |
| 4+ Person Household | 51 | 17.8% |
| Total Housing Units | 286 | 100.0% |
Occupancy by Ownership by Household Size in St Florian
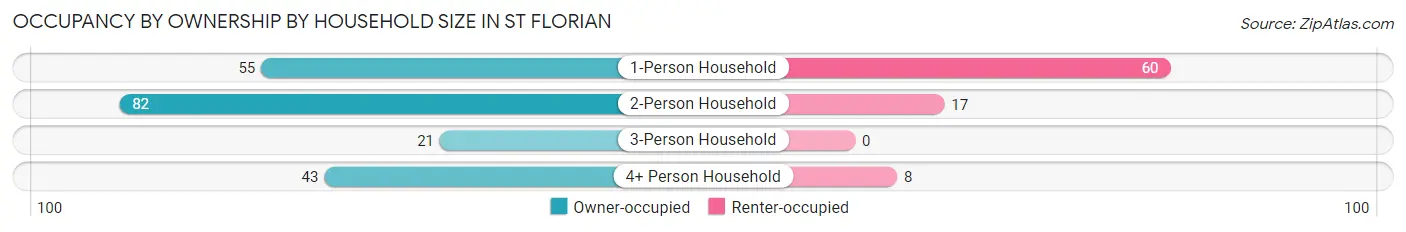
| Household Size | Owner-occupied | Renter-occupied |
| 1-Person Household | 55 (47.8%) | 60 (52.2%) |
| 2-Person Household | 82 (82.8%) | 17 (17.2%) |
| 3-Person Household | 21 (100.0%) | 0 (0.0%) |
| 4+ Person Household | 43 (84.3%) | 8 (15.7%) |
| Total Housing Units | 201 (70.3%) | 85 (29.7%) |
Occupancy by Educational Attainment in St Florian
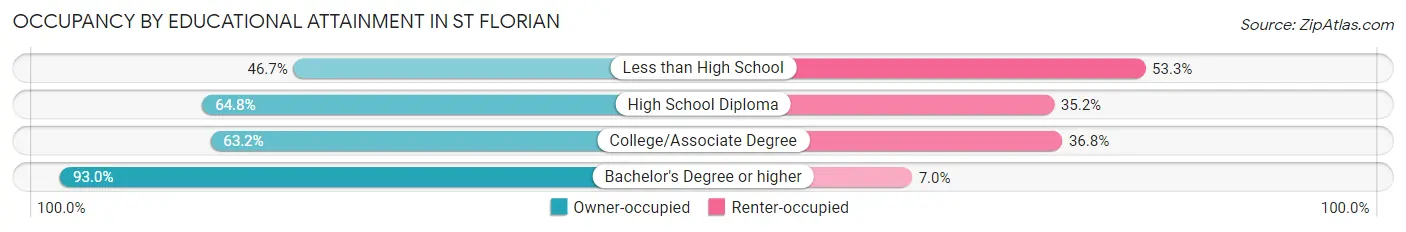
| Household Size | Owner-occupied | Renter-occupied |
| Less than High School | 7 (46.7%) | 8 (53.3%) |
| High School Diploma | 68 (64.8%) | 37 (35.2%) |
| College/Associate Degree | 60 (63.2%) | 35 (36.8%) |
| Bachelor's Degree or higher | 66 (93.0%) | 5 (7.0%) |
Occupancy by Age of Householder in St Florian
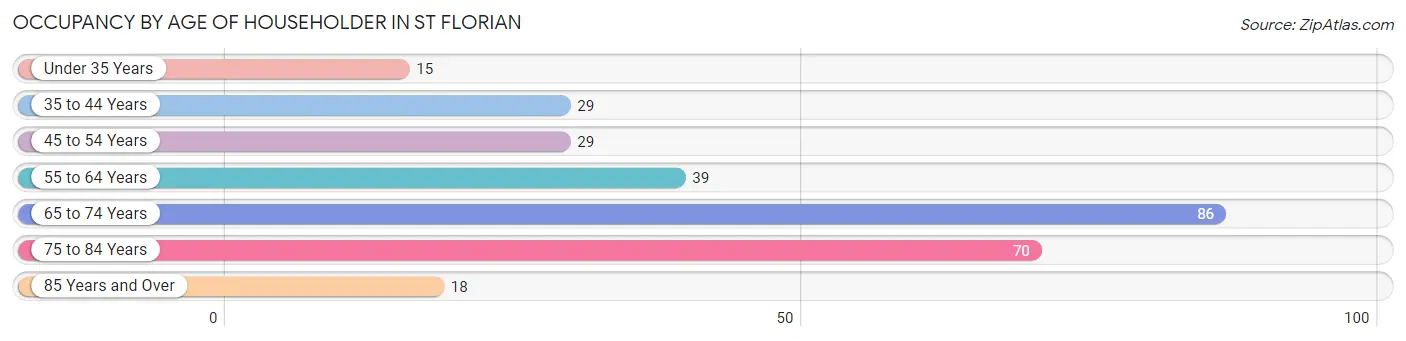
| Age Bracket | # Households | % Households |
| Under 35 Years | 15 | 5.2% |
| 35 to 44 Years | 29 | 10.1% |
| 45 to 54 Years | 29 | 10.1% |
| 55 to 64 Years | 39 | 13.6% |
| 65 to 74 Years | 86 | 30.1% |
| 75 to 84 Years | 70 | 24.5% |
| 85 Years and Over | 18 | 6.3% |
| Total | 286 | 100.0% |
Housing Finances in St Florian
Median Income by Occupancy in St Florian
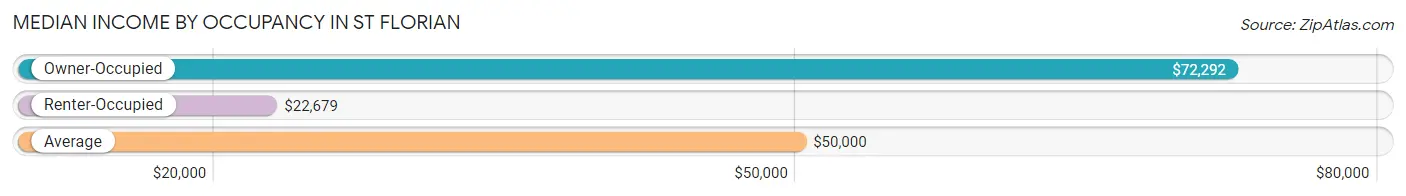
| Occupancy Type | # Households | Median Income |
| Owner-Occupied | 201 (70.3%) | $72,292 |
| Renter-Occupied | 85 (29.7%) | $22,679 |
| Average | 286 (100.0%) | $50,000 |
Occupancy by Householder Income Bracket in St Florian
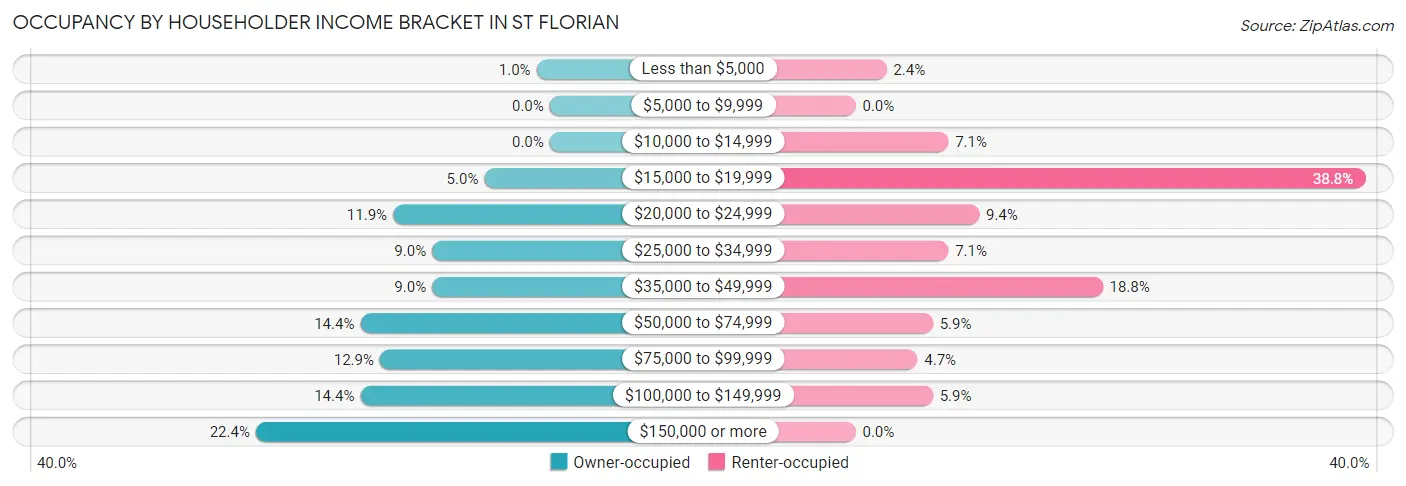
| Income Bracket | Owner-occupied | Renter-occupied |
| Less than $5,000 | 2 (1.0%) | 2 (2.4%) |
| $5,000 to $9,999 | 0 (0.0%) | 0 (0.0%) |
| $10,000 to $14,999 | 0 (0.0%) | 6 (7.1%) |
| $15,000 to $19,999 | 10 (5.0%) | 33 (38.8%) |
| $20,000 to $24,999 | 24 (11.9%) | 8 (9.4%) |
| $25,000 to $34,999 | 18 (9.0%) | 6 (7.1%) |
| $35,000 to $49,999 | 18 (9.0%) | 16 (18.8%) |
| $50,000 to $74,999 | 29 (14.4%) | 5 (5.9%) |
| $75,000 to $99,999 | 26 (12.9%) | 4 (4.7%) |
| $100,000 to $149,999 | 29 (14.4%) | 5 (5.9%) |
| $150,000 or more | 45 (22.4%) | 0 (0.0%) |
| Total | 201 (100.0%) | 85 (100.0%) |
Monthly Housing Cost Tiers in St Florian
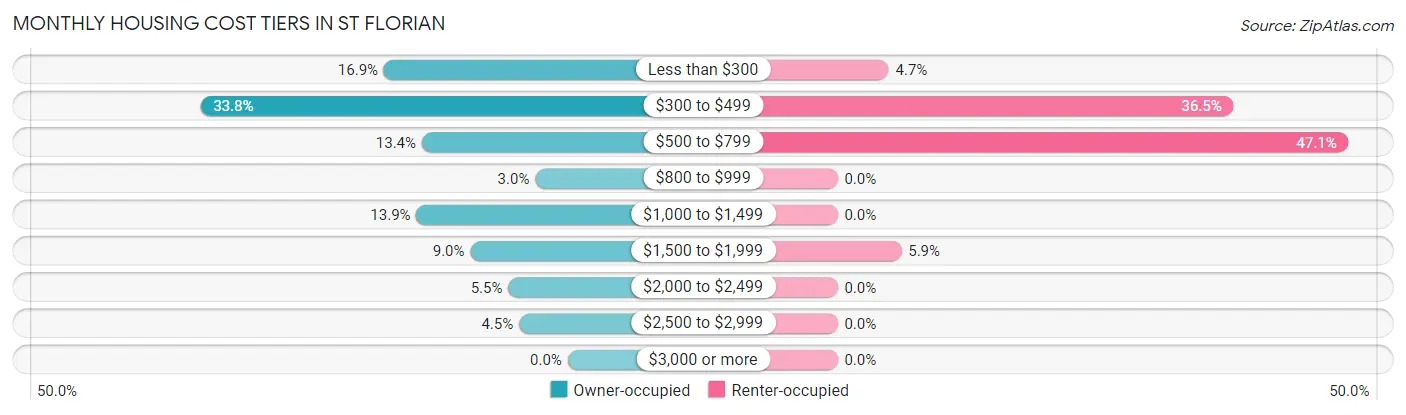
| Monthly Cost | Owner-occupied | Renter-occupied |
| Less than $300 | 34 (16.9%) | 4 (4.7%) |
| $300 to $499 | 68 (33.8%) | 31 (36.5%) |
| $500 to $799 | 27 (13.4%) | 40 (47.1%) |
| $800 to $999 | 6 (3.0%) | 0 (0.0%) |
| $1,000 to $1,499 | 28 (13.9%) | 0 (0.0%) |
| $1,500 to $1,999 | 18 (9.0%) | 5 (5.9%) |
| $2,000 to $2,499 | 11 (5.5%) | 0 (0.0%) |
| $2,500 to $2,999 | 9 (4.5%) | 0 (0.0%) |
| $3,000 or more | 0 (0.0%) | 0 (0.0%) |
| Total | 201 (100.0%) | 85 (100.0%) |
Physical Housing Characteristics in St Florian
Housing Structures in St Florian
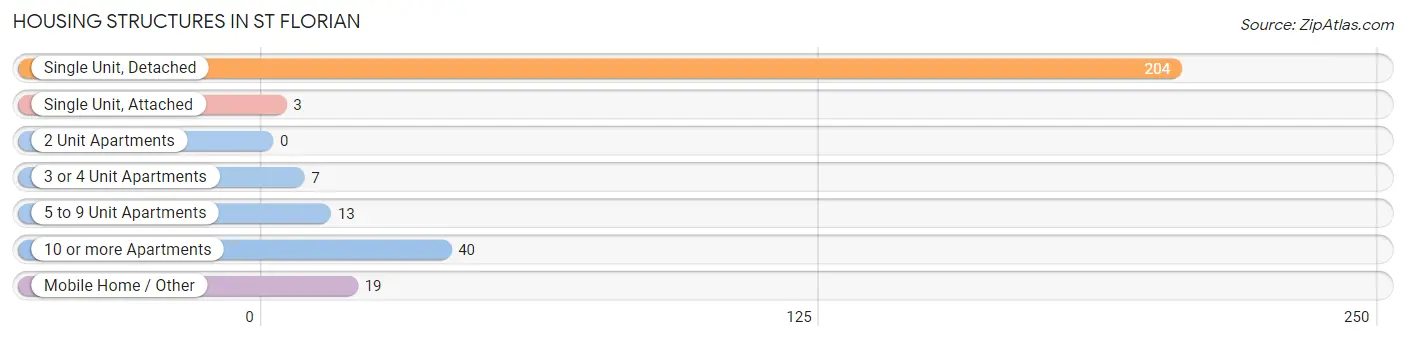
| Structure Type | # Housing Units | % Housing Units |
| Single Unit, Detached | 204 | 71.3% |
| Single Unit, Attached | 3 | 1.1% |
| 2 Unit Apartments | 0 | 0.0% |
| 3 or 4 Unit Apartments | 7 | 2.5% |
| 5 to 9 Unit Apartments | 13 | 4.5% |
| 10 or more Apartments | 40 | 14.0% |
| Mobile Home / Other | 19 | 6.6% |
| Total | 286 | 100.0% |
Housing Structures by Occupancy in St Florian
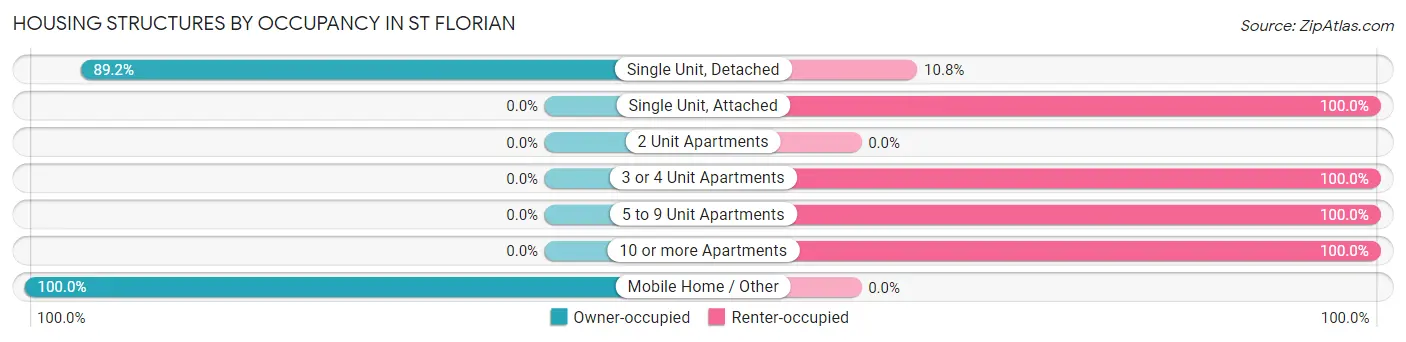
| Structure Type | Owner-occupied | Renter-occupied |
| Single Unit, Detached | 182 (89.2%) | 22 (10.8%) |
| Single Unit, Attached | 0 (0.0%) | 3 (100.0%) |
| 2 Unit Apartments | 0 (0.0%) | 0 (0.0%) |
| 3 or 4 Unit Apartments | 0 (0.0%) | 7 (100.0%) |
| 5 to 9 Unit Apartments | 0 (0.0%) | 13 (100.0%) |
| 10 or more Apartments | 0 (0.0%) | 40 (100.0%) |
| Mobile Home / Other | 19 (100.0%) | 0 (0.0%) |
| Total | 201 (70.3%) | 85 (29.7%) |
Housing Structures by Number of Rooms in St Florian
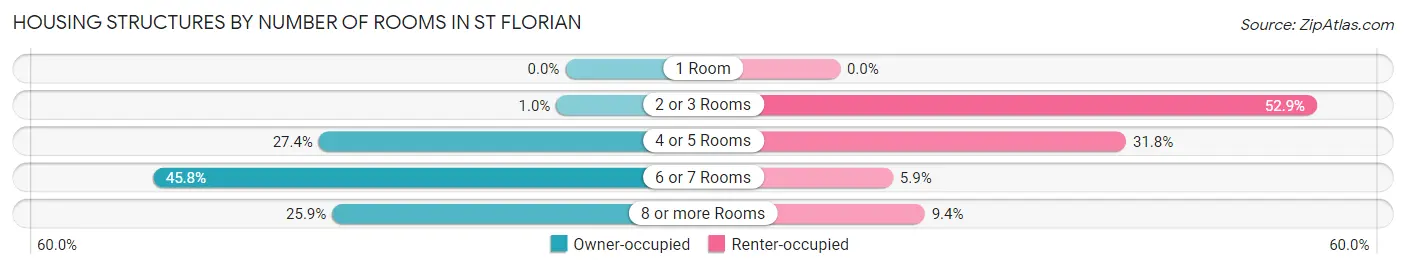
| Number of Rooms | Owner-occupied | Renter-occupied |
| 1 Room | 0 (0.0%) | 0 (0.0%) |
| 2 or 3 Rooms | 2 (1.0%) | 45 (52.9%) |
| 4 or 5 Rooms | 55 (27.4%) | 27 (31.8%) |
| 6 or 7 Rooms | 92 (45.8%) | 5 (5.9%) |
| 8 or more Rooms | 52 (25.9%) | 8 (9.4%) |
| Total | 201 (100.0%) | 85 (100.0%) |
Housing Structure by Heating Type in St Florian
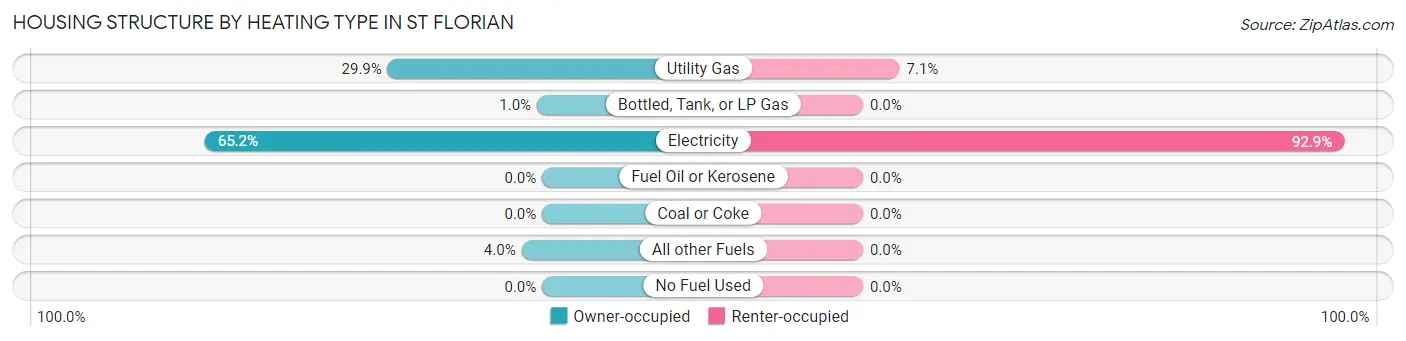
| Heating Type | Owner-occupied | Renter-occupied |
| Utility Gas | 60 (29.8%) | 6 (7.1%) |
| Bottled, Tank, or LP Gas | 2 (1.0%) | 0 (0.0%) |
| Electricity | 131 (65.2%) | 79 (92.9%) |
| Fuel Oil or Kerosene | 0 (0.0%) | 0 (0.0%) |
| Coal or Coke | 0 (0.0%) | 0 (0.0%) |
| All other Fuels | 8 (4.0%) | 0 (0.0%) |
| No Fuel Used | 0 (0.0%) | 0 (0.0%) |
| Total | 201 (100.0%) | 85 (100.0%) |
Household Vehicle Usage in St Florian
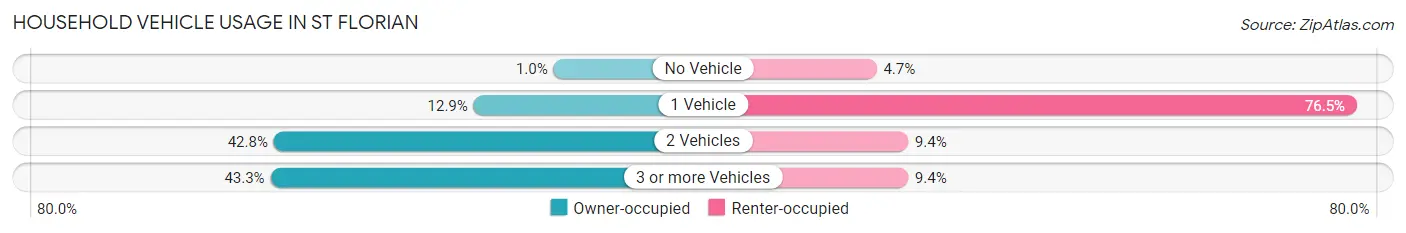
| Vehicles per Household | Owner-occupied | Renter-occupied |
| No Vehicle | 2 (1.0%) | 4 (4.7%) |
| 1 Vehicle | 26 (12.9%) | 65 (76.5%) |
| 2 Vehicles | 86 (42.8%) | 8 (9.4%) |
| 3 or more Vehicles | 87 (43.3%) | 8 (9.4%) |
| Total | 201 (100.0%) | 85 (100.0%) |
Real Estate & Mortgages in St Florian
Real Estate and Mortgage Overview in St Florian
| Characteristic | Without Mortgage | With Mortgage |
| Housing Units | 127 | 74 |
| Median Property Value | $203,400 | $308,300 |
| Median Household Income | $67,250 | $21 |
| Monthly Housing Costs | $381 | $0 |
| Real Estate Taxes | $643 | $12 |
Property Value by Mortgage Status in St Florian
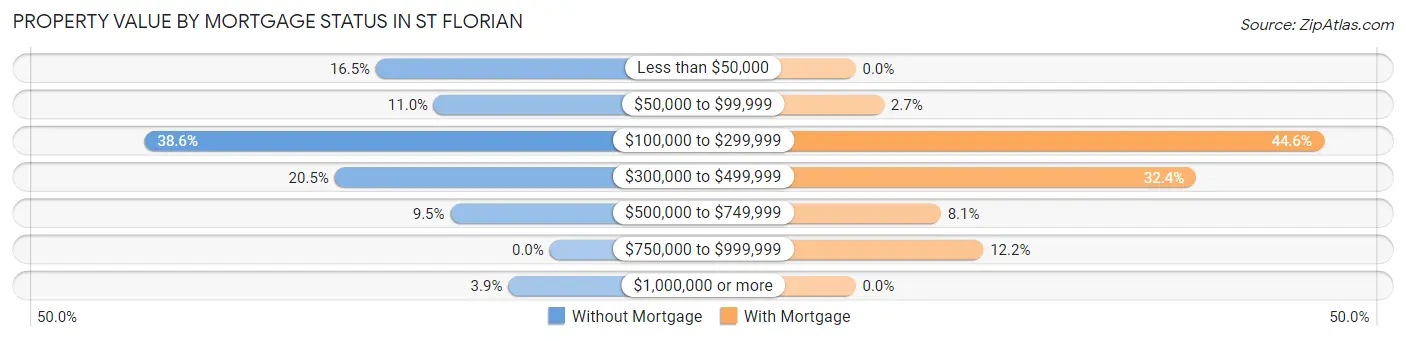
| Property Value | Without Mortgage | With Mortgage |
| Less than $50,000 | 21 (16.5%) | 0 (0.0%) |
| $50,000 to $99,999 | 14 (11.0%) | 2 (2.7%) |
| $100,000 to $299,999 | 49 (38.6%) | 33 (44.6%) |
| $300,000 to $499,999 | 26 (20.5%) | 24 (32.4%) |
| $500,000 to $749,999 | 12 (9.5%) | 6 (8.1%) |
| $750,000 to $999,999 | 0 (0.0%) | 9 (12.2%) |
| $1,000,000 or more | 5 (3.9%) | 0 (0.0%) |
| Total | 127 (100.0%) | 74 (100.0%) |
Household Income by Mortgage Status in St Florian
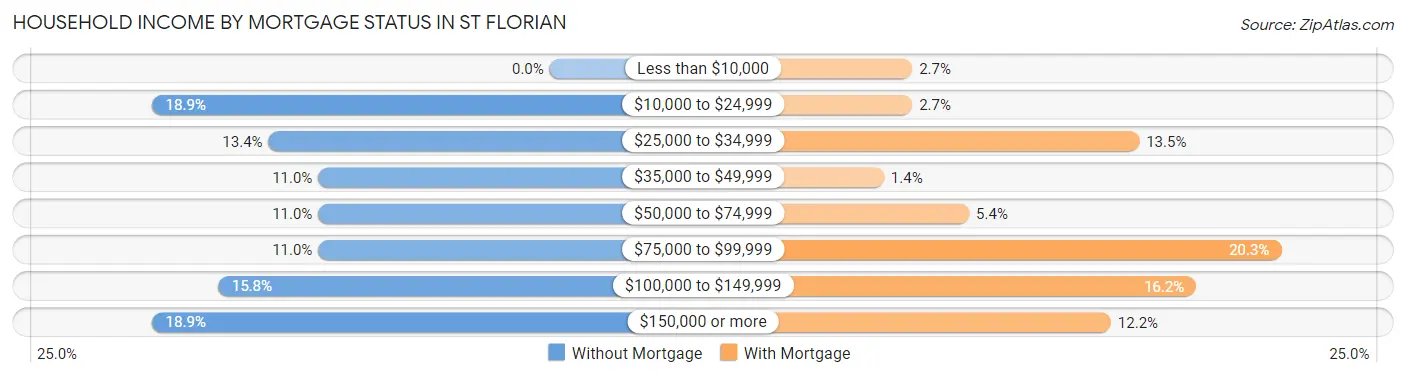
| Household Income | Without Mortgage | With Mortgage |
| Less than $10,000 | 0 (0.0%) | 2 (2.7%) |
| $10,000 to $24,999 | 24 (18.9%) | 2 (2.7%) |
| $25,000 to $34,999 | 17 (13.4%) | 10 (13.5%) |
| $35,000 to $49,999 | 14 (11.0%) | 1 (1.3%) |
| $50,000 to $74,999 | 14 (11.0%) | 4 (5.4%) |
| $75,000 to $99,999 | 14 (11.0%) | 15 (20.3%) |
| $100,000 to $149,999 | 20 (15.8%) | 12 (16.2%) |
| $150,000 or more | 24 (18.9%) | 9 (12.2%) |
| Total | 127 (100.0%) | 74 (100.0%) |
Property Value to Household Income Ratio in St Florian
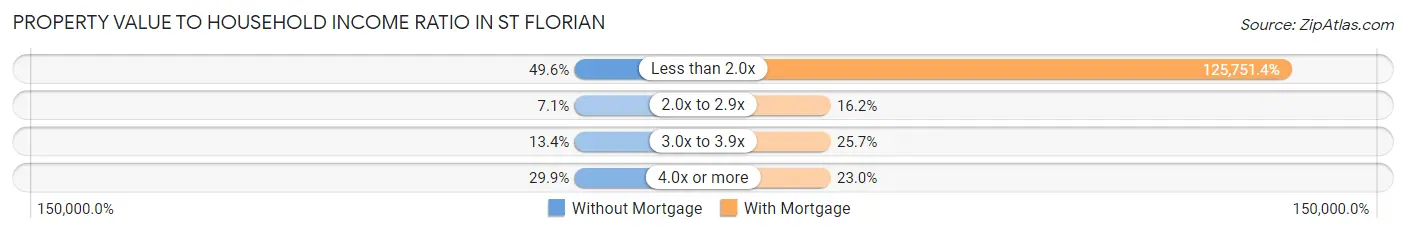
| Value-to-Income Ratio | Without Mortgage | With Mortgage |
| Less than 2.0x | 63 (49.6%) | 93,056 (125,751.4%) |
| 2.0x to 2.9x | 9 (7.1%) | 12 (16.2%) |
| 3.0x to 3.9x | 17 (13.4%) | 19 (25.7%) |
| 4.0x or more | 38 (29.9%) | 17 (23.0%) |
| Total | 127 (100.0%) | 74 (100.0%) |
Real Estate Taxes by Mortgage Status in St Florian
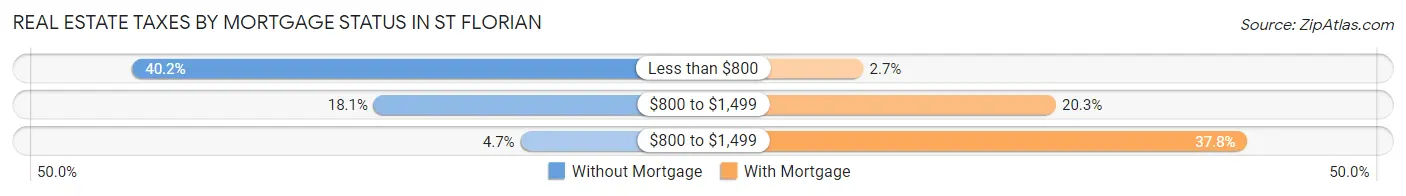
| Property Taxes | Without Mortgage | With Mortgage |
| Less than $800 | 51 (40.2%) | 2 (2.7%) |
| $800 to $1,499 | 23 (18.1%) | 15 (20.3%) |
| $800 to $1,499 | 6 (4.7%) | 28 (37.8%) |
| Total | 127 (100.0%) | 74 (100.0%) |
Health & Disability in St Florian
Health Insurance Coverage by Age in St Florian
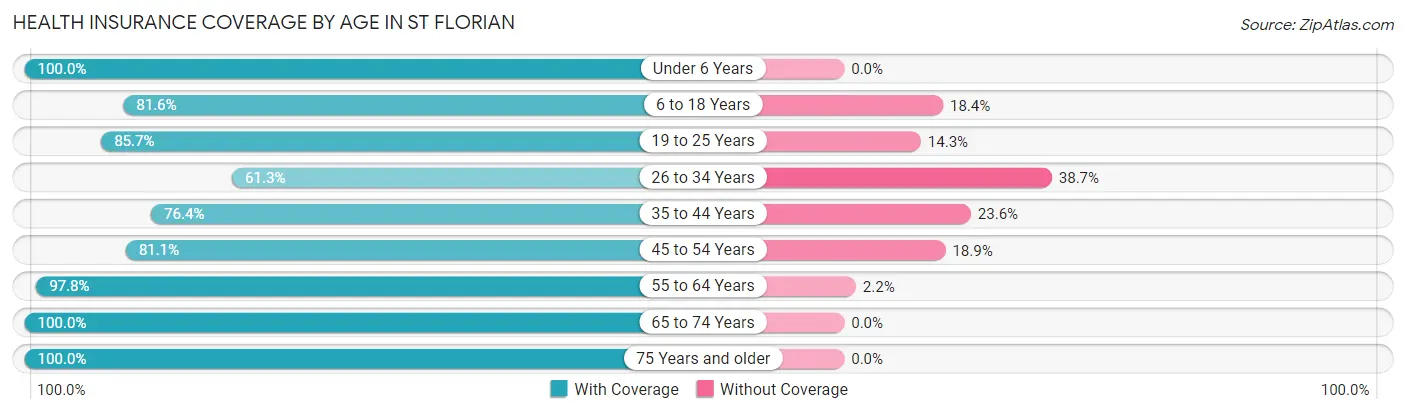
| Age Bracket | With Coverage | Without Coverage |
| Under 6 Years | 8 (100.0%) | 0 (0.0%) |
| 6 to 18 Years | 62 (81.6%) | 14 (18.4%) |
| 19 to 25 Years | 54 (85.7%) | 9 (14.3%) |
| 26 to 34 Years | 19 (61.3%) | 12 (38.7%) |
| 35 to 44 Years | 55 (76.4%) | 17 (23.6%) |
| 45 to 54 Years | 43 (81.1%) | 10 (18.9%) |
| 55 to 64 Years | 90 (97.8%) | 2 (2.2%) |
| 65 to 74 Years | 128 (100.0%) | 0 (0.0%) |
| 75 Years and older | 113 (100.0%) | 0 (0.0%) |
| Total | 572 (89.9%) | 64 (10.1%) |
Health Insurance Coverage by Citizenship Status in St Florian
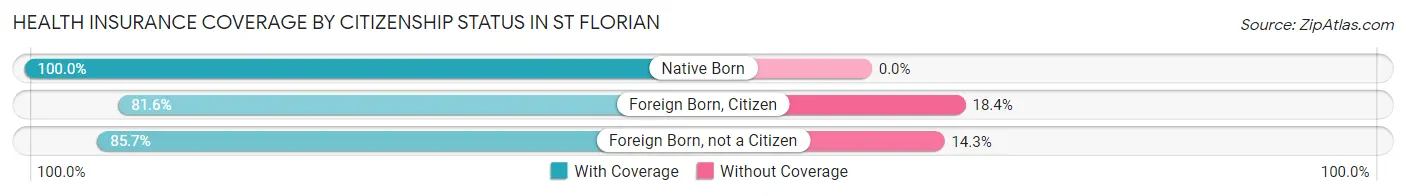
| Citizenship Status | With Coverage | Without Coverage |
| Native Born | 8 (100.0%) | 0 (0.0%) |
| Foreign Born, Citizen | 62 (81.6%) | 14 (18.4%) |
| Foreign Born, not a Citizen | 54 (85.7%) | 9 (14.3%) |
Health Insurance Coverage by Household Income in St Florian
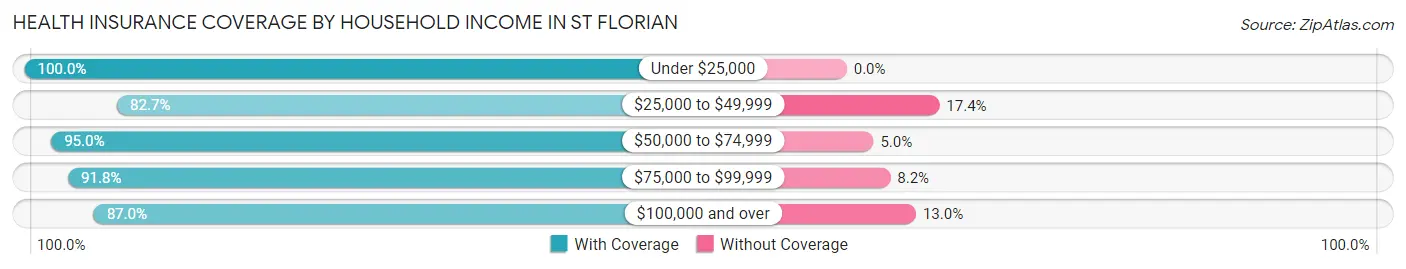
| Household Income | With Coverage | Without Coverage |
| Under $25,000 | 90 (100.0%) | 0 (0.0%) |
| $25,000 to $49,999 | 81 (82.7%) | 17 (17.3%) |
| $50,000 to $74,999 | 76 (95.0%) | 4 (5.0%) |
| $75,000 to $99,999 | 90 (91.8%) | 8 (8.2%) |
| $100,000 and over | 235 (87.0%) | 35 (13.0%) |
Public vs Private Health Insurance Coverage by Age in St Florian
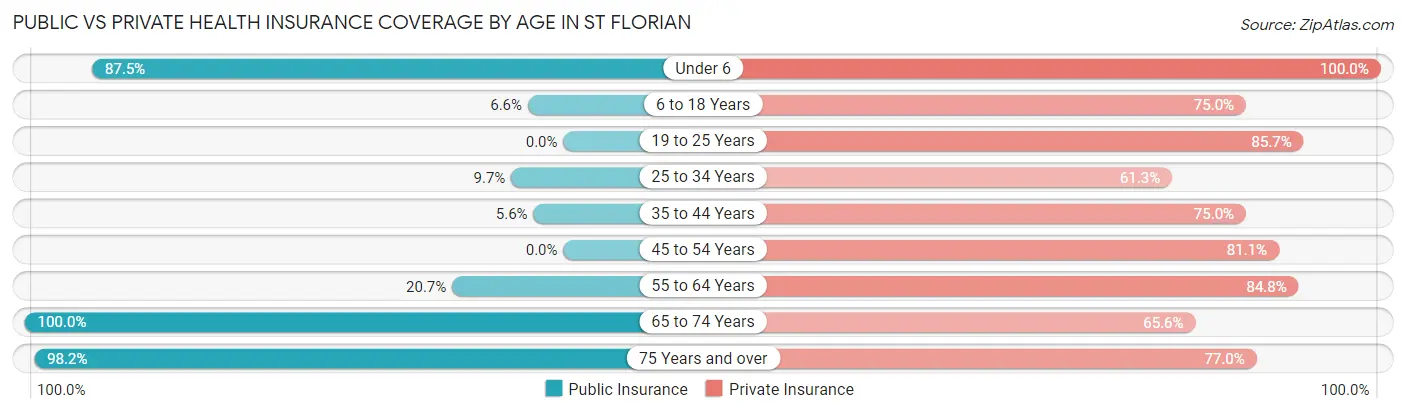
| Age Bracket | Public Insurance | Private Insurance |
| Under 6 | 7 (87.5%) | 8 (100.0%) |
| 6 to 18 Years | 5 (6.6%) | 57 (75.0%) |
| 19 to 25 Years | 0 (0.0%) | 54 (85.7%) |
| 25 to 34 Years | 3 (9.7%) | 19 (61.3%) |
| 35 to 44 Years | 4 (5.6%) | 54 (75.0%) |
| 45 to 54 Years | 0 (0.0%) | 43 (81.1%) |
| 55 to 64 Years | 19 (20.6%) | 78 (84.8%) |
| 65 to 74 Years | 128 (100.0%) | 84 (65.6%) |
| 75 Years and over | 111 (98.2%) | 87 (77.0%) |
| Total | 277 (43.5%) | 484 (76.1%) |
Disability Status by Sex by Age in St Florian
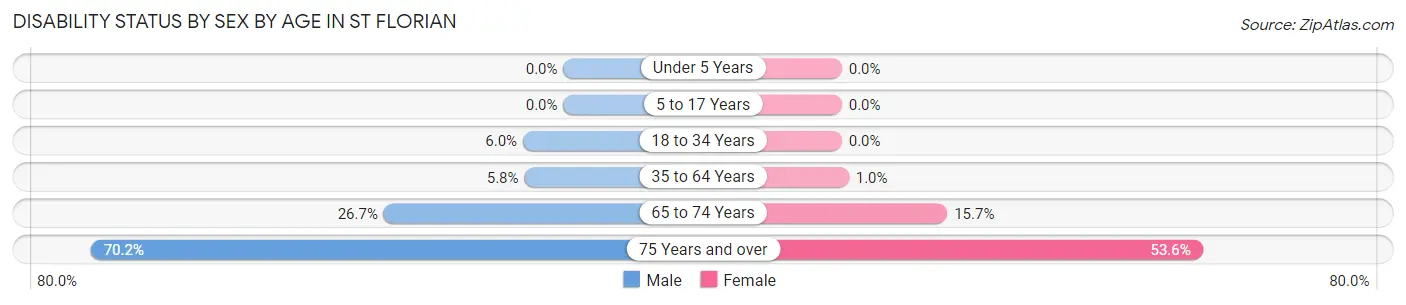
| Age Bracket | Male | Female |
| Under 5 Years | 0 (0.0%) | 0 (0.0%) |
| 5 to 17 Years | 0 (0.0%) | 0 (0.0%) |
| 18 to 34 Years | 3 (6.0%) | 0 (0.0%) |
| 35 to 64 Years | 7 (5.8%) | 1 (1.0%) |
| 65 to 74 Years | 12 (26.7%) | 13 (15.7%) |
| 75 Years and over | 40 (70.2%) | 30 (53.6%) |
Disability Class by Sex by Age in St Florian
Disability Class: Hearing Difficulty
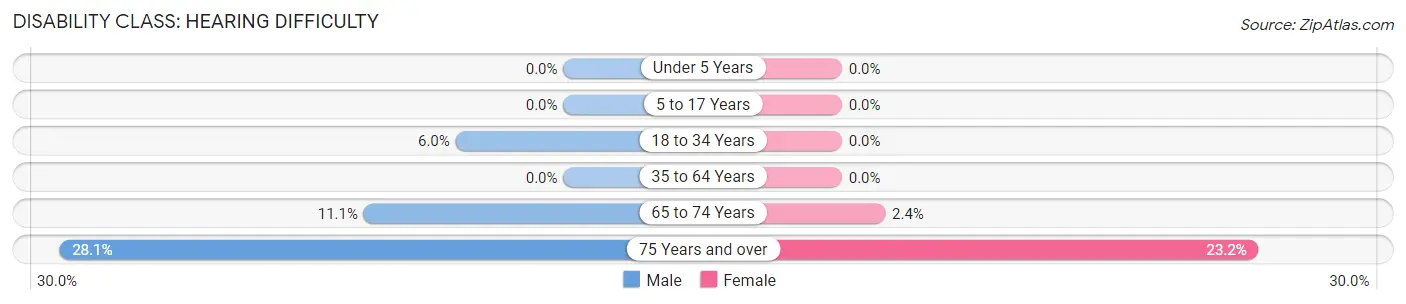
| Age Bracket | Male | Female |
| Under 5 Years | 0 (0.0%) | 0 (0.0%) |
| 5 to 17 Years | 0 (0.0%) | 0 (0.0%) |
| 18 to 34 Years | 3 (6.0%) | 0 (0.0%) |
| 35 to 64 Years | 0 (0.0%) | 0 (0.0%) |
| 65 to 74 Years | 5 (11.1%) | 2 (2.4%) |
| 75 Years and over | 16 (28.1%) | 13 (23.2%) |
Disability Class: Vision Difficulty
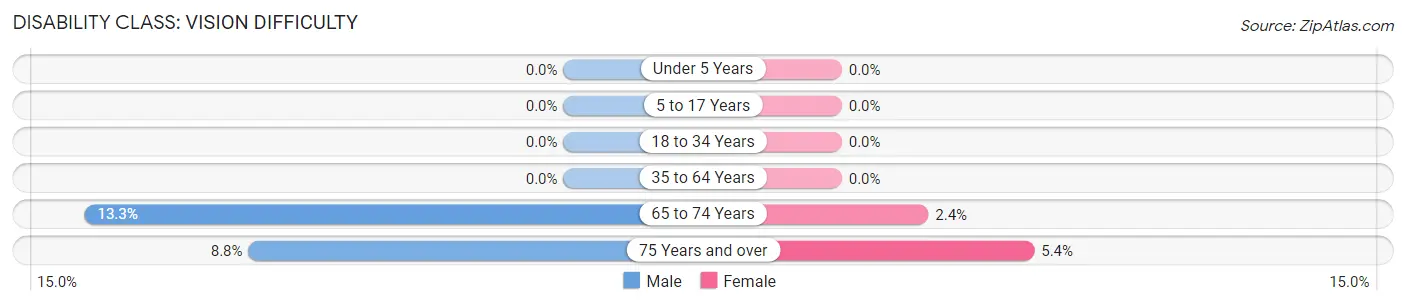
| Age Bracket | Male | Female |
| Under 5 Years | 0 (0.0%) | 0 (0.0%) |
| 5 to 17 Years | 0 (0.0%) | 0 (0.0%) |
| 18 to 34 Years | 0 (0.0%) | 0 (0.0%) |
| 35 to 64 Years | 0 (0.0%) | 0 (0.0%) |
| 65 to 74 Years | 6 (13.3%) | 2 (2.4%) |
| 75 Years and over | 5 (8.8%) | 3 (5.4%) |
Disability Class: Cognitive Difficulty
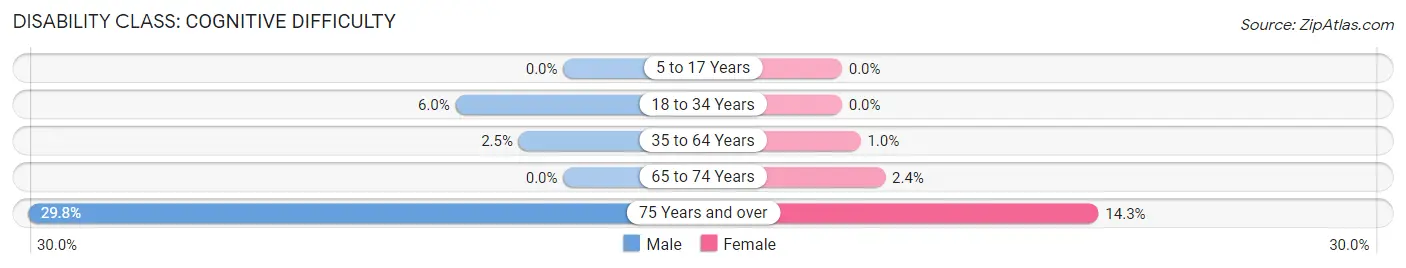
| Age Bracket | Male | Female |
| 5 to 17 Years | 0 (0.0%) | 0 (0.0%) |
| 18 to 34 Years | 3 (6.0%) | 0 (0.0%) |
| 35 to 64 Years | 3 (2.5%) | 1 (1.0%) |
| 65 to 74 Years | 0 (0.0%) | 2 (2.4%) |
| 75 Years and over | 17 (29.8%) | 8 (14.3%) |
Disability Class: Ambulatory Difficulty
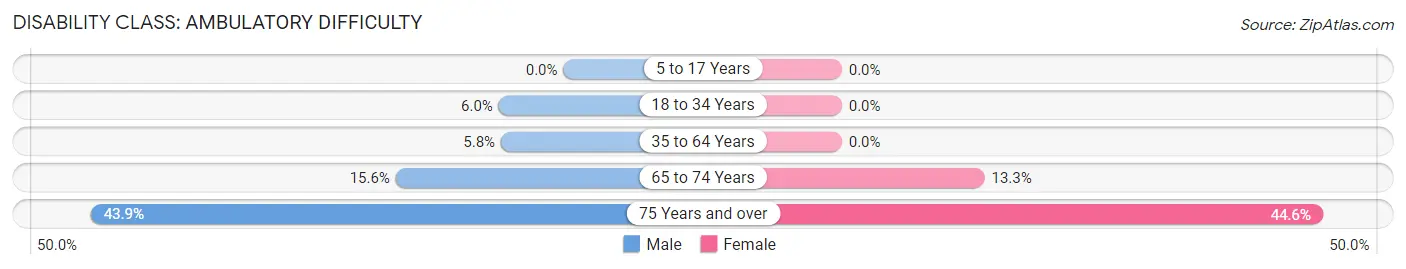
| Age Bracket | Male | Female |
| 5 to 17 Years | 0 (0.0%) | 0 (0.0%) |
| 18 to 34 Years | 3 (6.0%) | 0 (0.0%) |
| 35 to 64 Years | 7 (5.8%) | 0 (0.0%) |
| 65 to 74 Years | 7 (15.6%) | 11 (13.3%) |
| 75 Years and over | 25 (43.9%) | 25 (44.6%) |
Disability Class: Self-Care Difficulty
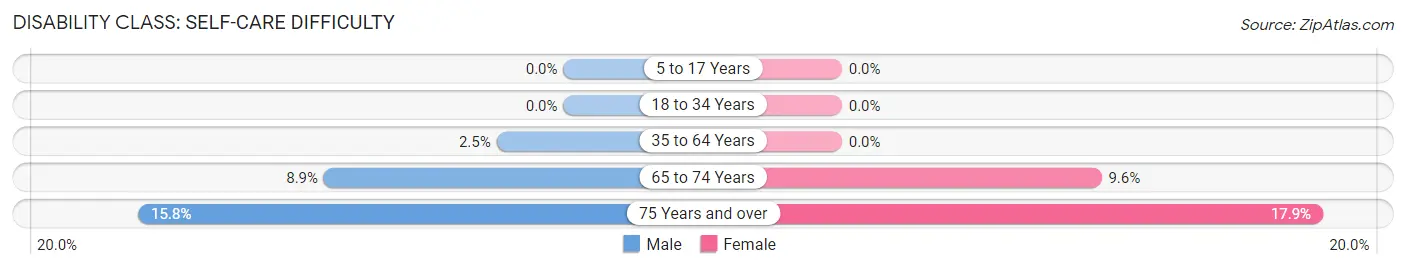
| Age Bracket | Male | Female |
| 5 to 17 Years | 0 (0.0%) | 0 (0.0%) |
| 18 to 34 Years | 0 (0.0%) | 0 (0.0%) |
| 35 to 64 Years | 3 (2.5%) | 0 (0.0%) |
| 65 to 74 Years | 4 (8.9%) | 8 (9.6%) |
| 75 Years and over | 9 (15.8%) | 10 (17.9%) |
Technology Access in St Florian
Computing Device Access in St Florian
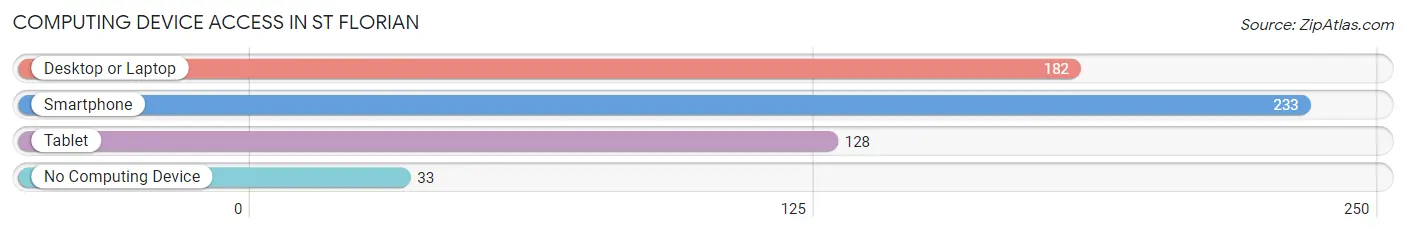
| Device Type | # Households | % Households |
| Desktop or Laptop | 182 | 63.6% |
| Smartphone | 233 | 81.5% |
| Tablet | 128 | 44.8% |
| No Computing Device | 33 | 11.5% |
| Total | 286 | 100.0% |
Internet Access in St Florian
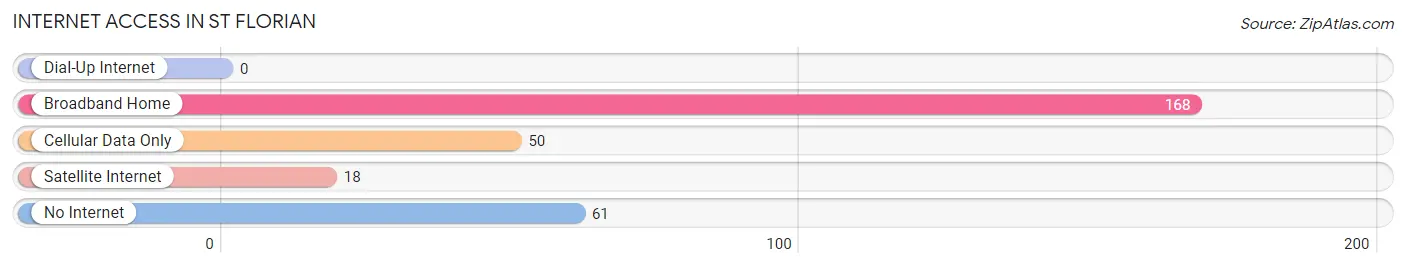
| Internet Type | # Households | % Households |
| Dial-Up Internet | 0 | 0.0% |
| Broadband Home | 168 | 58.7% |
| Cellular Data Only | 50 | 17.5% |
| Satellite Internet | 18 | 6.3% |
| No Internet | 61 | 21.3% |
| Total | 286 | 100.0% |
St Florian Summary
St Florian is a small town located in the northwest corner of Lauderdale County, Alabama. It is situated on the banks of the Tennessee River, and is part of the Florence-Muscle Shoals Metropolitan Statistical Area. The town has a population of 1,845 people, according to the 2010 census.
History
St Florian was founded in 1818 by a group of settlers from North Carolina. The town was named after St Florian, the patron saint of firefighters. The settlers were attracted to the area due to its fertile soil and abundant natural resources. The town quickly grew and became a thriving agricultural center.
In the late 19th century, St Florian became a major industrial center. The town was home to several factories, including a cotton mill, a paper mill, and a sawmill. The town also had a railroad line that connected it to other towns in the area.
In the early 20th century, St Florian experienced a period of decline. The factories closed and the railroad line was abandoned. The town’s population decreased and many of the buildings were abandoned.
In the late 20th century, St Florian experienced a resurgence. The town was revitalized with the construction of a new bridge over the Tennessee River. The bridge connected St Florian to the nearby town of Florence, and allowed for increased economic activity.
Geography
St Florian is located in the northwest corner of Lauderdale County, Alabama. The town is situated on the banks of the Tennessee River, and is part of the Florence-Muscle Shoals Metropolitan Statistical Area. The town is located approximately 20 miles north of Florence and 40 miles south of Huntsville.
The town has a total area of 1.3 square miles, all of which is land. The town is located in a hilly region, and is surrounded by forests and farmland. The town is located at an elevation of 545 feet above sea level.
Economy
St Florian’s economy is largely based on agriculture and manufacturing. The town is home to several factories, including a cotton mill, a paper mill, and a sawmill. The town also has a number of small businesses, including restaurants, retail stores, and service providers.
The town is also home to several educational institutions, including a community college and a technical school. The town is also home to a number of churches and other religious organizations.
Demographics
According to the 2010 census, St Florian has a population of 1,845 people. The town has a median household income of $35,000, and a median home value of $90,000. The town is predominantly white, with a small African American population. The town also has a small Hispanic population.
Conclusion
St Florian is a small town located in the northwest corner of Lauderdale County, Alabama. The town has a population of 1,845 people, and is part of the Florence-Muscle Shoals Metropolitan Statistical Area. The town’s economy is largely based on agriculture and manufacturing, and the town is home to several educational institutions. St Florian is predominantly white, with a small African American and Hispanic population.
Common Questions
What is Per Capita Income in St Florian?
Per Capita income in St Florian is $37,678.
What is the Median Family Income in St Florian?
Median Family Income in St Florian is $93,472.
What is the Median Household income in St Florian?
Median Household Income in St Florian is $50,000.
What is Income or Wage Gap in St Florian?
Income or Wage Gap in St Florian is 33.6%.
Women in St Florian earn 66.4 cents for every dollar earned by a man.
What is Inequality or Gini Index in St Florian?
Inequality or Gini Index in St Florian is 0.48.
What is the Total Population of St Florian?
Total Population of St Florian is 636.
What is the Total Male Population of St Florian?
Total Male Population of St Florian is 313.
What is the Total Female Population of St Florian?
Total Female Population of St Florian is 323.
What is the Ratio of Males per 100 Females in St Florian?
There are 96.90 Males per 100 Females in St Florian.
What is the Ratio of Females per 100 Males in St Florian?
There are 103.19 Females per 100 Males in St Florian.
What is the Median Population Age in St Florian?
Median Population Age in St Florian is 55.8 Years.
What is the Average Family Size in St Florian
Average Family Size in St Florian is 3.1 People.
What is the Average Household Size in St Florian
Average Household Size in St Florian is 2.2 People.
How Large is the Labor Force in St Florian?
There are 290 People in the Labor Forcein in St Florian.
What is the Percentage of People in the Labor Force in St Florian?
51.9% of People are in the Labor Force in St Florian.
What is the Unemployment Rate in St Florian?
Unemployment Rate in St Florian is 4.5%.