Zip Codes with the Highest Percentage of Families with Income Above $200,000 in Birmingham, AL
RELATED REPORTS & OPTIONS
Family Income | $200k+
Birmingham
Compare Zip Codes
Map of Zip Codes with the Highest Percentage of Families with Income Above $200,000 in Birmingham
0.10%
49.1%
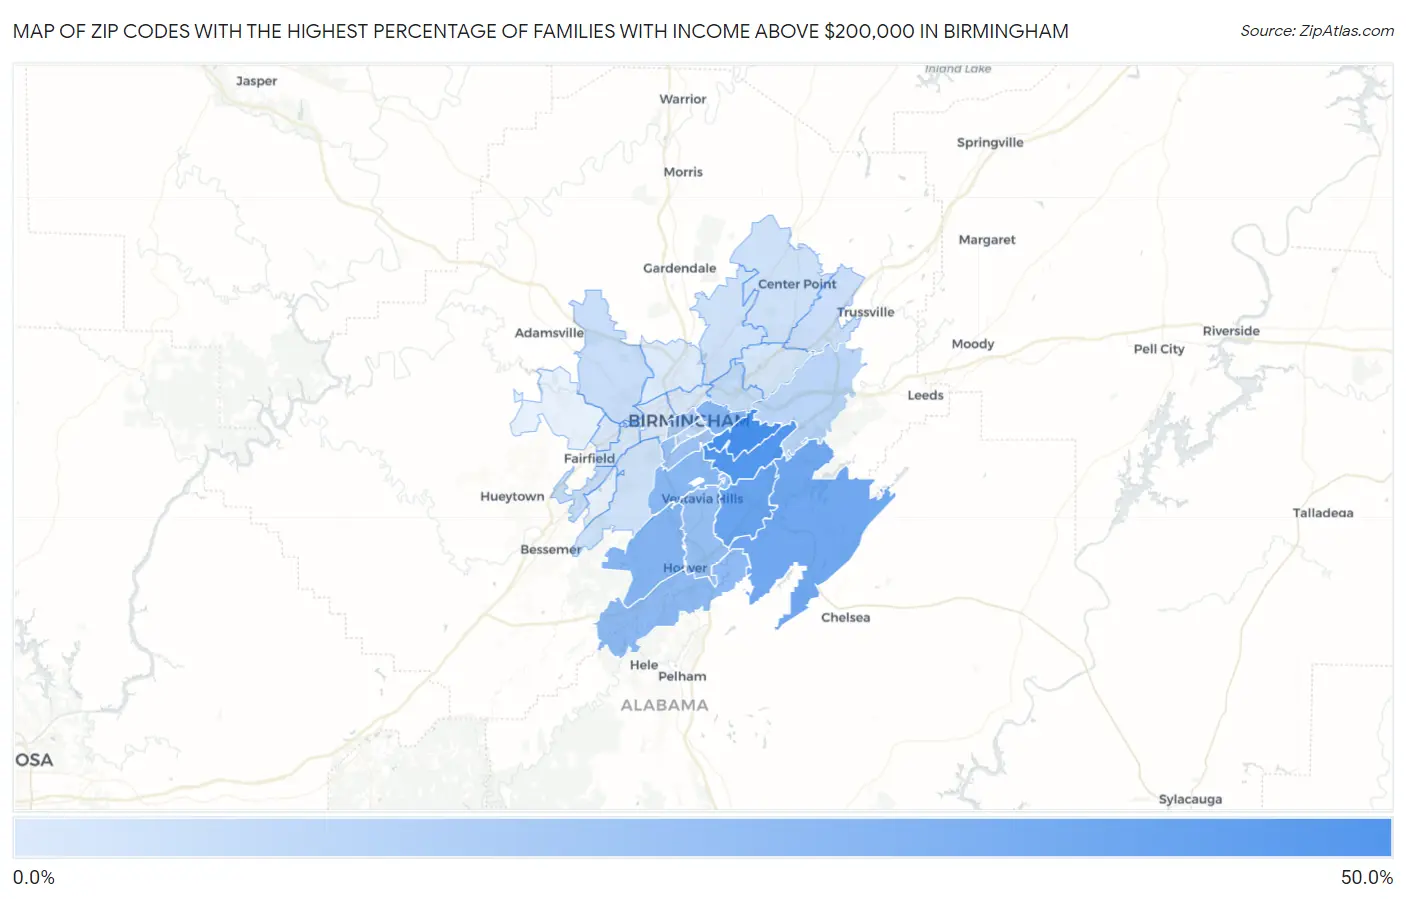
Zip Codes with the Highest Percentage of Families with Income Above $200,000 in Birmingham, AL
| Zip Code | Families with Income > $200k | vs State | vs National | |
| 1. | 35213 | 49.1% | 9.0% (+40.1)#2 | 14.8% (+34.3)#711 |
| 2. | 35223 | 44.9% | 9.0% (+35.9)#3 | 14.8% (+30.1)#943 |
| 3. | 35243 | 35.6% | 9.0% (+26.6)#6 | 14.8% (+20.8)#1,773 |
| 4. | 35242 | 33.2% | 9.0% (+24.2)#8 | 14.8% (+18.4)#2,077 |
| 5. | 35226 | 26.6% | 9.0% (+17.6)#15 | 14.8% (+11.8)#3,123 |
| 6. | 35222 | 26.2% | 9.0% (+17.2)#18 | 14.8% (+11.4)#3,199 |
| 7. | 35209 | 25.9% | 9.0% (+16.9)#21 | 14.8% (+11.1)#3,264 |
| 8. | 35244 | 23.0% | 9.0% (+14.0)#27 | 14.8% (+8.20)#3,940 |
| 9. | 35216 | 20.9% | 9.0% (+11.9)#33 | 14.8% (+6.10)#4,528 |
| 10. | 35205 | 19.5% | 9.0% (+10.5)#40 | 14.8% (+4.70)#4,970 |
| 11. | 35203 | 14.5% | 9.0% (+5.50)#60 | 14.8% (-0.300)#7,284 |
| 12. | 35210 | 9.8% | 9.0% (+0.800)#120 | 14.8% (-5.00)#11,014 |
| 13. | 35233 | 9.1% | 9.0% (+0.100)#136 | 14.8% (-5.70)#11,827 |
| 14. | 35212 | 6.4% | 9.0% (-2.60)#207 | 14.8% (-8.40)#15,729 |
| 15. | 35214 | 5.9% | 9.0% (-3.10)#225 | 14.8% (-8.90)#16,643 |
| 16. | 35228 | 5.5% | 9.0% (-3.50)#238 | 14.8% (-9.30)#17,446 |
| 17. | 35235 | 4.9% | 9.0% (-4.10)#270 | 14.8% (-9.90)#18,619 |
| 18. | 35217 | 4.1% | 9.0% (-4.90)#312 | 14.8% (-10.7)#20,218 |
| 19. | 35211 | 4.0% | 9.0% (-5.00)#318 | 14.8% (-10.8)#20,405 |
| 20. | 35215 | 3.7% | 9.0% (-5.30)#342 | 14.8% (-11.1)#21,056 |
| 21. | 35208 | 2.1% | 9.0% (-6.90)#436 | 14.8% (-12.7)#24,287 |
| 22. | 35206 | 1.8% | 9.0% (-7.20)#454 | 14.8% (-13.0)#24,793 |
| 23. | 35204 | 0.80% | 9.0% (-8.20)#497 | 14.8% (-14.0)#26,357 |
| 24. | 35234 | 0.80% | 9.0% (-8.20)#498 | 14.8% (-14.0)#26,375 |
| 25. | 35218 | 0.70% | 9.0% (-8.30)#499 | 14.8% (-14.1)#26,478 |
| 26. | 35207 | 0.10% | 9.0% (-8.90)#516 | 14.8% (-14.7)#26,995 |
1
Common Questions
What are the Top 10 Zip Codes with the Highest Percentage of Families with Income Above $200,000 in Birmingham, AL?
Top 10 Zip Codes with the Highest Percentage of Families with Income Above $200,000 in Birmingham, AL are:
What zip code has the Highest Percentage of Families with Income Above $200,000 in Birmingham, AL?
35213 has the Highest Percentage of Families with Income Above $200,000 in Birmingham, AL with 49.1%.
What is the Percentage of Families with Income Above $200,000 in Birmingham, AL?
Percentage of Families with Income Above $200,000 in Birmingham is 6.9%.
What is the Percentage of Families with Income Above $200,000 in Alabama?
Percentage of Families with Income Above $200,000 in Alabama is 9.0%.
What is the Percentage of Families with Income Above $200,000 in the United States?
Percentage of Families with Income Above $200,000 in the United States is 14.8%.