Shoal Creek, AL Map & Demographics
Shoal Creek Map
Shoal Creek Overview
$81,916
PER CAPITA INCOME
$159,722
AVG FAMILY INCOME
$130,375
AVG HOUSEHOLD INCOME
0.47
INEQUALITY / GINI INDEX
1,171
TOTAL POPULATION
549
MALE POPULATION
622
FEMALE POPULATION
88.26
MALES / 100 FEMALES
113.30
FEMALES / 100 MALES
52.4
MEDIAN AGE
2.9
AVG FAMILY SIZE
2.5
AVG HOUSEHOLD SIZE
508
LABOR FORCE [ PEOPLE ]
50.3%
PERCENT IN LABOR FORCE
3.1%
UNEMPLOYMENT RATE
Shoal Creek Area Codes
Income in Shoal Creek
Income Overview in Shoal Creek
Per Capita Income in Shoal Creek is $81,916, while median incomes of families and households are $159,722 and $130,375 respectively.
| Characteristic | Number | Measure |
| Per Capita Income | 1,171 | $81,916 |
| Median Family Income | 362 | $159,722 |
| Mean Family Income | 362 | $231,402 |
| Median Household Income | 478 | $130,375 |
| Mean Household Income | 478 | $199,191 |
| Income Deficit | 362 | $0 |
| Wage / Income Gap (%) | 1,171 | 0.00% |
| Wage / Income Gap ($) | 1,171 | 100.00¢ per $1 |
| Gini / Inequality Index | 1,171 | 0.47 |
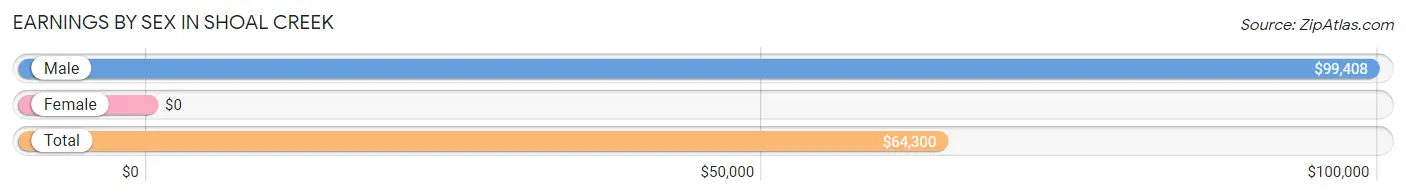
Earnings by Sex in Shoal Creek
| Sex | Number | Average Earnings |
| Male | 349 (67.6%) | $99,408 |
| Female | 167 (32.4%) | $0 |
| Total | 516 (100.0%) | $64,300 |
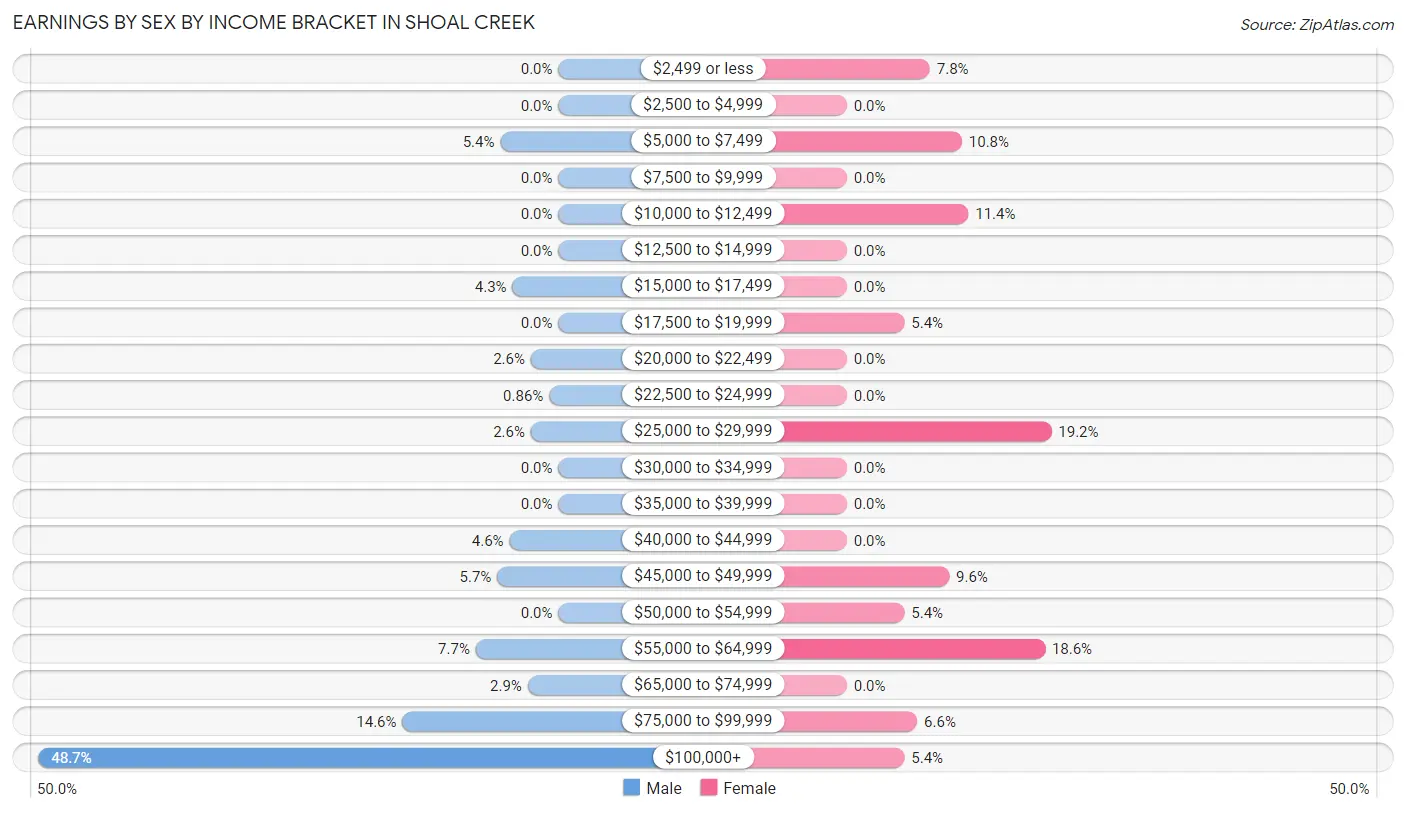
Earnings by Sex by Income Bracket in Shoal Creek
The most common earnings brackets in Shoal Creek are $100,000+ for men (170 | 48.7%) and $25,000 to $29,999 for women (32 | 19.2%).
| Income | Male | Female |
| $2,499 or less | 0 (0.0%) | 13 (7.8%) |
| $2,500 to $4,999 | 0 (0.0%) | 0 (0.0%) |
| $5,000 to $7,499 | 19 (5.4%) | 18 (10.8%) |
| $7,500 to $9,999 | 0 (0.0%) | 0 (0.0%) |
| $10,000 to $12,499 | 0 (0.0%) | 19 (11.4%) |
| $12,500 to $14,999 | 0 (0.0%) | 0 (0.0%) |
| $15,000 to $17,499 | 15 (4.3%) | 0 (0.0%) |
| $17,500 to $19,999 | 0 (0.0%) | 9 (5.4%) |
| $20,000 to $22,499 | 9 (2.6%) | 0 (0.0%) |
| $22,500 to $24,999 | 3 (0.9%) | 0 (0.0%) |
| $25,000 to $29,999 | 9 (2.6%) | 32 (19.2%) |
| $30,000 to $34,999 | 0 (0.0%) | 0 (0.0%) |
| $35,000 to $39,999 | 0 (0.0%) | 0 (0.0%) |
| $40,000 to $44,999 | 16 (4.6%) | 0 (0.0%) |
| $45,000 to $49,999 | 20 (5.7%) | 16 (9.6%) |
| $50,000 to $54,999 | 0 (0.0%) | 9 (5.4%) |
| $55,000 to $64,999 | 27 (7.7%) | 31 (18.6%) |
| $65,000 to $74,999 | 10 (2.9%) | 0 (0.0%) |
| $75,000 to $99,999 | 51 (14.6%) | 11 (6.6%) |
| $100,000+ | 170 (48.7%) | 9 (5.4%) |
| Total | 349 (100.0%) | 167 (100.0%) |
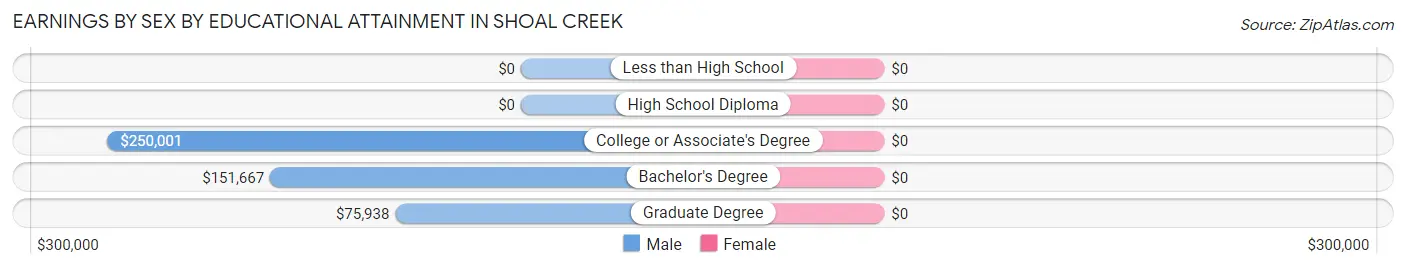
Earnings by Sex by Educational Attainment in Shoal Creek
| Educational Attainment | Male Income | Female Income |
| Less than High School | - | - |
| High School Diploma | - | - |
| College or Associate's Degree | $250,001 | $0 |
| Bachelor's Degree | $151,667 | $0 |
| Graduate Degree | $75,938 | $0 |
| Total | $99,408 | $28,789 |
Family Income in Shoal Creek
Family Income Brackets in Shoal Creek
According to the Shoal Creek family income data, there are 158 families falling into the $200,000+ income range, which is the most common income bracket and makes up 43.6% of all families.
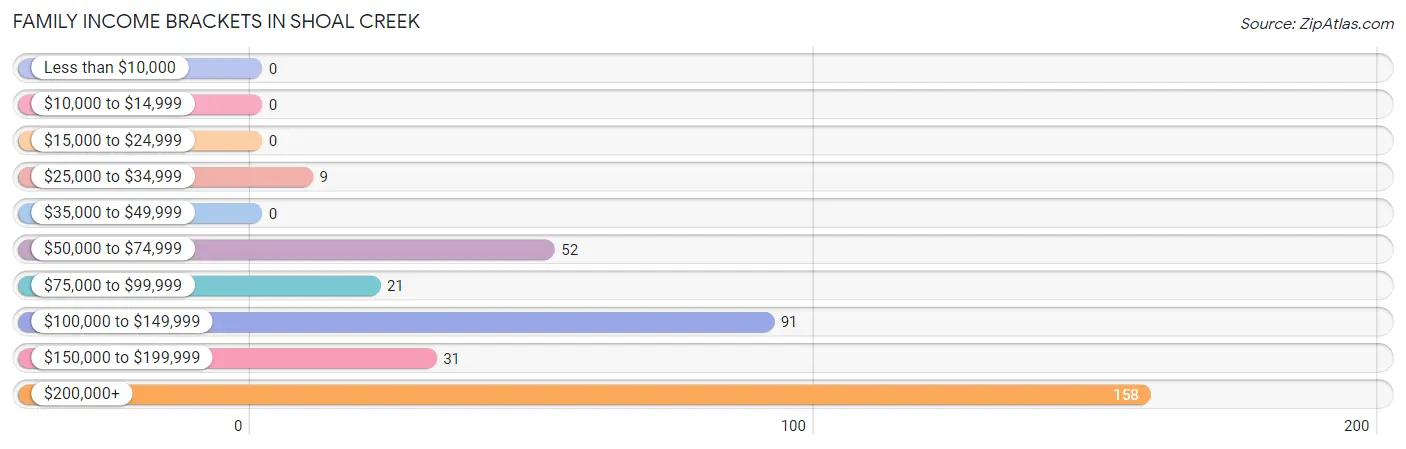
| Income Bracket | # Families | % Families |
| Less than $10,000 | 0 | 0.0% |
| $10,000 to $14,999 | 0 | 0.0% |
| $15,000 to $24,999 | 0 | 0.0% |
| $25,000 to $34,999 | 9 | 2.5% |
| $35,000 to $49,999 | 0 | 0.0% |
| $50,000 to $74,999 | 52 | 14.4% |
| $75,000 to $99,999 | 21 | 5.8% |
| $100,000 to $149,999 | 91 | 25.1% |
| $150,000 to $199,999 | 31 | 8.6% |
| $200,000+ | 158 | 43.6% |
Family Income by Famaliy Size in Shoal Creek
2-person families (210 | 58.0%) account for the highest median family income in Shoal Creek with $243,906 per family, while 2-person families (210 | 58.0%) have the highest median income of $121,953 per family member.
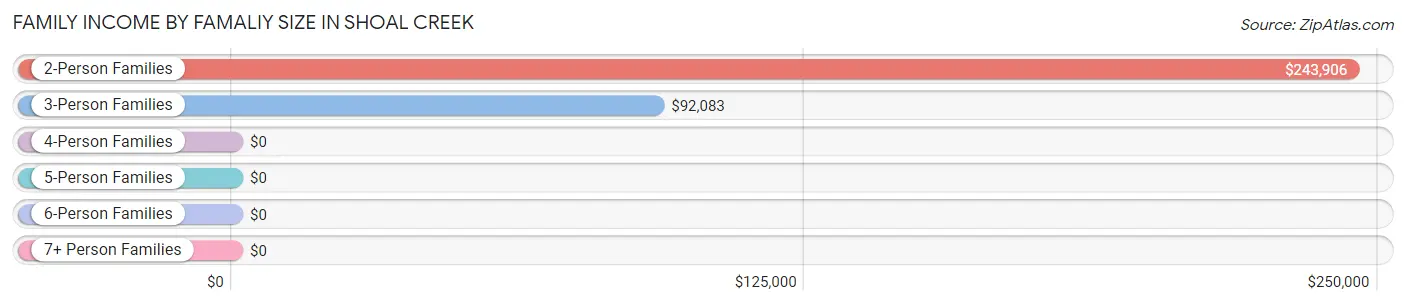
| Income Bracket | # Families | Median Income |
| 2-Person Families | 210 (58.0%) | $243,906 |
| 3-Person Families | 71 (19.6%) | $92,083 |
| 4-Person Families | 52 (14.4%) | $0 |
| 5-Person Families | 19 (5.2%) | $0 |
| 6-Person Families | 10 (2.8%) | $0 |
| 7+ Person Families | 0 (0.0%) | $0 |
| Total | 362 (100.0%) | $159,722 |
Family Income by Number of Earners in Shoal Creek
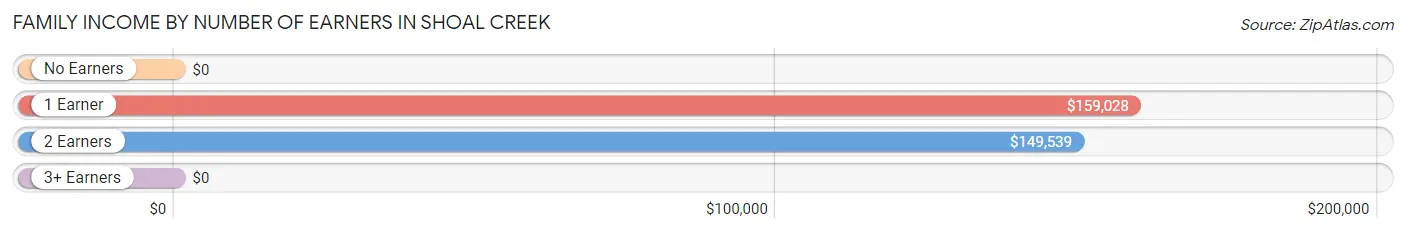
| Number of Earners | # Families | Median Income |
| No Earners | 19 (5.2%) | $0 |
| 1 Earner | 199 (55.0%) | $159,028 |
| 2 Earners | 137 (37.9%) | $149,539 |
| 3+ Earners | 7 (1.9%) | $0 |
| Total | 362 (100.0%) | $159,722 |
Household Income in Shoal Creek
Household Income Brackets in Shoal Creek
With 172 households falling in the category, the $200,000+ income range is the most frequent in Shoal Creek, accounting for 36.0% of all households.
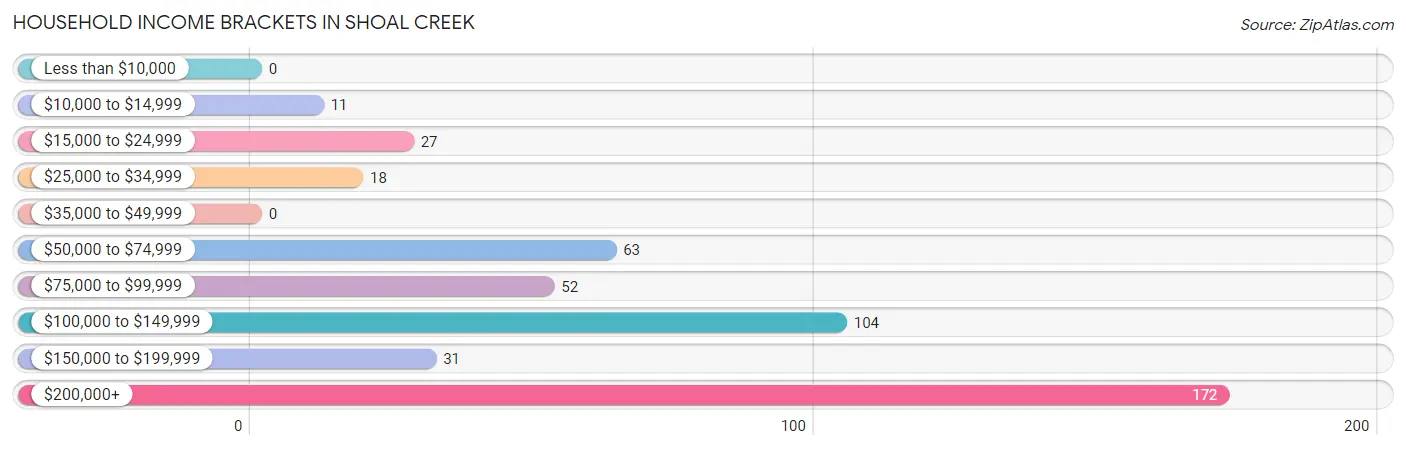
| Income Bracket | # Households | % Households |
| Less than $10,000 | 0 | 0.0% |
| $10,000 to $14,999 | 11 | 2.3% |
| $15,000 to $24,999 | 27 | 5.6% |
| $25,000 to $34,999 | 18 | 3.8% |
| $35,000 to $49,999 | 0 | 0.0% |
| $50,000 to $74,999 | 63 | 13.2% |
| $75,000 to $99,999 | 52 | 10.9% |
| $100,000 to $149,999 | 104 | 21.8% |
| $150,000 to $199,999 | 31 | 6.5% |
| $200,000+ | 172 | 36.0% |
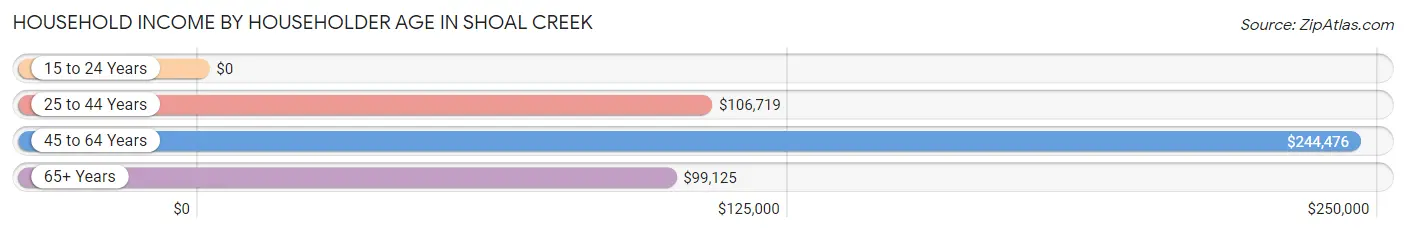
Household Income by Householder Age in Shoal Creek
The median household income in Shoal Creek is $130,375, with the highest median household income of $244,476 found in the 45 to 64 years age bracket for the primary householder. A total of 201 households (42.0%) fall into this category.
| Income Bracket | # Households | Median Income |
| 15 to 24 Years | 0 (0.0%) | $0 |
| 25 to 44 Years | 98 (20.5%) | $106,719 |
| 45 to 64 Years | 201 (42.0%) | $244,476 |
| 65+ Years | 179 (37.4%) | $99,125 |
| Total | 478 (100.0%) | $130,375 |
Poverty in Shoal Creek
Income Below Poverty by Sex and Age in Shoal Creek

| Age Bracket | Male | Female |
| Under 5 Years | 0 (0.0%) | 0 (0.0%) |
| 5 Years | 0 (0.0%) | 0 (0.0%) |
| 6 to 11 Years | 0 (0.0%) | 0 (0.0%) |
| 12 to 14 Years | 0 (0.0%) | 0 (0.0%) |
| 15 Years | 0 (0.0%) | 0 (0.0%) |
| 16 and 17 Years | 0 (0.0%) | 0 (0.0%) |
| 18 to 24 Years | 0 (0.0%) | 0 (0.0%) |
| 25 to 34 Years | 0 (0.0%) | 0 (0.0%) |
| 35 to 44 Years | 0 (0.0%) | 0 (0.0%) |
| 45 to 54 Years | 0 (0.0%) | 0 (0.0%) |
| 55 to 64 Years | 0 (0.0%) | 0 (0.0%) |
| 65 to 74 Years | 0 (0.0%) | 0 (0.0%) |
| 75 Years and over | 0 (0.0%) | 0 (0.0%) |
| Total | 0 (0.0%) | 0 (0.0%) |
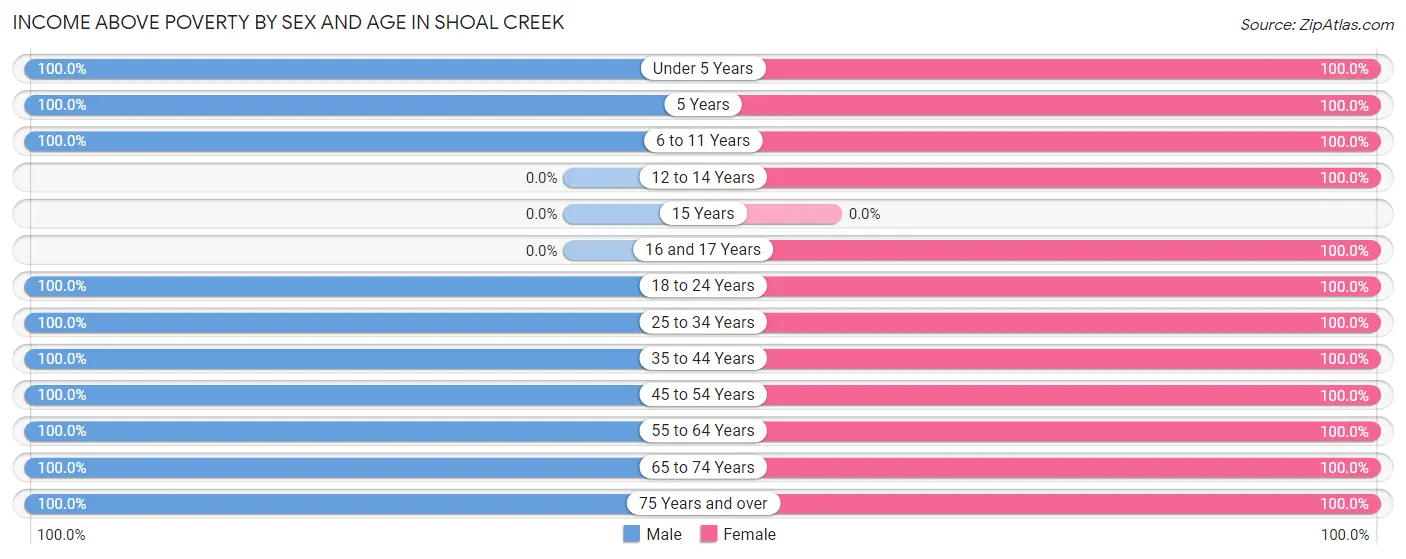
Income Above Poverty by Sex and Age in Shoal Creek
According to the poverty statistics in Shoal Creek, males aged under 5 years and females aged under 5 years are the age groups that are most secure financially, with 100.0% of males and 100.0% of females in these age groups living above the poverty line.
| Age Bracket | Male | Female |
| Under 5 Years | 16 (100.0%) | 1 (100.0%) |
| 5 Years | 11 (100.0%) | 10 (100.0%) |
| 6 to 11 Years | 62 (100.0%) | 53 (100.0%) |
| 12 to 14 Years | 0 (0.0%) | 8 (100.0%) |
| 15 Years | 0 (0.0%) | 0 (0.0%) |
| 16 and 17 Years | 0 (0.0%) | 28 (100.0%) |
| 18 to 24 Years | 28 (100.0%) | 37 (100.0%) |
| 25 to 34 Years | 22 (100.0%) | 35 (100.0%) |
| 35 to 44 Years | 107 (100.0%) | 69 (100.0%) |
| 45 to 54 Years | 67 (100.0%) | 63 (100.0%) |
| 55 to 64 Years | 111 (100.0%) | 166 (100.0%) |
| 65 to 74 Years | 93 (100.0%) | 81 (100.0%) |
| 75 Years and over | 32 (100.0%) | 71 (100.0%) |
| Total | 549 (100.0%) | 622 (100.0%) |
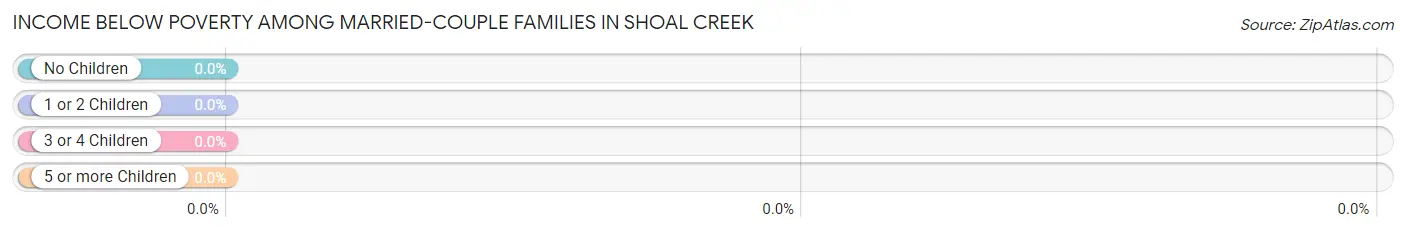
Income Below Poverty Among Married-Couple Families in Shoal Creek
| Children | Above Poverty | Below Poverty |
| No Children | 246 (100.0%) | 0 (0.0%) |
| 1 or 2 Children | 79 (100.0%) | 0 (0.0%) |
| 3 or 4 Children | 21 (100.0%) | 0 (0.0%) |
| 5 or more Children | 0 (0.0%) | 0 (0.0%) |
| Total | 346 (100.0%) | 0 (0.0%) |
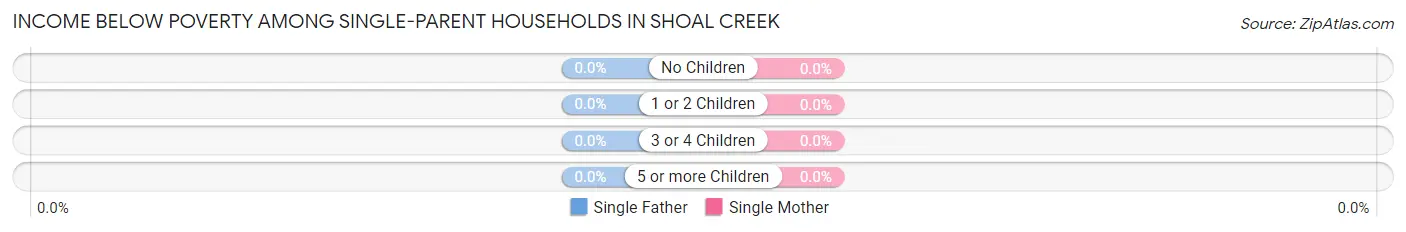
Income Below Poverty Among Single-Parent Households in Shoal Creek
| Children | Single Father | Single Mother |
| No Children | 0 (0.0%) | 0 (0.0%) |
| 1 or 2 Children | 0 (0.0%) | 0 (0.0%) |
| 3 or 4 Children | 0 (0.0%) | 0 (0.0%) |
| 5 or more Children | 0 (0.0%) | 0 (0.0%) |
| Total | 0 (0.0%) | 0 (0.0%) |
Income Below Poverty Among Married-Couple vs Single-Parent Households in Shoal Creek

| Children | Married-Couple Families | Single-Parent Households |
| No Children | 0 (0.0%) | 0 (0.0%) |
| 1 or 2 Children | 0 (0.0%) | 0 (0.0%) |
| 3 or 4 Children | 0 (0.0%) | 0 (0.0%) |
| 5 or more Children | 0 (0.0%) | 0 (0.0%) |
| Total | 0 (0.0%) | 0 (0.0%) |
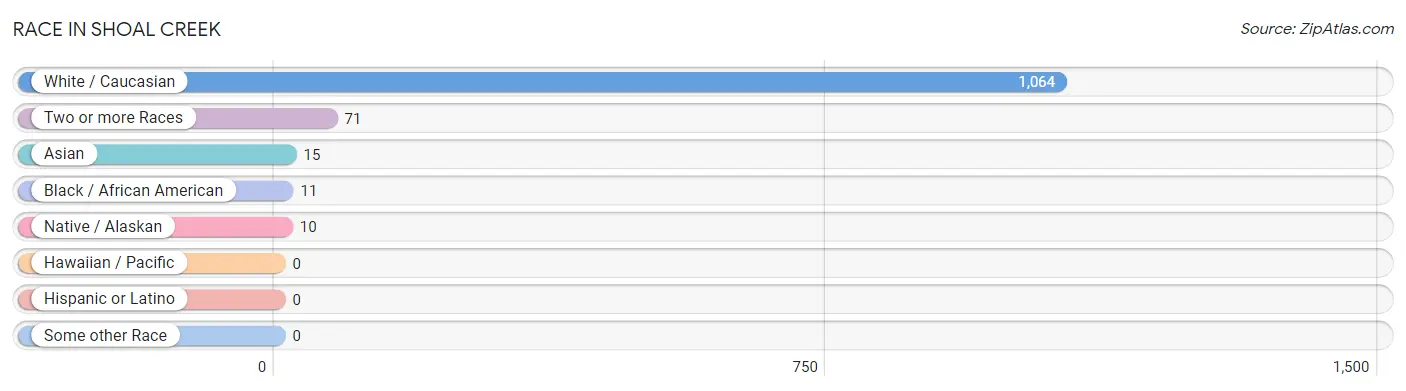
Race in Shoal Creek
The most populous races in Shoal Creek are White / Caucasian (1,064 | 90.9%), Two or more Races (71 | 6.1%), and Asian (15 | 1.3%).
| Race | # Population | % Population |
| Asian | 15 | 1.3% |
| Black / African American | 11 | 0.9% |
| Hawaiian / Pacific | 0 | 0.0% |
| Hispanic or Latino | 0 | 0.0% |
| Native / Alaskan | 10 | 0.9% |
| White / Caucasian | 1,064 | 90.9% |
| Two or more Races | 71 | 6.1% |
| Some other Race | 0 | 0.0% |
| Total | 1,171 | 100.0% |
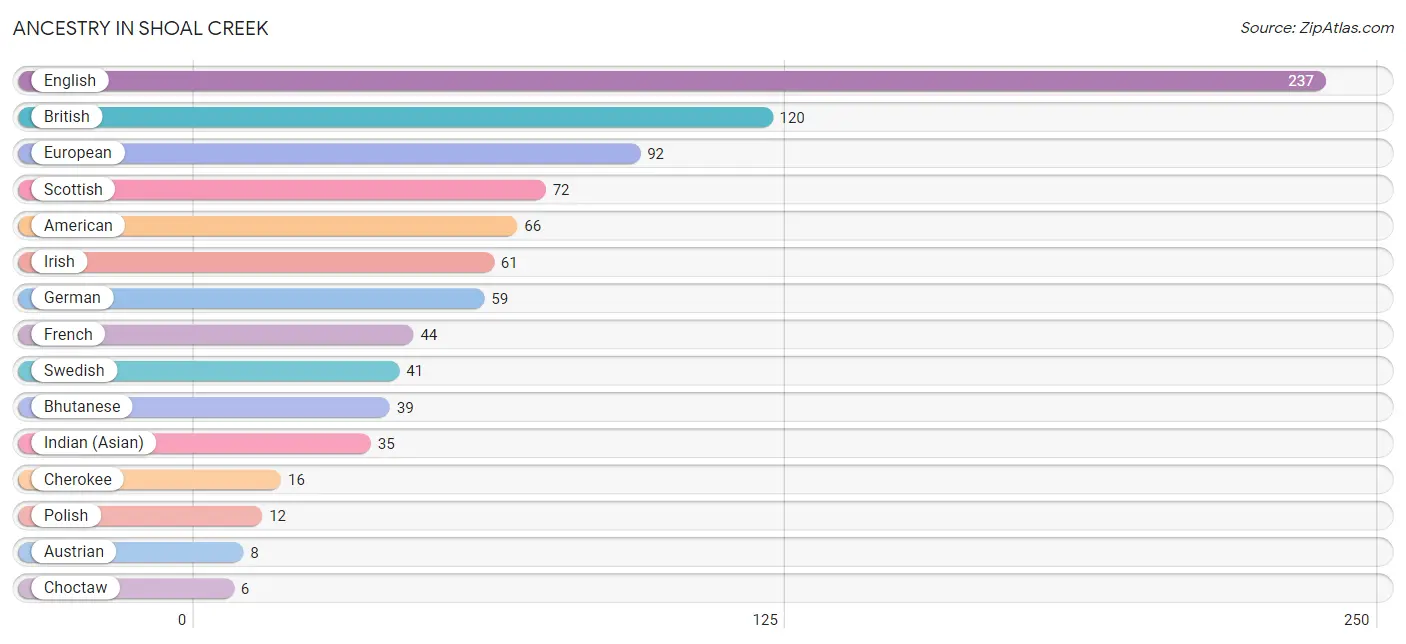
Ancestry in Shoal Creek
The most populous ancestries reported in Shoal Creek are English (237 | 20.2%), British (120 | 10.2%), European (92 | 7.9%), Scottish (72 | 6.1%), and American (66 | 5.6%), together accounting for 50.1% of all Shoal Creek residents.
| Ancestry | # Population | % Population |
| American | 66 | 5.6% |
| Austrian | 8 | 0.7% |
| Bhutanese | 39 | 3.3% |
| British | 120 | 10.2% |
| Cherokee | 16 | 1.4% |
| Choctaw | 6 | 0.5% |
| English | 237 | 20.2% |
| European | 92 | 7.9% |
| French | 44 | 3.8% |
| German | 59 | 5.0% |
| Indian (Asian) | 35 | 3.0% |
| Irish | 61 | 5.2% |
| Polish | 12 | 1.0% |
| Scottish | 72 | 6.1% |
| Swedish | 41 | 3.5% |
| Welsh | 6 | 0.5% | View All 16 Rows |
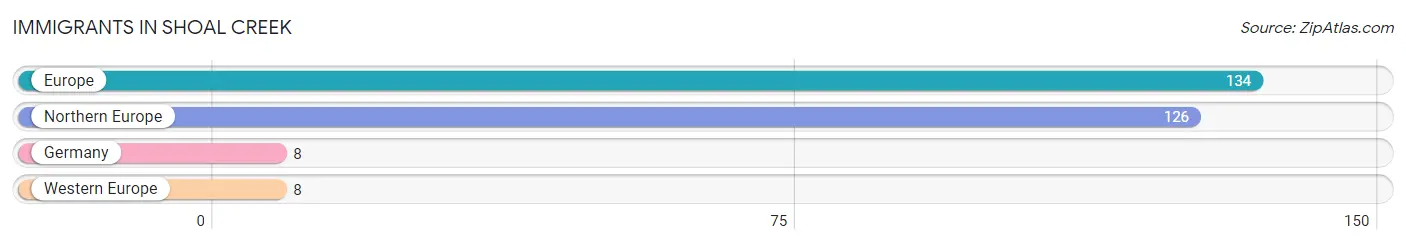
Immigrants in Shoal Creek
The most numerous immigrant groups reported in Shoal Creek came from Europe (134 | 11.4%), Northern Europe (126 | 10.8%), Germany (8 | 0.7%), and Western Europe (8 | 0.7%), together accounting for 23.6% of all Shoal Creek residents.
| Immigration Origin | # Population | % Population |
| Europe | 134 | 11.4% |
| Germany | 8 | 0.7% |
| Northern Europe | 126 | 10.8% |
| Western Europe | 8 | 0.7% | View All 4 Rows |
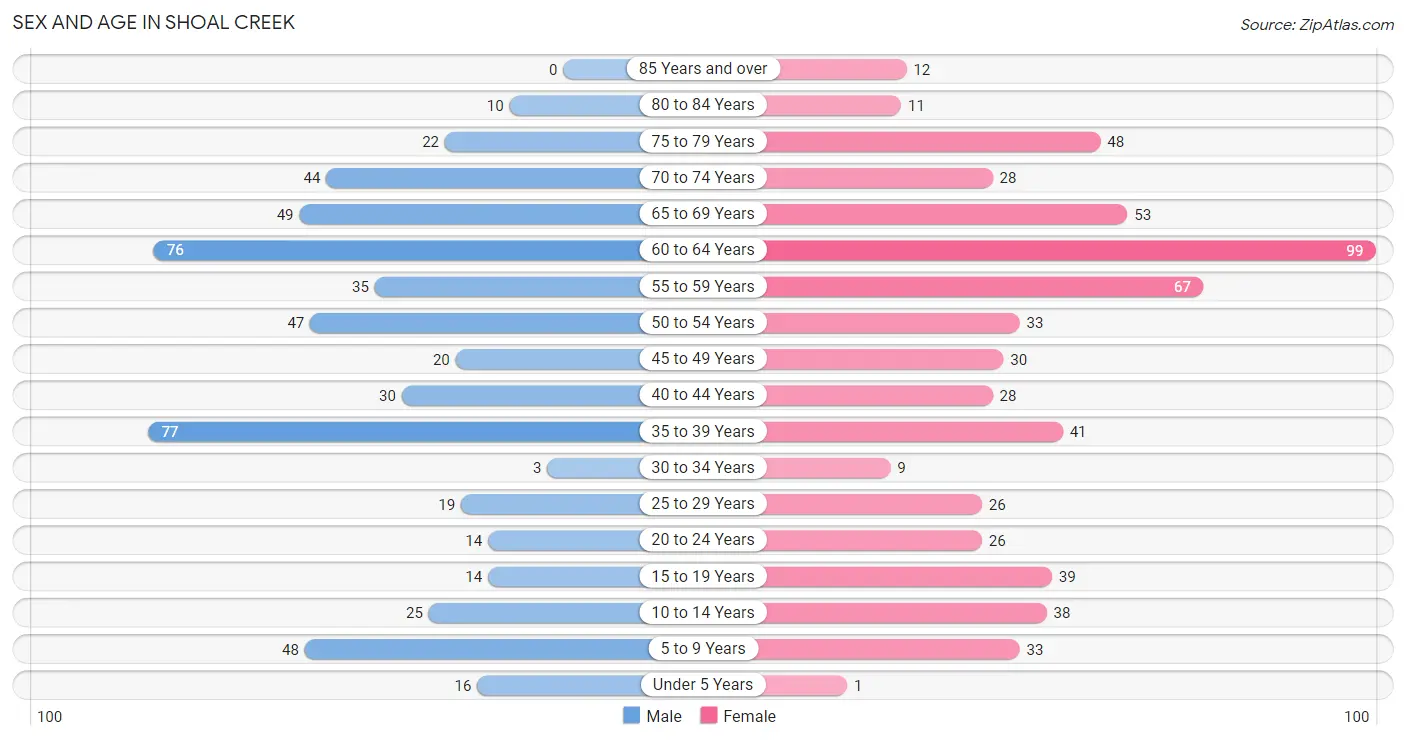
Sex and Age in Shoal Creek
Sex and Age in Shoal Creek
The most populous age groups in Shoal Creek are 35 to 39 Years (77 | 14.0%) for men and 60 to 64 Years (99 | 15.9%) for women.
| Age Bracket | Male | Female |
| Under 5 Years | 16 (2.9%) | 1 (0.2%) |
| 5 to 9 Years | 48 (8.7%) | 33 (5.3%) |
| 10 to 14 Years | 25 (4.5%) | 38 (6.1%) |
| 15 to 19 Years | 14 (2.5%) | 39 (6.3%) |
| 20 to 24 Years | 14 (2.5%) | 26 (4.2%) |
| 25 to 29 Years | 19 (3.5%) | 26 (4.2%) |
| 30 to 34 Years | 3 (0.5%) | 9 (1.5%) |
| 35 to 39 Years | 77 (14.0%) | 41 (6.6%) |
| 40 to 44 Years | 30 (5.5%) | 28 (4.5%) |
| 45 to 49 Years | 20 (3.6%) | 30 (4.8%) |
| 50 to 54 Years | 47 (8.6%) | 33 (5.3%) |
| 55 to 59 Years | 35 (6.4%) | 67 (10.8%) |
| 60 to 64 Years | 76 (13.8%) | 99 (15.9%) |
| 65 to 69 Years | 49 (8.9%) | 53 (8.5%) |
| 70 to 74 Years | 44 (8.0%) | 28 (4.5%) |
| 75 to 79 Years | 22 (4.0%) | 48 (7.7%) |
| 80 to 84 Years | 10 (1.8%) | 11 (1.8%) |
| 85 Years and over | 0 (0.0%) | 12 (1.9%) |
| Total | 549 (100.0%) | 622 (100.0%) |
Families and Households in Shoal Creek
Median Family Size in Shoal Creek
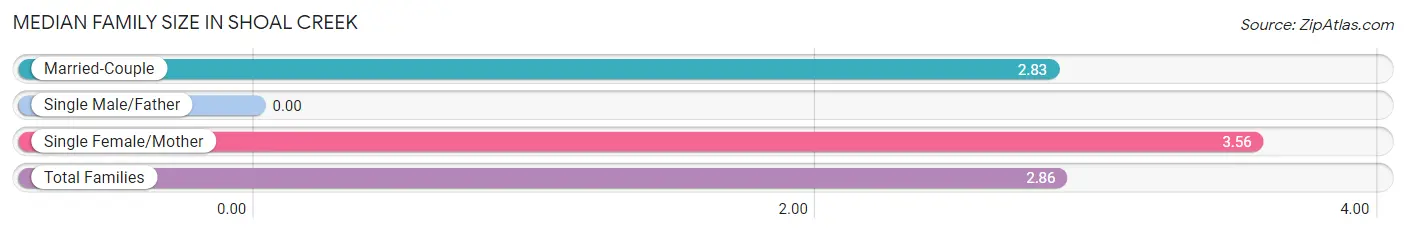
| Family Type | # Families | Family Size |
| Married-Couple | 346 (95.6%) | 2.83 |
| Single Male/Father | 0 (0.0%) | - |
| Single Female/Mother | 16 (4.4%) | 3.56 |
| Total Families | 362 (100.0%) | 2.86 |
Median Household Size in Shoal Creek
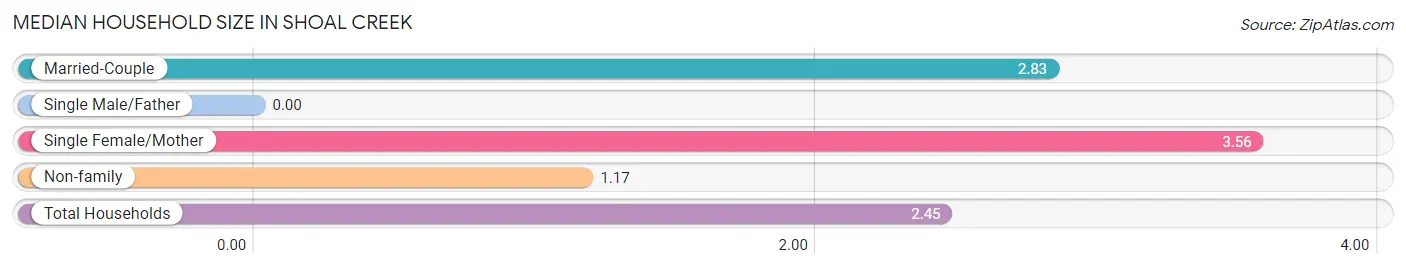
| Household Type | # Households | Household Size |
| Married-Couple | 346 (72.4%) | 2.83 |
| Single Male/Father | 0 (0.0%) | - |
| Single Female/Mother | 16 (3.4%) | 3.56 |
| Non-family | 116 (24.3%) | 1.17 |
| Total Households | 478 (100.0%) | 2.45 |
Household Size by Marriage Status in Shoal Creek
Out of a total of 478 households in Shoal Creek, 362 (75.7%) are family households, while 116 (24.3%) are nonfamily households. The most numerous type of family households are 2-person households, comprising 210, and the most common type of nonfamily households are 1-person households, comprising 103.
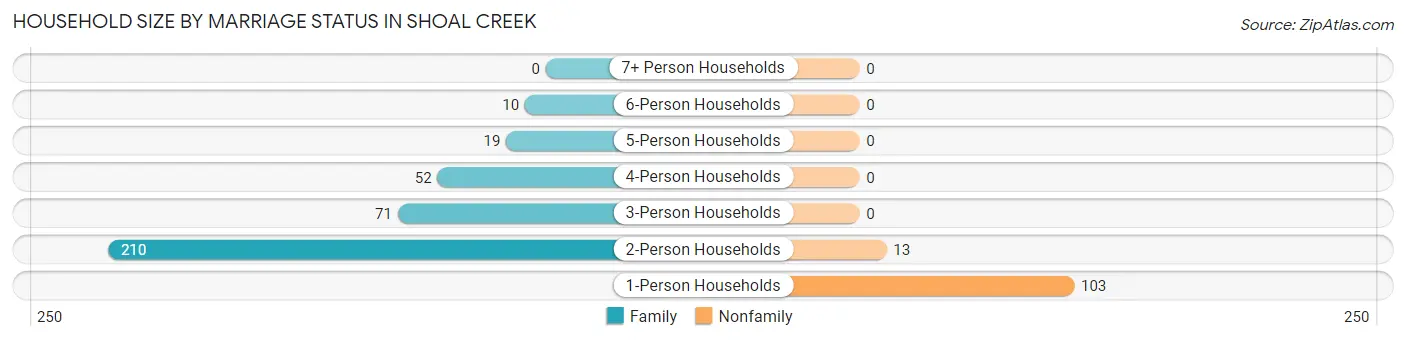
| Household Size | Family Households | Nonfamily Households |
| 1-Person Households | - | 103 (21.5%) |
| 2-Person Households | 210 (43.9%) | 13 (2.7%) |
| 3-Person Households | 71 (14.8%) | 0 (0.0%) |
| 4-Person Households | 52 (10.9%) | 0 (0.0%) |
| 5-Person Households | 19 (4.0%) | 0 (0.0%) |
| 6-Person Households | 10 (2.1%) | 0 (0.0%) |
| 7+ Person Households | 0 (0.0%) | 0 (0.0%) |
| Total | 362 (75.7%) | 116 (24.3%) |
Female Fertility in Shoal Creek
Fertility by Age in Shoal Creek
Average fertility rate in Shoal Creek is 75.0 births per 1,000 women. Women in the age bracket of 35 to 50 years have the highest fertility rate with 140.0 births per 1,000 women. Women in the age bracket of 35 to 50 years acount for 100.0% of all women with births.
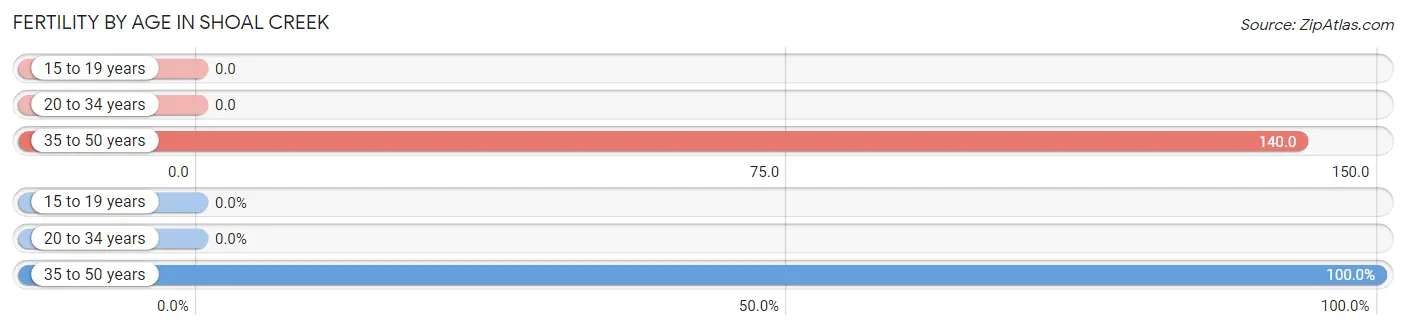
| Age Bracket | Women with Births | Births / 1,000 Women |
| 15 to 19 years | 0 (0.0%) | 0.0 |
| 20 to 34 years | 0 (0.0%) | 0.0 |
| 35 to 50 years | 16 (100.0%) | 140.0 |
| Total | 16 (100.0%) | 75.0 |
Fertility by Age by Marriage Status in Shoal Creek
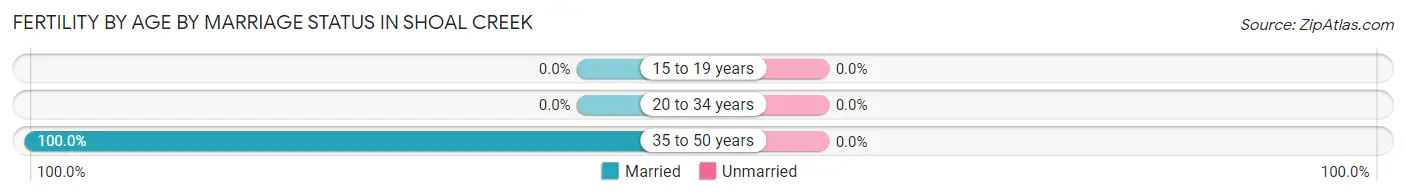
| Age Bracket | Married | Unmarried |
| 15 to 19 years | 0 (0.0%) | 0 (0.0%) |
| 20 to 34 years | 0 (0.0%) | 0 (0.0%) |
| 35 to 50 years | 16 (100.0%) | 0 (0.0%) |
| Total | 16 (100.0%) | 0 (0.0%) |
Fertility by Education in Shoal Creek
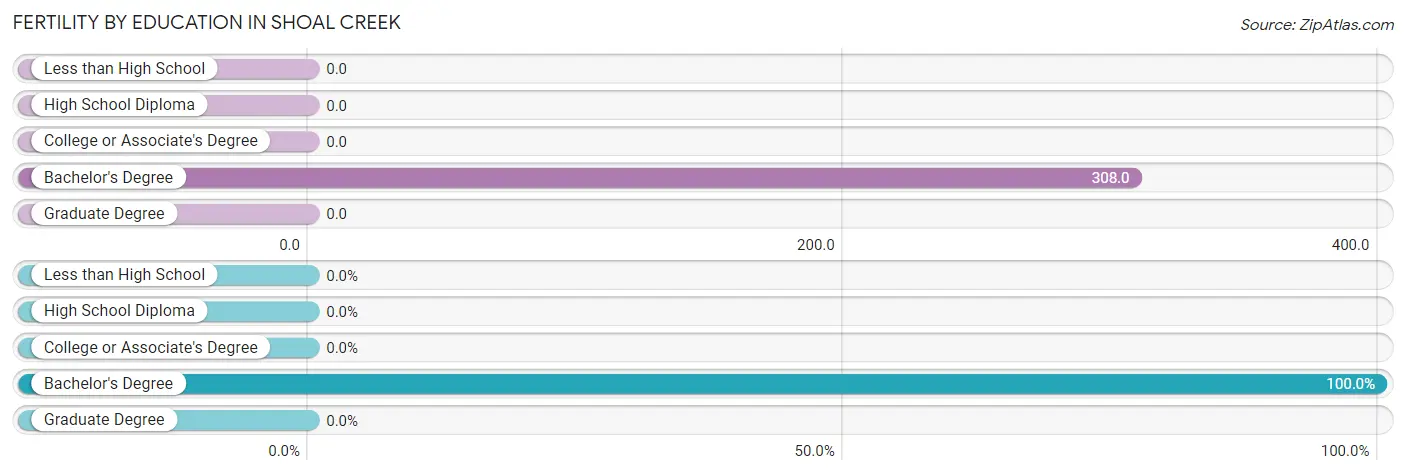
| Educational Attainment | Women with Births | Births / 1,000 Women |
| Less than High School | 0 (0.0%) | 0.0 |
| High School Diploma | 0 (0.0%) | 0.0 |
| College or Associate's Degree | 0 (0.0%) | 0.0 |
| Bachelor's Degree | 16 (100.0%) | 308.0 |
| Graduate Degree | 0 (0.0%) | 0.0 |
| Total | 16 (100.0%) | 75.0 |
Fertility by Education by Marriage Status in Shoal Creek
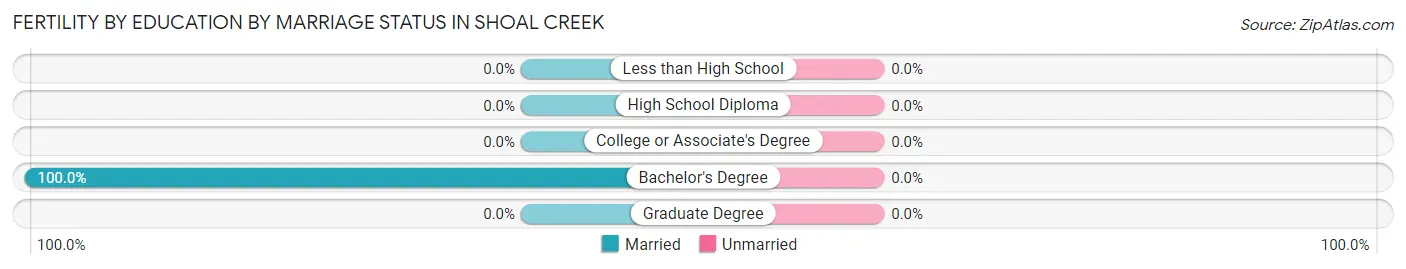
| Educational Attainment | Married | Unmarried |
| Less than High School | 0 (0.0%) | 0 (0.0%) |
| High School Diploma | 0 (0.0%) | 0 (0.0%) |
| College or Associate's Degree | 0 (0.0%) | 0 (0.0%) |
| Bachelor's Degree | 16 (100.0%) | 0 (0.0%) |
| Graduate Degree | 0 (0.0%) | 0 (0.0%) |
| Total | 16 (100.0%) | 0 (0.0%) |
Employment Characteristics in Shoal Creek
Employment by Class of Employer in Shoal Creek
Among the 460 employed individuals in Shoal Creek, private company employees (313 | 68.0%), not-for-profit organizations (48 | 10.4%), and self-employed (incorporated) (34 | 7.4%) make up the most common classes of employment.
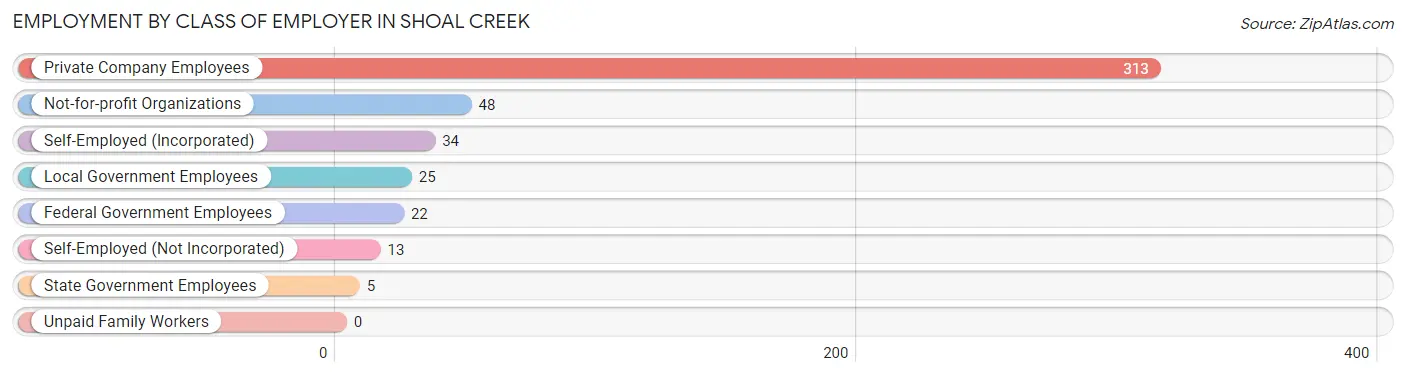
| Employer Class | # Employees | % Employees |
| Private Company Employees | 313 | 68.0% |
| Self-Employed (Incorporated) | 34 | 7.4% |
| Self-Employed (Not Incorporated) | 13 | 2.8% |
| Not-for-profit Organizations | 48 | 10.4% |
| Local Government Employees | 25 | 5.4% |
| State Government Employees | 5 | 1.1% |
| Federal Government Employees | 22 | 4.8% |
| Unpaid Family Workers | 0 | 0.0% |
| Total | 460 | 100.0% |
Employment Status by Age in Shoal Creek
According to the labor force statistics for Shoal Creek, out of the total population over 16 years of age (1,010), 50.3% or 508 individuals are in the labor force, with 3.1% or 16 of them unemployed. The age group with the highest labor force participation rate is 25 to 29 years, with 100.0% or 45 individuals in the labor force. Within the labor force, the 65 to 74 years age range has the highest percentage of unemployed individuals, with 20.8% or 15 of them being unemployed.
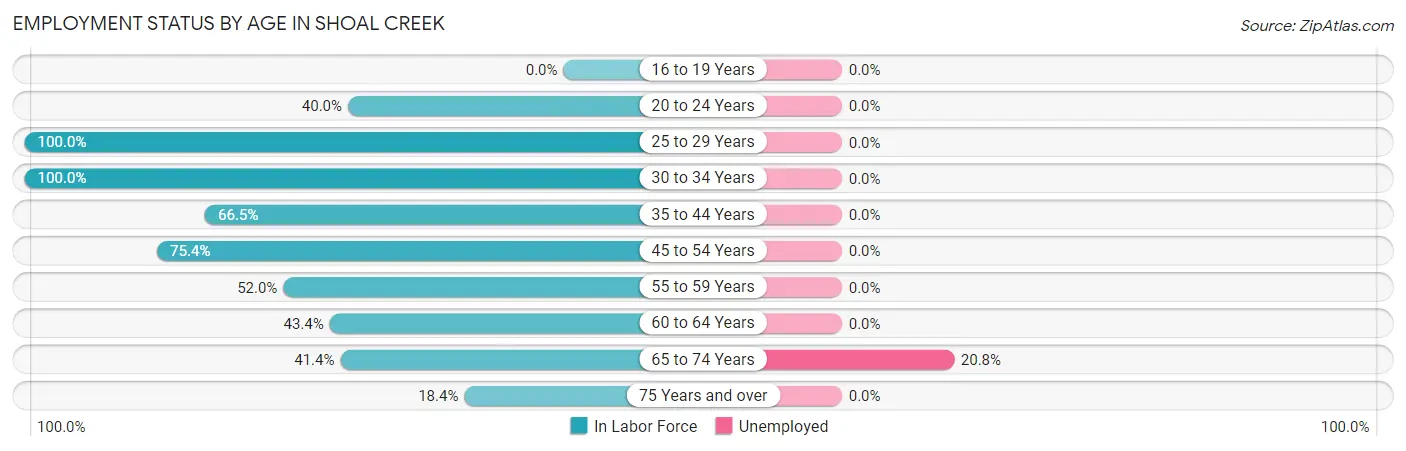
| Age Bracket | In Labor Force | Unemployed |
| 16 to 19 Years | 0 (0.0%) | 0 (0.0%) |
| 20 to 24 Years | 16 (40.0%) | 0 (0.0%) |
| 25 to 29 Years | 45 (100.0%) | 0 (0.0%) |
| 30 to 34 Years | 12 (100.0%) | 0 (0.0%) |
| 35 to 44 Years | 117 (66.5%) | 0 (0.0%) |
| 45 to 54 Years | 98 (75.4%) | 0 (0.0%) |
| 55 to 59 Years | 53 (52.0%) | 0 (0.0%) |
| 60 to 64 Years | 76 (43.4%) | 0 (0.0%) |
| 65 to 74 Years | 72 (41.4%) | 15 (20.8%) |
| 75 Years and over | 19 (18.4%) | 0 (0.0%) |
| Total | 508 (50.3%) | 16 (3.1%) |
Employment Status by Educational Attainment in Shoal Creek
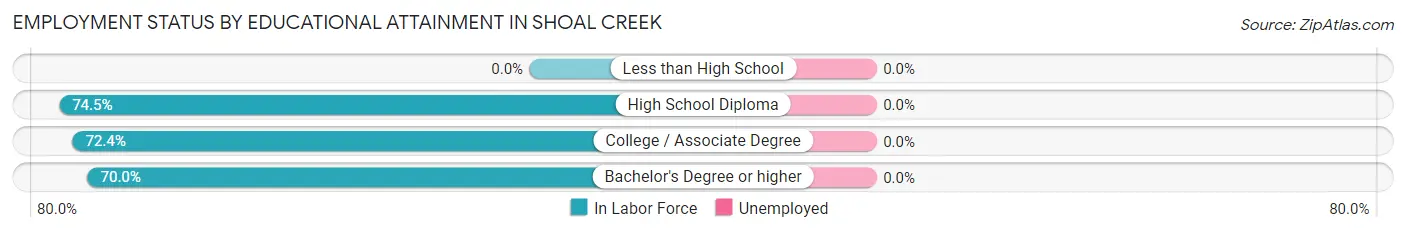
| Educational Attainment | In Labor Force | Unemployed |
| Less than High School | 0 (0.0%) | 0 (0.0%) |
| High School Diploma | 38 (74.5%) | 0 (0.0%) |
| College / Associate Degree | 113 (72.4%) | 0 (0.0%) |
| Bachelor's Degree or higher | 250 (70.0%) | 0 (0.0%) |
| Total | 401 (62.7%) | 0 (0.0%) |
Employment Occupations by Sex in Shoal Creek
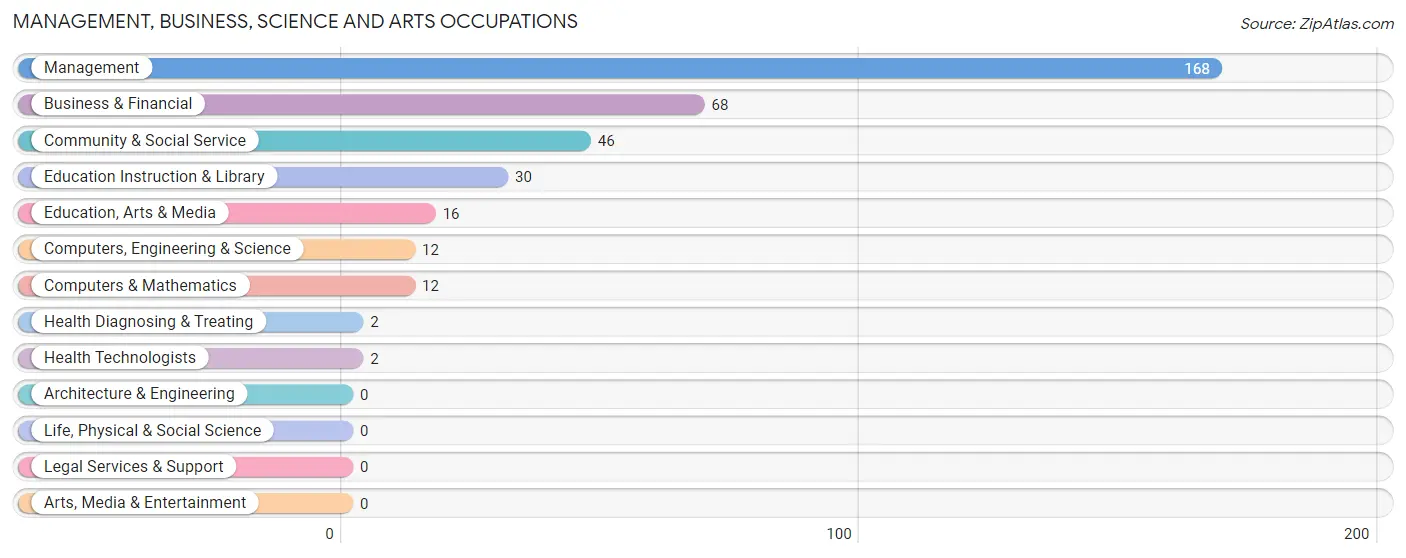
Management, Business, Science and Arts Occupations
The most common Management, Business, Science and Arts occupations in Shoal Creek are Management (168 | 35.4%), Business & Financial (68 | 14.3%), Community & Social Service (46 | 9.7%), Education Instruction & Library (30 | 6.3%), and Education, Arts & Media (16 | 3.4%).
Management, Business, Science and Arts Occupations by Sex
Within the Management, Business, Science and Arts occupations in Shoal Creek, the most male-oriented occupations are Computers, Engineering & Science (100.0%), Computers & Mathematics (100.0%), and Education Instruction & Library (100.0%), while the most female-oriented occupations are Education, Arts & Media (100.0%), Health Diagnosing & Treating (100.0%), and Health Technologists (100.0%).
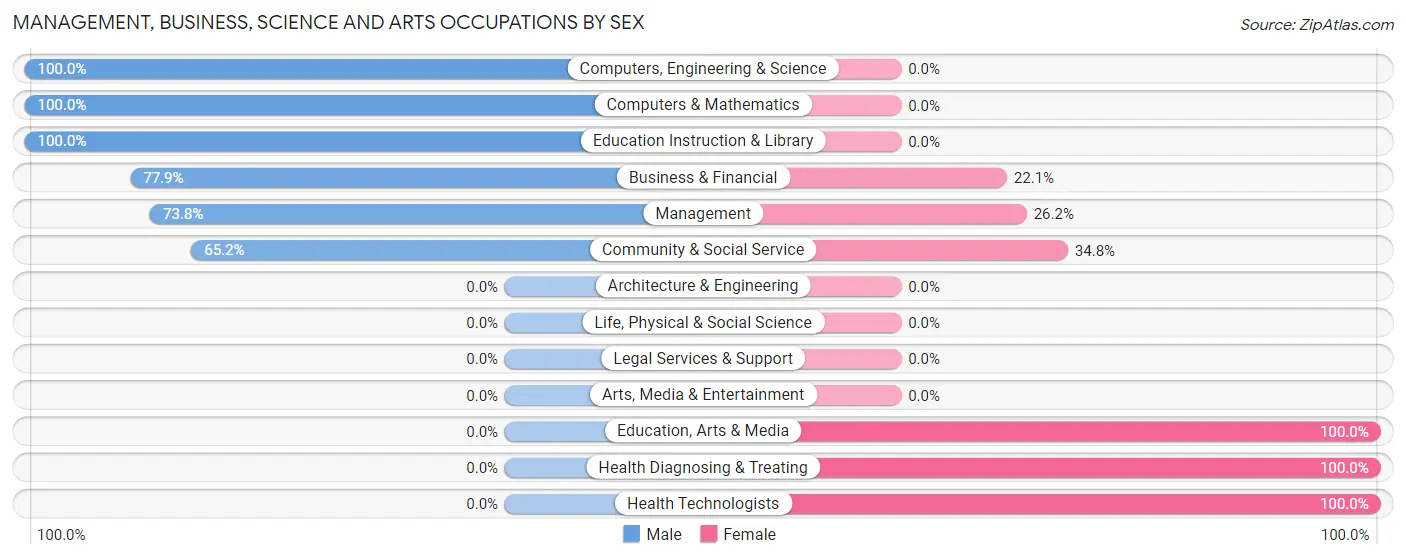
| Occupation | Male | Female |
| Management | 124 (73.8%) | 44 (26.2%) |
| Business & Financial | 53 (77.9%) | 15 (22.1%) |
| Computers, Engineering & Science | 12 (100.0%) | 0 (0.0%) |
| Computers & Mathematics | 12 (100.0%) | 0 (0.0%) |
| Architecture & Engineering | 0 (0.0%) | 0 (0.0%) |
| Life, Physical & Social Science | 0 (0.0%) | 0 (0.0%) |
| Community & Social Service | 30 (65.2%) | 16 (34.8%) |
| Education, Arts & Media | 0 (0.0%) | 16 (100.0%) |
| Legal Services & Support | 0 (0.0%) | 0 (0.0%) |
| Education Instruction & Library | 30 (100.0%) | 0 (0.0%) |
| Arts, Media & Entertainment | 0 (0.0%) | 0 (0.0%) |
| Health Diagnosing & Treating | 0 (0.0%) | 2 (100.0%) |
| Health Technologists | 0 (0.0%) | 2 (100.0%) |
| Total (Category) | 219 (74.0%) | 77 (26.0%) |
| Total (Overall) | 307 (64.8%) | 167 (35.2%) |
Services Occupations
The most common Services occupations in Shoal Creek are Food Preparation & Serving (18 | 3.8%), and Personal Care & Service (17 | 3.6%).
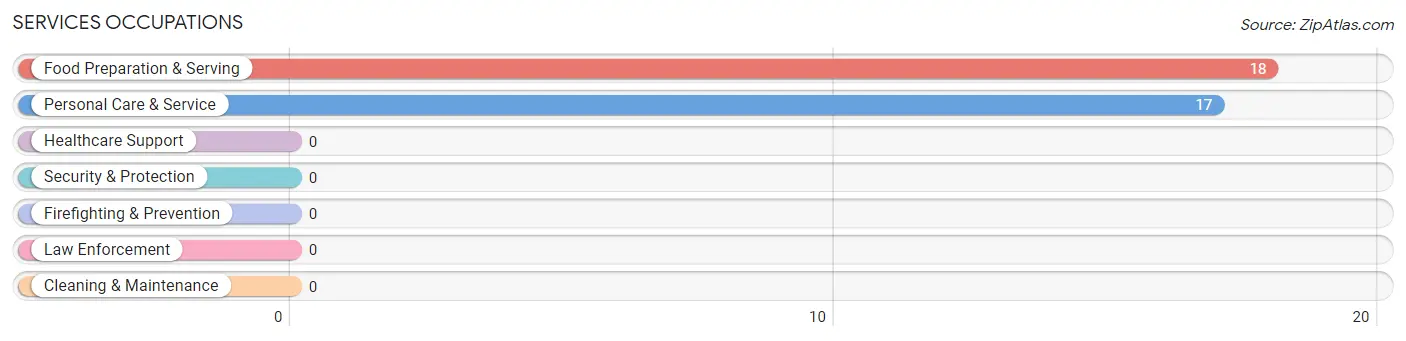
Services Occupations by Sex
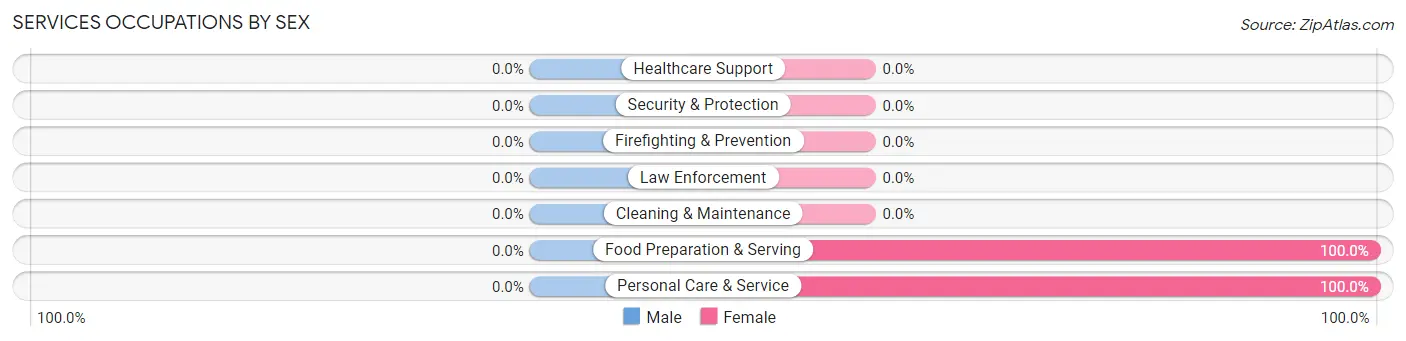
| Occupation | Male | Female |
| Healthcare Support | 0 (0.0%) | 0 (0.0%) |
| Security & Protection | 0 (0.0%) | 0 (0.0%) |
| Firefighting & Prevention | 0 (0.0%) | 0 (0.0%) |
| Law Enforcement | 0 (0.0%) | 0 (0.0%) |
| Food Preparation & Serving | 0 (0.0%) | 18 (100.0%) |
| Cleaning & Maintenance | 0 (0.0%) | 0 (0.0%) |
| Personal Care & Service | 0 (0.0%) | 17 (100.0%) |
| Total (Category) | 0 (0.0%) | 35 (100.0%) |
| Total (Overall) | 307 (64.8%) | 167 (35.2%) |
Sales and Office Occupations
The most common Sales and Office occupations in Shoal Creek are Sales & Related (71 | 15.0%), and Office & Administration (35 | 7.4%).
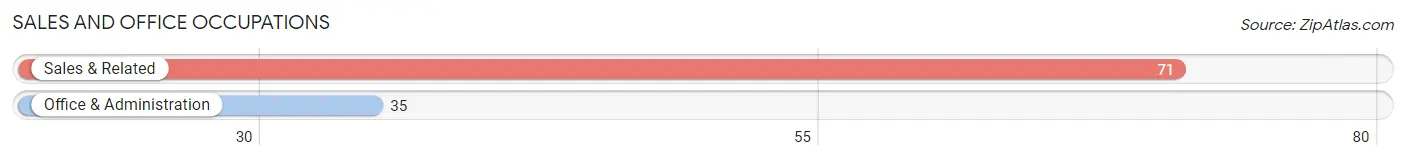
Sales and Office Occupations by Sex
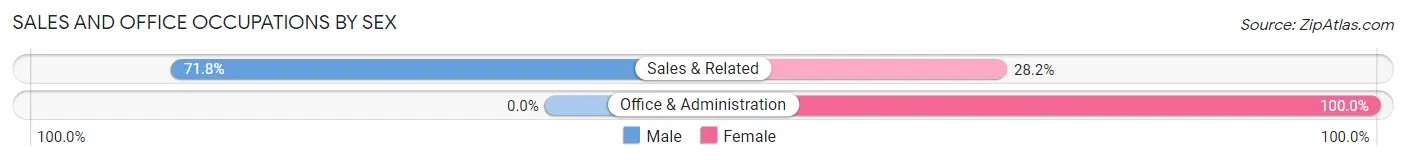
| Occupation | Male | Female |
| Sales & Related | 51 (71.8%) | 20 (28.2%) |
| Office & Administration | 0 (0.0%) | 35 (100.0%) |
| Total (Category) | 51 (48.1%) | 55 (51.9%) |
| Total (Overall) | 307 (64.8%) | 167 (35.2%) |
Natural Resources, Construction and Maintenance Occupations
The most common Natural Resources, Construction and Maintenance occupations in Shoal Creek are , and Installation, Maintenance & Repair (27 | 5.7%).
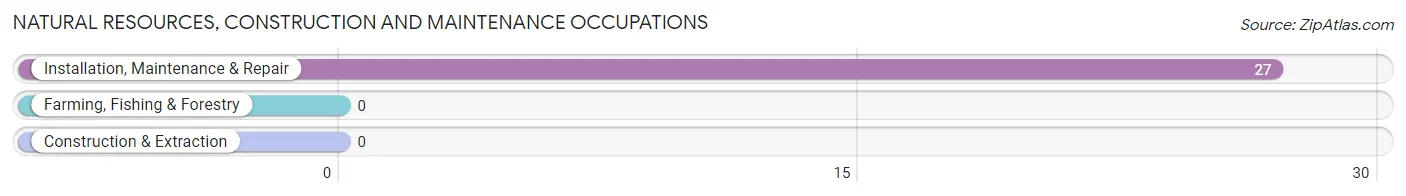
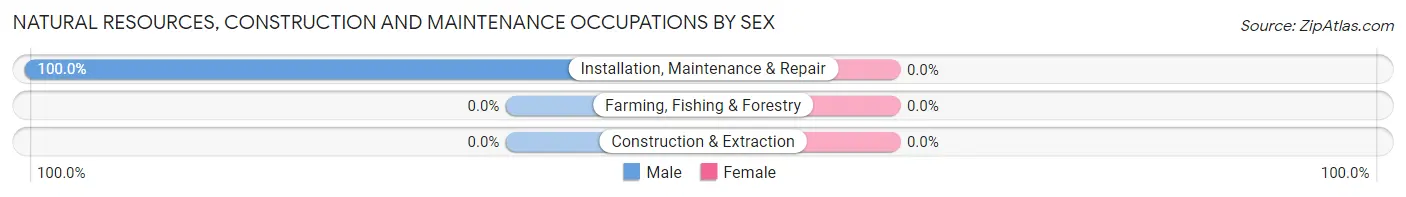
Natural Resources, Construction and Maintenance Occupations by Sex
| Occupation | Male | Female |
| Farming, Fishing & Forestry | 0 (0.0%) | 0 (0.0%) |
| Construction & Extraction | 0 (0.0%) | 0 (0.0%) |
| Installation, Maintenance & Repair | 27 (100.0%) | 0 (0.0%) |
| Total (Category) | 27 (100.0%) | 0 (0.0%) |
| Total (Overall) | 307 (64.8%) | 167 (35.2%) |
Production, Transportation and Moving Occupations
The most common Production, Transportation and Moving occupations in Shoal Creek are , and Transportation (10 | 2.1%).
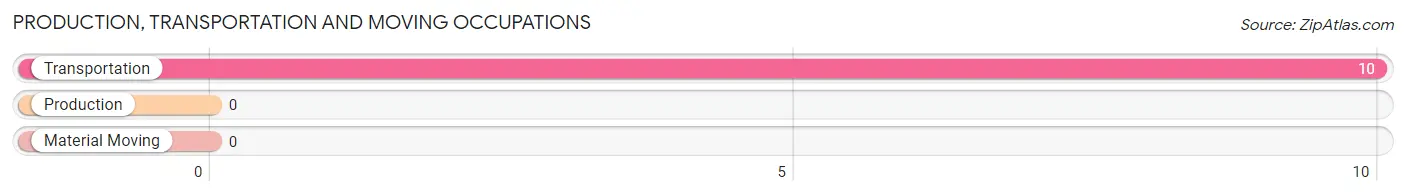
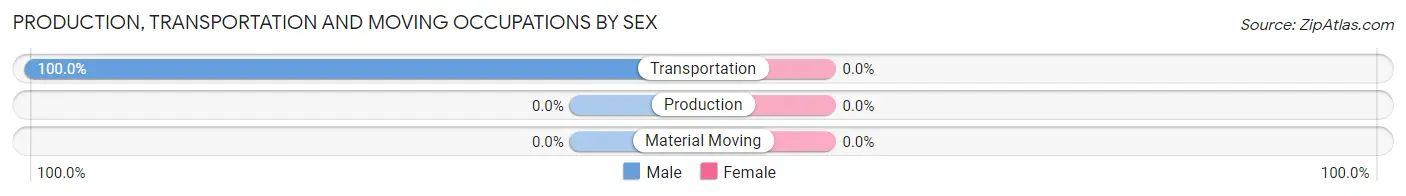
Production, Transportation and Moving Occupations by Sex
| Occupation | Male | Female |
| Production | 0 (0.0%) | 0 (0.0%) |
| Transportation | 10 (100.0%) | 0 (0.0%) |
| Material Moving | 0 (0.0%) | 0 (0.0%) |
| Total (Category) | 10 (100.0%) | 0 (0.0%) |
| Total (Overall) | 307 (64.8%) | 167 (35.2%) |
Employment Industries by Sex in Shoal Creek
Employment Industries in Shoal Creek
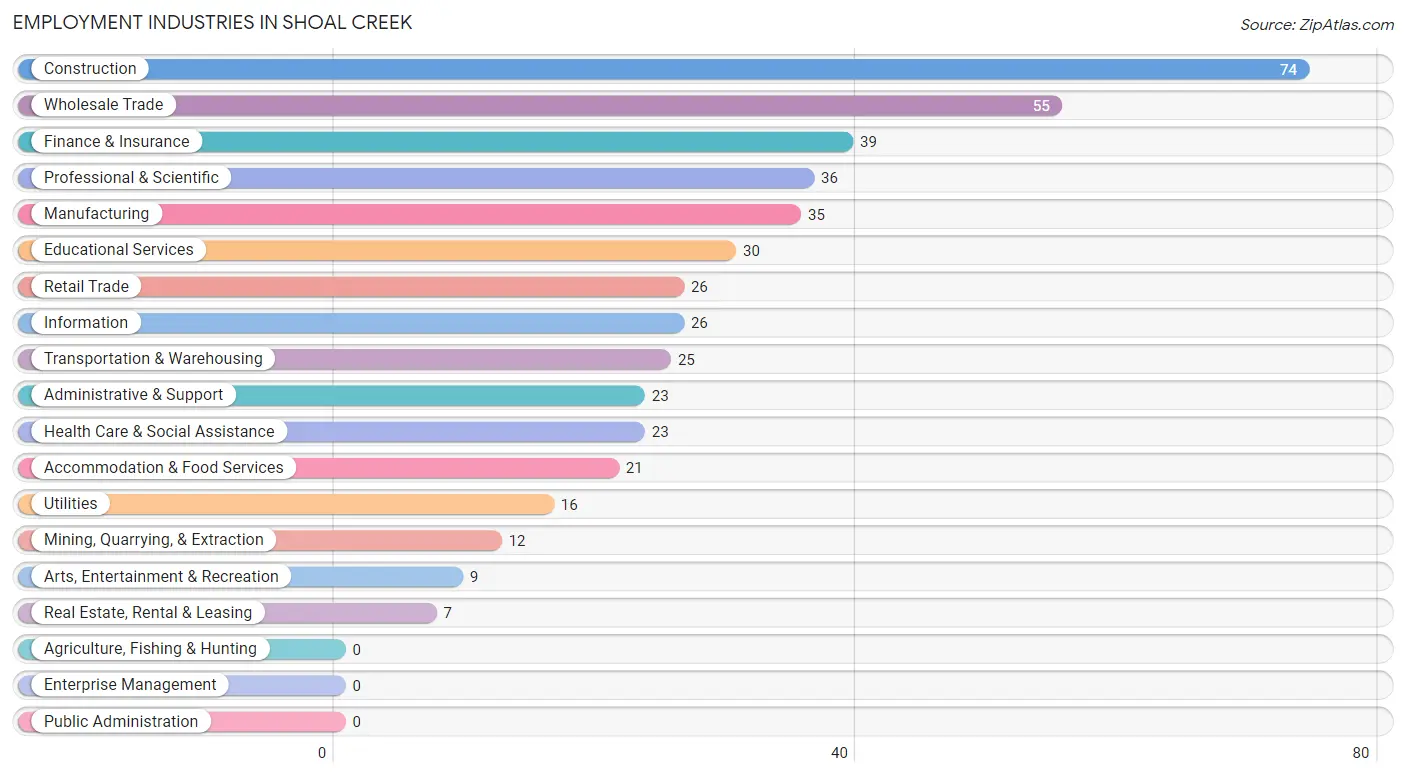
The major employment industries in Shoal Creek include Construction (74 | 15.6%), Wholesale Trade (55 | 11.6%), Finance & Insurance (39 | 8.2%), Professional & Scientific (36 | 7.6%), and Manufacturing (35 | 7.4%).
Employment Industries by Sex in Shoal Creek
The Shoal Creek industries that see more men than women are Mining, Quarrying, & Extraction (100.0%), Finance & Insurance (100.0%), and Real Estate, Rental & Leasing (100.0%), whereas the industries that tend to have a higher number of women are Utilities (100.0%), Accommodation & Food Services (85.7%), and Health Care & Social Assistance (78.3%).
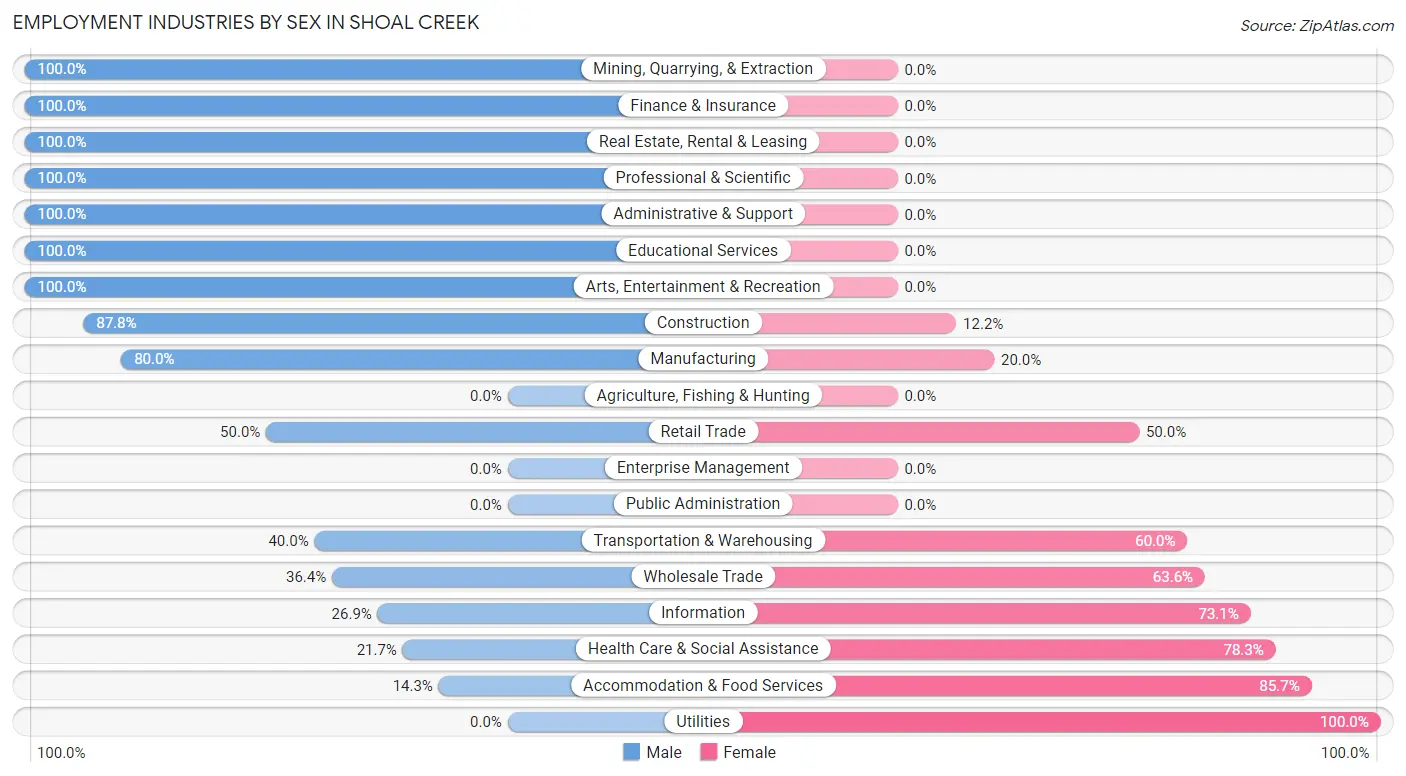
| Industry | Male | Female |
| Agriculture, Fishing & Hunting | 0 (0.0%) | 0 (0.0%) |
| Mining, Quarrying, & Extraction | 12 (100.0%) | 0 (0.0%) |
| Construction | 65 (87.8%) | 9 (12.2%) |
| Manufacturing | 28 (80.0%) | 7 (20.0%) |
| Wholesale Trade | 20 (36.4%) | 35 (63.6%) |
| Retail Trade | 13 (50.0%) | 13 (50.0%) |
| Transportation & Warehousing | 10 (40.0%) | 15 (60.0%) |
| Utilities | 0 (0.0%) | 16 (100.0%) |
| Information | 7 (26.9%) | 19 (73.1%) |
| Finance & Insurance | 39 (100.0%) | 0 (0.0%) |
| Real Estate, Rental & Leasing | 7 (100.0%) | 0 (0.0%) |
| Professional & Scientific | 36 (100.0%) | 0 (0.0%) |
| Enterprise Management | 0 (0.0%) | 0 (0.0%) |
| Administrative & Support | 23 (100.0%) | 0 (0.0%) |
| Educational Services | 30 (100.0%) | 0 (0.0%) |
| Health Care & Social Assistance | 5 (21.7%) | 18 (78.3%) |
| Arts, Entertainment & Recreation | 9 (100.0%) | 0 (0.0%) |
| Accommodation & Food Services | 3 (14.3%) | 18 (85.7%) |
| Public Administration | 0 (0.0%) | 0 (0.0%) |
| Total | 307 (64.8%) | 167 (35.2%) |
Education in Shoal Creek
School Enrollment in Shoal Creek
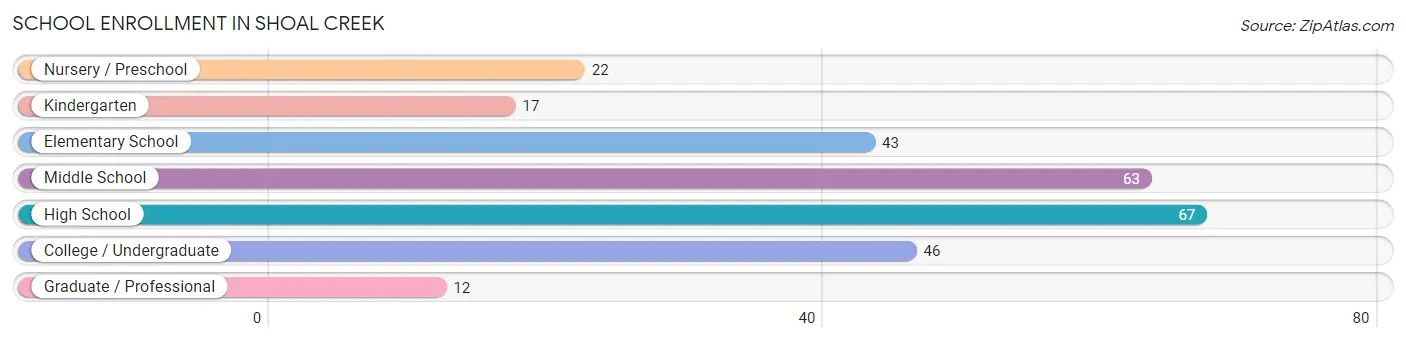
The most common levels of schooling among the 270 students in Shoal Creek are high school (67 | 24.8%), middle school (63 | 23.3%), and college / undergraduate (46 | 17.0%).
| School Level | # Students | % Students |
| Nursery / Preschool | 22 | 8.2% |
| Kindergarten | 17 | 6.3% |
| Elementary School | 43 | 15.9% |
| Middle School | 63 | 23.3% |
| High School | 67 | 24.8% |
| College / Undergraduate | 46 | 17.0% |
| Graduate / Professional | 12 | 4.4% |
| Total | 270 | 100.0% |
School Enrollment by Age by Funding Source in Shoal Creek
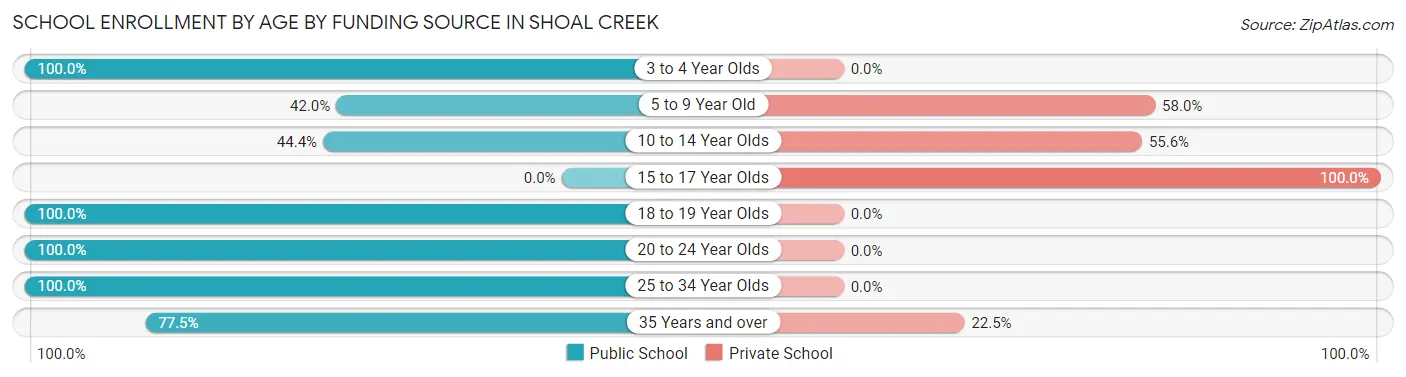
Out of a total of 270 students who are enrolled in schools in Shoal Creek, 119 (44.1%) attend a private institution, while the remaining 151 (55.9%) are enrolled in public schools. The age group of 15 to 17 year olds has the highest likelihood of being enrolled in private schools, with 28 (100.0% in the age bracket) enrolled. Conversely, the age group of 3 to 4 year olds has the lowest likelihood of being enrolled in a private school, with 1 (100.0% in the age bracket) attending a public institution.
| Age Bracket | Public School | Private School |
| 3 to 4 Year Olds | 1 (100.0%) | 0 (0.0%) |
| 5 to 9 Year Old | 34 (42.0%) | 47 (58.0%) |
| 10 to 14 Year Olds | 28 (44.4%) | 35 (55.6%) |
| 15 to 17 Year Olds | 0 (0.0%) | 28 (100.0%) |
| 18 to 19 Year Olds | 25 (100.0%) | 0 (0.0%) |
| 20 to 24 Year Olds | 24 (100.0%) | 0 (0.0%) |
| 25 to 34 Year Olds | 8 (100.0%) | 0 (0.0%) |
| 35 Years and over | 31 (77.5%) | 9 (22.5%) |
| Total | 151 (55.9%) | 119 (44.1%) |
Educational Attainment by Field of Study in Shoal Creek
Business (120 | 21.1%), education (120 | 21.1%), science & technology (51 | 9.0%), physical & health sciences (45 | 7.9%), and bio, nature & agricultural (42 | 7.4%) are the most common fields of study among 568 individuals in Shoal Creek who have obtained a bachelor's degree or higher.
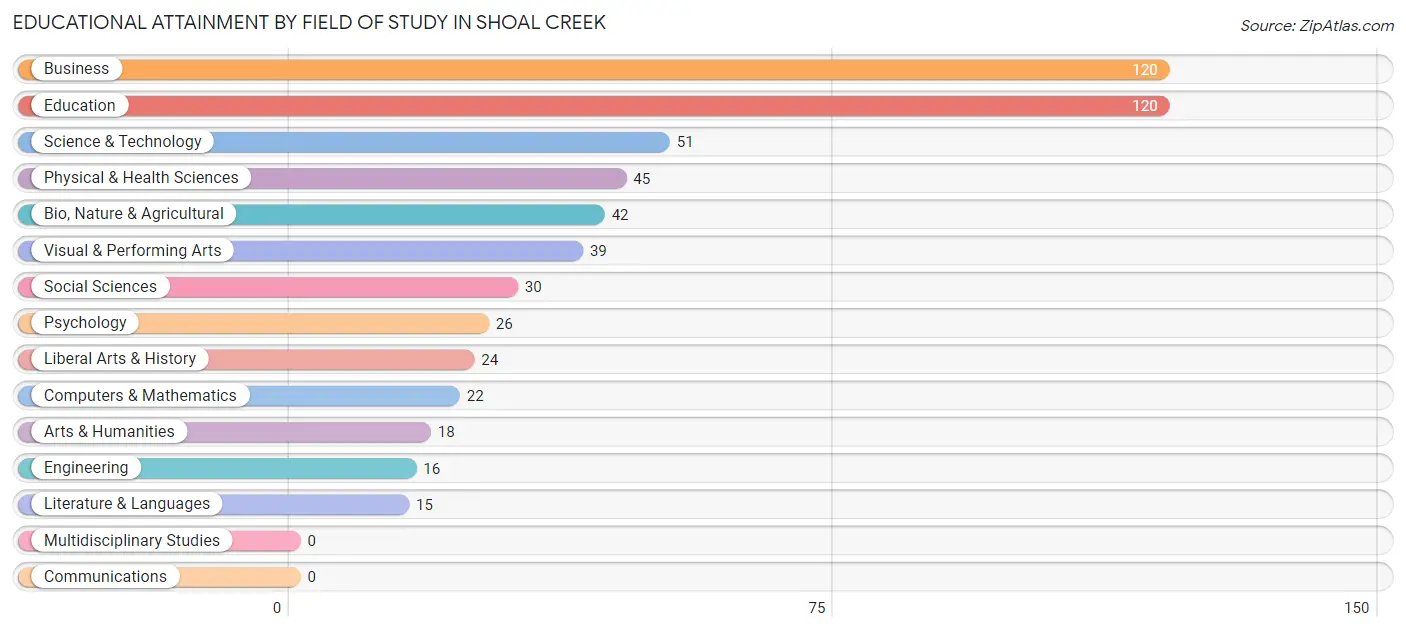
| Field of Study | # Graduates | % Graduates |
| Computers & Mathematics | 22 | 3.9% |
| Bio, Nature & Agricultural | 42 | 7.4% |
| Physical & Health Sciences | 45 | 7.9% |
| Psychology | 26 | 4.6% |
| Social Sciences | 30 | 5.3% |
| Engineering | 16 | 2.8% |
| Multidisciplinary Studies | 0 | 0.0% |
| Science & Technology | 51 | 9.0% |
| Business | 120 | 21.1% |
| Education | 120 | 21.1% |
| Literature & Languages | 15 | 2.6% |
| Liberal Arts & History | 24 | 4.2% |
| Visual & Performing Arts | 39 | 6.9% |
| Communications | 0 | 0.0% |
| Arts & Humanities | 18 | 3.2% |
| Total | 568 | 100.0% |
Transportation & Commute in Shoal Creek
Vehicle Availability by Sex in Shoal Creek
The most prevalent vehicle ownership categories in Shoal Creek are males with 2 vehicles (186, accounting for 60.8%) and females with 2 vehicles (78, making up 120.8%).
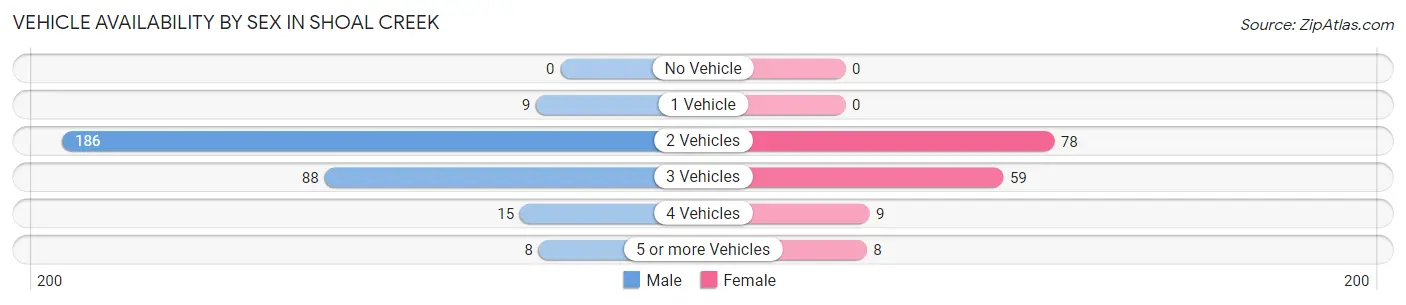
| Vehicles Available | Male | Female |
| No Vehicle | 0 (0.0%) | 0 (0.0%) |
| 1 Vehicle | 9 (2.9%) | 0 (0.0%) |
| 2 Vehicles | 186 (60.8%) | 78 (50.6%) |
| 3 Vehicles | 88 (28.8%) | 59 (38.3%) |
| 4 Vehicles | 15 (4.9%) | 9 (5.8%) |
| 5 or more Vehicles | 8 (2.6%) | 8 (5.2%) |
| Total | 306 (100.0%) | 154 (100.0%) |
Commute Time in Shoal Creek
The most frequently occuring commute durations in Shoal Creek are 30 to 34 minutes (121 commuters, 36.6%), 40 to 44 minutes (62 commuters, 18.7%), and 25 to 29 minutes (57 commuters, 17.2%).
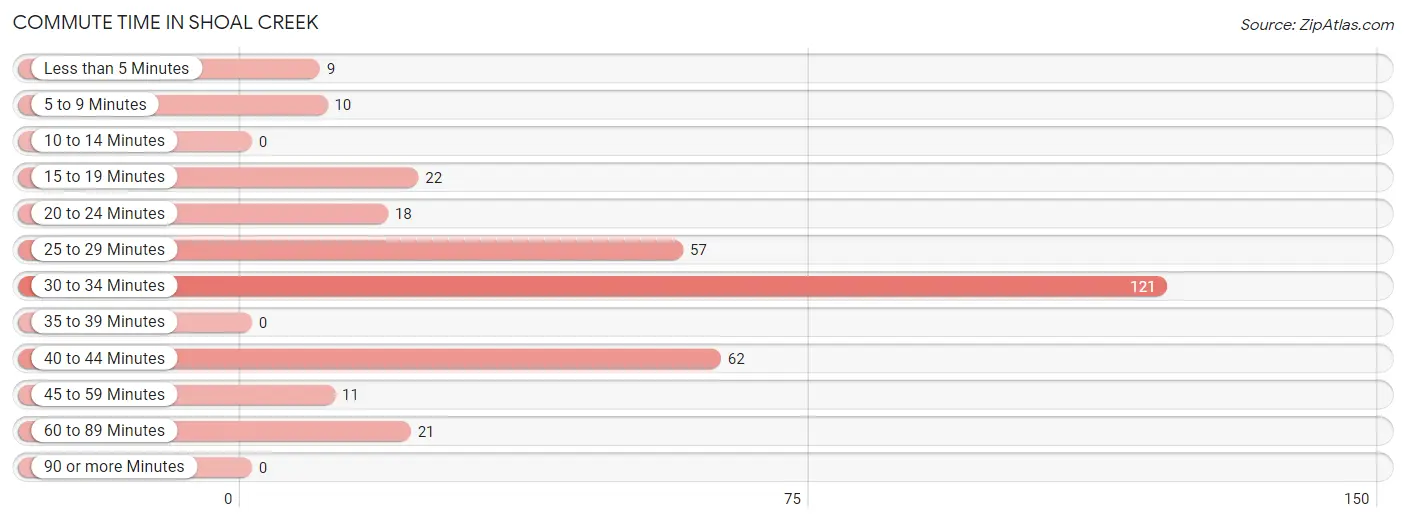
| Commute Time | # Commuters | % Commuters |
| Less than 5 Minutes | 9 | 2.7% |
| 5 to 9 Minutes | 10 | 3.0% |
| 10 to 14 Minutes | 0 | 0.0% |
| 15 to 19 Minutes | 22 | 6.7% |
| 20 to 24 Minutes | 18 | 5.4% |
| 25 to 29 Minutes | 57 | 17.2% |
| 30 to 34 Minutes | 121 | 36.6% |
| 35 to 39 Minutes | 0 | 0.0% |
| 40 to 44 Minutes | 62 | 18.7% |
| 45 to 59 Minutes | 11 | 3.3% |
| 60 to 89 Minutes | 21 | 6.3% |
| 90 or more Minutes | 0 | 0.0% |
Commute Time by Sex in Shoal Creek
The most common commute times in Shoal Creek are 30 to 34 minutes (78 commuters, 34.4%) for males and 30 to 34 minutes (43 commuters, 41.3%) for females.
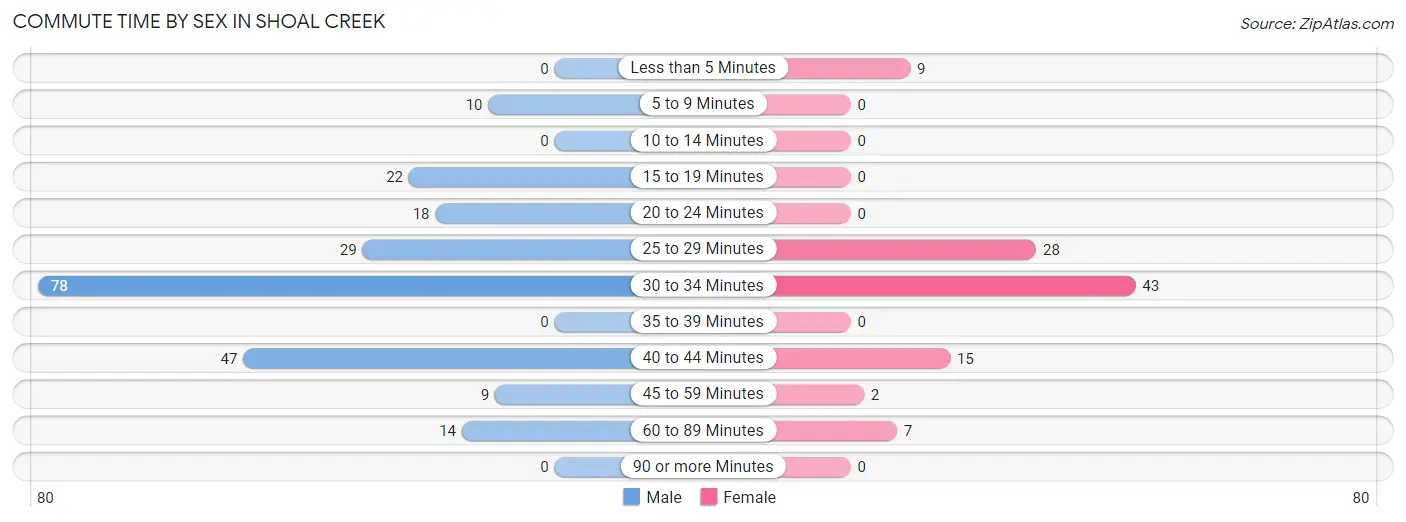
| Commute Time | Male | Female |
| Less than 5 Minutes | 0 (0.0%) | 9 (8.6%) |
| 5 to 9 Minutes | 10 (4.4%) | 0 (0.0%) |
| 10 to 14 Minutes | 0 (0.0%) | 0 (0.0%) |
| 15 to 19 Minutes | 22 (9.7%) | 0 (0.0%) |
| 20 to 24 Minutes | 18 (7.9%) | 0 (0.0%) |
| 25 to 29 Minutes | 29 (12.8%) | 28 (26.9%) |
| 30 to 34 Minutes | 78 (34.4%) | 43 (41.3%) |
| 35 to 39 Minutes | 0 (0.0%) | 0 (0.0%) |
| 40 to 44 Minutes | 47 (20.7%) | 15 (14.4%) |
| 45 to 59 Minutes | 9 (4.0%) | 2 (1.9%) |
| 60 to 89 Minutes | 14 (6.2%) | 7 (6.7%) |
| 90 or more Minutes | 0 (0.0%) | 0 (0.0%) |
Time of Departure to Work by Sex in Shoal Creek
The most frequent times of departure to work in Shoal Creek are 7:00 AM to 7:29 AM (40, 17.6%) for males and 7:30 AM to 7:59 AM (45, 43.3%) for females.
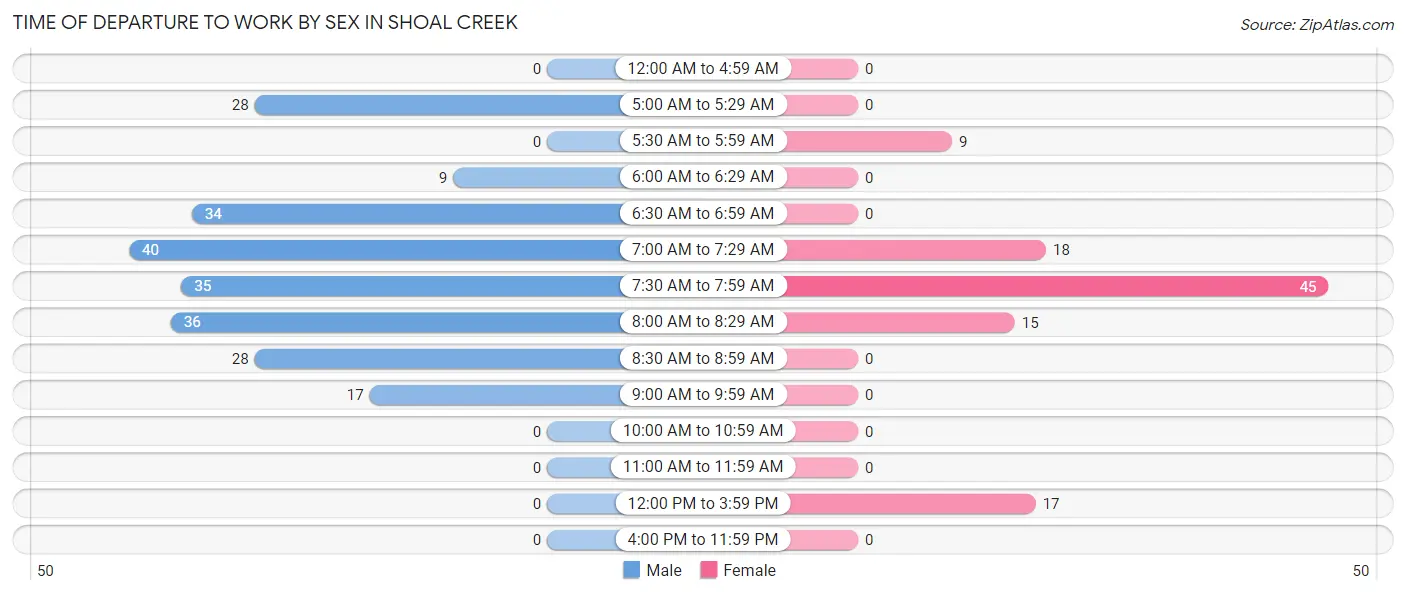
| Time of Departure | Male | Female |
| 12:00 AM to 4:59 AM | 0 (0.0%) | 0 (0.0%) |
| 5:00 AM to 5:29 AM | 28 (12.3%) | 0 (0.0%) |
| 5:30 AM to 5:59 AM | 0 (0.0%) | 9 (8.6%) |
| 6:00 AM to 6:29 AM | 9 (4.0%) | 0 (0.0%) |
| 6:30 AM to 6:59 AM | 34 (15.0%) | 0 (0.0%) |
| 7:00 AM to 7:29 AM | 40 (17.6%) | 18 (17.3%) |
| 7:30 AM to 7:59 AM | 35 (15.4%) | 45 (43.3%) |
| 8:00 AM to 8:29 AM | 36 (15.9%) | 15 (14.4%) |
| 8:30 AM to 8:59 AM | 28 (12.3%) | 0 (0.0%) |
| 9:00 AM to 9:59 AM | 17 (7.5%) | 0 (0.0%) |
| 10:00 AM to 10:59 AM | 0 (0.0%) | 0 (0.0%) |
| 11:00 AM to 11:59 AM | 0 (0.0%) | 0 (0.0%) |
| 12:00 PM to 3:59 PM | 0 (0.0%) | 17 (16.4%) |
| 4:00 PM to 11:59 PM | 0 (0.0%) | 0 (0.0%) |
| Total | 227 (100.0%) | 104 (100.0%) |
Housing Occupancy in Shoal Creek
Occupancy by Ownership in Shoal Creek
Of the total 478 dwellings in Shoal Creek, owner-occupied units account for 450 (94.1%), while renter-occupied units make up 28 (5.9%).
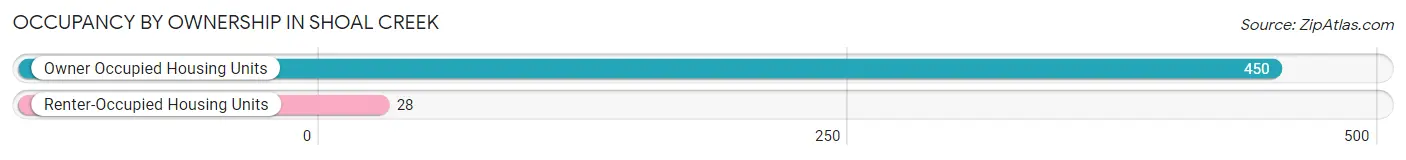
| Occupancy | # Housing Units | % Housing Units |
| Owner Occupied Housing Units | 450 | 94.1% |
| Renter-Occupied Housing Units | 28 | 5.9% |
| Total Occupied Housing Units | 478 | 100.0% |
Occupancy by Household Size in Shoal Creek
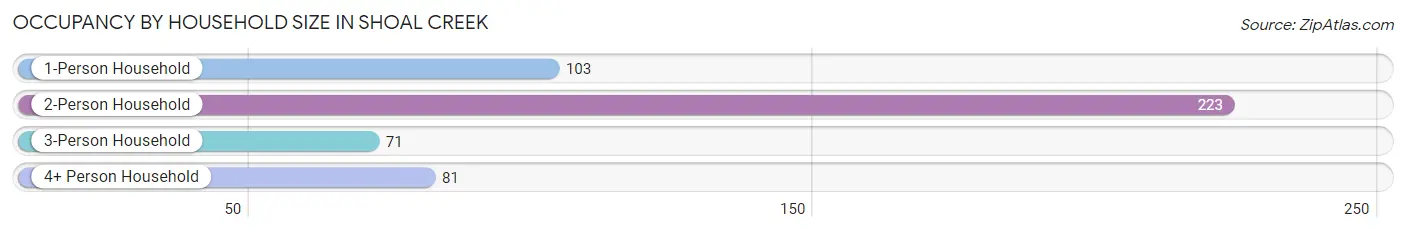
| Household Size | # Housing Units | % Housing Units |
| 1-Person Household | 103 | 21.5% |
| 2-Person Household | 223 | 46.7% |
| 3-Person Household | 71 | 14.8% |
| 4+ Person Household | 81 | 17.0% |
| Total Housing Units | 478 | 100.0% |
Occupancy by Ownership by Household Size in Shoal Creek
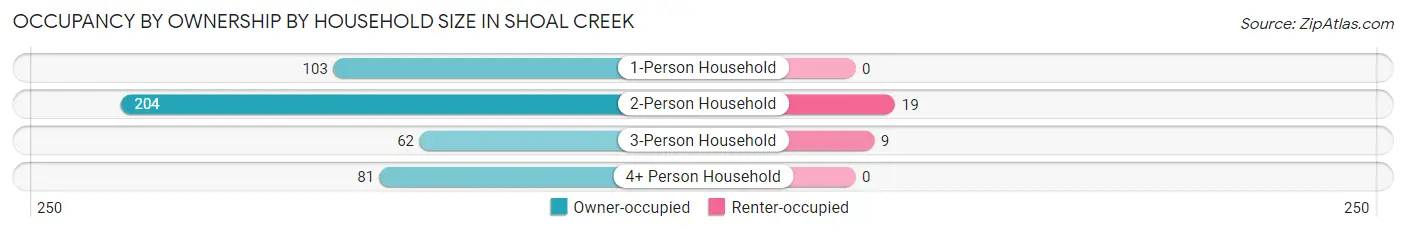
| Household Size | Owner-occupied | Renter-occupied |
| 1-Person Household | 103 (100.0%) | 0 (0.0%) |
| 2-Person Household | 204 (91.5%) | 19 (8.5%) |
| 3-Person Household | 62 (87.3%) | 9 (12.7%) |
| 4+ Person Household | 81 (100.0%) | 0 (0.0%) |
| Total Housing Units | 450 (94.1%) | 28 (5.9%) |
Occupancy by Educational Attainment in Shoal Creek
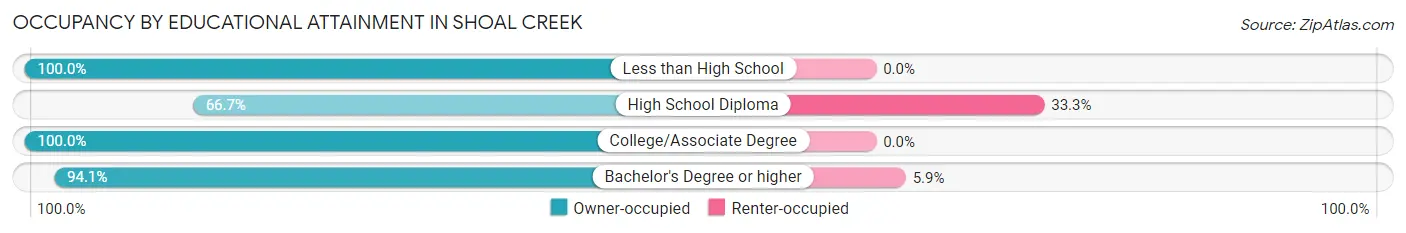
| Household Size | Owner-occupied | Renter-occupied |
| Less than High School | 25 (100.0%) | 0 (0.0%) |
| High School Diploma | 18 (66.7%) | 9 (33.3%) |
| College/Associate Degree | 102 (100.0%) | 0 (0.0%) |
| Bachelor's Degree or higher | 305 (94.1%) | 19 (5.9%) |
Occupancy by Age of Householder in Shoal Creek
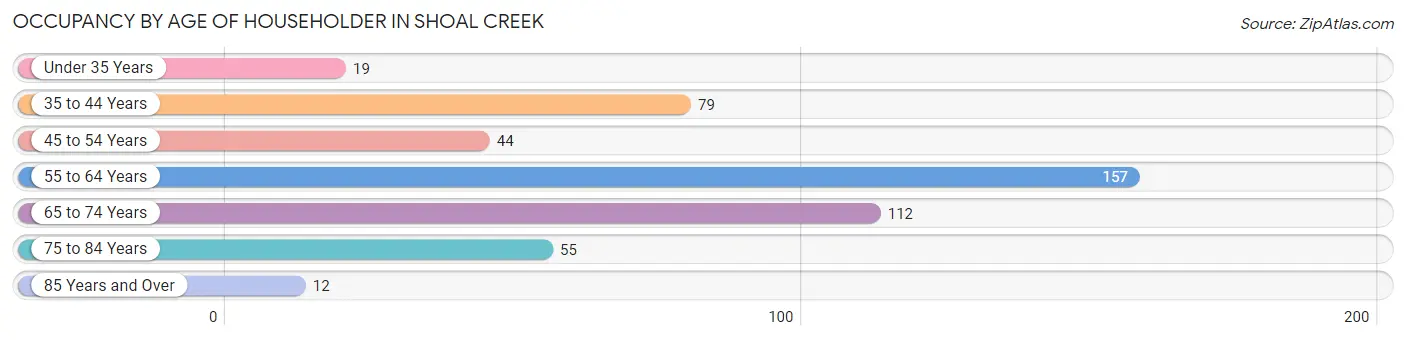
| Age Bracket | # Households | % Households |
| Under 35 Years | 19 | 4.0% |
| 35 to 44 Years | 79 | 16.5% |
| 45 to 54 Years | 44 | 9.2% |
| 55 to 64 Years | 157 | 32.9% |
| 65 to 74 Years | 112 | 23.4% |
| 75 to 84 Years | 55 | 11.5% |
| 85 Years and Over | 12 | 2.5% |
| Total | 478 | 100.0% |
Housing Finances in Shoal Creek
Median Income by Occupancy in Shoal Creek
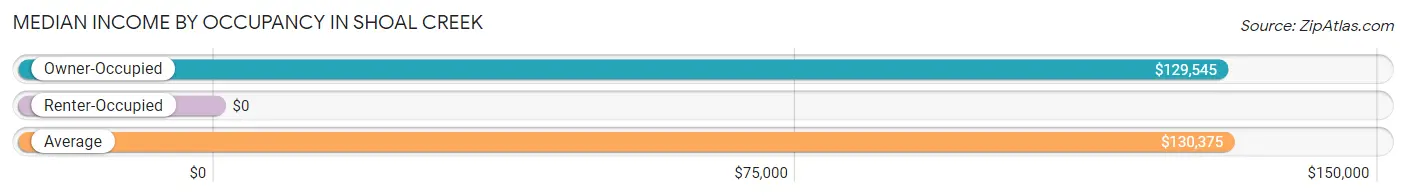
| Occupancy Type | # Households | Median Income |
| Owner-Occupied | 450 (94.1%) | $129,545 |
| Renter-Occupied | 28 (5.9%) | $0 |
| Average | 478 (100.0%) | $130,375 |
Occupancy by Householder Income Bracket in Shoal Creek
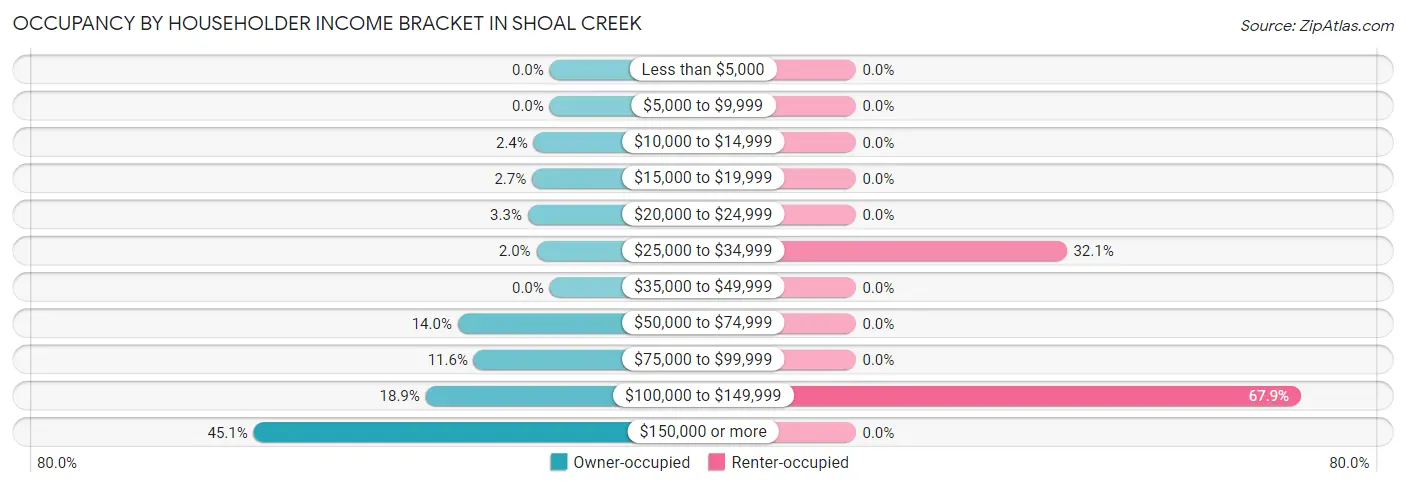
| Income Bracket | Owner-occupied | Renter-occupied |
| Less than $5,000 | 0 (0.0%) | 0 (0.0%) |
| $5,000 to $9,999 | 0 (0.0%) | 0 (0.0%) |
| $10,000 to $14,999 | 11 (2.4%) | 0 (0.0%) |
| $15,000 to $19,999 | 12 (2.7%) | 0 (0.0%) |
| $20,000 to $24,999 | 15 (3.3%) | 0 (0.0%) |
| $25,000 to $34,999 | 9 (2.0%) | 9 (32.1%) |
| $35,000 to $49,999 | 0 (0.0%) | 0 (0.0%) |
| $50,000 to $74,999 | 63 (14.0%) | 0 (0.0%) |
| $75,000 to $99,999 | 52 (11.6%) | 0 (0.0%) |
| $100,000 to $149,999 | 85 (18.9%) | 19 (67.9%) |
| $150,000 or more | 203 (45.1%) | 0 (0.0%) |
| Total | 450 (100.0%) | 28 (100.0%) |
Monthly Housing Cost Tiers in Shoal Creek
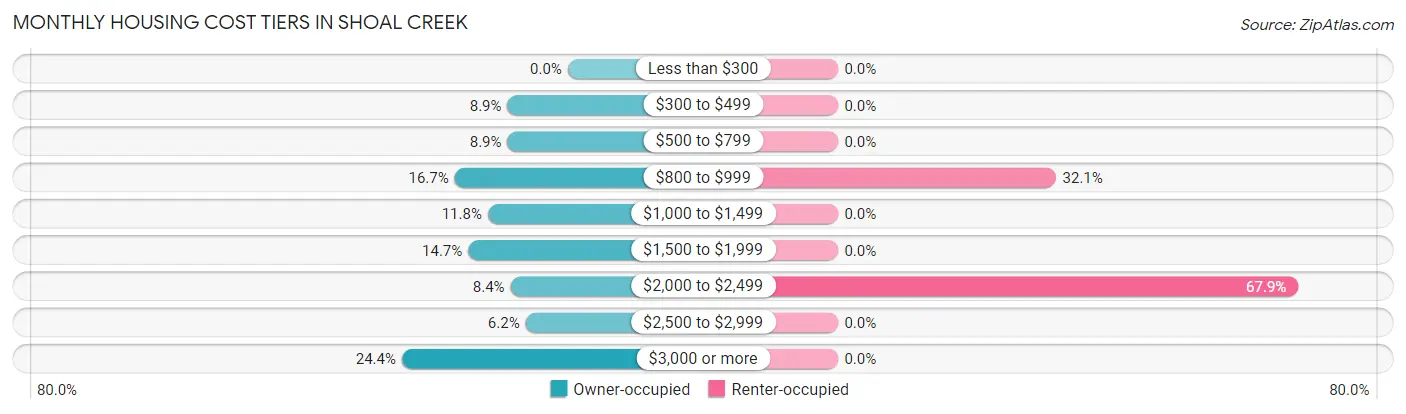
| Monthly Cost | Owner-occupied | Renter-occupied |
| Less than $300 | 0 (0.0%) | 0 (0.0%) |
| $300 to $499 | 40 (8.9%) | 0 (0.0%) |
| $500 to $799 | 40 (8.9%) | 0 (0.0%) |
| $800 to $999 | 75 (16.7%) | 9 (32.1%) |
| $1,000 to $1,499 | 53 (11.8%) | 0 (0.0%) |
| $1,500 to $1,999 | 66 (14.7%) | 0 (0.0%) |
| $2,000 to $2,499 | 38 (8.4%) | 19 (67.9%) |
| $2,500 to $2,999 | 28 (6.2%) | 0 (0.0%) |
| $3,000 or more | 110 (24.4%) | 0 (0.0%) |
| Total | 450 (100.0%) | 28 (100.0%) |
Physical Housing Characteristics in Shoal Creek
Housing Structures in Shoal Creek
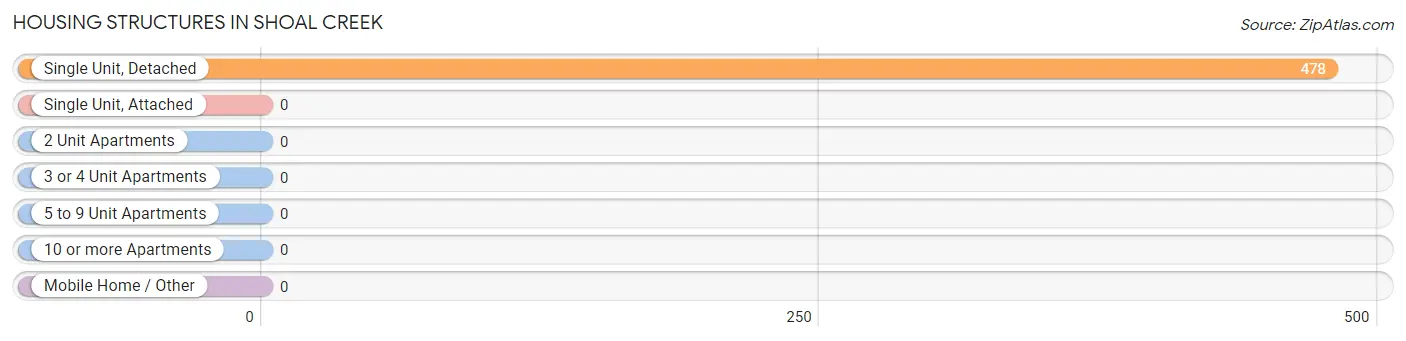
| Structure Type | # Housing Units | % Housing Units |
| Single Unit, Detached | 478 | 100.0% |
| Single Unit, Attached | 0 | 0.0% |
| 2 Unit Apartments | 0 | 0.0% |
| 3 or 4 Unit Apartments | 0 | 0.0% |
| 5 to 9 Unit Apartments | 0 | 0.0% |
| 10 or more Apartments | 0 | 0.0% |
| Mobile Home / Other | 0 | 0.0% |
| Total | 478 | 100.0% |
Housing Structures by Occupancy in Shoal Creek
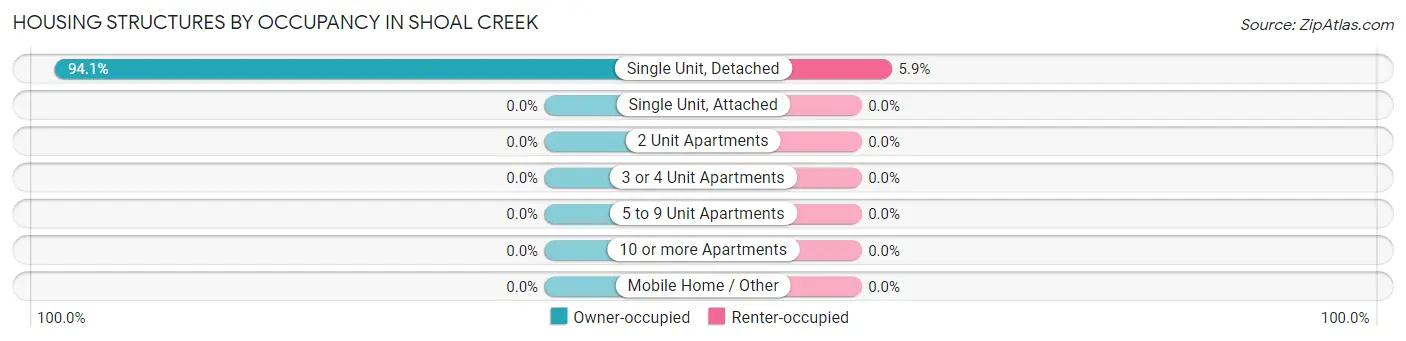
| Structure Type | Owner-occupied | Renter-occupied |
| Single Unit, Detached | 450 (94.1%) | 28 (5.9%) |
| Single Unit, Attached | 0 (0.0%) | 0 (0.0%) |
| 2 Unit Apartments | 0 (0.0%) | 0 (0.0%) |
| 3 or 4 Unit Apartments | 0 (0.0%) | 0 (0.0%) |
| 5 to 9 Unit Apartments | 0 (0.0%) | 0 (0.0%) |
| 10 or more Apartments | 0 (0.0%) | 0 (0.0%) |
| Mobile Home / Other | 0 (0.0%) | 0 (0.0%) |
| Total | 450 (94.1%) | 28 (5.9%) |
Housing Structures by Number of Rooms in Shoal Creek
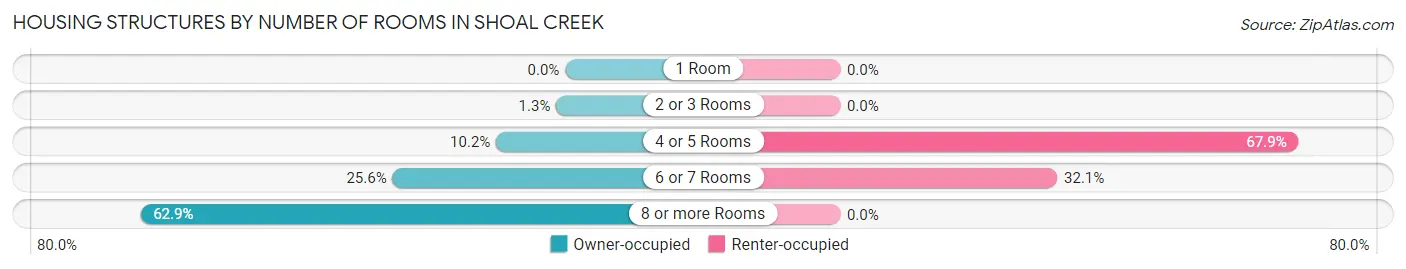
| Number of Rooms | Owner-occupied | Renter-occupied |
| 1 Room | 0 (0.0%) | 0 (0.0%) |
| 2 or 3 Rooms | 6 (1.3%) | 0 (0.0%) |
| 4 or 5 Rooms | 46 (10.2%) | 19 (67.9%) |
| 6 or 7 Rooms | 115 (25.6%) | 9 (32.1%) |
| 8 or more Rooms | 283 (62.9%) | 0 (0.0%) |
| Total | 450 (100.0%) | 28 (100.0%) |
Housing Structure by Heating Type in Shoal Creek
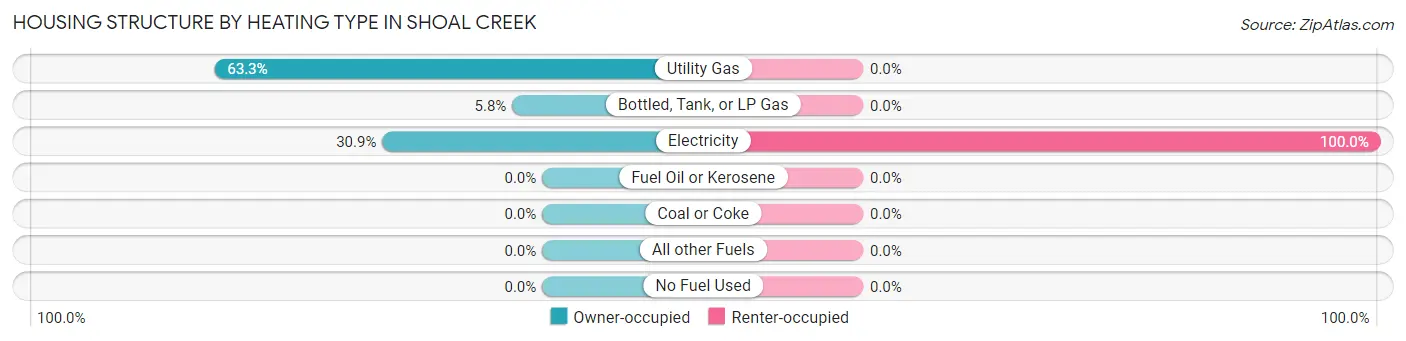
| Heating Type | Owner-occupied | Renter-occupied |
| Utility Gas | 285 (63.3%) | 0 (0.0%) |
| Bottled, Tank, or LP Gas | 26 (5.8%) | 0 (0.0%) |
| Electricity | 139 (30.9%) | 28 (100.0%) |
| Fuel Oil or Kerosene | 0 (0.0%) | 0 (0.0%) |
| Coal or Coke | 0 (0.0%) | 0 (0.0%) |
| All other Fuels | 0 (0.0%) | 0 (0.0%) |
| No Fuel Used | 0 (0.0%) | 0 (0.0%) |
| Total | 450 (100.0%) | 28 (100.0%) |
Household Vehicle Usage in Shoal Creek
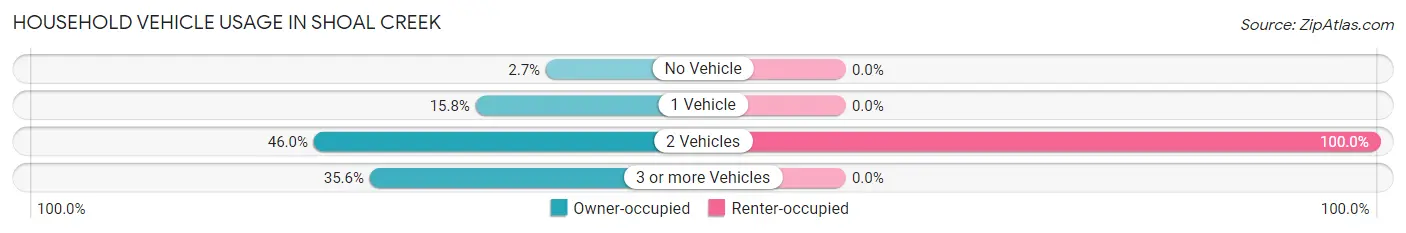
| Vehicles per Household | Owner-occupied | Renter-occupied |
| No Vehicle | 12 (2.7%) | 0 (0.0%) |
| 1 Vehicle | 71 (15.8%) | 0 (0.0%) |
| 2 Vehicles | 207 (46.0%) | 28 (100.0%) |
| 3 or more Vehicles | 160 (35.6%) | 0 (0.0%) |
| Total | 450 (100.0%) | 28 (100.0%) |
Real Estate & Mortgages in Shoal Creek
Real Estate and Mortgage Overview in Shoal Creek
| Characteristic | Without Mortgage | With Mortgage |
| Housing Units | 184 | 266 |
| Median Property Value | $639,500 | $756,500 |
| Median Household Income | $66,750 | $144 |
| Monthly Housing Costs | $839 | $110 |
| Real Estate Taxes | $2,295 | $6 |
Property Value by Mortgage Status in Shoal Creek
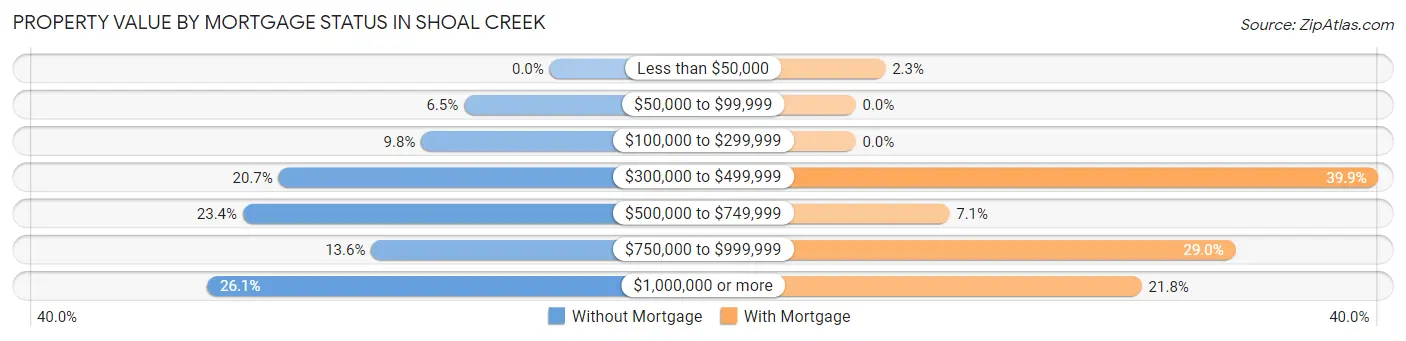
| Property Value | Without Mortgage | With Mortgage |
| Less than $50,000 | 0 (0.0%) | 6 (2.3%) |
| $50,000 to $99,999 | 12 (6.5%) | 0 (0.0%) |
| $100,000 to $299,999 | 18 (9.8%) | 0 (0.0%) |
| $300,000 to $499,999 | 38 (20.6%) | 106 (39.9%) |
| $500,000 to $749,999 | 43 (23.4%) | 19 (7.1%) |
| $750,000 to $999,999 | 25 (13.6%) | 77 (28.9%) |
| $1,000,000 or more | 48 (26.1%) | 58 (21.8%) |
| Total | 184 (100.0%) | 266 (100.0%) |
Household Income by Mortgage Status in Shoal Creek
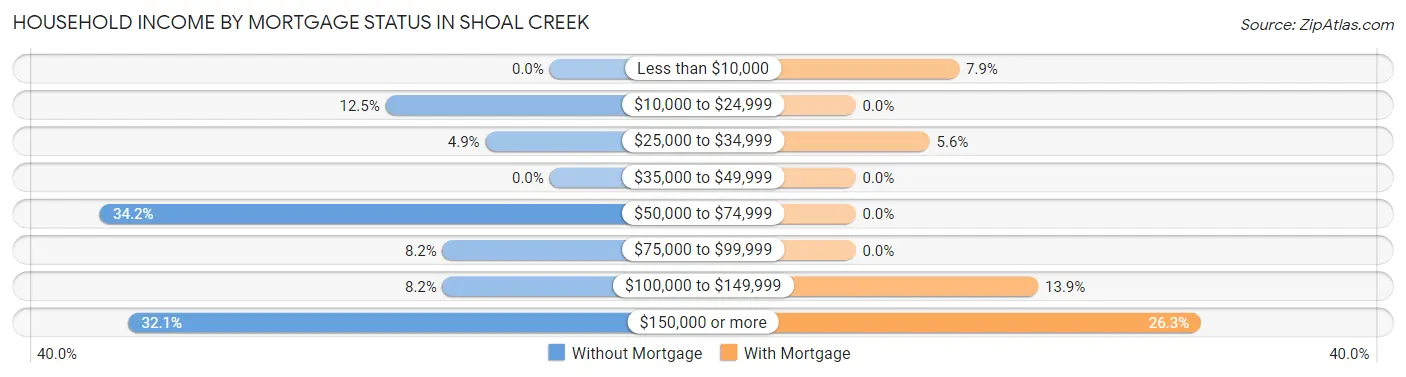
| Household Income | Without Mortgage | With Mortgage |
| Less than $10,000 | 0 (0.0%) | 21 (7.9%) |
| $10,000 to $24,999 | 23 (12.5%) | 0 (0.0%) |
| $25,000 to $34,999 | 9 (4.9%) | 15 (5.6%) |
| $35,000 to $49,999 | 0 (0.0%) | 0 (0.0%) |
| $50,000 to $74,999 | 63 (34.2%) | 0 (0.0%) |
| $75,000 to $99,999 | 15 (8.2%) | 0 (0.0%) |
| $100,000 to $149,999 | 15 (8.2%) | 37 (13.9%) |
| $150,000 or more | 59 (32.1%) | 70 (26.3%) |
| Total | 184 (100.0%) | 266 (100.0%) |
Property Value to Household Income Ratio in Shoal Creek
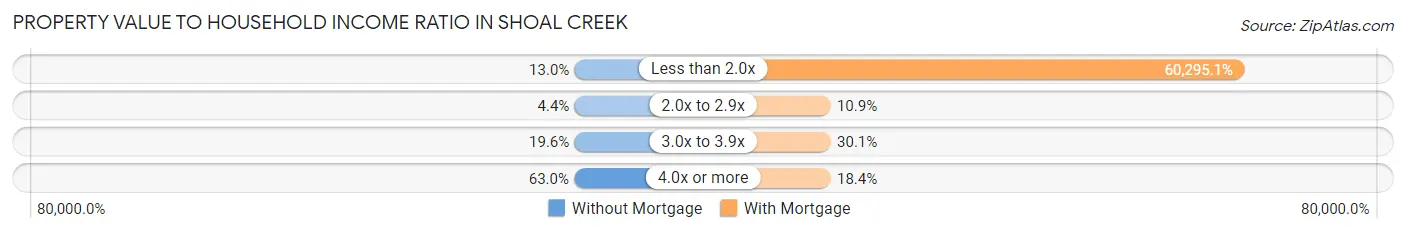
| Value-to-Income Ratio | Without Mortgage | With Mortgage |
| Less than 2.0x | 24 (13.0%) | 160,385 (60,295.1%) |
| 2.0x to 2.9x | 8 (4.3%) | 29 (10.9%) |
| 3.0x to 3.9x | 36 (19.6%) | 80 (30.1%) |
| 4.0x or more | 116 (63.0%) | 49 (18.4%) |
| Total | 184 (100.0%) | 266 (100.0%) |
Real Estate Taxes by Mortgage Status in Shoal Creek
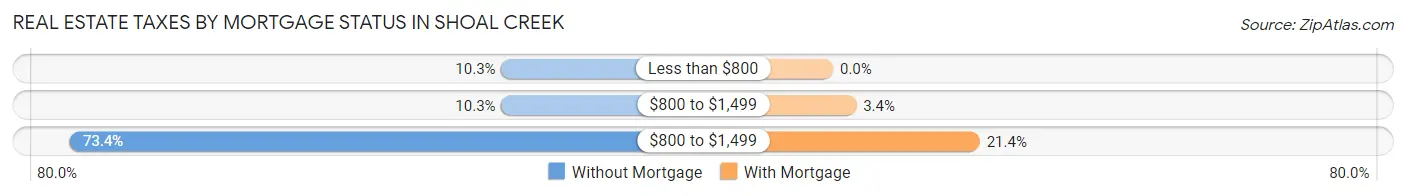
| Property Taxes | Without Mortgage | With Mortgage |
| Less than $800 | 19 (10.3%) | 0 (0.0%) |
| $800 to $1,499 | 19 (10.3%) | 9 (3.4%) |
| $800 to $1,499 | 135 (73.4%) | 57 (21.4%) |
| Total | 184 (100.0%) | 266 (100.0%) |
Health & Disability in Shoal Creek
Health Insurance Coverage by Age in Shoal Creek
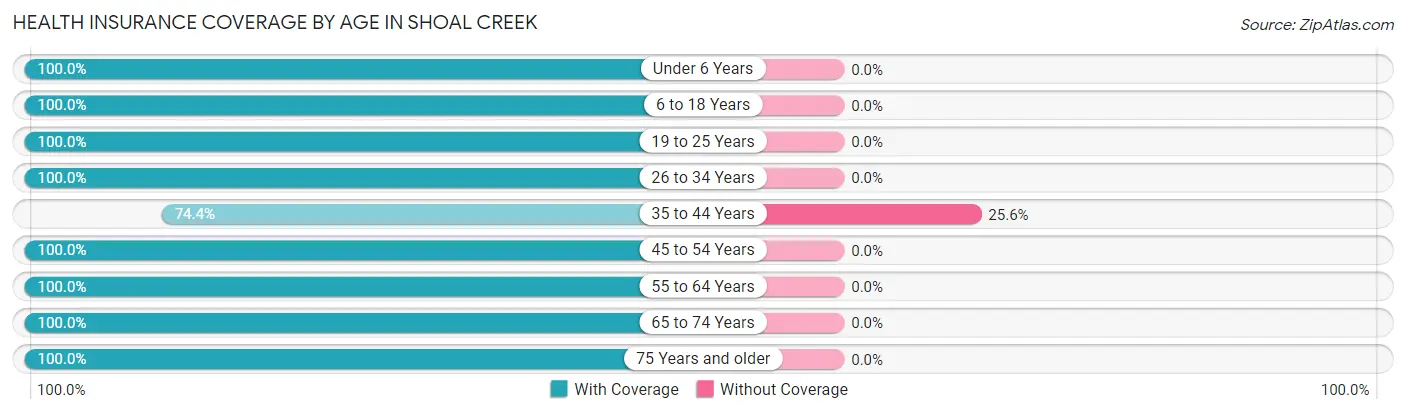
| Age Bracket | With Coverage | Without Coverage |
| Under 6 Years | 38 (100.0%) | 0 (0.0%) |
| 6 to 18 Years | 176 (100.0%) | 0 (0.0%) |
| 19 to 25 Years | 49 (100.0%) | 0 (0.0%) |
| 26 to 34 Years | 29 (100.0%) | 0 (0.0%) |
| 35 to 44 Years | 131 (74.4%) | 45 (25.6%) |
| 45 to 54 Years | 130 (100.0%) | 0 (0.0%) |
| 55 to 64 Years | 277 (100.0%) | 0 (0.0%) |
| 65 to 74 Years | 174 (100.0%) | 0 (0.0%) |
| 75 Years and older | 103 (100.0%) | 0 (0.0%) |
| Total | 1,107 (96.1%) | 45 (3.9%) |
Health Insurance Coverage by Citizenship Status in Shoal Creek
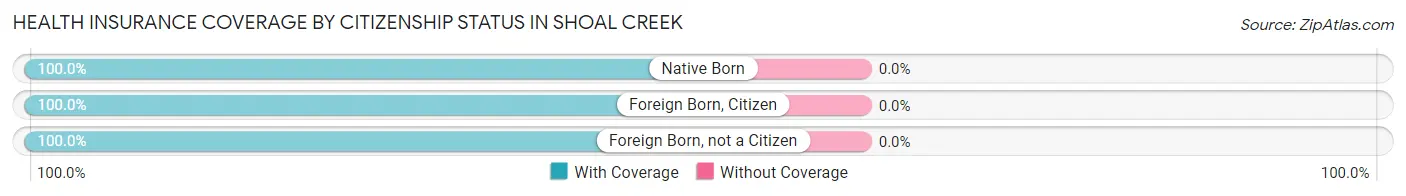
| Citizenship Status | With Coverage | Without Coverage |
| Native Born | 38 (100.0%) | 0 (0.0%) |
| Foreign Born, Citizen | 176 (100.0%) | 0 (0.0%) |
| Foreign Born, not a Citizen | 49 (100.0%) | 0 (0.0%) |
Health Insurance Coverage by Household Income in Shoal Creek
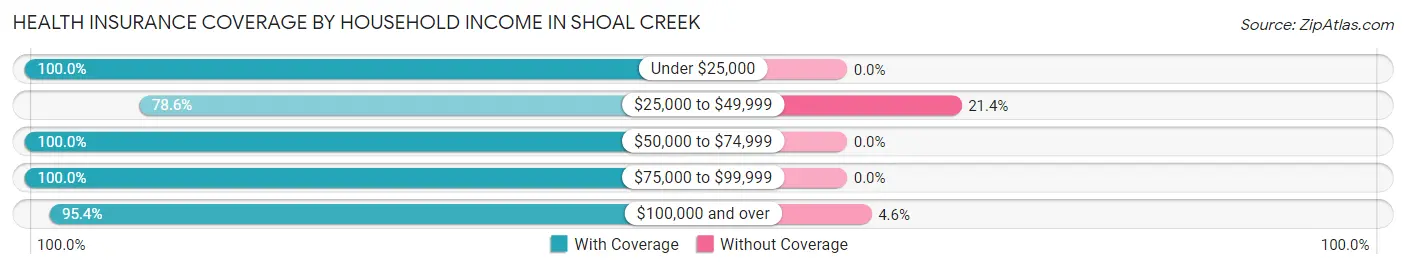
| Household Income | With Coverage | Without Coverage |
| Under $25,000 | 38 (100.0%) | 0 (0.0%) |
| $25,000 to $49,999 | 33 (78.6%) | 9 (21.4%) |
| $50,000 to $74,999 | 178 (100.0%) | 0 (0.0%) |
| $75,000 to $99,999 | 108 (100.0%) | 0 (0.0%) |
| $100,000 and over | 750 (95.4%) | 36 (4.6%) |
Public vs Private Health Insurance Coverage by Age in Shoal Creek
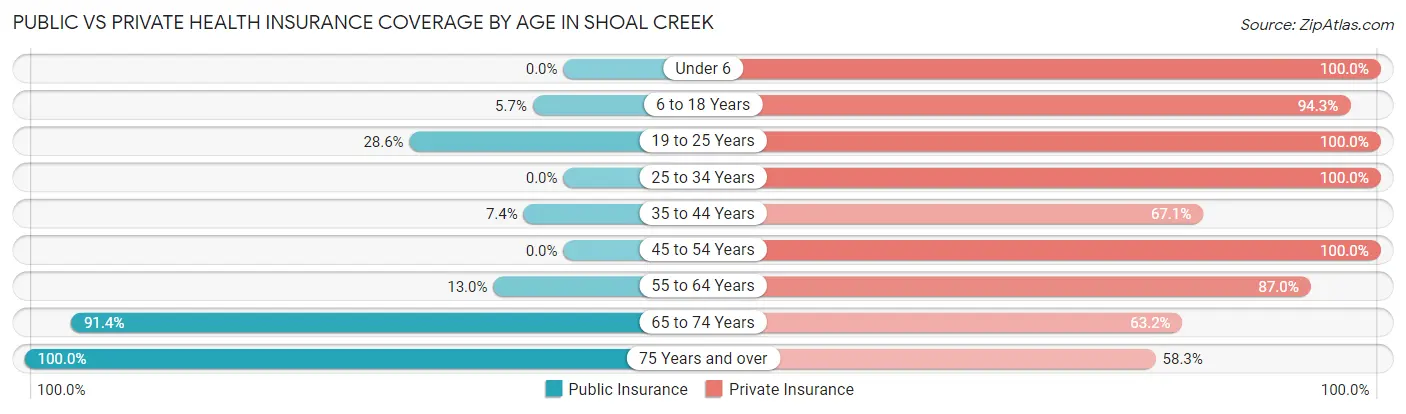
| Age Bracket | Public Insurance | Private Insurance |
| Under 6 | 0 (0.0%) | 38 (100.0%) |
| 6 to 18 Years | 10 (5.7%) | 166 (94.3%) |
| 19 to 25 Years | 14 (28.6%) | 49 (100.0%) |
| 25 to 34 Years | 0 (0.0%) | 29 (100.0%) |
| 35 to 44 Years | 13 (7.4%) | 118 (67.0%) |
| 45 to 54 Years | 0 (0.0%) | 130 (100.0%) |
| 55 to 64 Years | 36 (13.0%) | 241 (87.0%) |
| 65 to 74 Years | 159 (91.4%) | 110 (63.2%) |
| 75 Years and over | 103 (100.0%) | 60 (58.3%) |
| Total | 335 (29.1%) | 941 (81.7%) |
Disability Status by Sex by Age in Shoal Creek
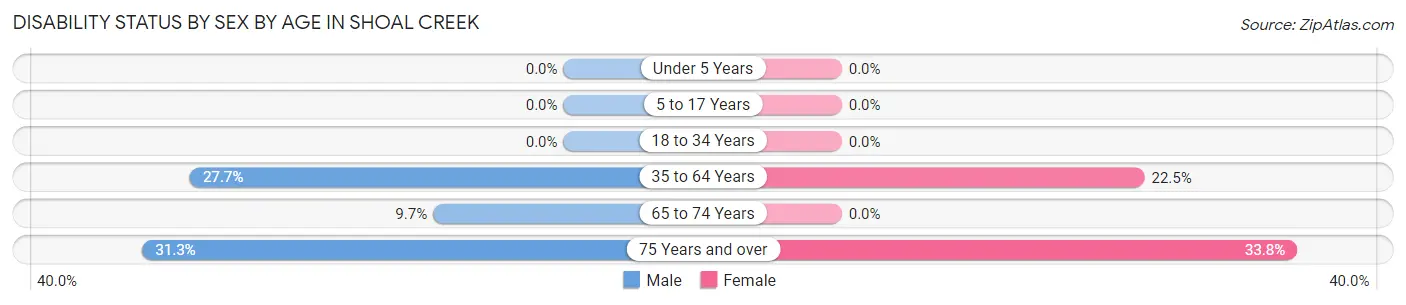
| Age Bracket | Male | Female |
| Under 5 Years | 0 (0.0%) | 0 (0.0%) |
| 5 to 17 Years | 0 (0.0%) | 0 (0.0%) |
| 18 to 34 Years | 0 (0.0%) | 0 (0.0%) |
| 35 to 64 Years | 79 (27.7%) | 67 (22.5%) |
| 65 to 74 Years | 9 (9.7%) | 0 (0.0%) |
| 75 Years and over | 10 (31.2%) | 24 (33.8%) |
Disability Class by Sex by Age in Shoal Creek
Disability Class: Hearing Difficulty
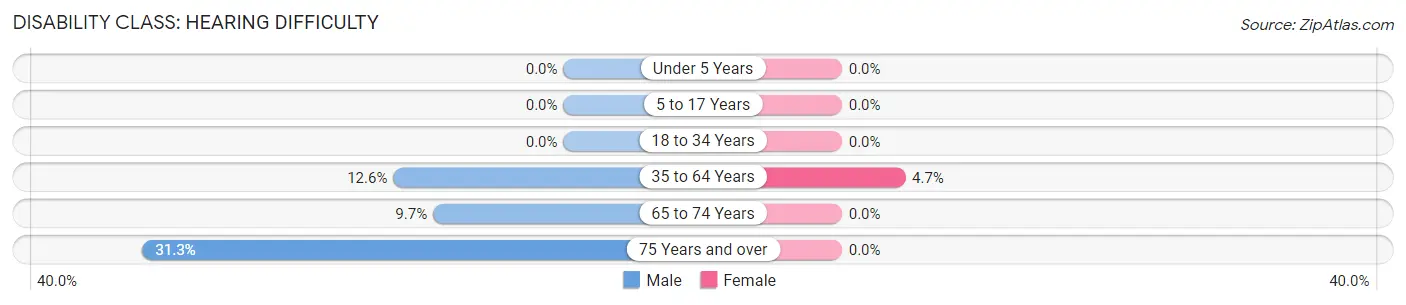
| Age Bracket | Male | Female |
| Under 5 Years | 0 (0.0%) | 0 (0.0%) |
| 5 to 17 Years | 0 (0.0%) | 0 (0.0%) |
| 18 to 34 Years | 0 (0.0%) | 0 (0.0%) |
| 35 to 64 Years | 36 (12.6%) | 14 (4.7%) |
| 65 to 74 Years | 9 (9.7%) | 0 (0.0%) |
| 75 Years and over | 10 (31.2%) | 0 (0.0%) |
Disability Class: Vision Difficulty
| Age Bracket | Male | Female |
| Under 5 Years | 0 (0.0%) | 0 (0.0%) |
| 5 to 17 Years | 0 (0.0%) | 0 (0.0%) |
| 18 to 34 Years | 0 (0.0%) | 0 (0.0%) |
| 35 to 64 Years | 0 (0.0%) | 0 (0.0%) |
| 65 to 74 Years | 0 (0.0%) | 0 (0.0%) |
| 75 Years and over | 0 (0.0%) | 0 (0.0%) |
Disability Class: Cognitive Difficulty
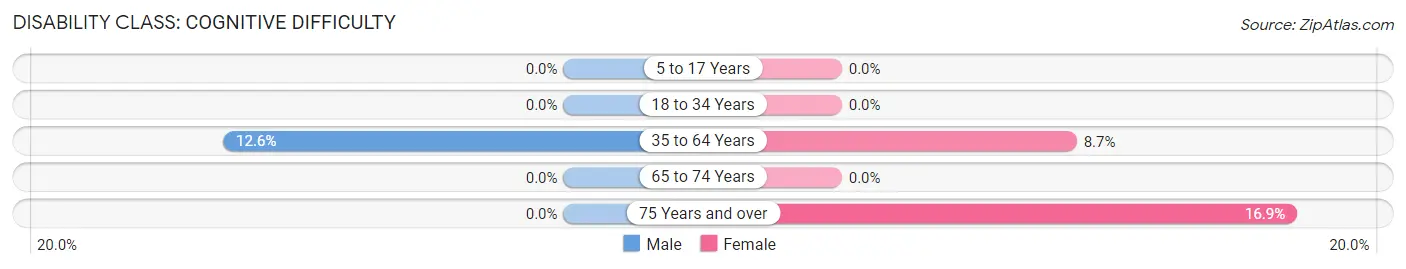
| Age Bracket | Male | Female |
| 5 to 17 Years | 0 (0.0%) | 0 (0.0%) |
| 18 to 34 Years | 0 (0.0%) | 0 (0.0%) |
| 35 to 64 Years | 36 (12.6%) | 26 (8.7%) |
| 65 to 74 Years | 0 (0.0%) | 0 (0.0%) |
| 75 Years and over | 0 (0.0%) | 12 (16.9%) |
Disability Class: Ambulatory Difficulty
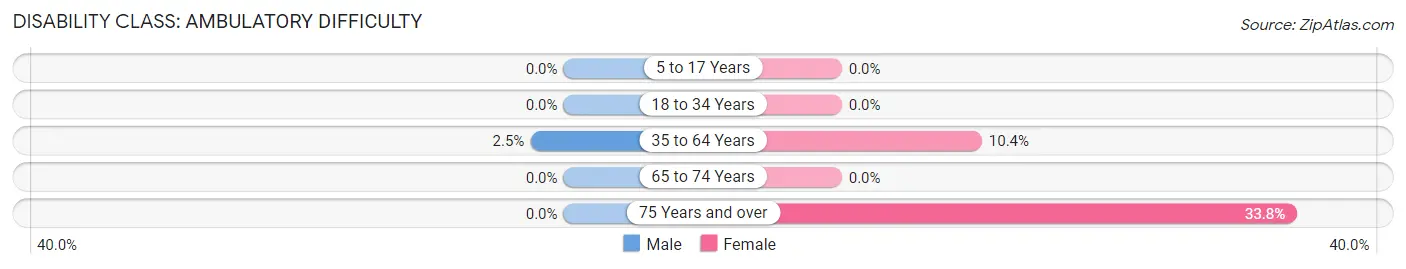
| Age Bracket | Male | Female |
| 5 to 17 Years | 0 (0.0%) | 0 (0.0%) |
| 18 to 34 Years | 0 (0.0%) | 0 (0.0%) |
| 35 to 64 Years | 7 (2.5%) | 31 (10.4%) |
| 65 to 74 Years | 0 (0.0%) | 0 (0.0%) |
| 75 Years and over | 0 (0.0%) | 24 (33.8%) |
Disability Class: Self-Care Difficulty
| Age Bracket | Male | Female |
| 5 to 17 Years | 0 (0.0%) | 0 (0.0%) |
| 18 to 34 Years | 0 (0.0%) | 0 (0.0%) |
| 35 to 64 Years | 0 (0.0%) | 0 (0.0%) |
| 65 to 74 Years | 0 (0.0%) | 0 (0.0%) |
| 75 Years and over | 0 (0.0%) | 0 (0.0%) |
Technology Access in Shoal Creek
Computing Device Access in Shoal Creek
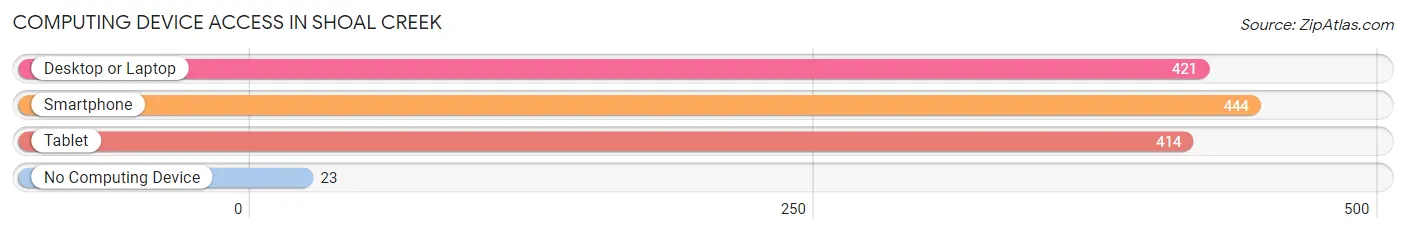
| Device Type | # Households | % Households |
| Desktop or Laptop | 421 | 88.1% |
| Smartphone | 444 | 92.9% |
| Tablet | 414 | 86.6% |
| No Computing Device | 23 | 4.8% |
| Total | 478 | 100.0% |
Internet Access in Shoal Creek
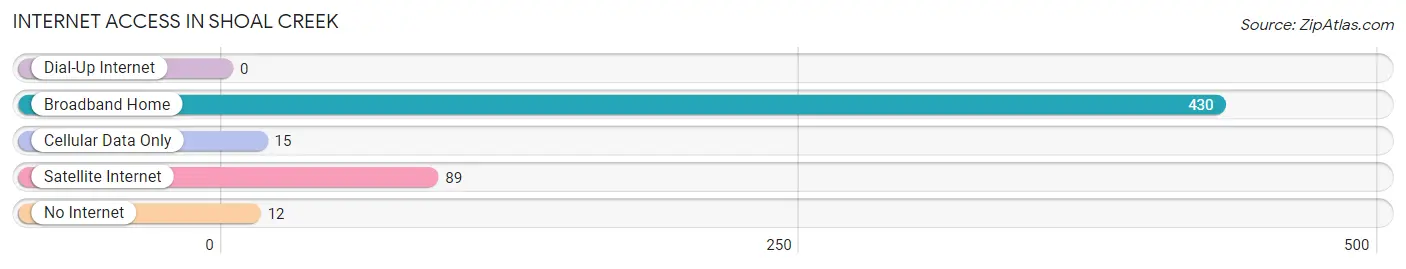
| Internet Type | # Households | % Households |
| Dial-Up Internet | 0 | 0.0% |
| Broadband Home | 430 | 90.0% |
| Cellular Data Only | 15 | 3.1% |
| Satellite Internet | 89 | 18.6% |
| No Internet | 12 | 2.5% |
| Total | 478 | 100.0% |
Shoal Creek Summary
Shoal Creek is a small unincorporated community located in Jefferson County, Alabama. It is situated in the foothills of the Appalachian Mountains, approximately 20 miles northeast of Birmingham. The community is bordered by the cities of Trussville, Clay, and Pinson. The population of Shoal Creek is estimated to be around 1,000 people.
Geography
Shoal Creek is located in the foothills of the Appalachian Mountains, approximately 20 miles northeast of Birmingham. The community is bordered by the cities of Trussville, Clay, and Pinson. The terrain is mostly hilly and wooded, with some flat areas. The area is known for its scenic beauty, with numerous creeks and streams running through the area. The climate is mild, with temperatures ranging from the mid-50s in the winter to the mid-80s in the summer.
History
Shoal Creek was first settled in the early 1800s by settlers from the Appalachian Mountains. The area was originally known as “Shoal Creek Settlement” and was home to a variety of small farms and businesses. The community was officially incorporated in 1887 and was named after the nearby Shoal Creek. The area was primarily agricultural, with cotton, corn, and other crops being grown in the area.
In the early 1900s, the area began to experience a period of growth and development. The Birmingham and Atlantic Railroad was built through the area, connecting it to Birmingham and other nearby cities. This allowed for the development of new businesses and industries in the area. The population of Shoal Creek grew steadily throughout the 20th century, reaching its peak in the 1950s.
Economy
Shoal Creek’s economy is primarily based on agriculture and manufacturing. The area is home to several small farms, which produce a variety of crops, including cotton, corn, soybeans, and hay. There are also several small manufacturing businesses in the area, which produce a variety of products, including furniture, clothing, and automotive parts.
The area is also home to several small businesses, including restaurants, retail stores, and service providers. The community is also home to a number of churches, which provide a variety of services to the community.
Demographics
The population of Shoal Creek is estimated to be around 1,000 people. The majority of the population is white (90%), with the remaining 10% being African American. The median household income is $45,000, and the median home value is $150,000. The area is served by the Jefferson County School System, which provides education to the community’s children.
Conclusion
Shoal Creek is a small unincorporated community located in Jefferson County, Alabama. It is situated in the foothills of the Appalachian Mountains, approximately 20 miles northeast of Birmingham. The community is bordered by the cities of Trussville, Clay, and Pinson. The population of Shoal Creek is estimated to be around 1,000 people. The economy of the area is primarily based on agriculture and manufacturing, and the area is home to several small businesses. The majority of the population is white, with the remaining 10% being African American. The median household income is $45,000, and the median home value is $150,000. The area is served by the Jefferson County School System, which provides education to the community’s children.
Common Questions
What is Per Capita Income in Shoal Creek?
Per Capita income in Shoal Creek is $81,916.
What is the Median Family Income in Shoal Creek?
Median Family Income in Shoal Creek is $159,722.
What is the Median Household income in Shoal Creek?
Median Household Income in Shoal Creek is $130,375.
What is Inequality or Gini Index in Shoal Creek?
Inequality or Gini Index in Shoal Creek is 0.47.
What is the Total Population of Shoal Creek?
Total Population of Shoal Creek is 1,171.
What is the Total Male Population of Shoal Creek?
Total Male Population of Shoal Creek is 549.
What is the Total Female Population of Shoal Creek?
Total Female Population of Shoal Creek is 622.
What is the Ratio of Males per 100 Females in Shoal Creek?
There are 88.26 Males per 100 Females in Shoal Creek.
What is the Ratio of Females per 100 Males in Shoal Creek?
There are 113.30 Females per 100 Males in Shoal Creek.
What is the Median Population Age in Shoal Creek?
Median Population Age in Shoal Creek is 52.4 Years.
What is the Average Family Size in Shoal Creek
Average Family Size in Shoal Creek is 2.9 People.
What is the Average Household Size in Shoal Creek
Average Household Size in Shoal Creek is 2.5 People.
How Large is the Labor Force in Shoal Creek?
There are 508 People in the Labor Forcein in Shoal Creek.
What is the Percentage of People in the Labor Force in Shoal Creek?
50.3% of People are in the Labor Force in Shoal Creek.
What is the Unemployment Rate in Shoal Creek?
Unemployment Rate in Shoal Creek is 3.1%.