Irondale, AL Map & Demographics
Irondale Map
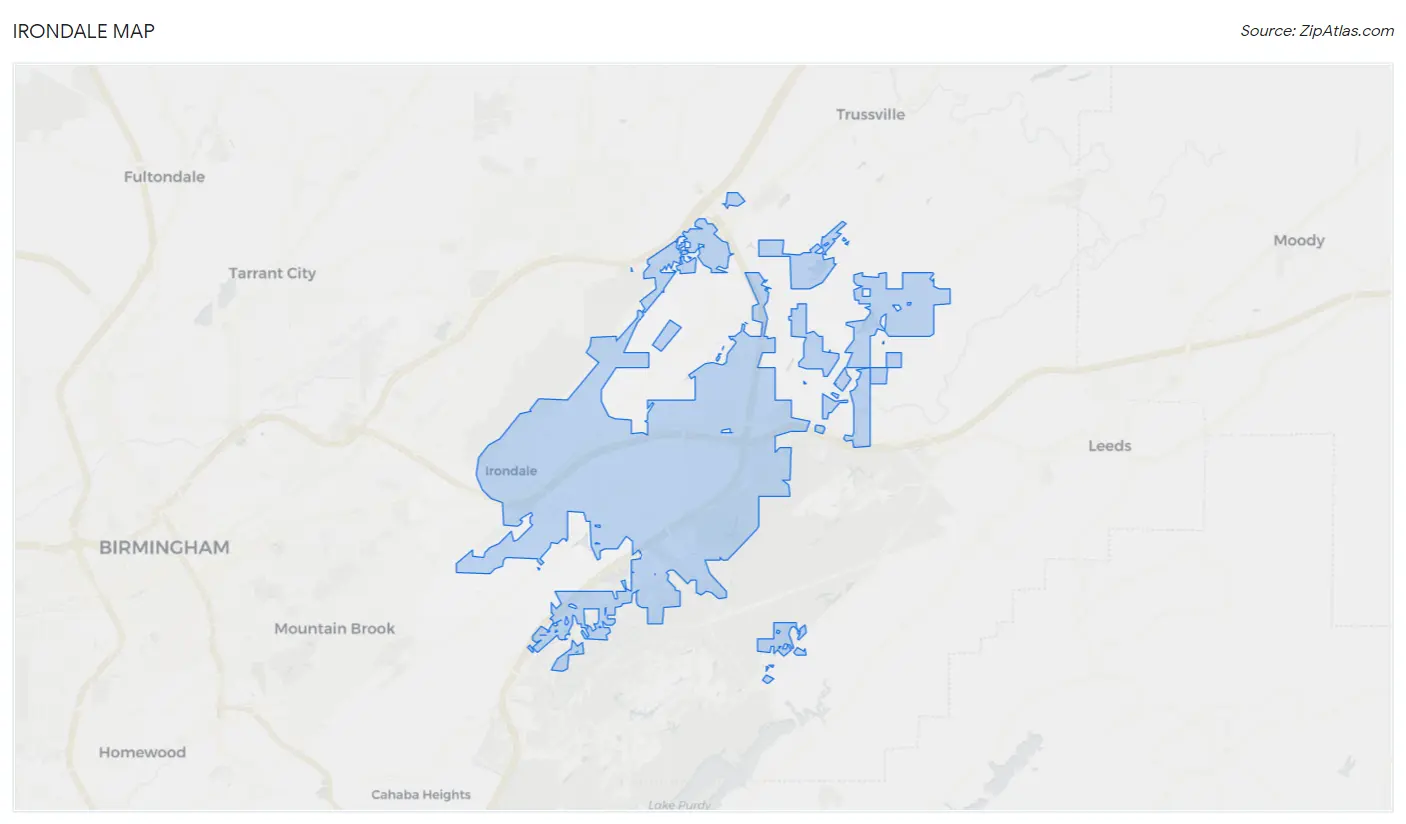
Irondale Overview
$43,501
PER CAPITA INCOME
$87,500
AVG FAMILY INCOME
$68,869
AVG HOUSEHOLD INCOME
29.9%
WAGE / INCOME GAP [ % ]
70.1¢/ $1
WAGE / INCOME GAP [ $ ]
0.46
INEQUALITY / GINI INDEX
13,455
TOTAL POPULATION
7,189
MALE POPULATION
6,266
FEMALE POPULATION
114.73
MALES / 100 FEMALES
87.16
FEMALES / 100 MALES
43.1
MEDIAN AGE
3.0
AVG FAMILY SIZE
2.1
AVG HOUSEHOLD SIZE
7,508
LABOR FORCE [ PEOPLE ]
64.6%
PERCENT IN LABOR FORCE
9.3%
UNEMPLOYMENT RATE
Irondale Area Codes
Income in Irondale
Income Overview in Irondale
Per Capita Income in Irondale is $43,501, while median incomes of families and households are $87,500 and $68,869 respectively.
| Characteristic | Number | Measure |
| Per Capita Income | 13,455 | $43,501 |
| Median Family Income | 3,248 | $87,500 |
| Mean Family Income | 3,248 | $100,059 |
| Median Household Income | 6,262 | $68,869 |
| Mean Household Income | 6,262 | $88,880 |
| Income Deficit | 3,248 | $0 |
| Wage / Income Gap (%) | 13,455 | 29.94% |
| Wage / Income Gap ($) | 13,455 | 70.06¢ per $1 |
| Gini / Inequality Index | 13,455 | 0.46 |
Earnings by Sex in Irondale
Average Earnings in Irondale are $49,314, $54,816 for men and $38,404 for women, a difference of 29.9%.
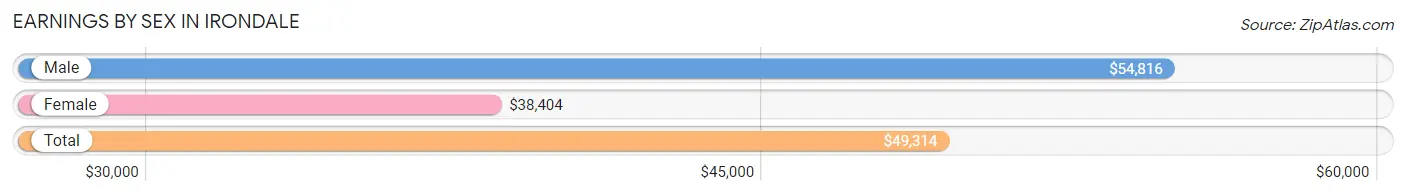
| Sex | Number | Average Earnings |
| Male | 4,453 (56.1%) | $54,816 |
| Female | 3,484 (43.9%) | $38,404 |
| Total | 7,937 (100.0%) | $49,314 |
Earnings by Sex by Income Bracket in Irondale
The most common earnings brackets in Irondale are $100,000+ for men (695 | 15.6%) and $55,000 to $64,999 for women (394 | 11.3%).
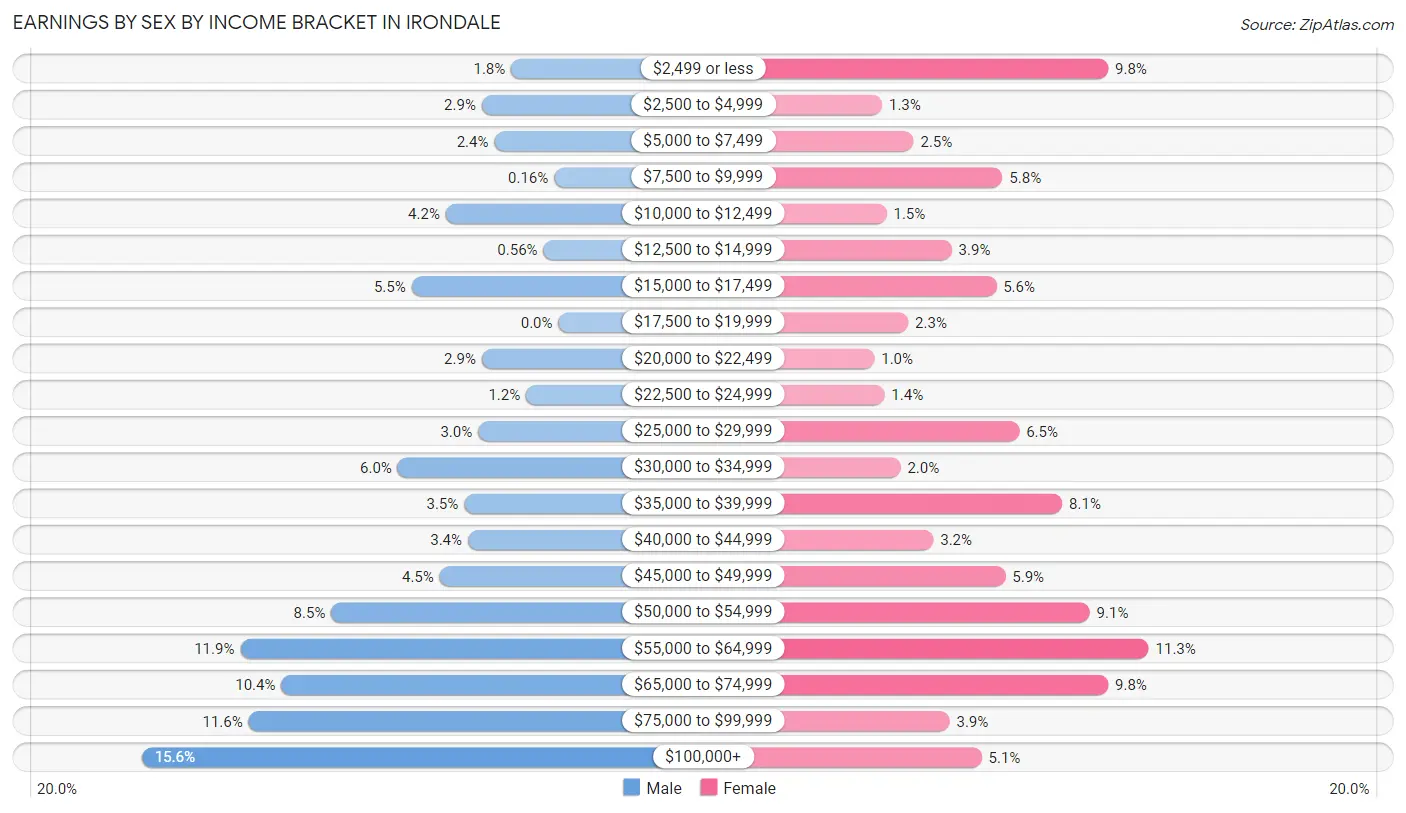
| Income | Male | Female |
| $2,499 or less | 79 (1.8%) | 341 (9.8%) |
| $2,500 to $4,999 | 128 (2.9%) | 46 (1.3%) |
| $5,000 to $7,499 | 107 (2.4%) | 87 (2.5%) |
| $7,500 to $9,999 | 7 (0.2%) | 203 (5.8%) |
| $10,000 to $12,499 | 188 (4.2%) | 52 (1.5%) |
| $12,500 to $14,999 | 25 (0.6%) | 137 (3.9%) |
| $15,000 to $17,499 | 245 (5.5%) | 195 (5.6%) |
| $17,500 to $19,999 | 0 (0.0%) | 80 (2.3%) |
| $20,000 to $22,499 | 128 (2.9%) | 36 (1.0%) |
| $22,500 to $24,999 | 54 (1.2%) | 49 (1.4%) |
| $25,000 to $29,999 | 134 (3.0%) | 225 (6.5%) |
| $30,000 to $34,999 | 268 (6.0%) | 70 (2.0%) |
| $35,000 to $39,999 | 157 (3.5%) | 281 (8.1%) |
| $40,000 to $44,999 | 151 (3.4%) | 113 (3.2%) |
| $45,000 to $49,999 | 198 (4.4%) | 207 (5.9%) |
| $50,000 to $54,999 | 379 (8.5%) | 317 (9.1%) |
| $55,000 to $64,999 | 531 (11.9%) | 394 (11.3%) |
| $65,000 to $74,999 | 462 (10.4%) | 341 (9.8%) |
| $75,000 to $99,999 | 517 (11.6%) | 134 (3.8%) |
| $100,000+ | 695 (15.6%) | 176 (5.1%) |
| Total | 4,453 (100.0%) | 3,484 (100.0%) |
Earnings by Sex by Educational Attainment in Irondale
Average earnings in Irondale are $58,182 for men and $42,132 for women, a difference of 27.6%. Men with an educational attainment of graduate degree enjoy the highest average annual earnings of $61,880, while those with less than high school education earn the least with $38,134. Women with an educational attainment of graduate degree earn the most with the average annual earnings of $57,720, while those with college or associate's degree education have the smallest earnings of $32,895.
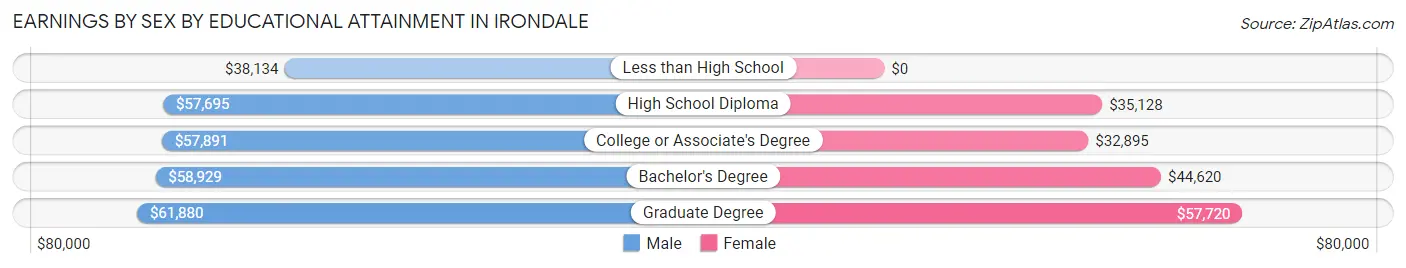
| Educational Attainment | Male Income | Female Income |
| Less than High School | $38,134 | $0 |
| High School Diploma | $57,695 | $35,128 |
| College or Associate's Degree | $57,891 | $32,895 |
| Bachelor's Degree | $58,929 | $44,620 |
| Graduate Degree | $61,880 | $57,720 |
| Total | $58,182 | $42,132 |
Family Income in Irondale
Family Income Brackets in Irondale
According to the Irondale family income data, there are 796 families falling into the $100,000 to $149,999 income range, which is the most common income bracket and makes up 24.5% of all families. Conversely, the $25,000 to $34,999 income bracket is the least frequent group with only 94 families (2.9%) belonging to this category.
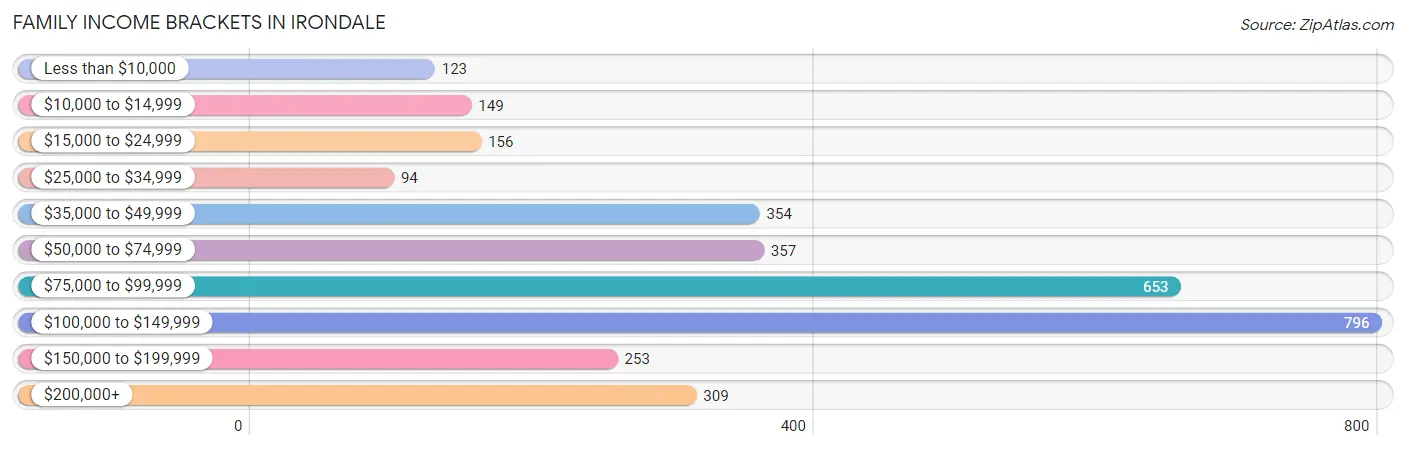
| Income Bracket | # Families | % Families |
| Less than $10,000 | 123 | 3.8% |
| $10,000 to $14,999 | 149 | 4.6% |
| $15,000 to $24,999 | 156 | 4.8% |
| $25,000 to $34,999 | 94 | 2.9% |
| $35,000 to $49,999 | 354 | 10.9% |
| $50,000 to $74,999 | 357 | 11.0% |
| $75,000 to $99,999 | 653 | 20.1% |
| $100,000 to $149,999 | 796 | 24.5% |
| $150,000 to $199,999 | 253 | 7.8% |
| $200,000+ | 309 | 9.5% |
Family Income by Famaliy Size in Irondale
7+ person families (29 | 0.9%) account for the highest median family income in Irondale with $103,482 per family, while 2-person families (1,787 | 55.0%) have the highest median income of $43,567 per family member.
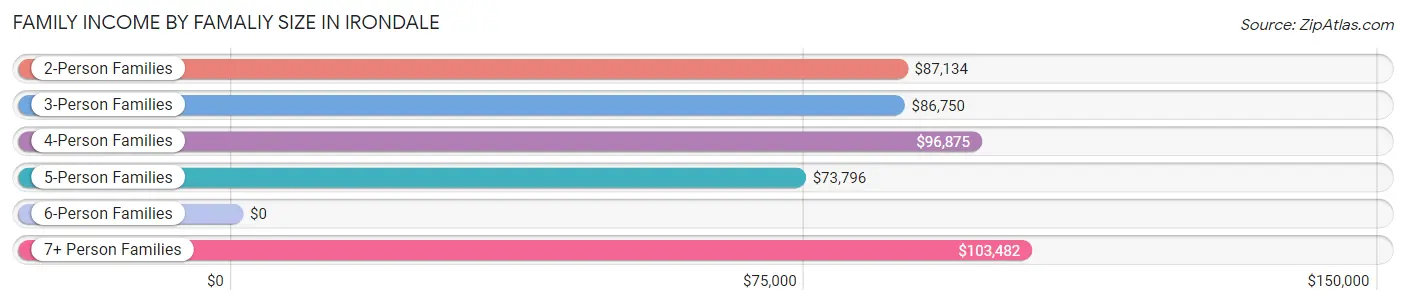
| Income Bracket | # Families | Median Income |
| 2-Person Families | 1,787 (55.0%) | $87,134 |
| 3-Person Families | 708 (21.8%) | $86,750 |
| 4-Person Families | 566 (17.4%) | $96,875 |
| 5-Person Families | 158 (4.9%) | $73,796 |
| 6-Person Families | 0 (0.0%) | $0 |
| 7+ Person Families | 29 (0.9%) | $103,482 |
| Total | 3,248 (100.0%) | $87,500 |
Family Income by Number of Earners in Irondale
The median family income in Irondale is $87,500, with families comprising 3+ earners (380) having the highest median family income of $134,636, while families with no earners (598) have the lowest median family income of $41,268, accounting for 11.7% and 18.4% of families, respectively.
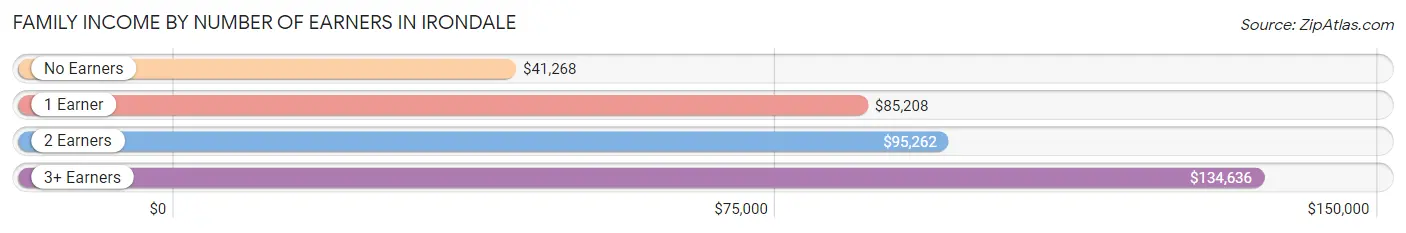
| Number of Earners | # Families | Median Income |
| No Earners | 598 (18.4%) | $41,268 |
| 1 Earner | 829 (25.5%) | $85,208 |
| 2 Earners | 1,441 (44.4%) | $95,262 |
| 3+ Earners | 380 (11.7%) | $134,636 |
| Total | 3,248 (100.0%) | $87,500 |
Household Income in Irondale
Household Income Brackets in Irondale
With 1,371 households falling in the category, the $50,000 to $74,999 income range is the most frequent in Irondale, accounting for 21.9% of all households. In contrast, only 213 households (3.4%) fall into the $10,000 to $14,999 income bracket, making it the least populous group.
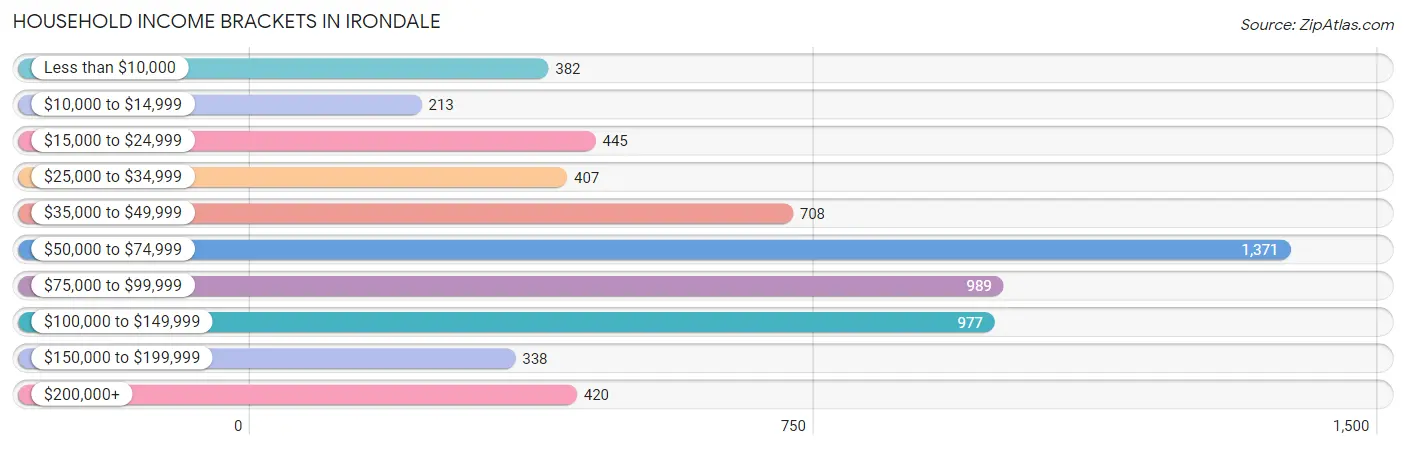
| Income Bracket | # Households | % Households |
| Less than $10,000 | 382 | 6.1% |
| $10,000 to $14,999 | 213 | 3.4% |
| $15,000 to $24,999 | 445 | 7.1% |
| $25,000 to $34,999 | 407 | 6.5% |
| $35,000 to $49,999 | 708 | 11.3% |
| $50,000 to $74,999 | 1,371 | 21.9% |
| $75,000 to $99,999 | 989 | 15.8% |
| $100,000 to $149,999 | 977 | 15.6% |
| $150,000 to $199,999 | 338 | 5.4% |
| $200,000+ | 420 | 6.7% |
Household Income by Householder Age in Irondale
The median household income in Irondale is $68,869, with the highest median household income of $78,138 found in the 25 to 44 years age bracket for the primary householder. A total of 1,677 households (26.8%) fall into this category. Meanwhile, the 15 to 24 years age bracket for the primary householder has the lowest median household income of $0, with 452 households (7.2%) in this group.
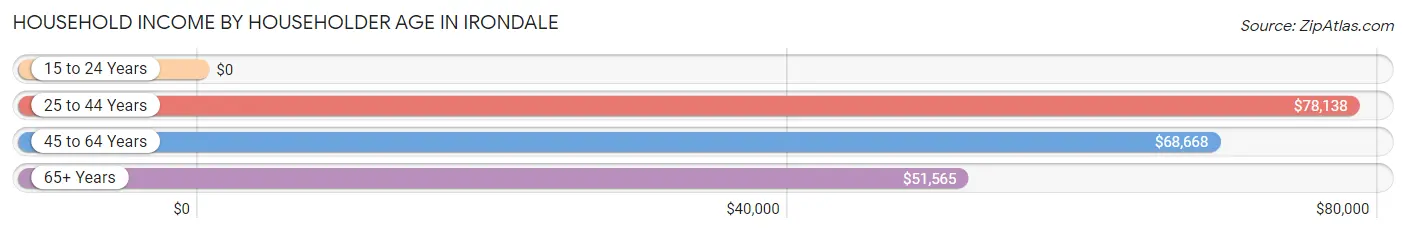
| Income Bracket | # Households | Median Income |
| 15 to 24 Years | 452 (7.2%) | $0 |
| 25 to 44 Years | 1,677 (26.8%) | $78,138 |
| 45 to 64 Years | 2,584 (41.3%) | $68,668 |
| 65+ Years | 1,549 (24.7%) | $51,565 |
| Total | 6,262 (100.0%) | $68,869 |
Poverty in Irondale
Income Below Poverty by Sex and Age in Irondale
With 14.4% poverty level for males and 16.0% for females among the residents of Irondale, 5 year old males and 5 year old females are the most vulnerable to poverty, with 176 males (100.0%) and 42 females (50.0%) in their respective age groups living below the poverty level.
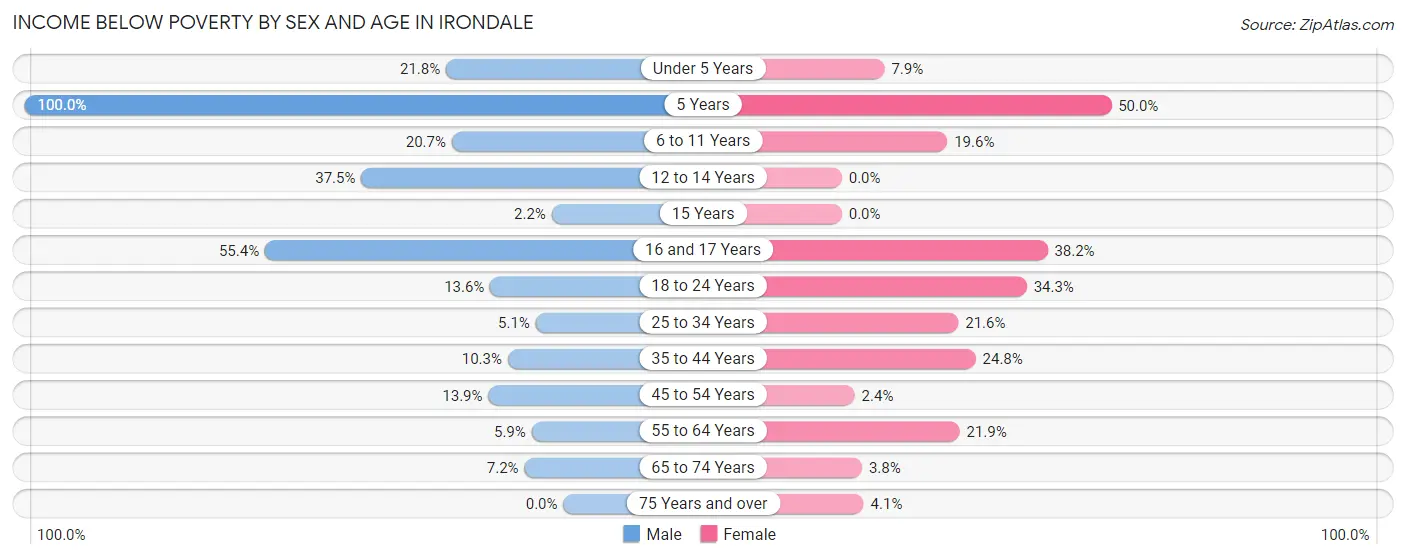
| Age Bracket | Male | Female |
| Under 5 Years | 132 (21.8%) | 16 (7.9%) |
| 5 Years | 176 (100.0%) | 42 (50.0%) |
| 6 to 11 Years | 35 (20.7%) | 54 (19.6%) |
| 12 to 14 Years | 48 (37.5%) | 0 (0.0%) |
| 15 Years | 2 (2.2%) | 0 (0.0%) |
| 16 and 17 Years | 103 (55.4%) | 50 (38.2%) |
| 18 to 24 Years | 118 (13.6%) | 150 (34.3%) |
| 25 to 34 Years | 51 (5.1%) | 199 (21.6%) |
| 35 to 44 Years | 92 (10.3%) | 156 (24.8%) |
| 45 to 54 Years | 164 (13.9%) | 20 (2.4%) |
| 55 to 64 Years | 56 (5.9%) | 255 (21.8%) |
| 65 to 74 Years | 45 (7.2%) | 37 (3.7%) |
| 75 Years and over | 0 (0.0%) | 19 (4.1%) |
| Total | 1,022 (14.4%) | 998 (16.0%) |
Income Above Poverty by Sex and Age in Irondale
According to the poverty statistics in Irondale, males aged 75 years and over and females aged 12 to 14 years are the age groups that are most secure financially, with 100.0% of males and 100.0% of females in these age groups living above the poverty line.
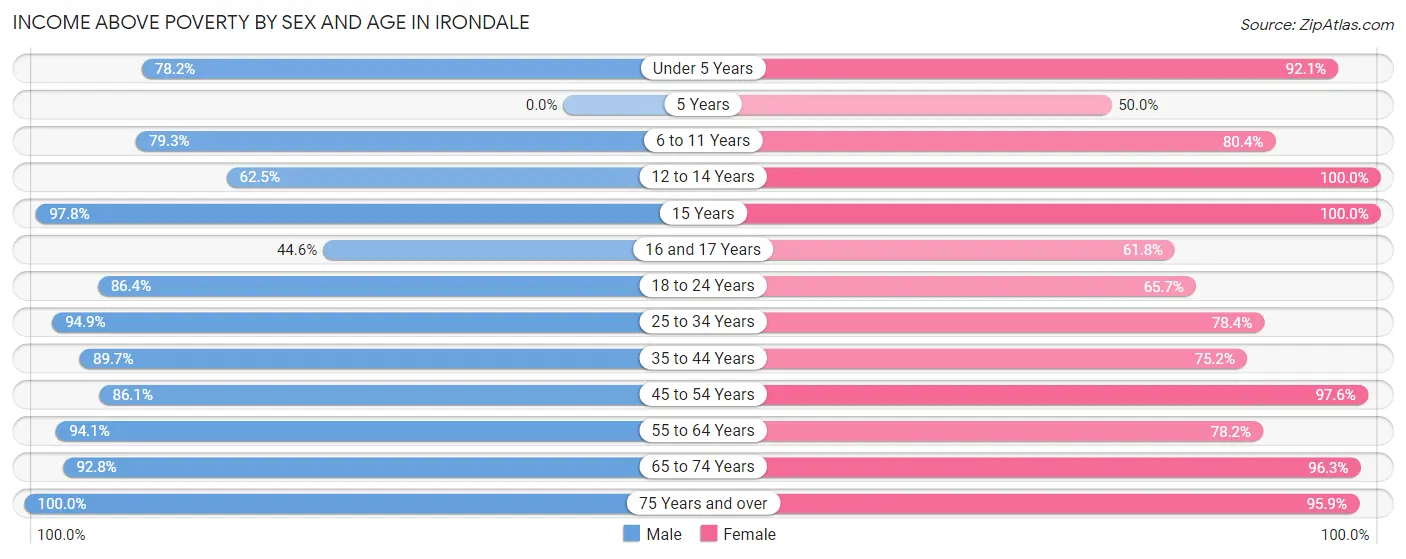
| Age Bracket | Male | Female |
| Under 5 Years | 474 (78.2%) | 186 (92.1%) |
| 5 Years | 0 (0.0%) | 42 (50.0%) |
| 6 to 11 Years | 134 (79.3%) | 222 (80.4%) |
| 12 to 14 Years | 80 (62.5%) | 60 (100.0%) |
| 15 Years | 90 (97.8%) | 25 (100.0%) |
| 16 and 17 Years | 83 (44.6%) | 81 (61.8%) |
| 18 to 24 Years | 751 (86.4%) | 287 (65.7%) |
| 25 to 34 Years | 942 (94.9%) | 721 (78.4%) |
| 35 to 44 Years | 800 (89.7%) | 472 (75.2%) |
| 45 to 54 Years | 1,014 (86.1%) | 817 (97.6%) |
| 55 to 64 Years | 895 (94.1%) | 912 (78.1%) |
| 65 to 74 Years | 578 (92.8%) | 949 (96.3%) |
| 75 Years and over | 256 (100.0%) | 449 (95.9%) |
| Total | 6,097 (85.6%) | 5,223 (84.0%) |
Income Below Poverty Among Married-Couple Families in Irondale
The poverty statistics for married-couple families in Irondale show that 7.4% or 160 of the total 2,174 families live below the poverty line. Families with 1 or 2 children have the highest poverty rate of 21.6%, comprising of 115 families. On the other hand, families with 3 or 4 children have the lowest poverty rate of 0.0%, which includes 0 families.
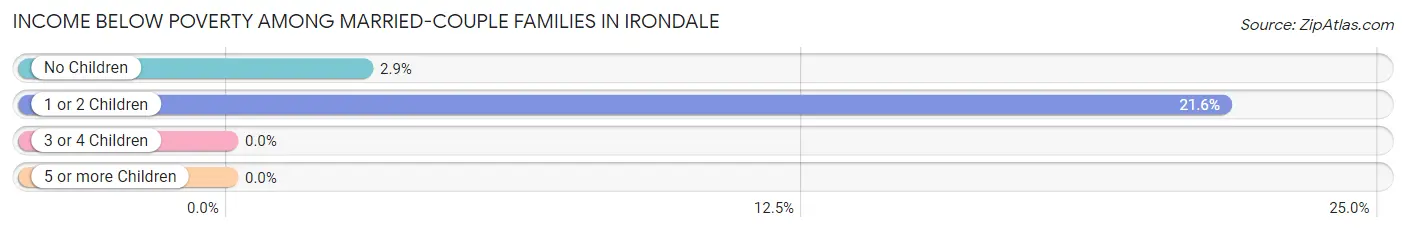
| Children | Above Poverty | Below Poverty |
| No Children | 1,484 (97.1%) | 45 (2.9%) |
| 1 or 2 Children | 417 (78.4%) | 115 (21.6%) |
| 3 or 4 Children | 93 (100.0%) | 0 (0.0%) |
| 5 or more Children | 20 (100.0%) | 0 (0.0%) |
| Total | 2,014 (92.6%) | 160 (7.4%) |
Income Below Poverty Among Single-Parent Households in Irondale
According to the poverty data in Irondale, 4.6% or 13 single-father households and 29.9% or 237 single-mother households are living below the poverty line. Among single-father households, those with 3 or 4 children have the highest poverty rate, with 1 households (100.0%) experiencing poverty. Likewise, among single-mother households, those with 3 or 4 children have the highest poverty rate, with 96 households (85.0%) falling below the poverty line.
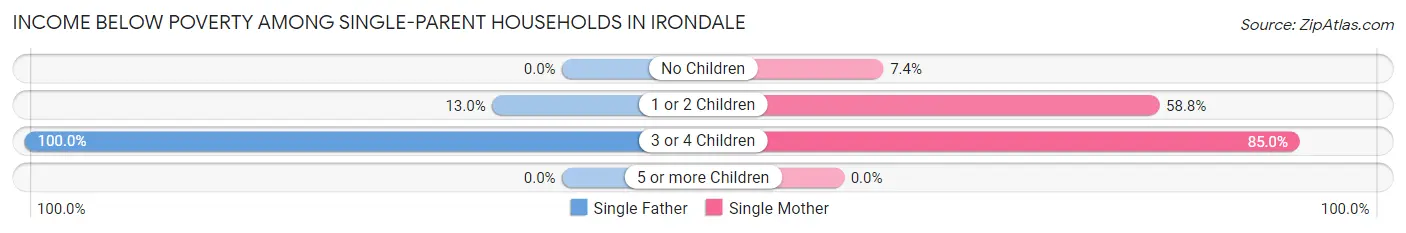
| Children | Single Father | Single Mother |
| No Children | 0 (0.0%) | 37 (7.4%) |
| 1 or 2 Children | 12 (13.0%) | 104 (58.8%) |
| 3 or 4 Children | 1 (100.0%) | 96 (85.0%) |
| 5 or more Children | 0 (0.0%) | 0 (0.0%) |
| Total | 13 (4.6%) | 237 (29.9%) |
Income Below Poverty Among Married-Couple vs Single-Parent Households in Irondale
The poverty data for Irondale shows that 160 of the married-couple family households (7.4%) and 250 of the single-parent households (23.3%) are living below the poverty level. Within the married-couple family households, those with 1 or 2 children have the highest poverty rate, with 115 households (21.6%) falling below the poverty line. Among the single-parent households, those with 3 or 4 children have the highest poverty rate, with 97 household (85.1%) living below poverty.
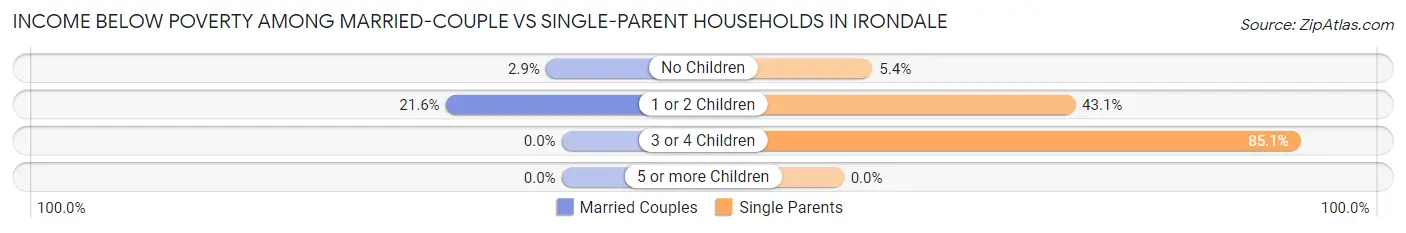
| Children | Married-Couple Families | Single-Parent Households |
| No Children | 45 (2.9%) | 37 (5.3%) |
| 1 or 2 Children | 115 (21.6%) | 116 (43.1%) |
| 3 or 4 Children | 0 (0.0%) | 97 (85.1%) |
| 5 or more Children | 0 (0.0%) | 0 (0.0%) |
| Total | 160 (7.4%) | 250 (23.3%) |
Race in Irondale
The most populous races in Irondale are White / Caucasian (8,457 | 62.8%), Black / African American (4,328 | 32.2%), and Hispanic or Latino (707 | 5.2%).
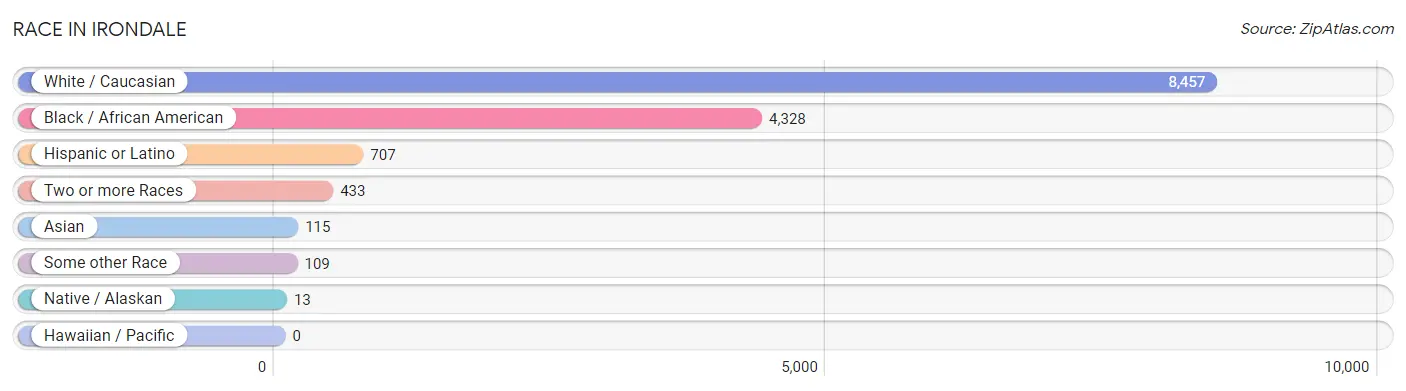
| Race | # Population | % Population |
| Asian | 115 | 0.9% |
| Black / African American | 4,328 | 32.2% |
| Hawaiian / Pacific | 0 | 0.0% |
| Hispanic or Latino | 707 | 5.2% |
| Native / Alaskan | 13 | 0.1% |
| White / Caucasian | 8,457 | 62.8% |
| Two or more Races | 433 | 3.2% |
| Some other Race | 109 | 0.8% |
| Total | 13,455 | 100.0% |
Ancestry in Irondale
The most populous ancestries reported in Irondale are American (1,317 | 9.8%), English (1,275 | 9.5%), Irish (1,064 | 7.9%), European (652 | 4.9%), and German (455 | 3.4%), together accounting for 35.4% of all Irondale residents.
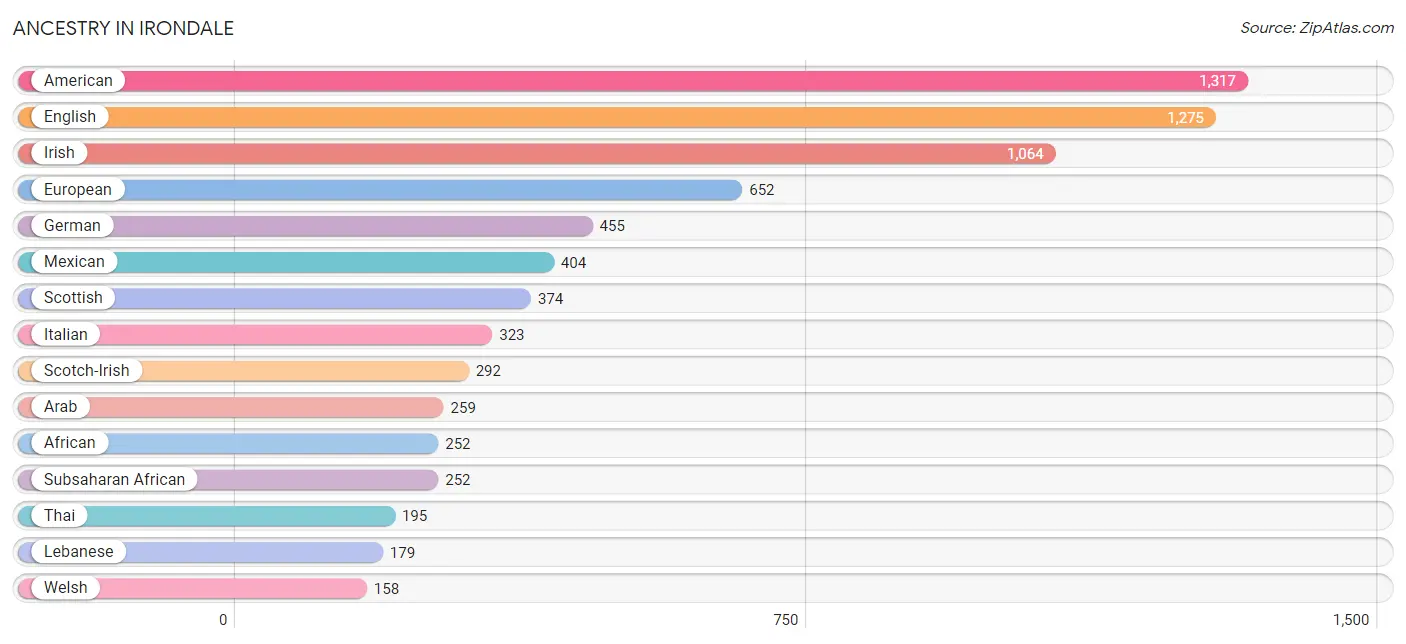
| Ancestry | # Population | % Population |
| African | 252 | 1.9% |
| American | 1,317 | 9.8% |
| Arab | 259 | 1.9% |
| Bhutanese | 110 | 0.8% |
| Bolivian | 37 | 0.3% |
| British | 82 | 0.6% |
| Canadian | 13 | 0.1% |
| Central American | 9 | 0.1% |
| Cuban | 17 | 0.1% |
| Dominican | 24 | 0.2% |
| Dutch | 65 | 0.5% |
| Ecuadorian | 109 | 0.8% |
| Egyptian | 38 | 0.3% |
| English | 1,275 | 9.5% |
| European | 652 | 4.9% |
| French | 127 | 0.9% |
| French Canadian | 23 | 0.2% |
| German | 455 | 3.4% |
| Guatemalan | 9 | 0.1% |
| Guyanese | 71 | 0.5% |
| Hungarian | 37 | 0.3% |
| Iranian | 6 | 0.0% |
| Irish | 1,064 | 7.9% |
| Italian | 323 | 2.4% |
| Jamaican | 31 | 0.2% |
| Korean | 3 | 0.0% |
| Latvian | 7 | 0.1% |
| Lebanese | 179 | 1.3% |
| Lithuanian | 58 | 0.4% |
| Macedonian | 28 | 0.2% |
| Mexican | 404 | 3.0% |
| Mexican American Indian | 6 | 0.0% |
| Northern European | 7 | 0.1% |
| Norwegian | 75 | 0.6% |
| Palestinian | 15 | 0.1% |
| Polish | 151 | 1.1% |
| Puerto Rican | 93 | 0.7% |
| Russian | 62 | 0.5% |
| Scandinavian | 46 | 0.3% |
| Scotch-Irish | 292 | 2.2% |
| Scottish | 374 | 2.8% |
| South American | 146 | 1.1% |
| Spanish | 14 | 0.1% |
| Subsaharan African | 252 | 1.9% |
| Swedish | 29 | 0.2% |
| Syrian | 27 | 0.2% |
| Thai | 195 | 1.5% |
| Turkish | 19 | 0.1% |
| Ukrainian | 13 | 0.1% |
| Vietnamese | 4 | 0.0% |
| Welsh | 158 | 1.2% | View All 51 Rows |
Immigrants in Irondale
The most numerous immigrant groups reported in Irondale came from Latin America (289 | 2.1%), Africa (211 | 1.6%), Central America (157 | 1.2%), Western Africa (145 | 1.1%), and Asia (130 | 1.0%), together accounting for 6.9% of all Irondale residents.
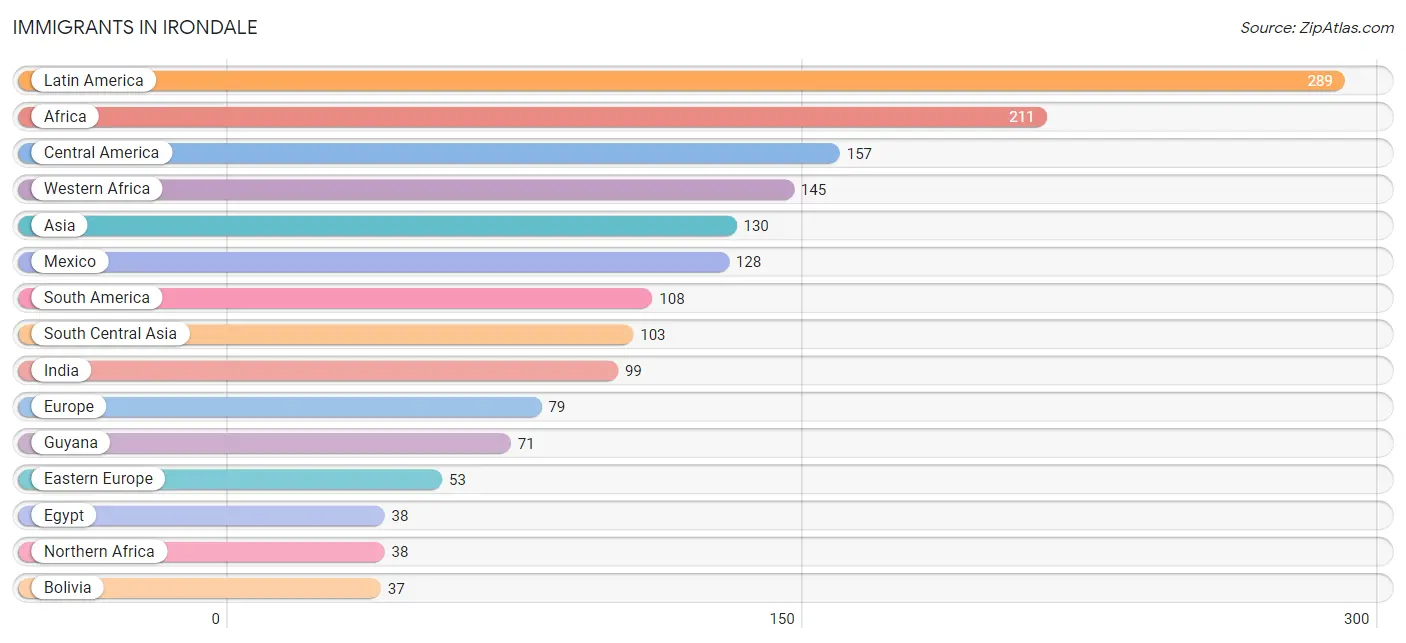
| Immigration Origin | # Population | % Population |
| Africa | 211 | 1.6% |
| Asia | 130 | 1.0% |
| Bangladesh | 4 | 0.0% |
| Bolivia | 37 | 0.3% |
| Caribbean | 24 | 0.2% |
| Central America | 157 | 1.2% |
| Dominican Republic | 24 | 0.2% |
| Eastern Africa | 28 | 0.2% |
| Eastern Europe | 53 | 0.4% |
| Egypt | 38 | 0.3% |
| Europe | 79 | 0.6% |
| Germany | 17 | 0.1% |
| Guatemala | 9 | 0.1% |
| Guyana | 71 | 0.5% |
| India | 99 | 0.7% |
| Kenya | 28 | 0.2% |
| Latin America | 289 | 2.1% |
| Lithuania | 37 | 0.3% |
| Mexico | 128 | 0.9% |
| Northern Africa | 38 | 0.3% |
| Northern Europe | 9 | 0.1% |
| Panama | 20 | 0.2% |
| Russia | 16 | 0.1% |
| Saudi Arabia | 12 | 0.1% |
| South America | 108 | 0.8% |
| South Central Asia | 103 | 0.8% |
| Western Africa | 145 | 1.1% |
| Western Asia | 12 | 0.1% |
| Western Europe | 17 | 0.1% | View All 29 Rows |
Sex and Age in Irondale
Sex and Age in Irondale
The most populous age groups in Irondale are 20 to 24 Years (742 | 10.3%) for men and 70 to 74 Years (606 | 9.7%) for women.
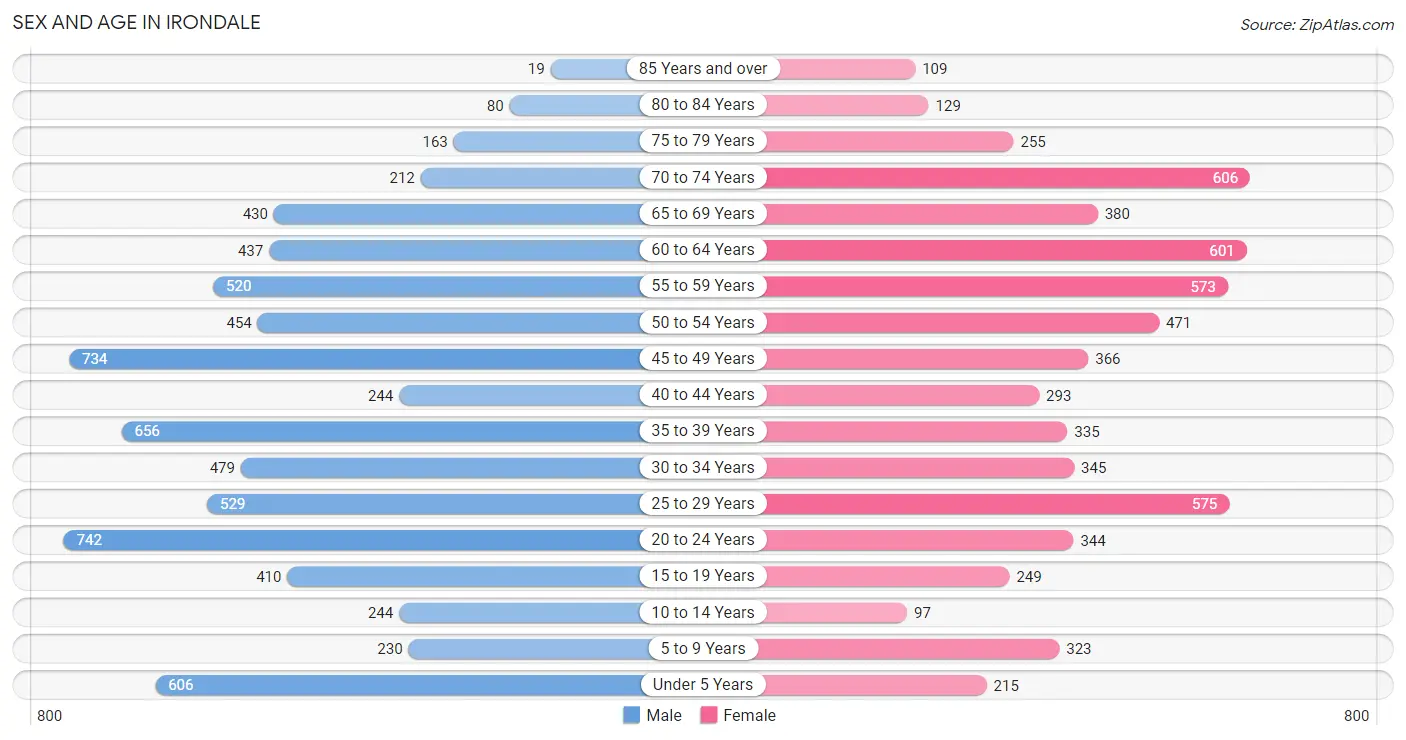
| Age Bracket | Male | Female |
| Under 5 Years | 606 (8.4%) | 215 (3.4%) |
| 5 to 9 Years | 230 (3.2%) | 323 (5.1%) |
| 10 to 14 Years | 244 (3.4%) | 97 (1.5%) |
| 15 to 19 Years | 410 (5.7%) | 249 (4.0%) |
| 20 to 24 Years | 742 (10.3%) | 344 (5.5%) |
| 25 to 29 Years | 529 (7.4%) | 575 (9.2%) |
| 30 to 34 Years | 479 (6.7%) | 345 (5.5%) |
| 35 to 39 Years | 656 (9.1%) | 335 (5.3%) |
| 40 to 44 Years | 244 (3.4%) | 293 (4.7%) |
| 45 to 49 Years | 734 (10.2%) | 366 (5.8%) |
| 50 to 54 Years | 454 (6.3%) | 471 (7.5%) |
| 55 to 59 Years | 520 (7.2%) | 573 (9.1%) |
| 60 to 64 Years | 437 (6.1%) | 601 (9.6%) |
| 65 to 69 Years | 430 (6.0%) | 380 (6.1%) |
| 70 to 74 Years | 212 (2.9%) | 606 (9.7%) |
| 75 to 79 Years | 163 (2.3%) | 255 (4.1%) |
| 80 to 84 Years | 80 (1.1%) | 129 (2.1%) |
| 85 Years and over | 19 (0.3%) | 109 (1.7%) |
| Total | 7,189 (100.0%) | 6,266 (100.0%) |
Families and Households in Irondale
Median Family Size in Irondale
The median family size in Irondale is 2.98 persons per family, with single female/mother families (792 | 24.4%) accounting for the largest median family size of 3.3 persons per family. On the other hand, single male/father families (282 | 8.7%) represent the smallest median family size with 2.41 persons per family.
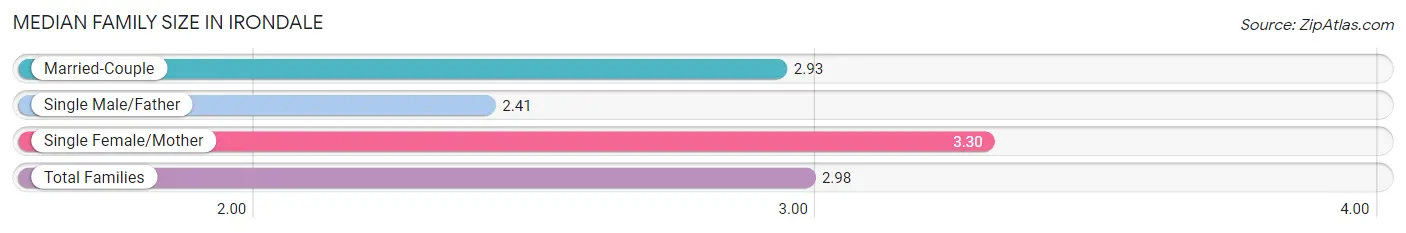
| Family Type | # Families | Family Size |
| Married-Couple | 2,174 (66.9%) | 2.93 |
| Single Male/Father | 282 (8.7%) | 2.41 |
| Single Female/Mother | 792 (24.4%) | 3.30 |
| Total Families | 3,248 (100.0%) | 2.98 |
Median Household Size in Irondale
The median household size in Irondale is 2.13 persons per household, with single female/mother households (792 | 12.7%) accounting for the largest median household size of 3.34 persons per household. non-family households (3,014 | 48.1%) represent the smallest median household size with 1.18 persons per household.
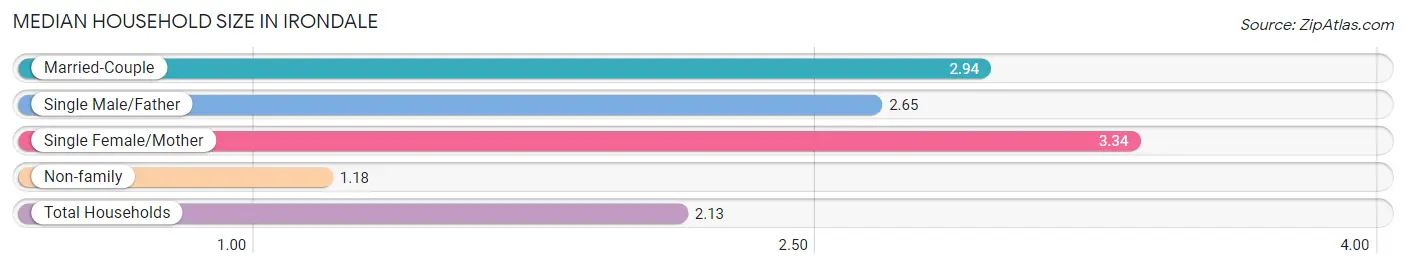
| Household Type | # Households | Household Size |
| Married-Couple | 2,174 (34.7%) | 2.94 |
| Single Male/Father | 282 (4.5%) | 2.65 |
| Single Female/Mother | 792 (12.7%) | 3.34 |
| Non-family | 3,014 (48.1%) | 1.18 |
| Total Households | 6,262 (100.0%) | 2.13 |
Household Size by Marriage Status in Irondale
Out of a total of 6,262 households in Irondale, 3,248 (51.9%) are family households, while 3,014 (48.1%) are nonfamily households. The most numerous type of family households are 2-person households, comprising 1,698, and the most common type of nonfamily households are 1-person households, comprising 2,575.
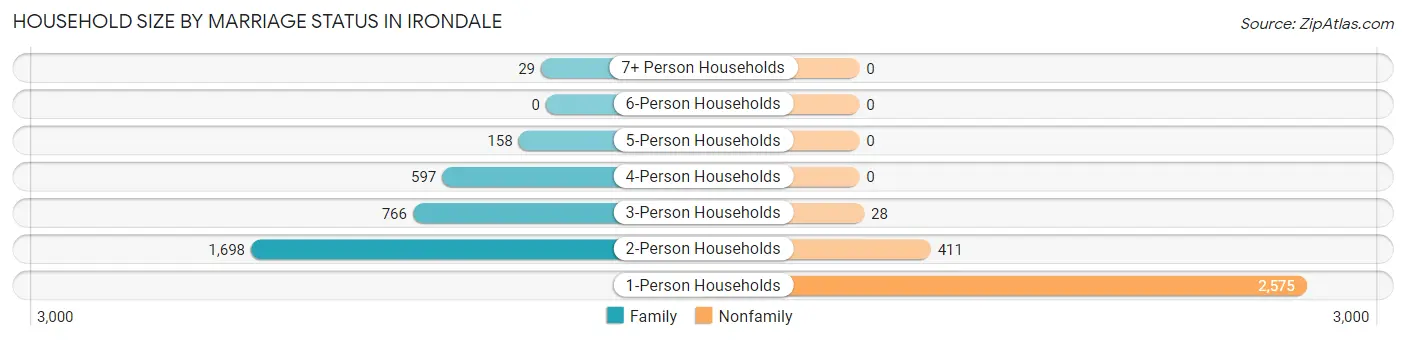
| Household Size | Family Households | Nonfamily Households |
| 1-Person Households | - | 2,575 (41.1%) |
| 2-Person Households | 1,698 (27.1%) | 411 (6.6%) |
| 3-Person Households | 766 (12.2%) | 28 (0.4%) |
| 4-Person Households | 597 (9.5%) | 0 (0.0%) |
| 5-Person Households | 158 (2.5%) | 0 (0.0%) |
| 6-Person Households | 0 (0.0%) | 0 (0.0%) |
| 7+ Person Households | 29 (0.5%) | 0 (0.0%) |
| Total | 3,248 (51.9%) | 3,014 (48.1%) |
Female Fertility in Irondale
Fertility by Age in Irondale
Average fertility rate in Irondale is 71.0 births per 1,000 women. Women in the age bracket of 20 to 34 years have the highest fertility rate with 135.0 births per 1,000 women. Women in the age bracket of 20 to 34 years acount for 92.4% of all women with births.
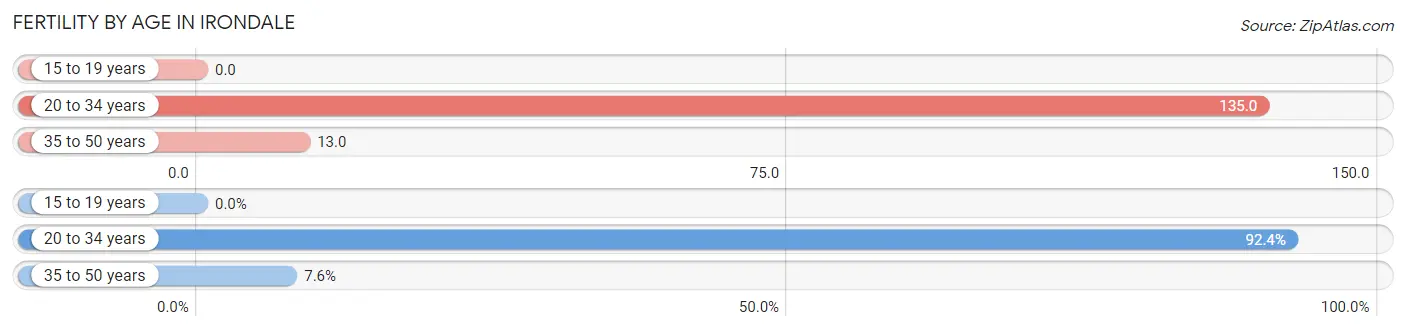
| Age Bracket | Women with Births | Births / 1,000 Women |
| 15 to 19 years | 0 (0.0%) | 0.0 |
| 20 to 34 years | 171 (92.4%) | 135.0 |
| 35 to 50 years | 14 (7.6%) | 13.0 |
| Total | 185 (100.0%) | 71.0 |
Fertility by Age by Marriage Status in Irondale
8.6% of women with births (185) in Irondale are married. The highest percentage of unmarried women with births falls into 20 to 34 years age bracket with 98.8% of them unmarried at the time of birth, while the lowest percentage of unmarried women with births belong to 35 to 50 years age bracket with 0.0% of them unmarried.
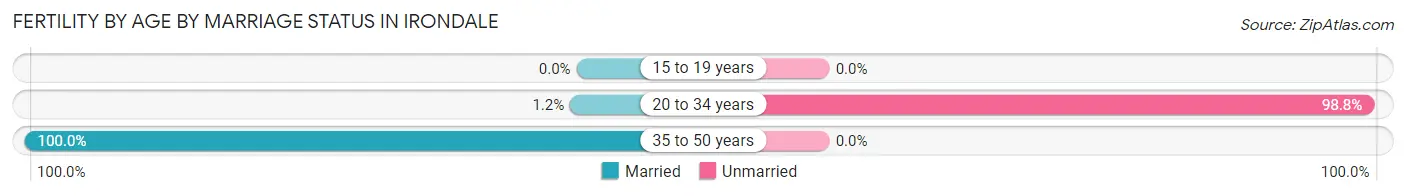
| Age Bracket | Married | Unmarried |
| 15 to 19 years | 0 (0.0%) | 0 (0.0%) |
| 20 to 34 years | 2 (1.2%) | 169 (98.8%) |
| 35 to 50 years | 14 (100.0%) | 0 (0.0%) |
| Total | 16 (8.6%) | 169 (91.3%) |
Fertility by Education in Irondale
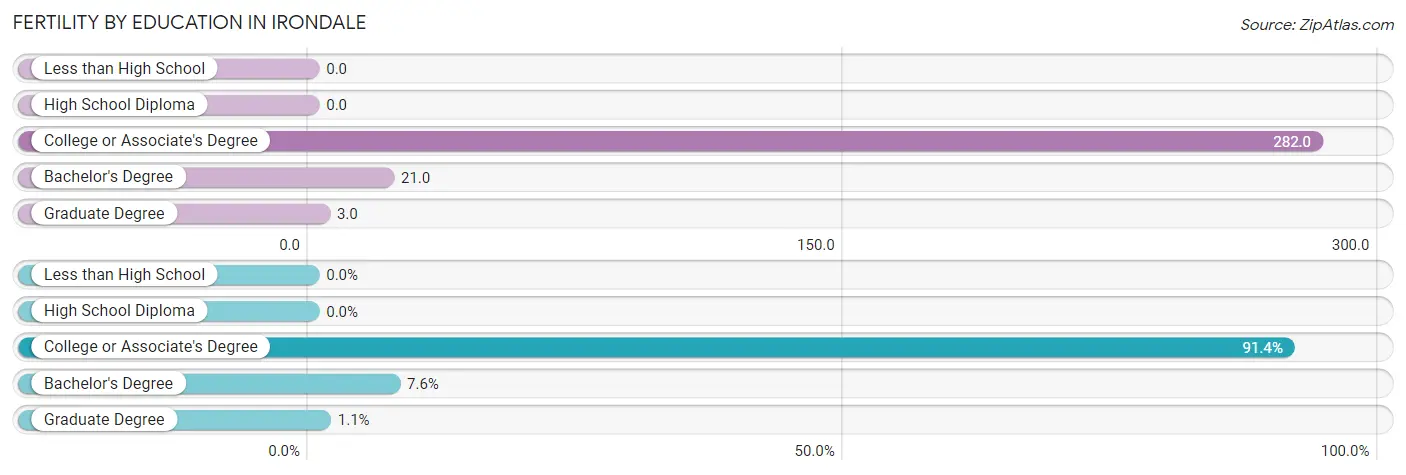
| Educational Attainment | Women with Births | Births / 1,000 Women |
| Less than High School | 0 (0.0%) | 0.0 |
| High School Diploma | 0 (0.0%) | 0.0 |
| College or Associate's Degree | 169 (91.3%) | 282.0 |
| Bachelor's Degree | 14 (7.6%) | 21.0 |
| Graduate Degree | 2 (1.1%) | 3.0 |
| Total | 185 (100.0%) | 71.0 |
Fertility by Education by Marriage Status in Irondale
91.3% of women with births in Irondale are unmarried. Women with the educational attainment of bachelor's degree are most likely to be married with 100.0% of them married at childbirth, while women with the educational attainment of college or associate's degree are least likely to be married with 100.0% of them unmarried at childbirth.
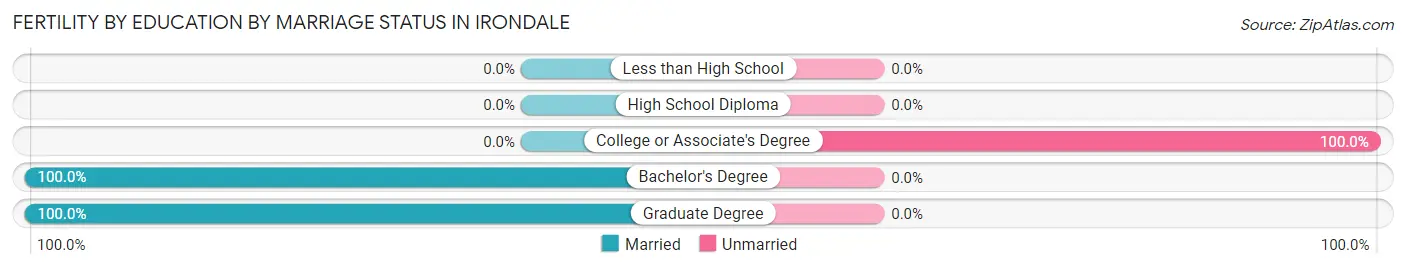
| Educational Attainment | Married | Unmarried |
| Less than High School | 0 (0.0%) | 0 (0.0%) |
| High School Diploma | 0 (0.0%) | 0 (0.0%) |
| College or Associate's Degree | 0 (0.0%) | 169 (100.0%) |
| Bachelor's Degree | 14 (100.0%) | 0 (0.0%) |
| Graduate Degree | 2 (100.0%) | 0 (0.0%) |
| Total | 16 (8.6%) | 169 (91.3%) |
Employment Characteristics in Irondale
Employment by Class of Employer in Irondale
Among the 6,656 employed individuals in Irondale, private company employees (3,972 | 59.7%), not-for-profit organizations (886 | 13.3%), and local government employees (604 | 9.1%) make up the most common classes of employment.
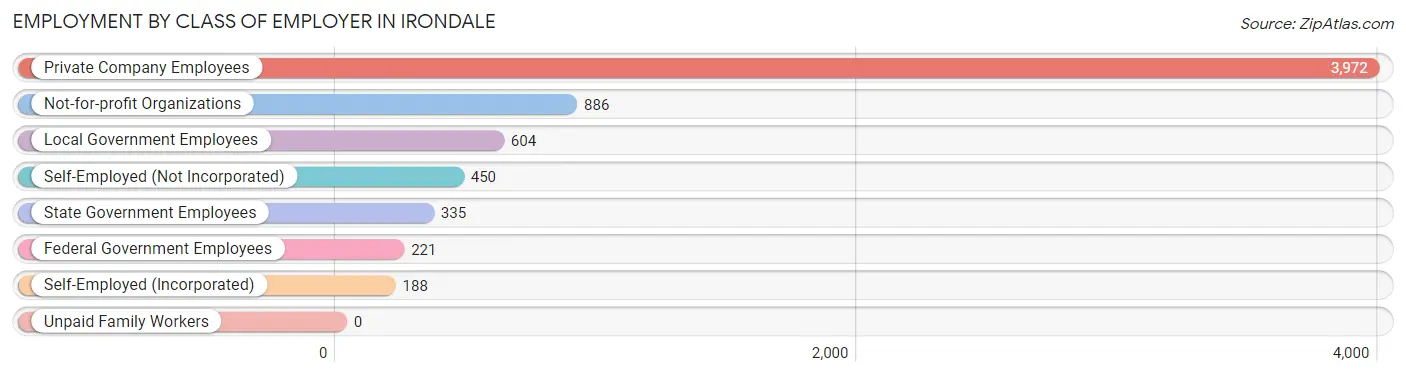
| Employer Class | # Employees | % Employees |
| Private Company Employees | 3,972 | 59.7% |
| Self-Employed (Incorporated) | 188 | 2.8% |
| Self-Employed (Not Incorporated) | 450 | 6.8% |
| Not-for-profit Organizations | 886 | 13.3% |
| Local Government Employees | 604 | 9.1% |
| State Government Employees | 335 | 5.0% |
| Federal Government Employees | 221 | 3.3% |
| Unpaid Family Workers | 0 | 0.0% |
| Total | 6,656 | 100.0% |
Employment Status by Age in Irondale
According to the labor force statistics for Irondale, out of the total population over 16 years of age (11,623), 64.6% or 7,508 individuals are in the labor force, with 9.3% or 698 of them unemployed. The age group with the highest labor force participation rate is 30 to 34 years, with 92.2% or 760 individuals in the labor force. Within the labor force, the 16 to 19 years age range has the highest percentage of unemployed individuals, with 52.3% or 122 of them being unemployed.
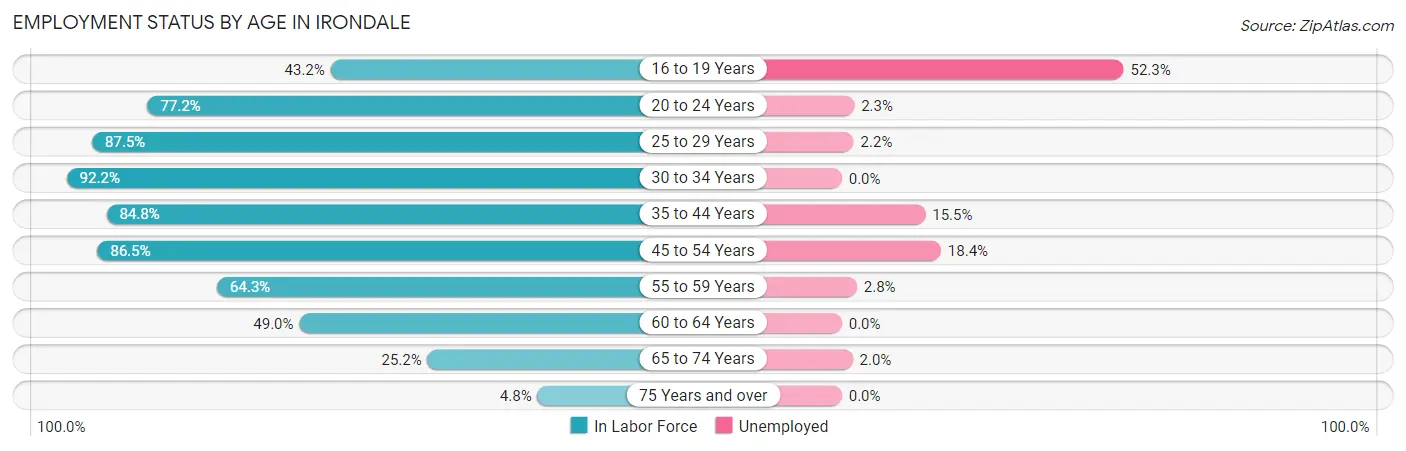
| Age Bracket | In Labor Force | Unemployed |
| 16 to 19 Years | 234 (43.2%) | 122 (52.3%) |
| 20 to 24 Years | 838 (77.2%) | 19 (2.3%) |
| 25 to 29 Years | 966 (87.5%) | 21 (2.2%) |
| 30 to 34 Years | 760 (92.2%) | 0 (0.0%) |
| 35 to 44 Years | 1,296 (84.8%) | 201 (15.5%) |
| 45 to 54 Years | 1,752 (86.5%) | 322 (18.4%) |
| 55 to 59 Years | 703 (64.3%) | 20 (2.8%) |
| 60 to 64 Years | 509 (49.0%) | 0 (0.0%) |
| 65 to 74 Years | 410 (25.2%) | 8 (2.0%) |
| 75 Years and over | 36 (4.8%) | 0 (0.0%) |
| Total | 7,508 (64.6%) | 698 (9.3%) |
Employment Status by Educational Attainment in Irondale
According to labor force statistics for Irondale, 78.6% of individuals (5,983) out of the total population between 25 and 64 years of age (7,612) are in the labor force, with 9.4% or 562 of them being unemployed. The group with the highest labor force participation rate are those with the educational attainment of bachelor's degree or higher, with 82.9% or 2,769 individuals in the labor force. Within the labor force, individuals with less than high school education have the highest percentage of unemployment, with 30.8% or 105 of them being unemployed.
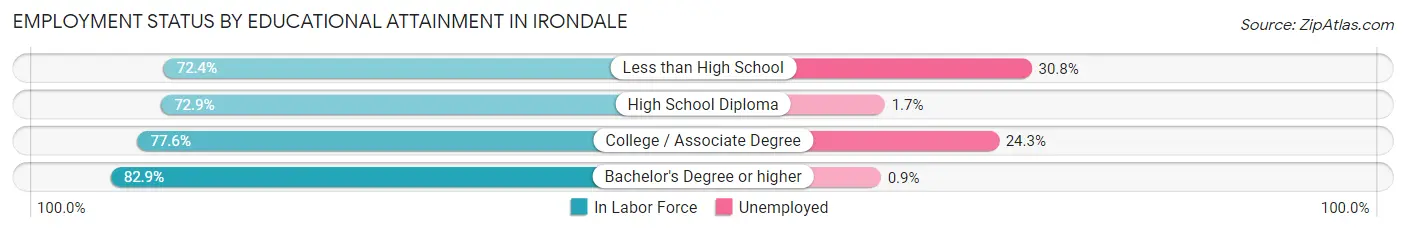
| Educational Attainment | In Labor Force | Unemployed |
| Less than High School | 341 (72.4%) | 145 (30.8%) |
| High School Diploma | 1,172 (72.9%) | 27 (1.7%) |
| College / Associate Degree | 1,703 (77.6%) | 533 (24.3%) |
| Bachelor's Degree or higher | 2,769 (82.9%) | 30 (0.9%) |
| Total | 5,983 (78.6%) | 716 (9.4%) |
Employment Occupations by Sex in Irondale
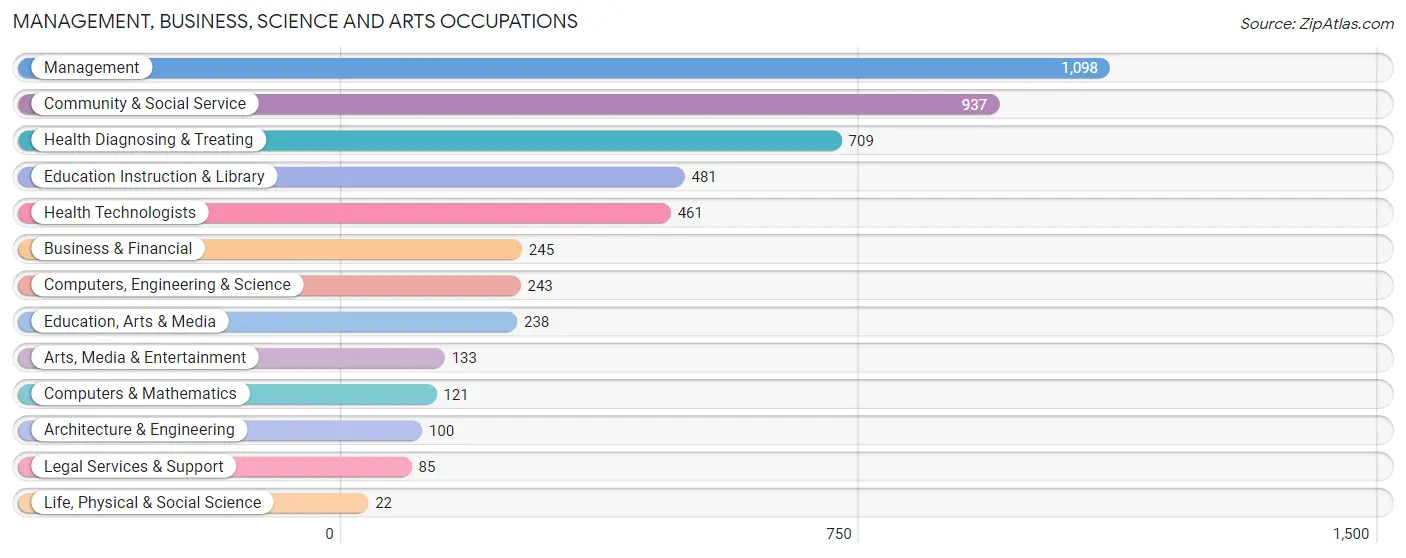
Management, Business, Science and Arts Occupations
The most common Management, Business, Science and Arts occupations in Irondale are Management (1,098 | 16.3%), Community & Social Service (937 | 13.9%), Health Diagnosing & Treating (709 | 10.5%), Education Instruction & Library (481 | 7.1%), and Health Technologists (461 | 6.9%).
Management, Business, Science and Arts Occupations by Sex
Within the Management, Business, Science and Arts occupations in Irondale, the most male-oriented occupations are Architecture & Engineering (100.0%), Computers, Engineering & Science (79.4%), and Computers & Mathematics (71.9%), while the most female-oriented occupations are Education, Arts & Media (74.8%), Health Diagnosing & Treating (74.1%), and Life, Physical & Social Science (72.7%).
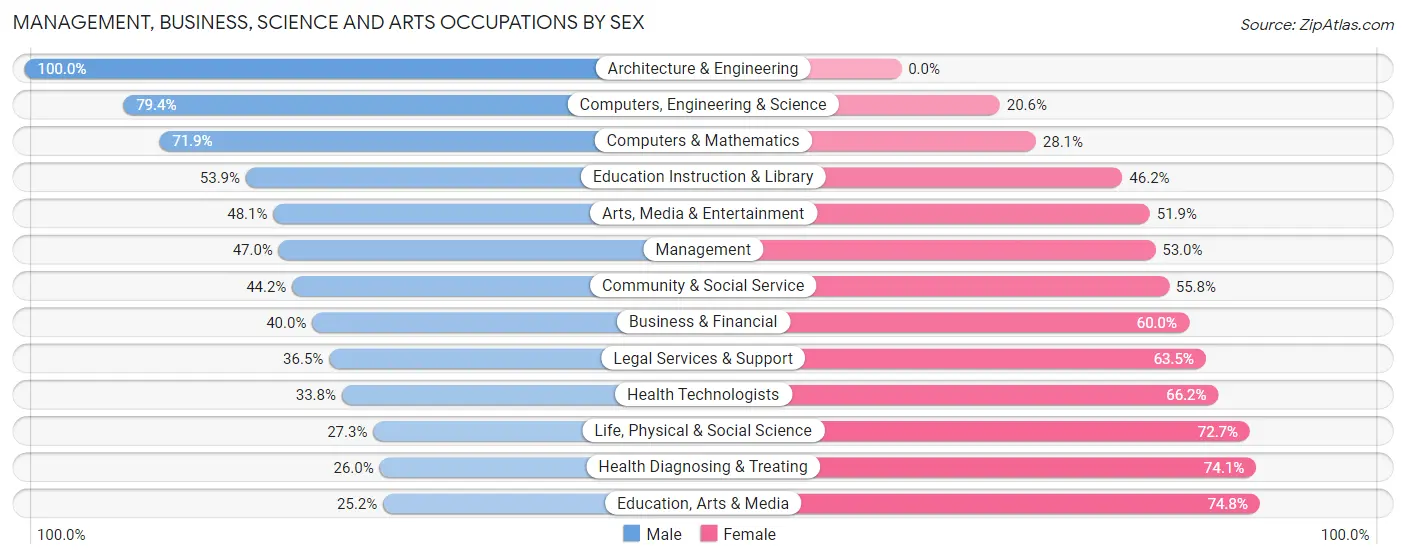
| Occupation | Male | Female |
| Management | 516 (47.0%) | 582 (53.0%) |
| Business & Financial | 98 (40.0%) | 147 (60.0%) |
| Computers, Engineering & Science | 193 (79.4%) | 50 (20.6%) |
| Computers & Mathematics | 87 (71.9%) | 34 (28.1%) |
| Architecture & Engineering | 100 (100.0%) | 0 (0.0%) |
| Life, Physical & Social Science | 6 (27.3%) | 16 (72.7%) |
| Community & Social Service | 414 (44.2%) | 523 (55.8%) |
| Education, Arts & Media | 60 (25.2%) | 178 (74.8%) |
| Legal Services & Support | 31 (36.5%) | 54 (63.5%) |
| Education Instruction & Library | 259 (53.8%) | 222 (46.2%) |
| Arts, Media & Entertainment | 64 (48.1%) | 69 (51.9%) |
| Health Diagnosing & Treating | 184 (26.0%) | 525 (74.1%) |
| Health Technologists | 156 (33.8%) | 305 (66.2%) |
| Total (Category) | 1,405 (43.5%) | 1,827 (56.5%) |
| Total (Overall) | 3,601 (53.5%) | 3,123 (46.5%) |
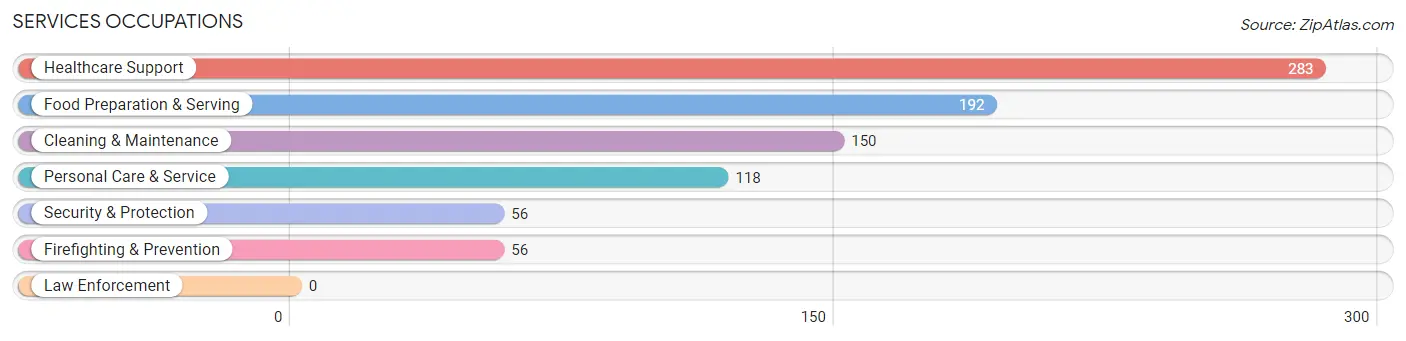
Services Occupations
The most common Services occupations in Irondale are Healthcare Support (283 | 4.2%), Food Preparation & Serving (192 | 2.9%), Cleaning & Maintenance (150 | 2.2%), Personal Care & Service (118 | 1.8%), and Security & Protection (56 | 0.8%).
Services Occupations by Sex
Within the Services occupations in Irondale, the most male-oriented occupations are Security & Protection (100.0%), Firefighting & Prevention (100.0%), and Cleaning & Maintenance (27.3%), while the most female-oriented occupations are Healthcare Support (89.4%), Food Preparation & Serving (85.9%), and Personal Care & Service (75.4%).
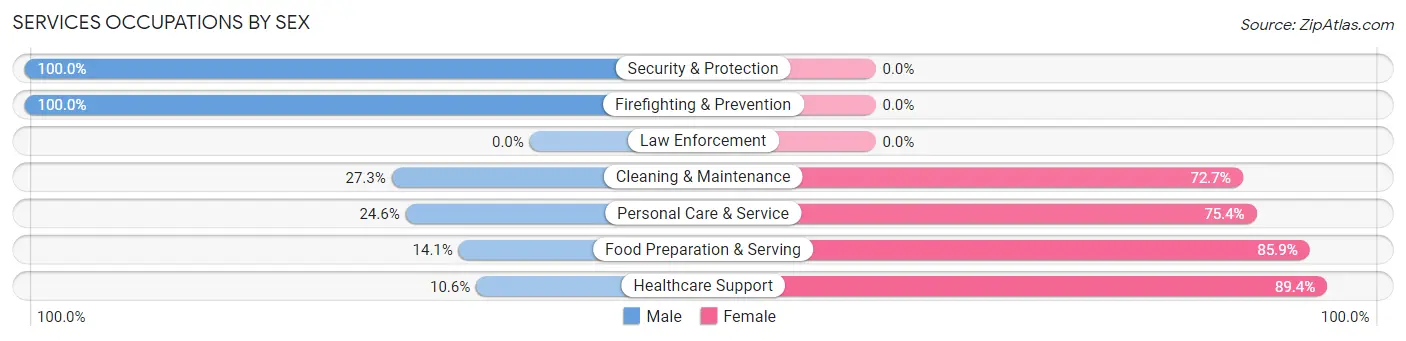
| Occupation | Male | Female |
| Healthcare Support | 30 (10.6%) | 253 (89.4%) |
| Security & Protection | 56 (100.0%) | 0 (0.0%) |
| Firefighting & Prevention | 56 (100.0%) | 0 (0.0%) |
| Law Enforcement | 0 (0.0%) | 0 (0.0%) |
| Food Preparation & Serving | 27 (14.1%) | 165 (85.9%) |
| Cleaning & Maintenance | 41 (27.3%) | 109 (72.7%) |
| Personal Care & Service | 29 (24.6%) | 89 (75.4%) |
| Total (Category) | 183 (22.9%) | 616 (77.1%) |
| Total (Overall) | 3,601 (53.5%) | 3,123 (46.5%) |
Sales and Office Occupations
The most common Sales and Office occupations in Irondale are Office & Administration (655 | 9.7%), and Sales & Related (530 | 7.9%).
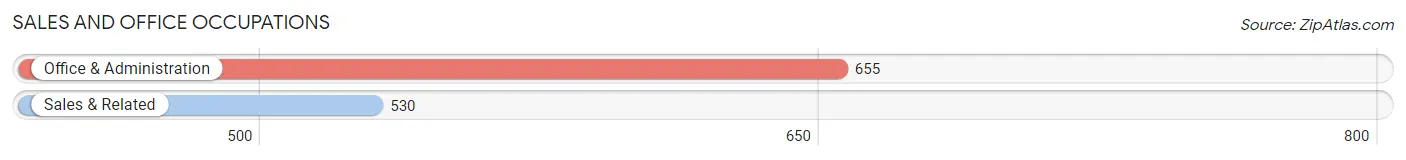
Sales and Office Occupations by Sex
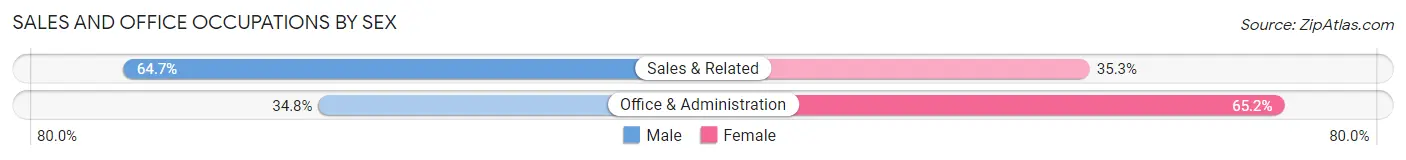
| Occupation | Male | Female |
| Sales & Related | 343 (64.7%) | 187 (35.3%) |
| Office & Administration | 228 (34.8%) | 427 (65.2%) |
| Total (Category) | 571 (48.2%) | 614 (51.8%) |
| Total (Overall) | 3,601 (53.5%) | 3,123 (46.5%) |
Natural Resources, Construction and Maintenance Occupations
The most common Natural Resources, Construction and Maintenance occupations in Irondale are Installation, Maintenance & Repair (381 | 5.7%), and Construction & Extraction (189 | 2.8%).
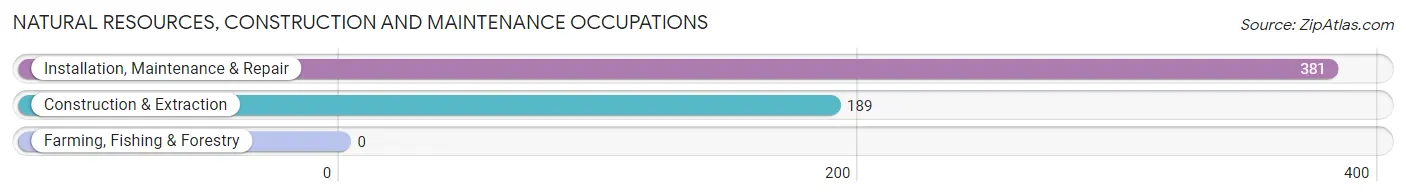
Natural Resources, Construction and Maintenance Occupations by Sex
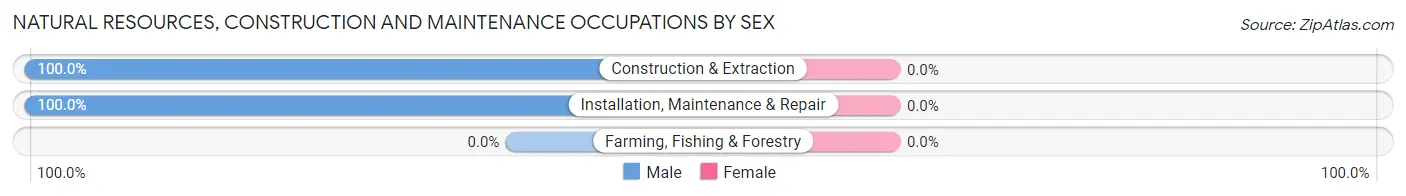
| Occupation | Male | Female |
| Farming, Fishing & Forestry | 0 (0.0%) | 0 (0.0%) |
| Construction & Extraction | 189 (100.0%) | 0 (0.0%) |
| Installation, Maintenance & Repair | 381 (100.0%) | 0 (0.0%) |
| Total (Category) | 570 (100.0%) | 0 (0.0%) |
| Total (Overall) | 3,601 (53.5%) | 3,123 (46.5%) |
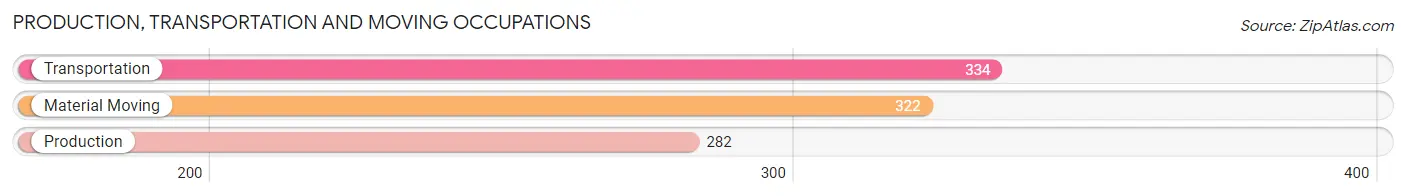
Production, Transportation and Moving Occupations
The most common Production, Transportation and Moving occupations in Irondale are Transportation (334 | 5.0%), Material Moving (322 | 4.8%), and Production (282 | 4.2%).
Production, Transportation and Moving Occupations by Sex
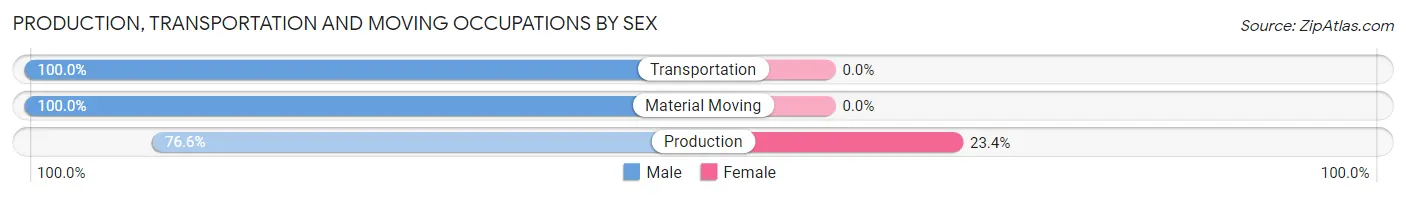
| Occupation | Male | Female |
| Production | 216 (76.6%) | 66 (23.4%) |
| Transportation | 334 (100.0%) | 0 (0.0%) |
| Material Moving | 322 (100.0%) | 0 (0.0%) |
| Total (Category) | 872 (93.0%) | 66 (7.0%) |
| Total (Overall) | 3,601 (53.5%) | 3,123 (46.5%) |
Employment Industries by Sex in Irondale
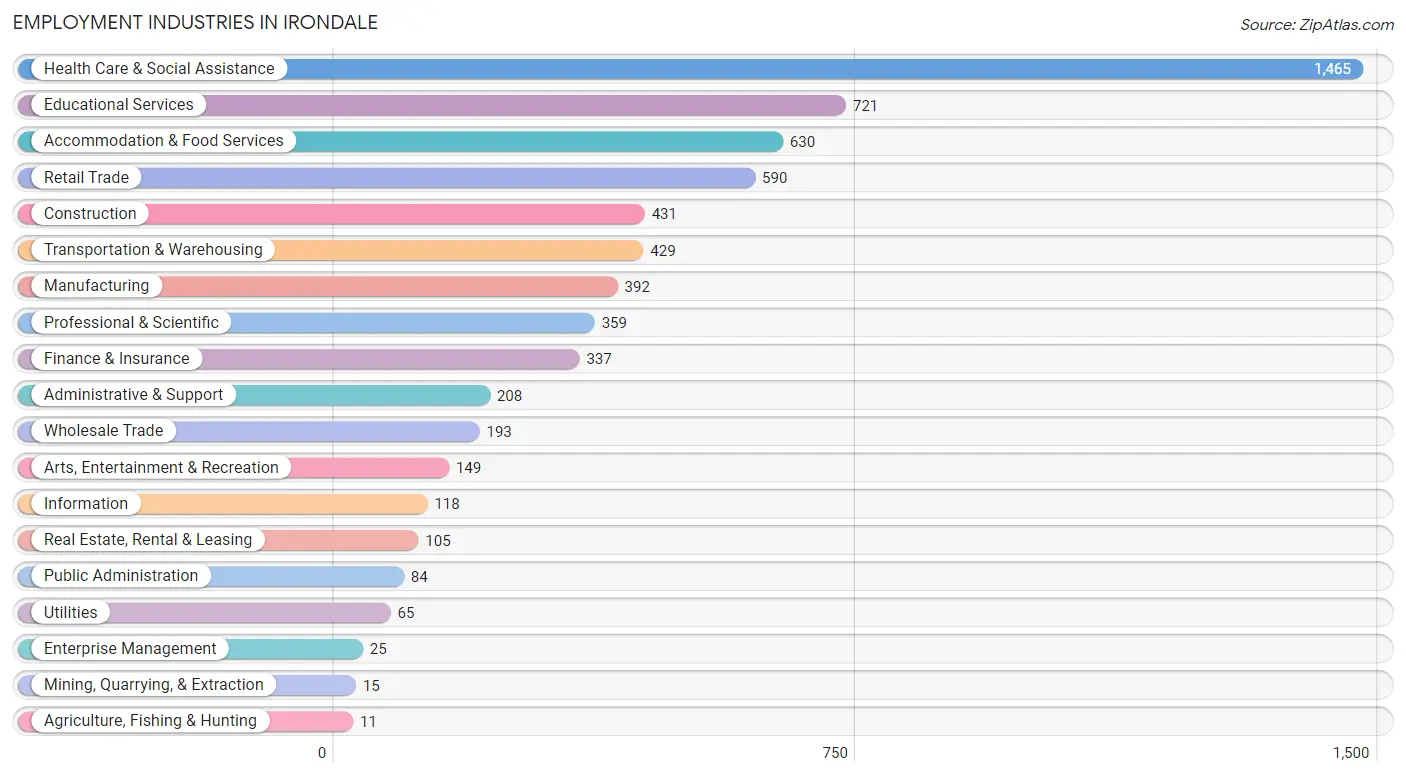
Employment Industries in Irondale
The major employment industries in Irondale include Health Care & Social Assistance (1,465 | 21.8%), Educational Services (721 | 10.7%), Accommodation & Food Services (630 | 9.4%), Retail Trade (590 | 8.8%), and Construction (431 | 6.4%).
Employment Industries by Sex in Irondale
The Irondale industries that see more men than women are Agriculture, Fishing & Hunting (100.0%), Mining, Quarrying, & Extraction (100.0%), and Transportation & Warehousing (93.9%), whereas the industries that tend to have a higher number of women are Arts, Entertainment & Recreation (89.9%), Health Care & Social Assistance (73.2%), and Administrative & Support (62.0%).
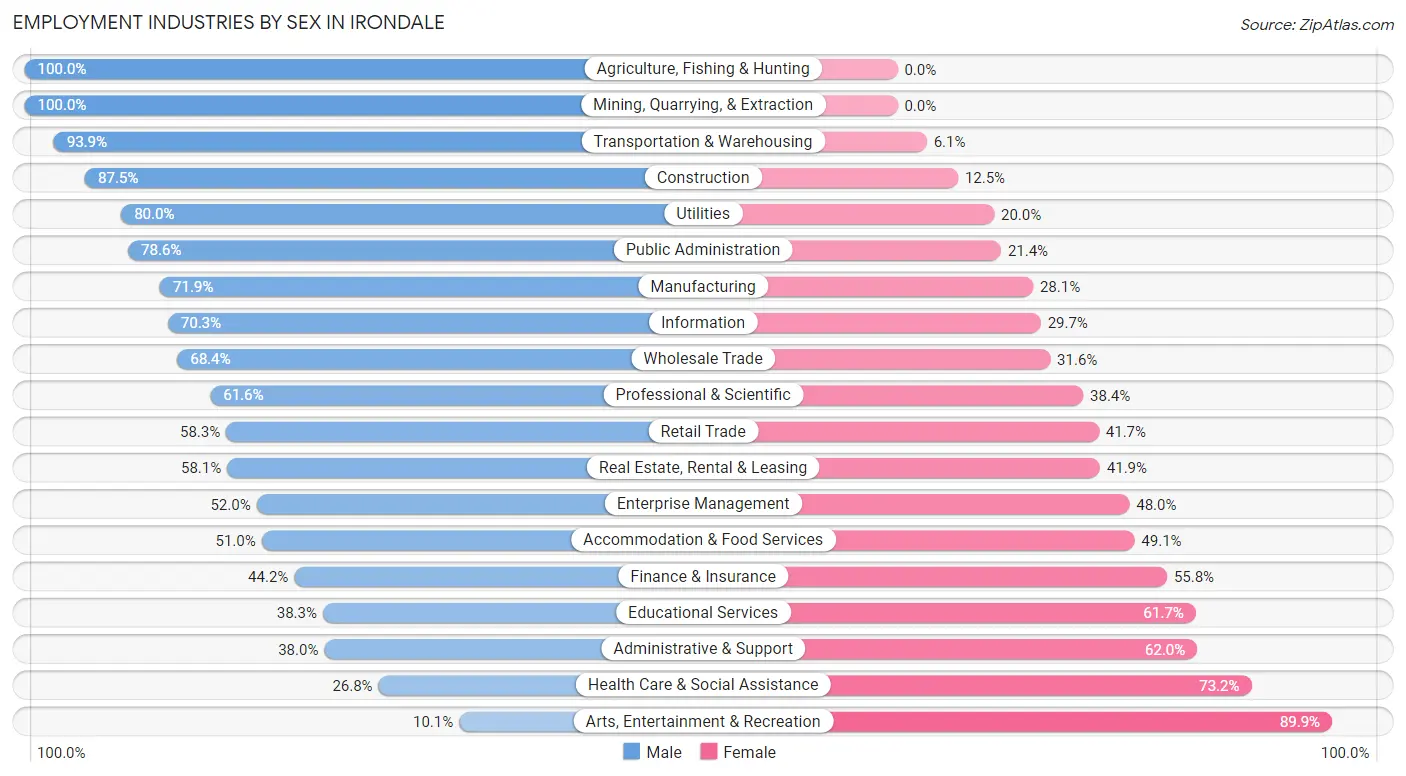
| Industry | Male | Female |
| Agriculture, Fishing & Hunting | 11 (100.0%) | 0 (0.0%) |
| Mining, Quarrying, & Extraction | 15 (100.0%) | 0 (0.0%) |
| Construction | 377 (87.5%) | 54 (12.5%) |
| Manufacturing | 282 (71.9%) | 110 (28.1%) |
| Wholesale Trade | 132 (68.4%) | 61 (31.6%) |
| Retail Trade | 344 (58.3%) | 246 (41.7%) |
| Transportation & Warehousing | 403 (93.9%) | 26 (6.1%) |
| Utilities | 52 (80.0%) | 13 (20.0%) |
| Information | 83 (70.3%) | 35 (29.7%) |
| Finance & Insurance | 149 (44.2%) | 188 (55.8%) |
| Real Estate, Rental & Leasing | 61 (58.1%) | 44 (41.9%) |
| Professional & Scientific | 221 (61.6%) | 138 (38.4%) |
| Enterprise Management | 13 (52.0%) | 12 (48.0%) |
| Administrative & Support | 79 (38.0%) | 129 (62.0%) |
| Educational Services | 276 (38.3%) | 445 (61.7%) |
| Health Care & Social Assistance | 392 (26.8%) | 1,073 (73.2%) |
| Arts, Entertainment & Recreation | 15 (10.1%) | 134 (89.9%) |
| Accommodation & Food Services | 321 (50.9%) | 309 (49.0%) |
| Public Administration | 66 (78.6%) | 18 (21.4%) |
| Total | 3,601 (53.5%) | 3,123 (46.5%) |
Education in Irondale
School Enrollment in Irondale
The most common levels of schooling among the 2,275 students in Irondale are college / undergraduate (688 | 30.2%), high school (422 | 18.5%), and elementary school (347 | 15.2%).
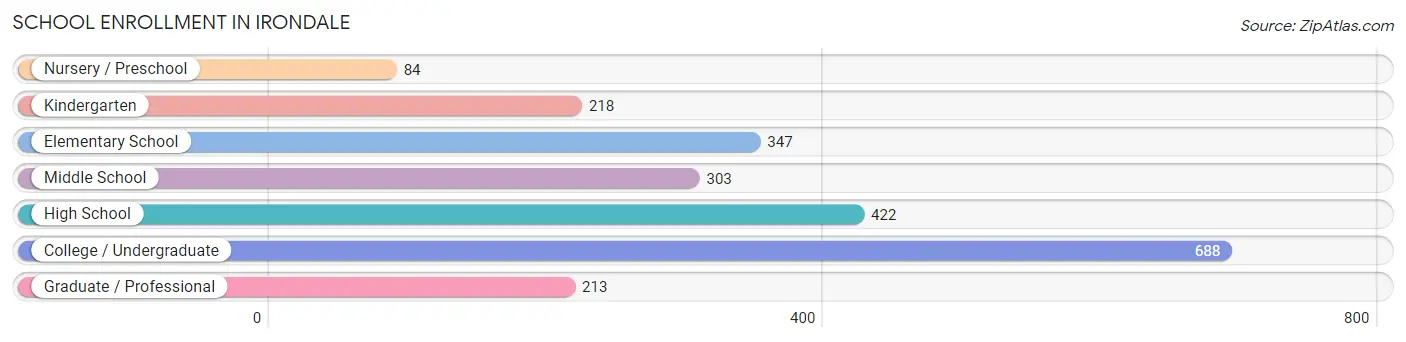
| School Level | # Students | % Students |
| Nursery / Preschool | 84 | 3.7% |
| Kindergarten | 218 | 9.6% |
| Elementary School | 347 | 15.2% |
| Middle School | 303 | 13.3% |
| High School | 422 | 18.5% |
| College / Undergraduate | 688 | 30.2% |
| Graduate / Professional | 213 | 9.4% |
| Total | 2,275 | 100.0% |
School Enrollment by Age by Funding Source in Irondale
Out of a total of 2,275 students who are enrolled in schools in Irondale, 710 (31.2%) attend a private institution, while the remaining 1,565 (68.8%) are enrolled in public schools. The age group of 3 to 4 year olds has the highest likelihood of being enrolled in private schools, with 25 (59.5% in the age bracket) enrolled. Conversely, the age group of 35 years and over has the lowest likelihood of being enrolled in a private school, with 88 (100.0% in the age bracket) attending a public institution.
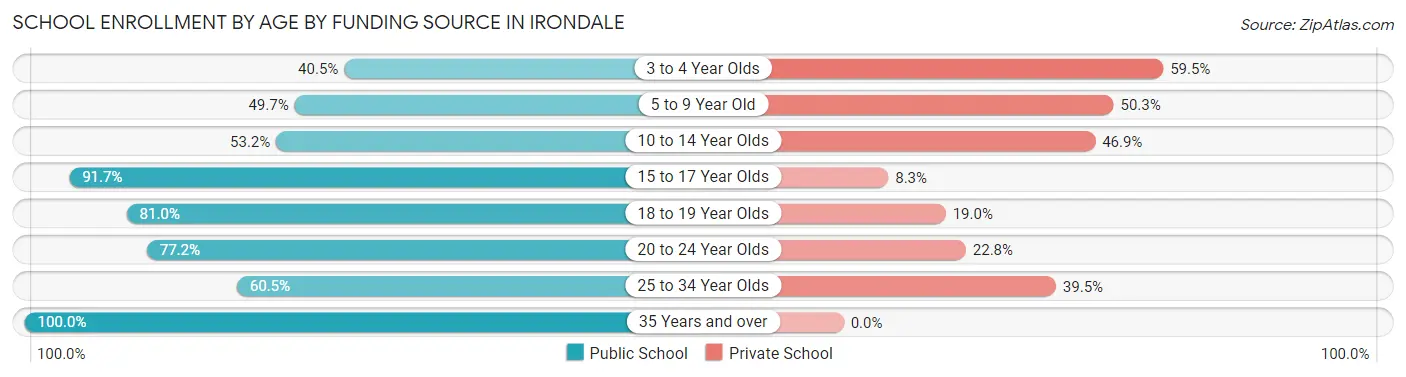
| Age Bracket | Public School | Private School |
| 3 to 4 Year Olds | 17 (40.5%) | 25 (59.5%) |
| 5 to 9 Year Old | 275 (49.7%) | 278 (50.3%) |
| 10 to 14 Year Olds | 177 (53.1%) | 156 (46.9%) |
| 15 to 17 Year Olds | 375 (91.7%) | 34 (8.3%) |
| 18 to 19 Year Olds | 115 (81.0%) | 27 (19.0%) |
| 20 to 24 Year Olds | 414 (77.2%) | 122 (22.8%) |
| 25 to 34 Year Olds | 104 (60.5%) | 68 (39.5%) |
| 35 Years and over | 88 (100.0%) | 0 (0.0%) |
| Total | 1,565 (68.8%) | 710 (31.2%) |
Educational Attainment by Field of Study in Irondale
Business (725 | 16.9%), education (635 | 14.8%), bio, nature & agricultural (547 | 12.7%), science & technology (468 | 10.9%), and liberal arts & history (321 | 7.5%) are the most common fields of study among 4,300 individuals in Irondale who have obtained a bachelor's degree or higher.
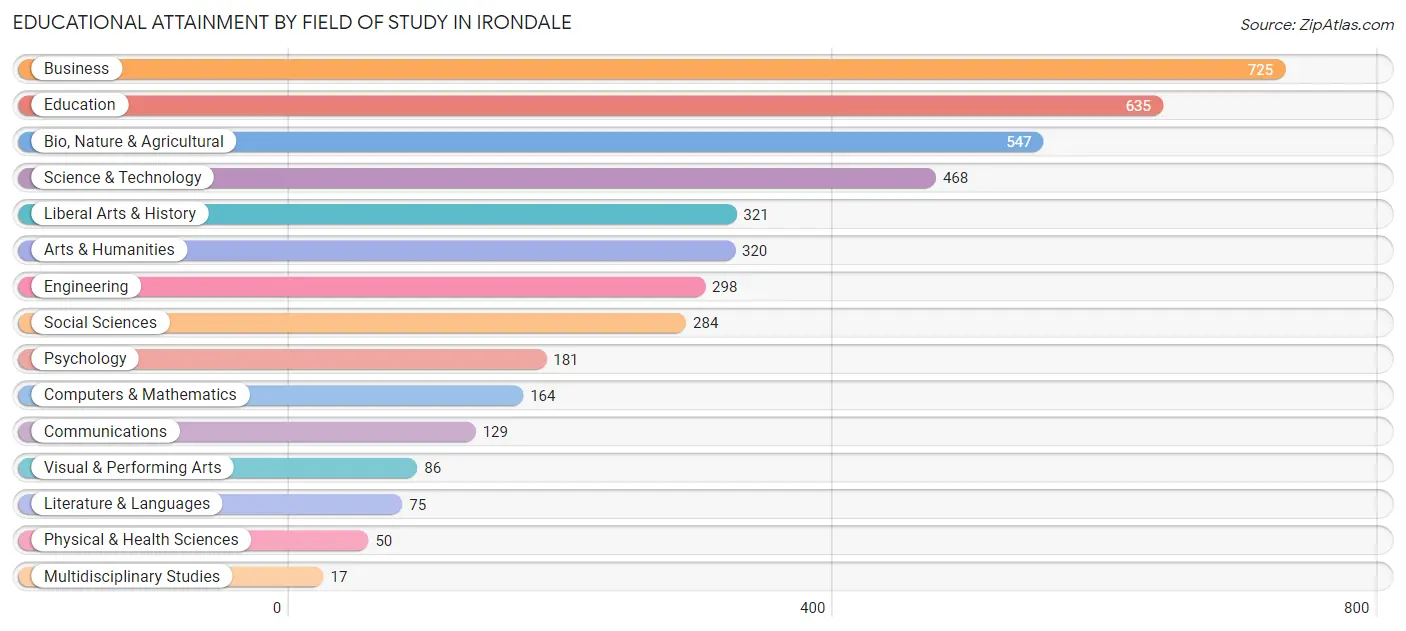
| Field of Study | # Graduates | % Graduates |
| Computers & Mathematics | 164 | 3.8% |
| Bio, Nature & Agricultural | 547 | 12.7% |
| Physical & Health Sciences | 50 | 1.2% |
| Psychology | 181 | 4.2% |
| Social Sciences | 284 | 6.6% |
| Engineering | 298 | 6.9% |
| Multidisciplinary Studies | 17 | 0.4% |
| Science & Technology | 468 | 10.9% |
| Business | 725 | 16.9% |
| Education | 635 | 14.8% |
| Literature & Languages | 75 | 1.7% |
| Liberal Arts & History | 321 | 7.5% |
| Visual & Performing Arts | 86 | 2.0% |
| Communications | 129 | 3.0% |
| Arts & Humanities | 320 | 7.4% |
| Total | 4,300 | 100.0% |
Transportation & Commute in Irondale
Vehicle Availability by Sex in Irondale
The most prevalent vehicle ownership categories in Irondale are males with 2 vehicles (1,606, accounting for 45.4%) and females with 2 vehicles (1,216, making up 51.5%).
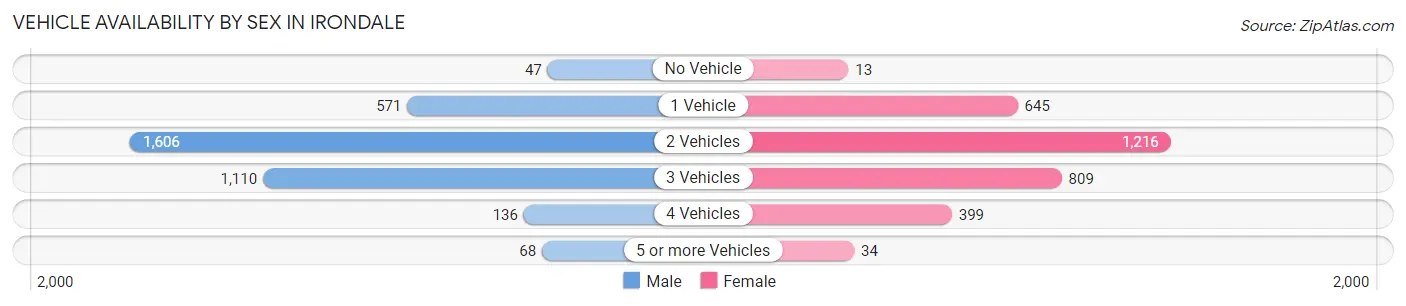
| Vehicles Available | Male | Female |
| No Vehicle | 47 (1.3%) | 13 (0.4%) |
| 1 Vehicle | 571 (16.1%) | 645 (20.7%) |
| 2 Vehicles | 1,606 (45.4%) | 1,216 (39.0%) |
| 3 Vehicles | 1,110 (31.4%) | 809 (26.0%) |
| 4 Vehicles | 136 (3.8%) | 399 (12.8%) |
| 5 or more Vehicles | 68 (1.9%) | 34 (1.1%) |
| Total | 3,538 (100.0%) | 3,116 (100.0%) |
Commute Time in Irondale
The most frequently occuring commute durations in Irondale are 20 to 24 minutes (1,251 commuters, 20.8%), 15 to 19 minutes (1,224 commuters, 20.4%), and 10 to 14 minutes (871 commuters, 14.5%).
| Commute Time | # Commuters | % Commuters |
| Less than 5 Minutes | 32 | 0.5% |
| 5 to 9 Minutes | 466 | 7.7% |
| 10 to 14 Minutes | 871 | 14.5% |
| 15 to 19 Minutes | 1,224 | 20.4% |
| 20 to 24 Minutes | 1,251 | 20.8% |
| 25 to 29 Minutes | 630 | 10.5% |
| 30 to 34 Minutes | 725 | 12.1% |
| 35 to 39 Minutes | 142 | 2.4% |
| 40 to 44 Minutes | 192 | 3.2% |
| 45 to 59 Minutes | 246 | 4.1% |
| 60 to 89 Minutes | 203 | 3.4% |
| 90 or more Minutes | 28 | 0.5% |
Commute Time by Sex in Irondale
The most common commute times in Irondale are 20 to 24 minutes (571 commuters, 17.6%) for males and 20 to 24 minutes (680 commuters, 24.6%) for females.
| Commute Time | Male | Female |
| Less than 5 Minutes | 12 (0.4%) | 20 (0.7%) |
| 5 to 9 Minutes | 343 (10.6%) | 123 (4.4%) |
| 10 to 14 Minutes | 506 (15.6%) | 365 (13.2%) |
| 15 to 19 Minutes | 546 (16.8%) | 678 (24.5%) |
| 20 to 24 Minutes | 571 (17.6%) | 680 (24.6%) |
| 25 to 29 Minutes | 344 (10.6%) | 286 (10.3%) |
| 30 to 34 Minutes | 534 (16.5%) | 191 (6.9%) |
| 35 to 39 Minutes | 108 (3.3%) | 34 (1.2%) |
| 40 to 44 Minutes | 75 (2.3%) | 117 (4.2%) |
| 45 to 59 Minutes | 116 (3.6%) | 130 (4.7%) |
| 60 to 89 Minutes | 90 (2.8%) | 113 (4.1%) |
| 90 or more Minutes | 0 (0.0%) | 28 (1.0%) |
Time of Departure to Work by Sex in Irondale
The most frequent times of departure to work in Irondale are 8:00 AM to 8:29 AM (679, 20.9%) for males and 7:00 AM to 7:29 AM (398, 14.4%) for females.
| Time of Departure | Male | Female |
| 12:00 AM to 4:59 AM | 119 (3.7%) | 126 (4.6%) |
| 5:00 AM to 5:29 AM | 56 (1.7%) | 0 (0.0%) |
| 5:30 AM to 5:59 AM | 191 (5.9%) | 69 (2.5%) |
| 6:00 AM to 6:29 AM | 179 (5.5%) | 203 (7.3%) |
| 6:30 AM to 6:59 AM | 146 (4.5%) | 185 (6.7%) |
| 7:00 AM to 7:29 AM | 492 (15.2%) | 398 (14.4%) |
| 7:30 AM to 7:59 AM | 464 (14.3%) | 353 (12.8%) |
| 8:00 AM to 8:29 AM | 679 (20.9%) | 375 (13.6%) |
| 8:30 AM to 8:59 AM | 438 (13.5%) | 123 (4.4%) |
| 9:00 AM to 9:59 AM | 99 (3.0%) | 373 (13.5%) |
| 10:00 AM to 10:59 AM | 92 (2.8%) | 32 (1.2%) |
| 11:00 AM to 11:59 AM | 61 (1.9%) | 35 (1.3%) |
| 12:00 PM to 3:59 PM | 120 (3.7%) | 216 (7.8%) |
| 4:00 PM to 11:59 PM | 109 (3.4%) | 277 (10.0%) |
| Total | 3,245 (100.0%) | 2,765 (100.0%) |
Housing Occupancy in Irondale
Occupancy by Ownership in Irondale
Of the total 6,262 dwellings in Irondale, owner-occupied units account for 3,784 (60.4%), while renter-occupied units make up 2,478 (39.6%).
| Occupancy | # Housing Units | % Housing Units |
| Owner Occupied Housing Units | 3,784 | 60.4% |
| Renter-Occupied Housing Units | 2,478 | 39.6% |
| Total Occupied Housing Units | 6,262 | 100.0% |
Occupancy by Household Size in Irondale
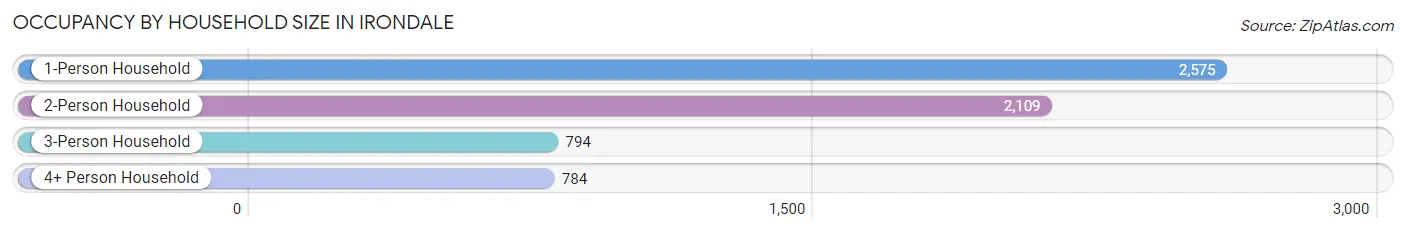
| Household Size | # Housing Units | % Housing Units |
| 1-Person Household | 2,575 | 41.1% |
| 2-Person Household | 2,109 | 33.7% |
| 3-Person Household | 794 | 12.7% |
| 4+ Person Household | 784 | 12.5% |
| Total Housing Units | 6,262 | 100.0% |
Occupancy by Ownership by Household Size in Irondale
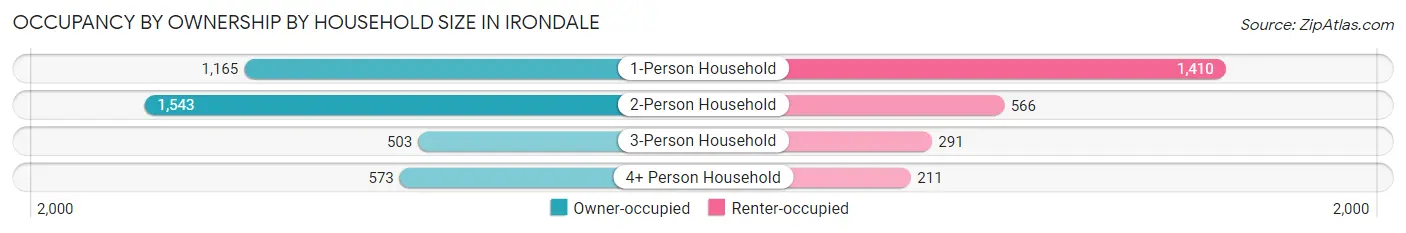
| Household Size | Owner-occupied | Renter-occupied |
| 1-Person Household | 1,165 (45.2%) | 1,410 (54.8%) |
| 2-Person Household | 1,543 (73.2%) | 566 (26.8%) |
| 3-Person Household | 503 (63.3%) | 291 (36.6%) |
| 4+ Person Household | 573 (73.1%) | 211 (26.9%) |
| Total Housing Units | 3,784 (60.4%) | 2,478 (39.6%) |
Occupancy by Educational Attainment in Irondale
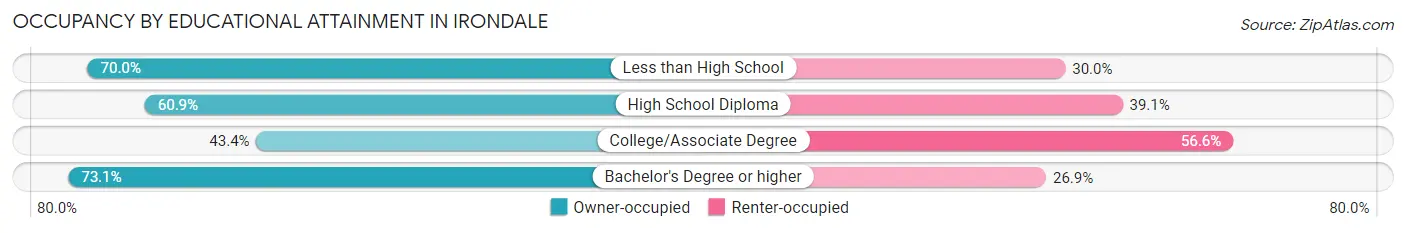
| Household Size | Owner-occupied | Renter-occupied |
| Less than High School | 266 (70.0%) | 114 (30.0%) |
| High School Diploma | 781 (60.9%) | 501 (39.1%) |
| College/Associate Degree | 912 (43.4%) | 1,190 (56.6%) |
| Bachelor's Degree or higher | 1,825 (73.1%) | 673 (26.9%) |
Occupancy by Age of Householder in Irondale
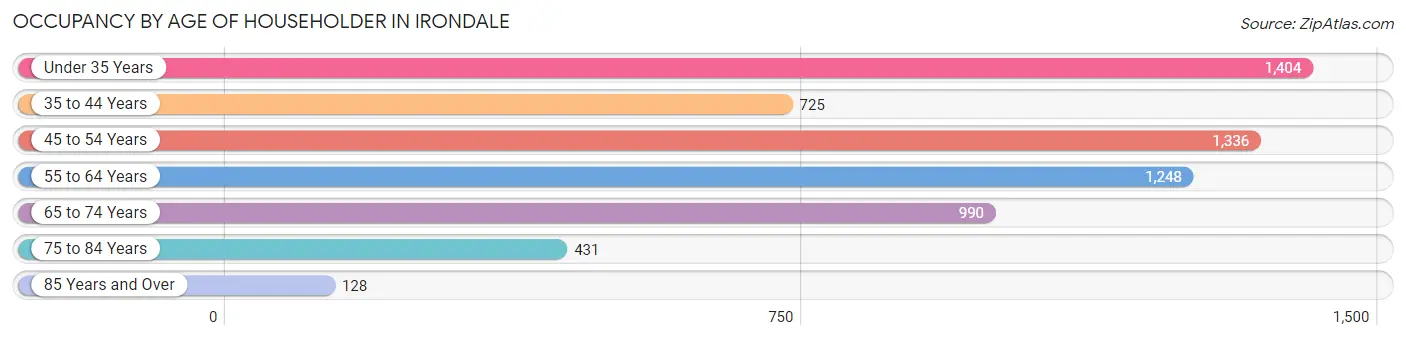
| Age Bracket | # Households | % Households |
| Under 35 Years | 1,404 | 22.4% |
| 35 to 44 Years | 725 | 11.6% |
| 45 to 54 Years | 1,336 | 21.3% |
| 55 to 64 Years | 1,248 | 19.9% |
| 65 to 74 Years | 990 | 15.8% |
| 75 to 84 Years | 431 | 6.9% |
| 85 Years and Over | 128 | 2.0% |
| Total | 6,262 | 100.0% |
Housing Finances in Irondale
Median Income by Occupancy in Irondale
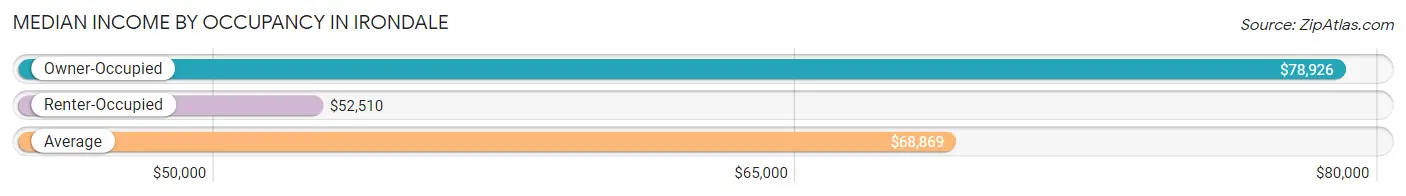
| Occupancy Type | # Households | Median Income |
| Owner-Occupied | 3,784 (60.4%) | $78,926 |
| Renter-Occupied | 2,478 (39.6%) | $52,510 |
| Average | 6,262 (100.0%) | $68,869 |
Occupancy by Householder Income Bracket in Irondale
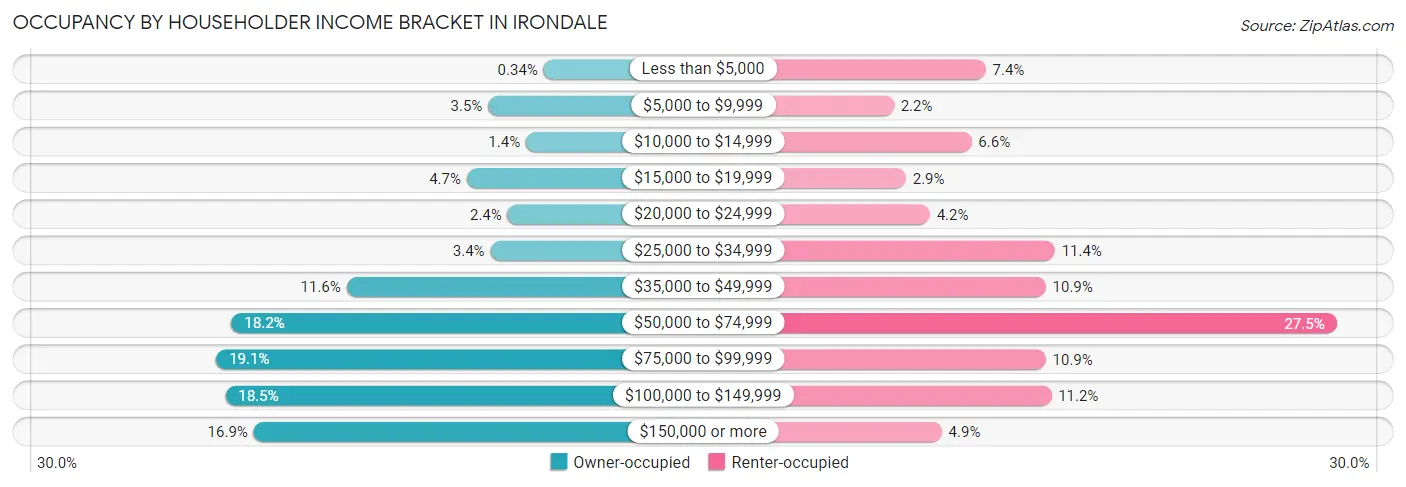
| Income Bracket | Owner-occupied | Renter-occupied |
| Less than $5,000 | 13 (0.3%) | 184 (7.4%) |
| $5,000 to $9,999 | 133 (3.5%) | 54 (2.2%) |
| $10,000 to $14,999 | 51 (1.3%) | 164 (6.6%) |
| $15,000 to $19,999 | 179 (4.7%) | 71 (2.9%) |
| $20,000 to $24,999 | 91 (2.4%) | 105 (4.2%) |
| $25,000 to $34,999 | 128 (3.4%) | 282 (11.4%) |
| $35,000 to $49,999 | 439 (11.6%) | 269 (10.9%) |
| $50,000 to $74,999 | 688 (18.2%) | 681 (27.5%) |
| $75,000 to $99,999 | 721 (19.1%) | 269 (10.9%) |
| $100,000 to $149,999 | 701 (18.5%) | 277 (11.2%) |
| $150,000 or more | 640 (16.9%) | 122 (4.9%) |
| Total | 3,784 (100.0%) | 2,478 (100.0%) |
Monthly Housing Cost Tiers in Irondale
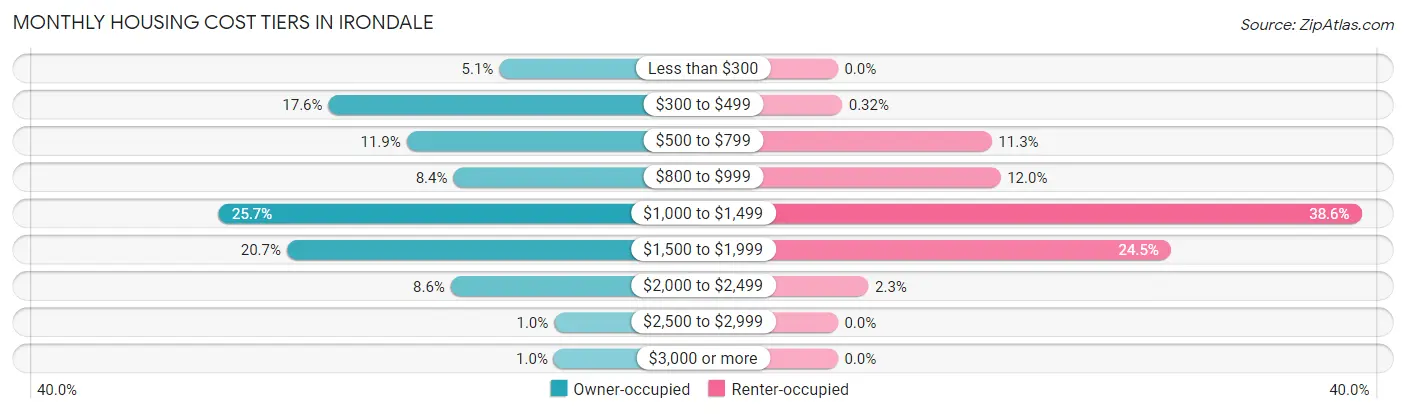
| Monthly Cost | Owner-occupied | Renter-occupied |
| Less than $300 | 191 (5.1%) | 0 (0.0%) |
| $300 to $499 | 667 (17.6%) | 8 (0.3%) |
| $500 to $799 | 449 (11.9%) | 281 (11.3%) |
| $800 to $999 | 319 (8.4%) | 297 (12.0%) |
| $1,000 to $1,499 | 972 (25.7%) | 956 (38.6%) |
| $1,500 to $1,999 | 783 (20.7%) | 608 (24.5%) |
| $2,000 to $2,499 | 326 (8.6%) | 56 (2.3%) |
| $2,500 to $2,999 | 38 (1.0%) | 0 (0.0%) |
| $3,000 or more | 39 (1.0%) | 0 (0.0%) |
| Total | 3,784 (100.0%) | 2,478 (100.0%) |
Physical Housing Characteristics in Irondale
Housing Structures in Irondale
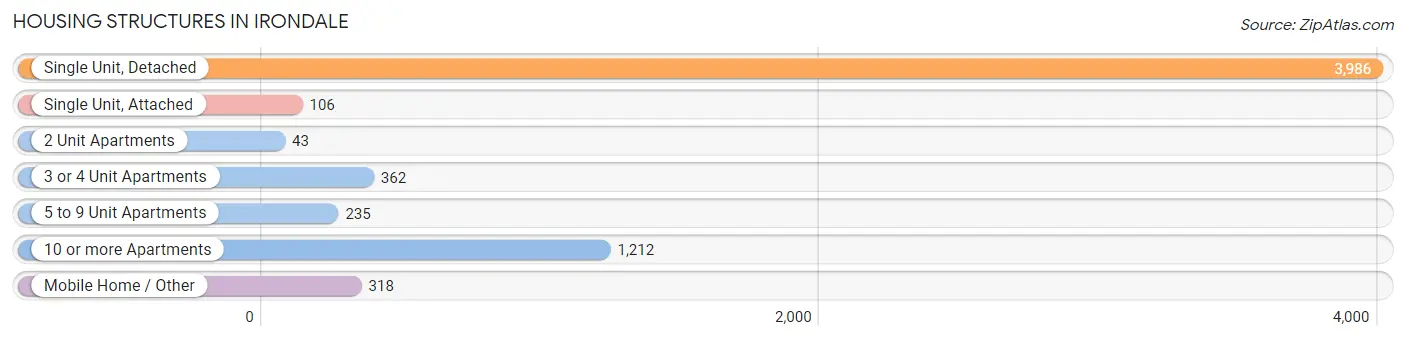
| Structure Type | # Housing Units | % Housing Units |
| Single Unit, Detached | 3,986 | 63.6% |
| Single Unit, Attached | 106 | 1.7% |
| 2 Unit Apartments | 43 | 0.7% |
| 3 or 4 Unit Apartments | 362 | 5.8% |
| 5 to 9 Unit Apartments | 235 | 3.7% |
| 10 or more Apartments | 1,212 | 19.4% |
| Mobile Home / Other | 318 | 5.1% |
| Total | 6,262 | 100.0% |
Housing Structures by Occupancy in Irondale
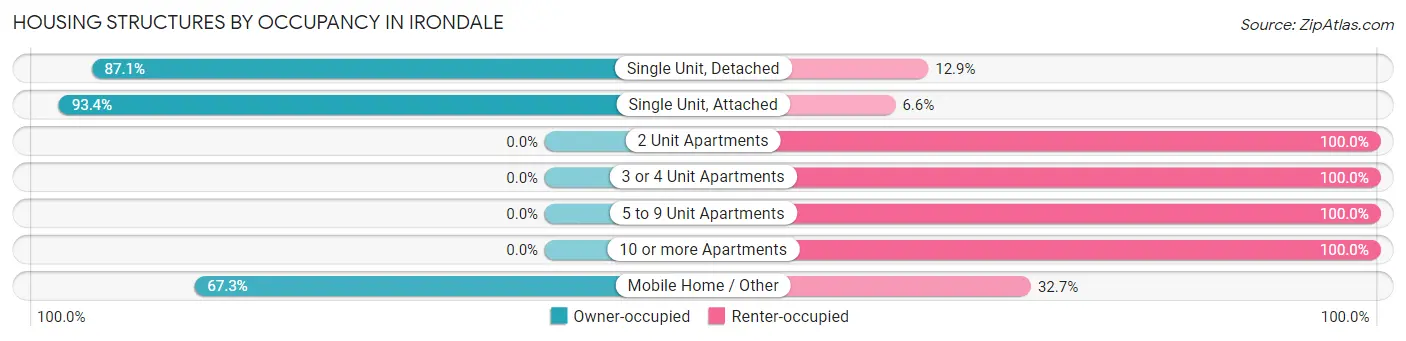
| Structure Type | Owner-occupied | Renter-occupied |
| Single Unit, Detached | 3,471 (87.1%) | 515 (12.9%) |
| Single Unit, Attached | 99 (93.4%) | 7 (6.6%) |
| 2 Unit Apartments | 0 (0.0%) | 43 (100.0%) |
| 3 or 4 Unit Apartments | 0 (0.0%) | 362 (100.0%) |
| 5 to 9 Unit Apartments | 0 (0.0%) | 235 (100.0%) |
| 10 or more Apartments | 0 (0.0%) | 1,212 (100.0%) |
| Mobile Home / Other | 214 (67.3%) | 104 (32.7%) |
| Total | 3,784 (60.4%) | 2,478 (39.6%) |
Housing Structures by Number of Rooms in Irondale
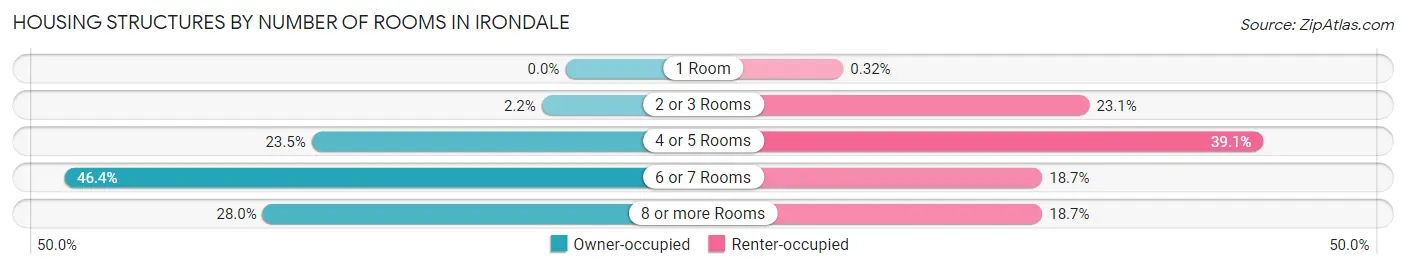
| Number of Rooms | Owner-occupied | Renter-occupied |
| 1 Room | 0 (0.0%) | 8 (0.3%) |
| 2 or 3 Rooms | 83 (2.2%) | 572 (23.1%) |
| 4 or 5 Rooms | 888 (23.5%) | 970 (39.1%) |
| 6 or 7 Rooms | 1,754 (46.4%) | 464 (18.7%) |
| 8 or more Rooms | 1,059 (28.0%) | 464 (18.7%) |
| Total | 3,784 (100.0%) | 2,478 (100.0%) |
Housing Structure by Heating Type in Irondale
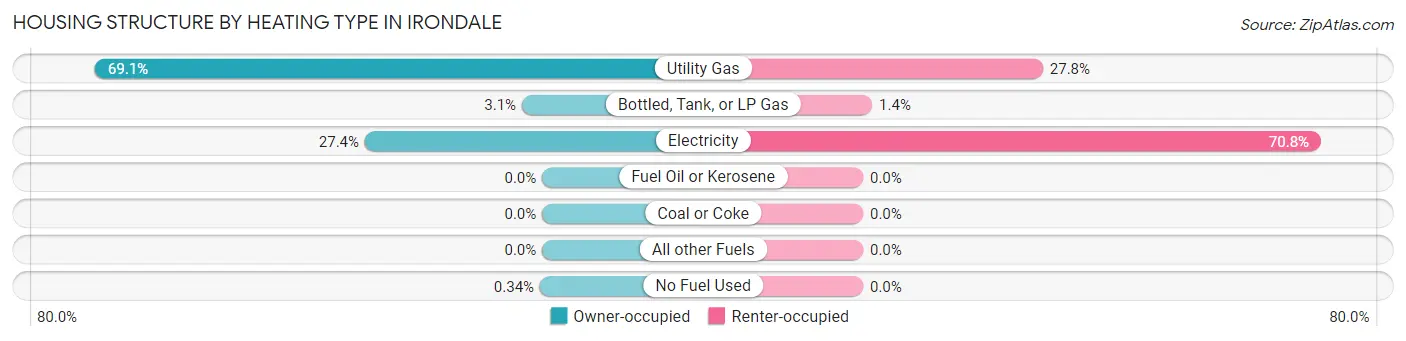
| Heating Type | Owner-occupied | Renter-occupied |
| Utility Gas | 2,616 (69.1%) | 689 (27.8%) |
| Bottled, Tank, or LP Gas | 118 (3.1%) | 35 (1.4%) |
| Electricity | 1,037 (27.4%) | 1,754 (70.8%) |
| Fuel Oil or Kerosene | 0 (0.0%) | 0 (0.0%) |
| Coal or Coke | 0 (0.0%) | 0 (0.0%) |
| All other Fuels | 0 (0.0%) | 0 (0.0%) |
| No Fuel Used | 13 (0.3%) | 0 (0.0%) |
| Total | 3,784 (100.0%) | 2,478 (100.0%) |
Household Vehicle Usage in Irondale
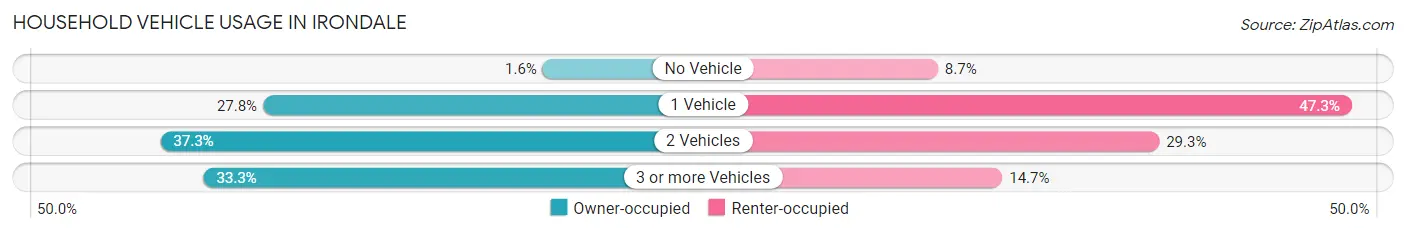
| Vehicles per Household | Owner-occupied | Renter-occupied |
| No Vehicle | 62 (1.6%) | 215 (8.7%) |
| 1 Vehicle | 1,050 (27.8%) | 1,172 (47.3%) |
| 2 Vehicles | 1,412 (37.3%) | 727 (29.3%) |
| 3 or more Vehicles | 1,260 (33.3%) | 364 (14.7%) |
| Total | 3,784 (100.0%) | 2,478 (100.0%) |
Real Estate & Mortgages in Irondale
Real Estate and Mortgage Overview in Irondale
| Characteristic | Without Mortgage | With Mortgage |
| Housing Units | 1,253 | 2,531 |
| Median Property Value | $183,700 | $214,100 |
| Median Household Income | $70,775 | $486 |
| Monthly Housing Costs | $447 | $39 |
| Real Estate Taxes | $950 | $228 |
Property Value by Mortgage Status in Irondale
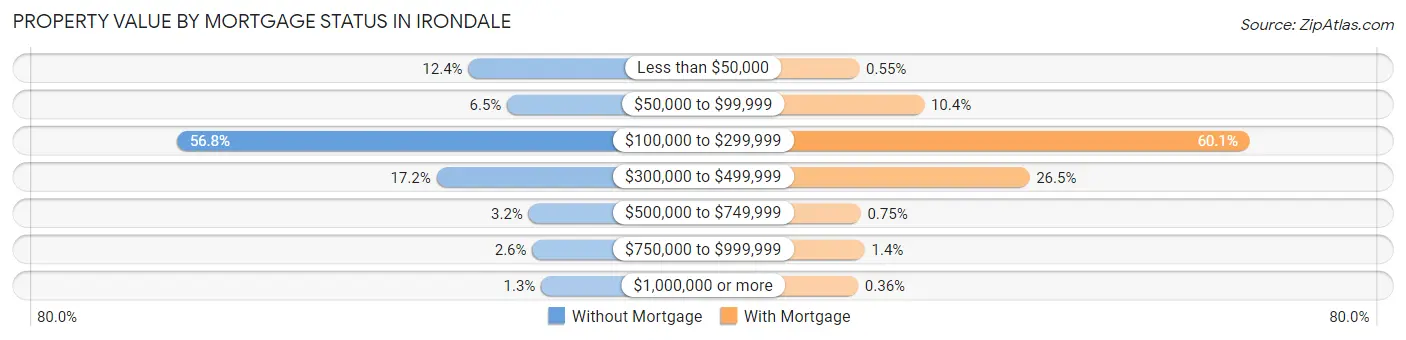
| Property Value | Without Mortgage | With Mortgage |
| Less than $50,000 | 155 (12.4%) | 14 (0.5%) |
| $50,000 to $99,999 | 81 (6.5%) | 264 (10.4%) |
| $100,000 to $299,999 | 712 (56.8%) | 1,520 (60.1%) |
| $300,000 to $499,999 | 216 (17.2%) | 670 (26.5%) |
| $500,000 to $749,999 | 40 (3.2%) | 19 (0.7%) |
| $750,000 to $999,999 | 33 (2.6%) | 35 (1.4%) |
| $1,000,000 or more | 16 (1.3%) | 9 (0.4%) |
| Total | 1,253 (100.0%) | 2,531 (100.0%) |
Household Income by Mortgage Status in Irondale
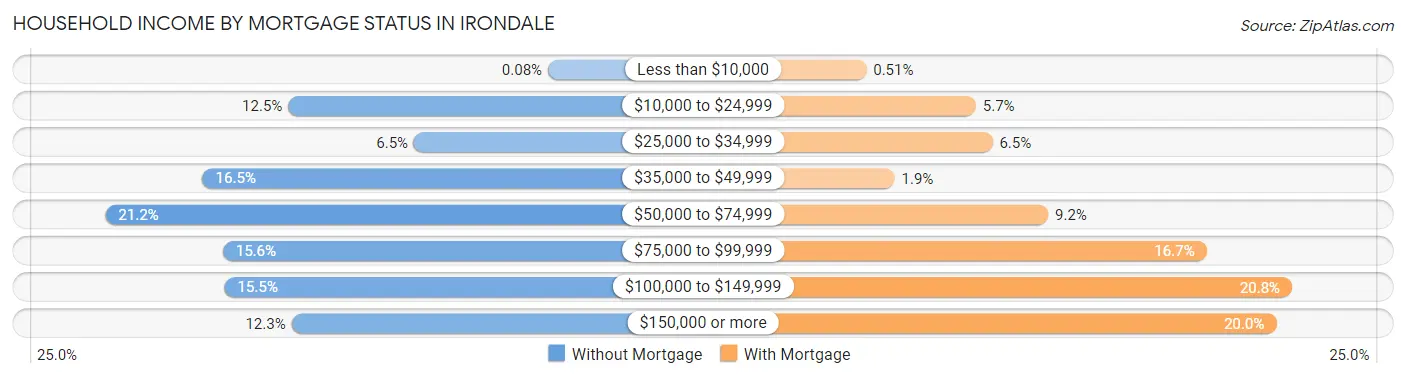
| Household Income | Without Mortgage | With Mortgage |
| Less than $10,000 | 1 (0.1%) | 13 (0.5%) |
| $10,000 to $24,999 | 156 (12.4%) | 145 (5.7%) |
| $25,000 to $34,999 | 81 (6.5%) | 165 (6.5%) |
| $35,000 to $49,999 | 207 (16.5%) | 47 (1.9%) |
| $50,000 to $74,999 | 265 (21.1%) | 232 (9.2%) |
| $75,000 to $99,999 | 195 (15.6%) | 423 (16.7%) |
| $100,000 to $149,999 | 194 (15.5%) | 526 (20.8%) |
| $150,000 or more | 154 (12.3%) | 507 (20.0%) |
| Total | 1,253 (100.0%) | 2,531 (100.0%) |
Property Value to Household Income Ratio in Irondale
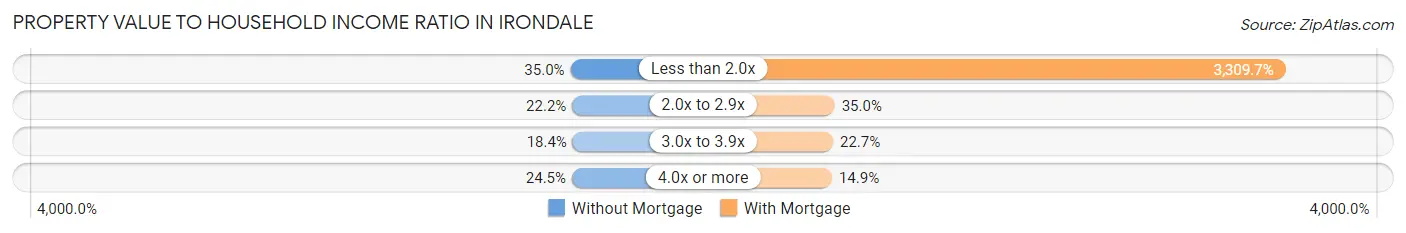
| Value-to-Income Ratio | Without Mortgage | With Mortgage |
| Less than 2.0x | 438 (35.0%) | 83,769 (3,309.7%) |
| 2.0x to 2.9x | 278 (22.2%) | 886 (35.0%) |
| 3.0x to 3.9x | 230 (18.4%) | 574 (22.7%) |
| 4.0x or more | 307 (24.5%) | 377 (14.9%) |
| Total | 1,253 (100.0%) | 2,531 (100.0%) |
Real Estate Taxes by Mortgage Status in Irondale
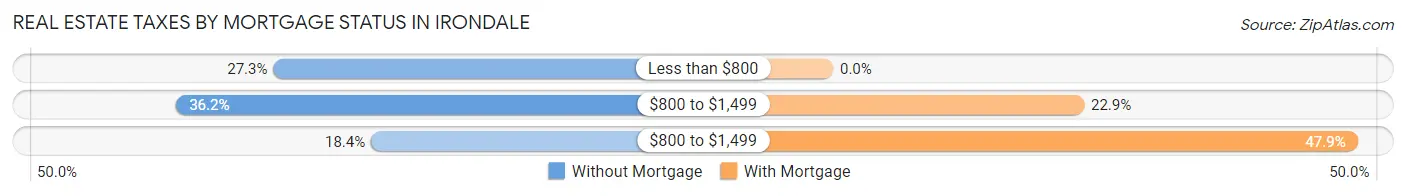
| Property Taxes | Without Mortgage | With Mortgage |
| Less than $800 | 342 (27.3%) | 0 (0.0%) |
| $800 to $1,499 | 453 (36.1%) | 580 (22.9%) |
| $800 to $1,499 | 230 (18.4%) | 1,212 (47.9%) |
| Total | 1,253 (100.0%) | 2,531 (100.0%) |
Health & Disability in Irondale
Health Insurance Coverage by Age in Irondale
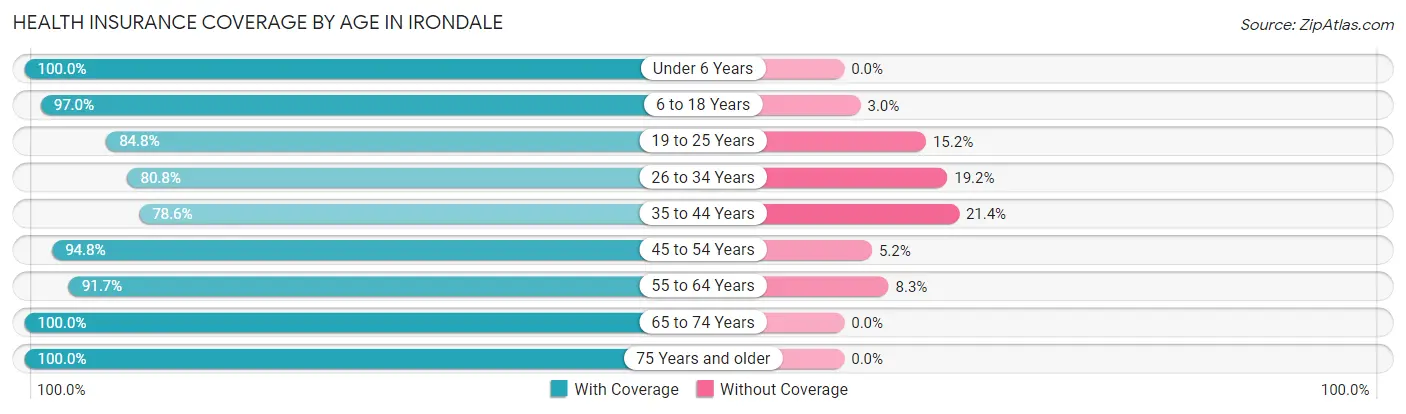
| Age Bracket | With Coverage | Without Coverage |
| Under 6 Years | 1,081 (100.0%) | 0 (0.0%) |
| 6 to 18 Years | 1,087 (97.0%) | 34 (3.0%) |
| 19 to 25 Years | 1,069 (84.8%) | 192 (15.2%) |
| 26 to 34 Years | 1,468 (80.8%) | 349 (19.2%) |
| 35 to 44 Years | 1,195 (78.6%) | 325 (21.4%) |
| 45 to 54 Years | 1,911 (94.8%) | 104 (5.2%) |
| 55 to 64 Years | 1,943 (91.7%) | 175 (8.3%) |
| 65 to 74 Years | 1,609 (100.0%) | 0 (0.0%) |
| 75 Years and older | 724 (100.0%) | 0 (0.0%) |
| Total | 12,087 (91.1%) | 1,179 (8.9%) |
Health Insurance Coverage by Citizenship Status in Irondale
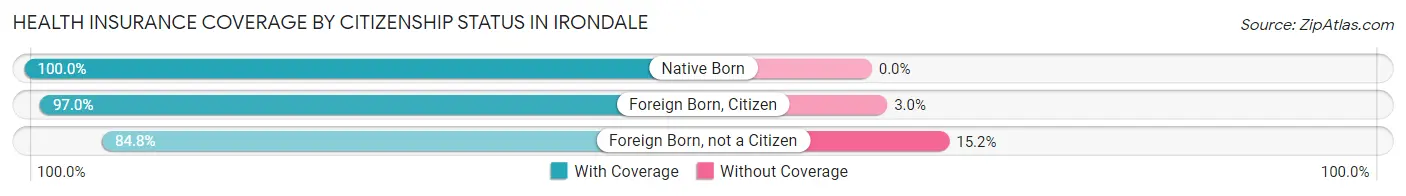
| Citizenship Status | With Coverage | Without Coverage |
| Native Born | 1,081 (100.0%) | 0 (0.0%) |
| Foreign Born, Citizen | 1,087 (97.0%) | 34 (3.0%) |
| Foreign Born, not a Citizen | 1,069 (84.8%) | 192 (15.2%) |
Health Insurance Coverage by Household Income in Irondale
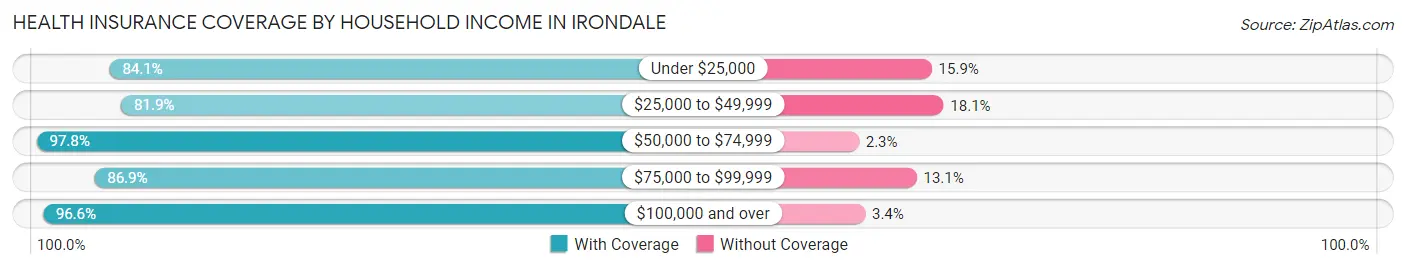
| Household Income | With Coverage | Without Coverage |
| Under $25,000 | 1,724 (84.1%) | 326 (15.9%) |
| $25,000 to $49,999 | 1,656 (81.9%) | 366 (18.1%) |
| $50,000 to $74,999 | 2,350 (97.8%) | 54 (2.2%) |
| $75,000 to $99,999 | 1,818 (86.9%) | 273 (13.1%) |
| $100,000 and over | 4,513 (96.6%) | 160 (3.4%) |
Public vs Private Health Insurance Coverage by Age in Irondale
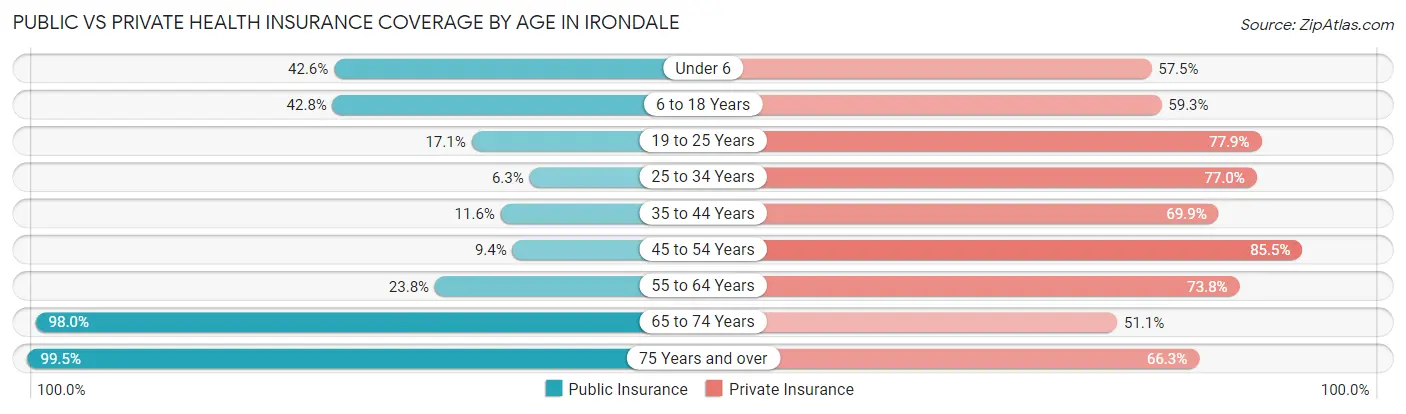
| Age Bracket | Public Insurance | Private Insurance |
| Under 6 | 460 (42.5%) | 621 (57.5%) |
| 6 to 18 Years | 480 (42.8%) | 665 (59.3%) |
| 19 to 25 Years | 215 (17.1%) | 982 (77.9%) |
| 25 to 34 Years | 114 (6.3%) | 1,399 (77.0%) |
| 35 to 44 Years | 177 (11.6%) | 1,063 (69.9%) |
| 45 to 54 Years | 190 (9.4%) | 1,722 (85.5%) |
| 55 to 64 Years | 505 (23.8%) | 1,563 (73.8%) |
| 65 to 74 Years | 1,576 (98.0%) | 822 (51.1%) |
| 75 Years and over | 720 (99.5%) | 480 (66.3%) |
| Total | 4,437 (33.5%) | 9,317 (70.2%) |
Disability Status by Sex by Age in Irondale
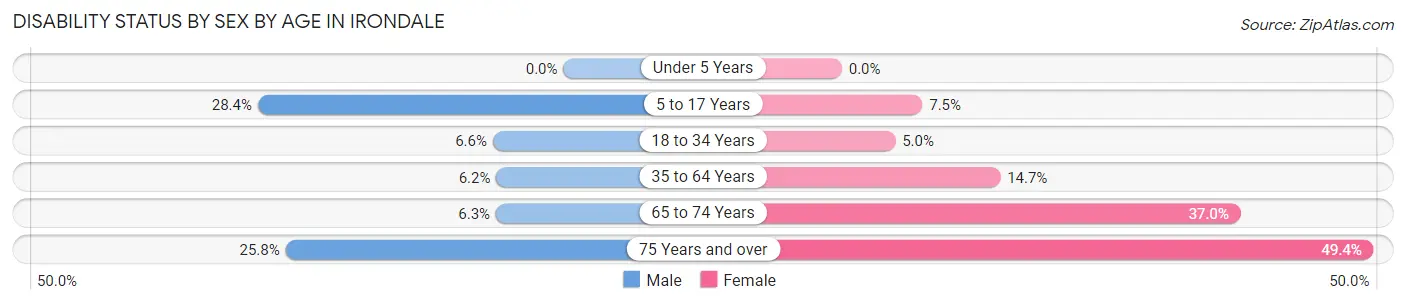
| Age Bracket | Male | Female |
| Under 5 Years | 0 (0.0%) | 0 (0.0%) |
| 5 to 17 Years | 213 (28.4%) | 43 (7.5%) |
| 18 to 34 Years | 122 (6.6%) | 63 (5.0%) |
| 35 to 64 Years | 188 (6.2%) | 387 (14.7%) |
| 65 to 74 Years | 39 (6.3%) | 365 (37.0%) |
| 75 Years and over | 66 (25.8%) | 231 (49.4%) |
Disability Class by Sex by Age in Irondale
Disability Class: Hearing Difficulty
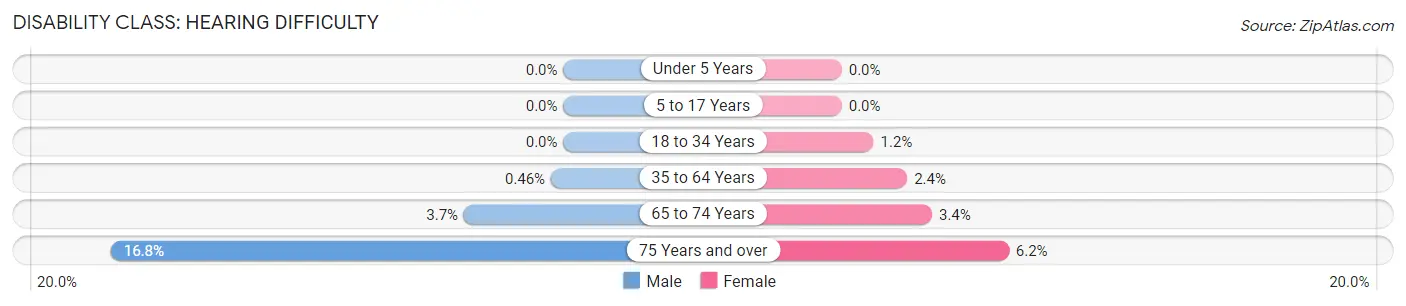
| Age Bracket | Male | Female |
| Under 5 Years | 0 (0.0%) | 0 (0.0%) |
| 5 to 17 Years | 0 (0.0%) | 0 (0.0%) |
| 18 to 34 Years | 0 (0.0%) | 15 (1.2%) |
| 35 to 64 Years | 14 (0.5%) | 64 (2.4%) |
| 65 to 74 Years | 23 (3.7%) | 33 (3.4%) |
| 75 Years and over | 43 (16.8%) | 29 (6.2%) |
Disability Class: Vision Difficulty
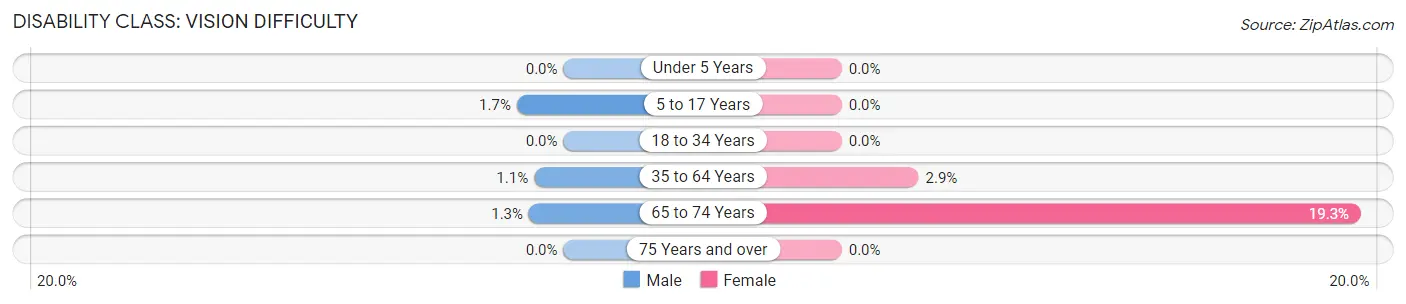
| Age Bracket | Male | Female |
| Under 5 Years | 0 (0.0%) | 0 (0.0%) |
| 5 to 17 Years | 13 (1.7%) | 0 (0.0%) |
| 18 to 34 Years | 0 (0.0%) | 0 (0.0%) |
| 35 to 64 Years | 33 (1.1%) | 75 (2.9%) |
| 65 to 74 Years | 8 (1.3%) | 190 (19.3%) |
| 75 Years and over | 0 (0.0%) | 0 (0.0%) |
Disability Class: Cognitive Difficulty
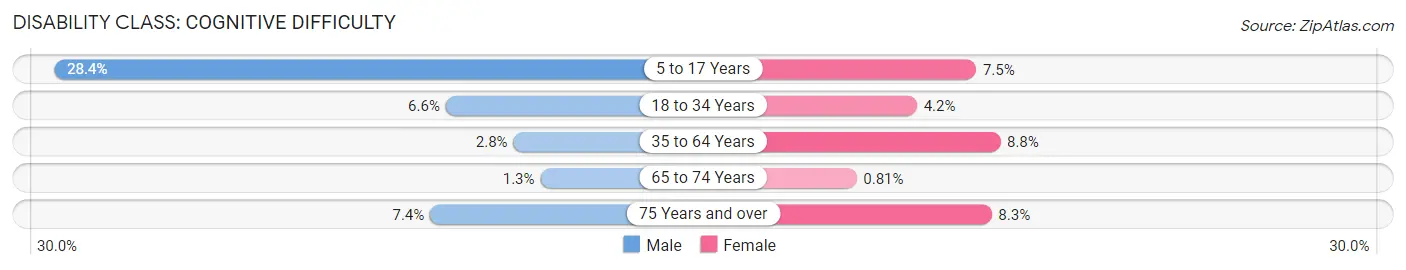
| Age Bracket | Male | Female |
| 5 to 17 Years | 213 (28.4%) | 43 (7.5%) |
| 18 to 34 Years | 122 (6.6%) | 53 (4.2%) |
| 35 to 64 Years | 84 (2.8%) | 232 (8.8%) |
| 65 to 74 Years | 8 (1.3%) | 8 (0.8%) |
| 75 Years and over | 19 (7.4%) | 39 (8.3%) |
Disability Class: Ambulatory Difficulty
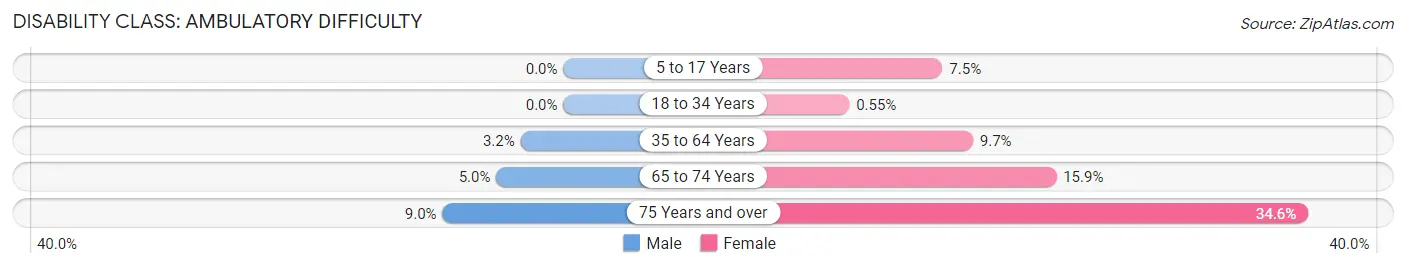
| Age Bracket | Male | Female |
| 5 to 17 Years | 0 (0.0%) | 43 (7.5%) |
| 18 to 34 Years | 0 (0.0%) | 7 (0.5%) |
| 35 to 64 Years | 96 (3.2%) | 256 (9.7%) |
| 65 to 74 Years | 31 (5.0%) | 157 (15.9%) |
| 75 Years and over | 23 (9.0%) | 162 (34.6%) |
Disability Class: Self-Care Difficulty
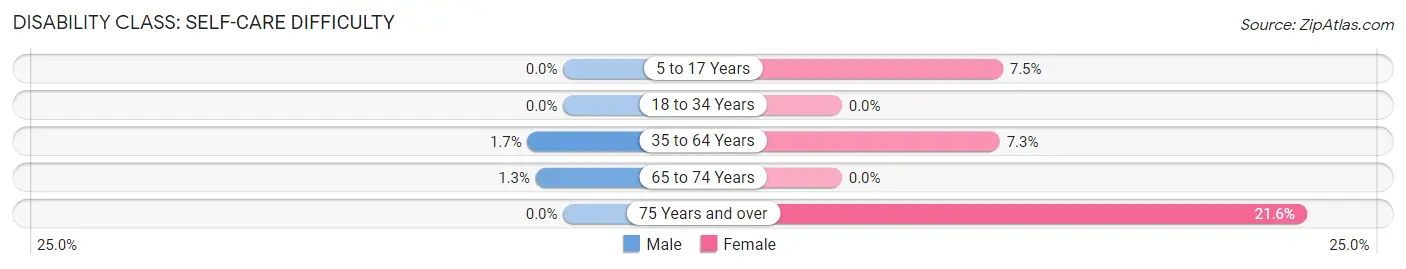
| Age Bracket | Male | Female |
| 5 to 17 Years | 0 (0.0%) | 43 (7.5%) |
| 18 to 34 Years | 0 (0.0%) | 0 (0.0%) |
| 35 to 64 Years | 50 (1.7%) | 193 (7.3%) |
| 65 to 74 Years | 8 (1.3%) | 0 (0.0%) |
| 75 Years and over | 0 (0.0%) | 101 (21.6%) |
Technology Access in Irondale
Computing Device Access in Irondale
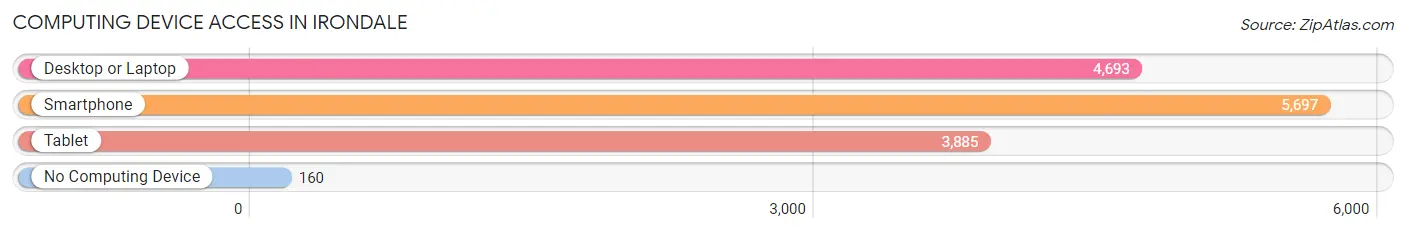
| Device Type | # Households | % Households |
| Desktop or Laptop | 4,693 | 74.9% |
| Smartphone | 5,697 | 91.0% |
| Tablet | 3,885 | 62.0% |
| No Computing Device | 160 | 2.6% |
| Total | 6,262 | 100.0% |
Internet Access in Irondale
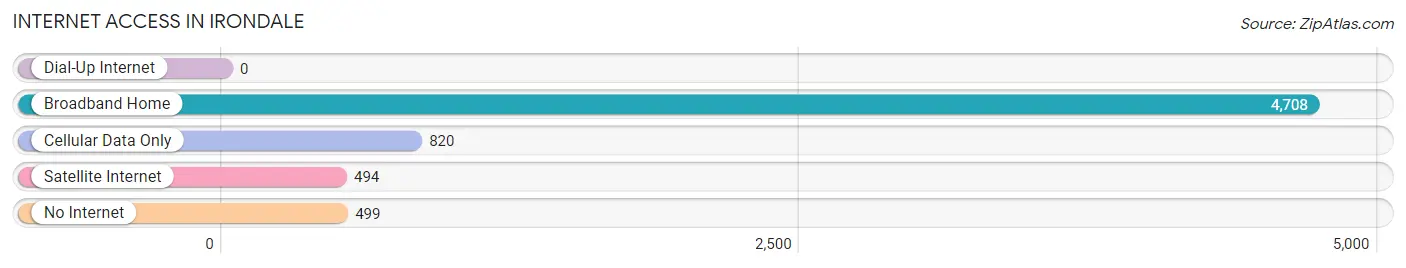
| Internet Type | # Households | % Households |
| Dial-Up Internet | 0 | 0.0% |
| Broadband Home | 4,708 | 75.2% |
| Cellular Data Only | 820 | 13.1% |
| Satellite Internet | 494 | 7.9% |
| No Internet | 499 | 8.0% |
| Total | 6,262 | 100.0% |
Irondale Summary
Irondale, Alabama is a small city located in Jefferson County, Alabama. It is located just east of Birmingham, Alabama and is part of the Birmingham-Hoover Metropolitan Statistical Area. The city has a population of 12,349 as of the 2010 census.
History
The area that is now Irondale was first settled in the early 1800s by settlers from North Carolina. The area was originally known as Irondale Furnace, named after the iron ore furnace that was built in the area in 1871. The furnace was used to produce iron for the Confederate Army during the Civil War. After the war, the furnace was used to produce iron for the railroads that were being built in the area.
In 1887, the town of Irondale was officially incorporated. The town was named after the iron ore furnace that had been built in the area. The town grew slowly over the next few decades, but it was not until the 1950s that the town began to experience significant growth. This growth was due to the expansion of the Birmingham-Hoover Metropolitan Statistical Area and the growth of the steel industry in the area.
Geography
Irondale is located in Jefferson County, Alabama. It is located just east of Birmingham, Alabama and is part of the Birmingham-Hoover Metropolitan Statistical Area. The city has a total area of 8.2 square miles, all of which is land. The city is located at an elevation of 645 feet above sea level.
The city is located in the foothills of the Appalachian Mountains and is surrounded by rolling hills and forests. The city is located near several major highways, including Interstate 20, Interstate 59, and U.S. Route 11.
Economy
The economy of Irondale is largely based on the steel industry. The city is home to several steel mills, including the Irondale Steel Mill, which is the largest steel mill in the state. The city is also home to several other manufacturing companies, including a paper mill and a chemical plant.
The city is also home to several retail stores, restaurants, and other businesses. The city is home to several large employers, including the University of Alabama at Birmingham, the Birmingham-Jefferson Convention Complex, and the Birmingham-Shuttlesworth International Airport.
Demographics
As of the 2010 census, the population of Irondale was 12,349. The racial makeup of the city was 79.3% White, 16.2% African American, 0.3% Native American, 0.7% Asian, 0.1% Pacific Islander, 1.2% from other races, and 2.4% from two or more races. Hispanic or Latino of any race were 3.2% of the population.
The median income for a household in the city was $37,917, and the median income for a family was $45,945. The per capita income for the city was $20,945. About 11.2% of families and 14.2% of the population were below the poverty line, including 19.2% of those under age 18 and 8.2% of those age 65 or over.
Common Questions
What is Per Capita Income in Irondale?
Per Capita income in Irondale is $43,501.
What is the Median Family Income in Irondale?
Median Family Income in Irondale is $87,500.
What is the Median Household income in Irondale?
Median Household Income in Irondale is $68,869.
What is Income or Wage Gap in Irondale?
Income or Wage Gap in Irondale is 29.9%.
Women in Irondale earn 70.1 cents for every dollar earned by a man.
What is Inequality or Gini Index in Irondale?
Inequality or Gini Index in Irondale is 0.46.
What is the Total Population of Irondale?
Total Population of Irondale is 13,455.
What is the Total Male Population of Irondale?
Total Male Population of Irondale is 7,189.
What is the Total Female Population of Irondale?
Total Female Population of Irondale is 6,266.
What is the Ratio of Males per 100 Females in Irondale?
There are 114.73 Males per 100 Females in Irondale.
What is the Ratio of Females per 100 Males in Irondale?
There are 87.16 Females per 100 Males in Irondale.
What is the Median Population Age in Irondale?
Median Population Age in Irondale is 43.1 Years.
What is the Average Family Size in Irondale
Average Family Size in Irondale is 3.0 People.
What is the Average Household Size in Irondale
Average Household Size in Irondale is 2.1 People.
How Large is the Labor Force in Irondale?
There are 7,508 People in the Labor Forcein in Irondale.
What is the Percentage of People in the Labor Force in Irondale?
64.6% of People are in the Labor Force in Irondale.
What is the Unemployment Rate in Irondale?
Unemployment Rate in Irondale is 9.3%.