Perdido, AL Map & Demographics
Perdido Map
Perdido Overview
$37,138
PER CAPITA INCOME
$48,984
AVG FAMILY INCOME
$37,461
AVG HOUSEHOLD INCOME
0.56
INEQUALITY / GINI INDEX
621
TOTAL POPULATION
349
MALE POPULATION
272
FEMALE POPULATION
128.31
MALES / 100 FEMALES
77.94
FEMALES / 100 MALES
52.1
MEDIAN AGE
3.2
AVG FAMILY SIZE
2.5
AVG HOUSEHOLD SIZE
254
LABOR FORCE [ PEOPLE ]
48.4%
PERCENT IN LABOR FORCE
5.9%
UNEMPLOYMENT RATE
Perdido Zip Codes
Perdido Area Codes
Income in Perdido
Income Overview in Perdido
Per Capita Income in Perdido is $37,138, while median incomes of families and households are $48,984 and $37,461 respectively.
| Characteristic | Number | Measure |
| Per Capita Income | 621 | $37,138 |
| Median Family Income | 153 | $48,984 |
| Mean Family Income | 153 | $66,530 |
| Median Household Income | 245 | $37,461 |
| Mean Household Income | 245 | $85,015 |
| Income Deficit | 153 | $0 |
| Wage / Income Gap (%) | 621 | 0.00% |
| Wage / Income Gap ($) | 621 | 100.00¢ per $1 |
| Gini / Inequality Index | 621 | 0.56 |
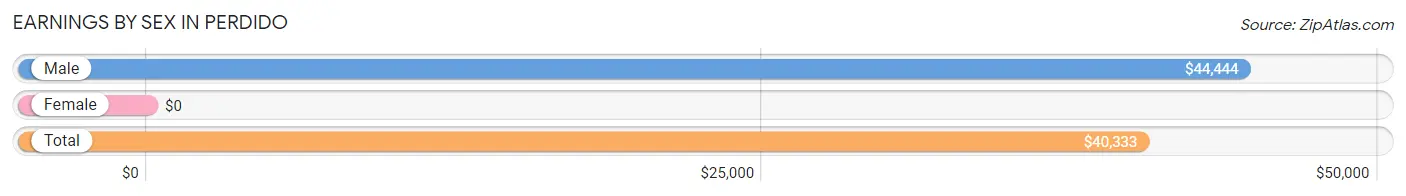
Earnings by Sex in Perdido
| Sex | Number | Average Earnings |
| Male | 160 (59.3%) | $44,444 |
| Female | 110 (40.7%) | $0 |
| Total | 270 (100.0%) | $40,333 |
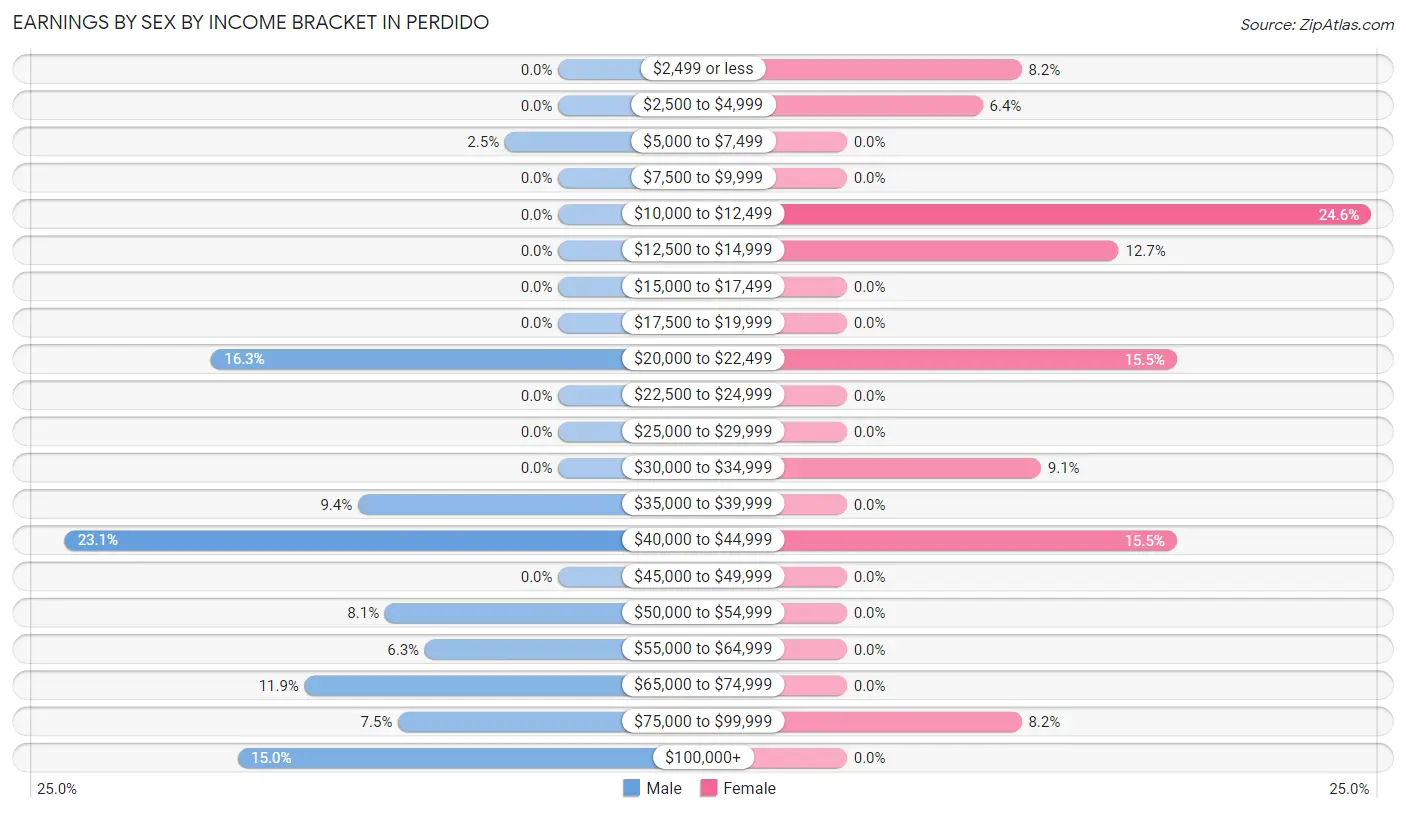
Earnings by Sex by Income Bracket in Perdido
The most common earnings brackets in Perdido are $40,000 to $44,999 for men (37 | 23.1%) and $10,000 to $12,499 for women (27 | 24.5%).
| Income | Male | Female |
| $2,499 or less | 0 (0.0%) | 9 (8.2%) |
| $2,500 to $4,999 | 0 (0.0%) | 7 (6.4%) |
| $5,000 to $7,499 | 4 (2.5%) | 0 (0.0%) |
| $7,500 to $9,999 | 0 (0.0%) | 0 (0.0%) |
| $10,000 to $12,499 | 0 (0.0%) | 27 (24.5%) |
| $12,500 to $14,999 | 0 (0.0%) | 14 (12.7%) |
| $15,000 to $17,499 | 0 (0.0%) | 0 (0.0%) |
| $17,500 to $19,999 | 0 (0.0%) | 0 (0.0%) |
| $20,000 to $22,499 | 26 (16.3%) | 17 (15.4%) |
| $22,500 to $24,999 | 0 (0.0%) | 0 (0.0%) |
| $25,000 to $29,999 | 0 (0.0%) | 0 (0.0%) |
| $30,000 to $34,999 | 0 (0.0%) | 10 (9.1%) |
| $35,000 to $39,999 | 15 (9.4%) | 0 (0.0%) |
| $40,000 to $44,999 | 37 (23.1%) | 17 (15.4%) |
| $45,000 to $49,999 | 0 (0.0%) | 0 (0.0%) |
| $50,000 to $54,999 | 13 (8.1%) | 0 (0.0%) |
| $55,000 to $64,999 | 10 (6.2%) | 0 (0.0%) |
| $65,000 to $74,999 | 19 (11.9%) | 0 (0.0%) |
| $75,000 to $99,999 | 12 (7.5%) | 9 (8.2%) |
| $100,000+ | 24 (15.0%) | 0 (0.0%) |
| Total | 160 (100.0%) | 110 (100.0%) |
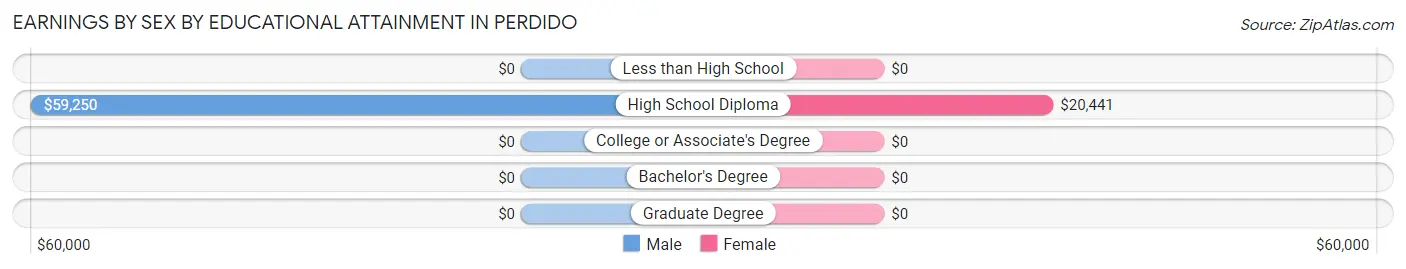
Earnings by Sex by Educational Attainment in Perdido
Average earnings in Perdido are $44,444 for men and $21,691 for women, a difference of 51.2%. Men with an educational attainment of high school diploma enjoy the highest average annual earnings of $59,250, while those with high school diploma education earn the least with $59,250. Women with an educational attainment of high school diploma earn the most with the average annual earnings of $20,441, while those with high school diploma education have the smallest earnings of $20,441.
| Educational Attainment | Male Income | Female Income |
| Less than High School | - | - |
| High School Diploma | $59,250 | $20,441 |
| College or Associate's Degree | - | - |
| Bachelor's Degree | - | - |
| Graduate Degree | - | - |
| Total | $44,444 | $21,691 |
Family Income in Perdido
Family Income Brackets in Perdido
According to the Perdido family income data, there are 51 families falling into the $25,000 to $34,999 income range, which is the most common income bracket and makes up 33.3% of all families.
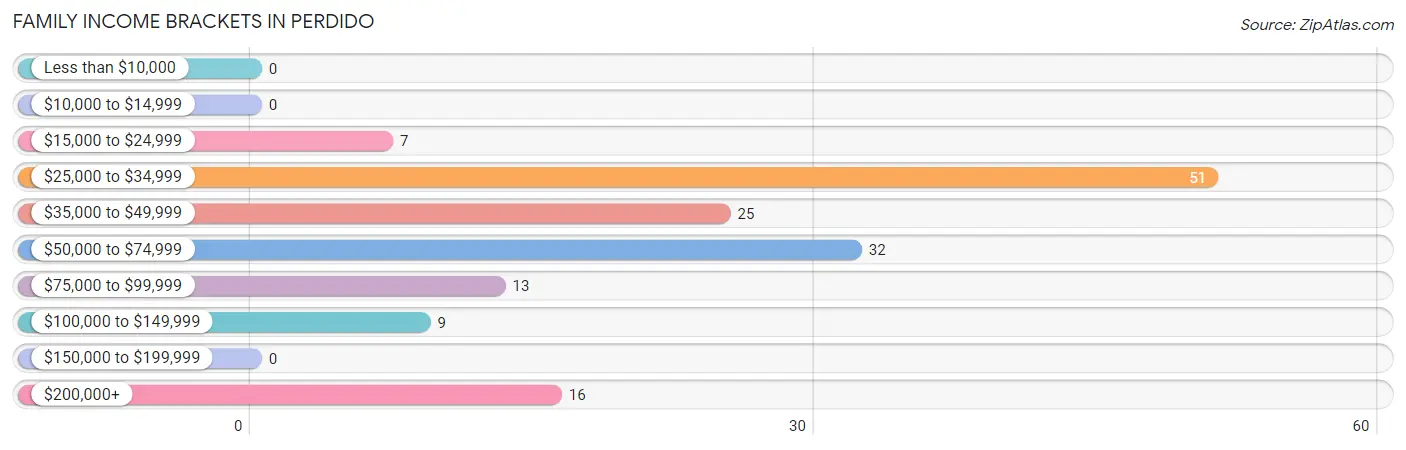
| Income Bracket | # Families | % Families |
| Less than $10,000 | 0 | 0.0% |
| $10,000 to $14,999 | 0 | 0.0% |
| $15,000 to $24,999 | 7 | 4.6% |
| $25,000 to $34,999 | 51 | 33.3% |
| $35,000 to $49,999 | 25 | 16.3% |
| $50,000 to $74,999 | 32 | 20.9% |
| $75,000 to $99,999 | 13 | 8.5% |
| $100,000 to $149,999 | 9 | 5.9% |
| $150,000 to $199,999 | 0 | 0.0% |
| $200,000+ | 16 | 10.5% |
Family Income by Famaliy Size in Perdido
2-person families (95 | 62.1%) account for the highest median family income in Perdido with $29,028 per family, while 2-person families (95 | 62.1%) have the highest median income of $14,514 per family member.
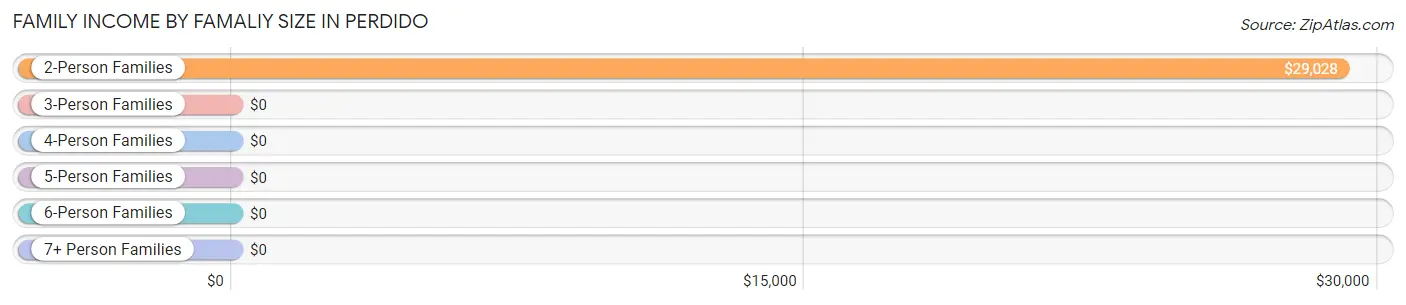
| Income Bracket | # Families | Median Income |
| 2-Person Families | 95 (62.1%) | $29,028 |
| 3-Person Families | 16 (10.5%) | $0 |
| 4-Person Families | 13 (8.5%) | $0 |
| 5-Person Families | 13 (8.5%) | $0 |
| 6-Person Families | 16 (10.5%) | $0 |
| 7+ Person Families | 0 (0.0%) | $0 |
| Total | 153 (100.0%) | $48,984 |
Family Income by Number of Earners in Perdido
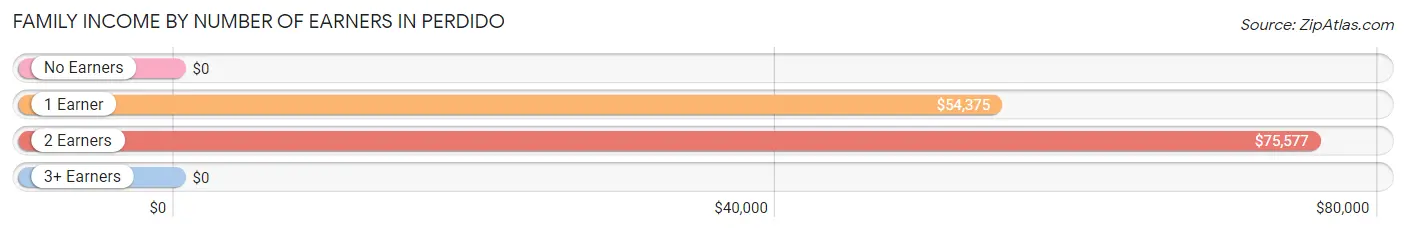
| Number of Earners | # Families | Median Income |
| No Earners | 41 (26.8%) | $0 |
| 1 Earner | 58 (37.9%) | $54,375 |
| 2 Earners | 38 (24.8%) | $75,577 |
| 3+ Earners | 16 (10.5%) | $0 |
| Total | 153 (100.0%) | $48,984 |
Household Income in Perdido
Household Income Brackets in Perdido
With 57 households falling in the category, the $35,000 to $49,999 income range is the most frequent in Perdido, accounting for 23.3% of all households.
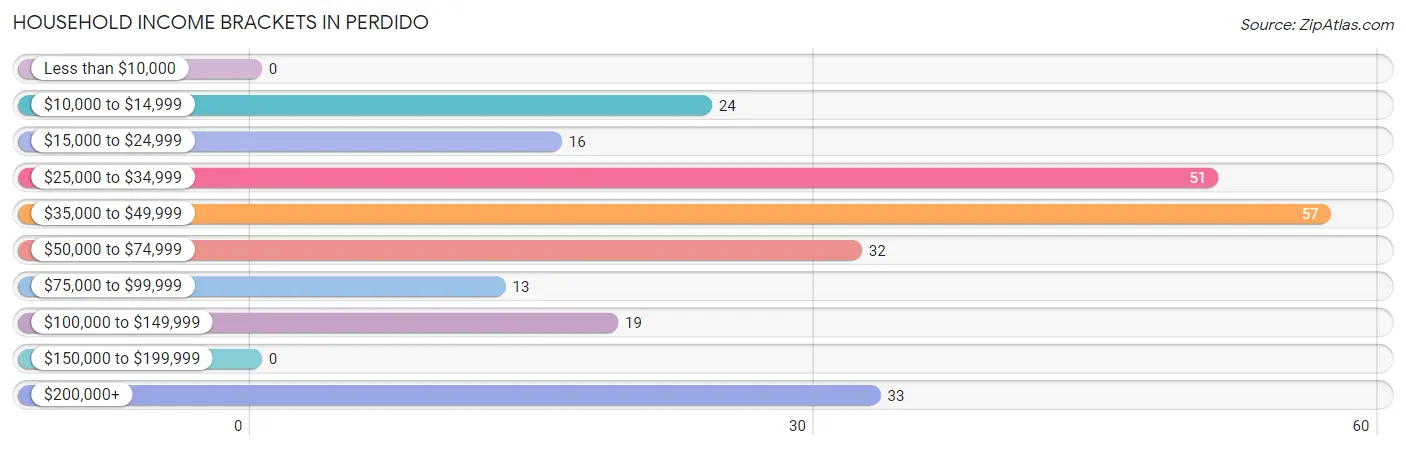
| Income Bracket | # Households | % Households |
| Less than $10,000 | 0 | 0.0% |
| $10,000 to $14,999 | 24 | 9.8% |
| $15,000 to $24,999 | 16 | 6.5% |
| $25,000 to $34,999 | 51 | 20.8% |
| $35,000 to $49,999 | 57 | 23.3% |
| $50,000 to $74,999 | 32 | 13.1% |
| $75,000 to $99,999 | 13 | 5.3% |
| $100,000 to $149,999 | 19 | 7.8% |
| $150,000 to $199,999 | 0 | 0.0% |
| $200,000+ | 33 | 13.5% |
Household Income by Householder Age in Perdido
The median household income in Perdido is $37,461, with the highest median household income of $75,673 found in the 25 to 44 years age bracket for the primary householder. A total of 57 households (23.3%) fall into this category.
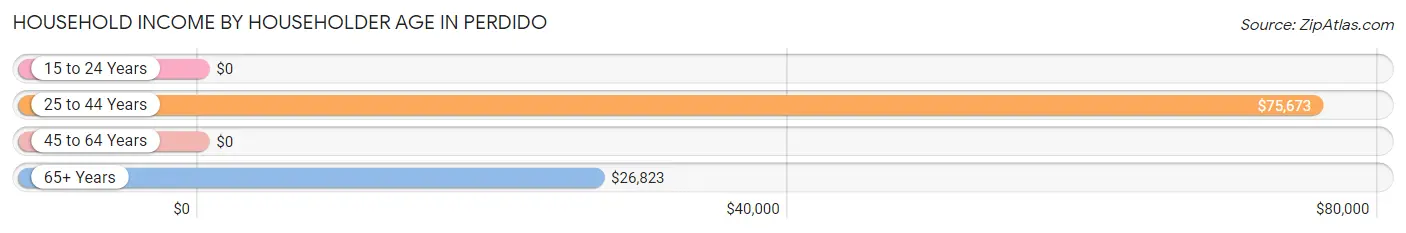
| Income Bracket | # Households | Median Income |
| 15 to 24 Years | 0 (0.0%) | $0 |
| 25 to 44 Years | 57 (23.3%) | $75,673 |
| 45 to 64 Years | 73 (29.8%) | $0 |
| 65+ Years | 115 (46.9%) | $26,823 |
| Total | 245 (100.0%) | $37,461 |
Poverty in Perdido
Income Below Poverty by Sex and Age in Perdido
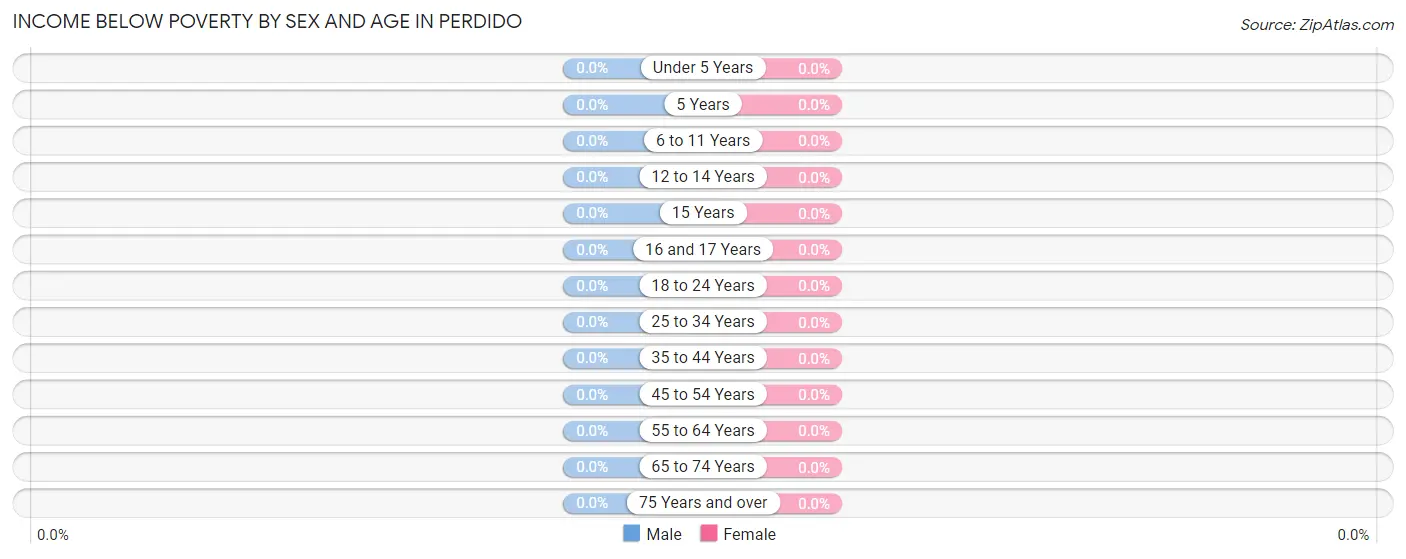
| Age Bracket | Male | Female |
| Under 5 Years | 0 (0.0%) | 0 (0.0%) |
| 5 Years | 0 (0.0%) | 0 (0.0%) |
| 6 to 11 Years | 0 (0.0%) | 0 (0.0%) |
| 12 to 14 Years | 0 (0.0%) | 0 (0.0%) |
| 15 Years | 0 (0.0%) | 0 (0.0%) |
| 16 and 17 Years | 0 (0.0%) | 0 (0.0%) |
| 18 to 24 Years | 0 (0.0%) | 0 (0.0%) |
| 25 to 34 Years | 0 (0.0%) | 0 (0.0%) |
| 35 to 44 Years | 0 (0.0%) | 0 (0.0%) |
| 45 to 54 Years | 0 (0.0%) | 0 (0.0%) |
| 55 to 64 Years | 0 (0.0%) | 0 (0.0%) |
| 65 to 74 Years | 0 (0.0%) | 0 (0.0%) |
| 75 Years and over | 0 (0.0%) | 0 (0.0%) |
| Total | 0 (0.0%) | 0 (0.0%) |
Income Above Poverty by Sex and Age in Perdido
According to the poverty statistics in Perdido, males aged 5 years and females aged 5 years are the age groups that are most secure financially, with 100.0% of males and 100.0% of females in these age groups living above the poverty line.
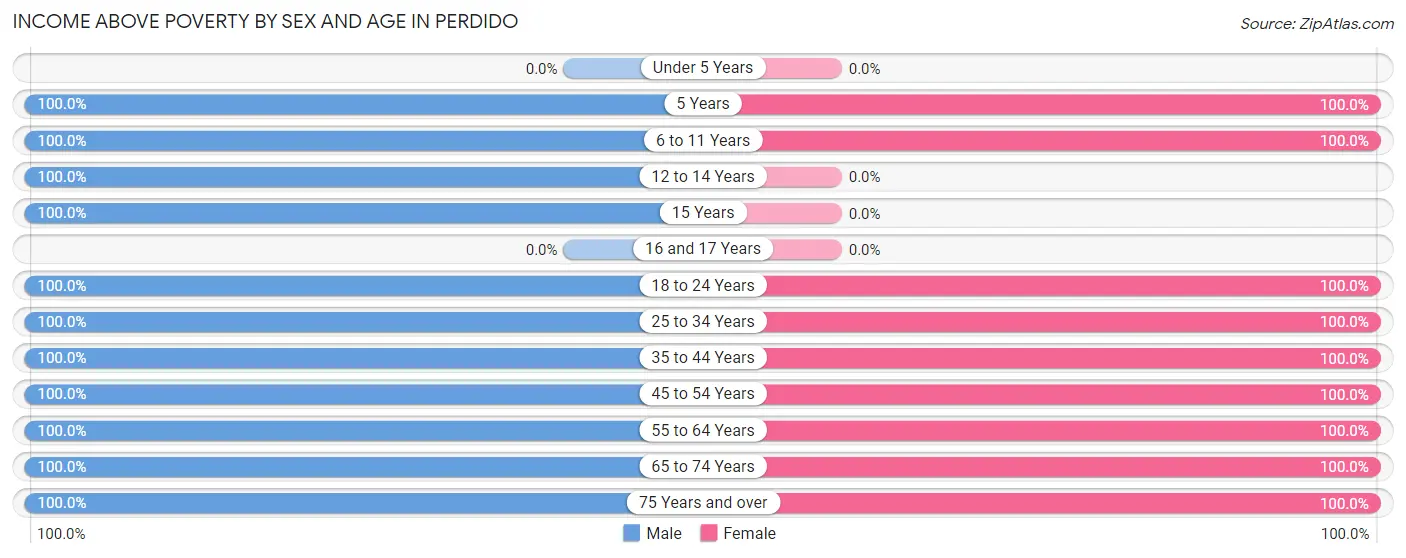
| Age Bracket | Male | Female |
| Under 5 Years | 0 (0.0%) | 0 (0.0%) |
| 5 Years | 11 (100.0%) | 7 (100.0%) |
| 6 to 11 Years | 13 (100.0%) | 45 (100.0%) |
| 12 to 14 Years | 9 (100.0%) | 0 (0.0%) |
| 15 Years | 11 (100.0%) | 0 (0.0%) |
| 16 and 17 Years | 0 (0.0%) | 0 (0.0%) |
| 18 to 24 Years | 27 (100.0%) | 27 (100.0%) |
| 25 to 34 Years | 24 (100.0%) | 17 (100.0%) |
| 35 to 44 Years | 37 (100.0%) | 35 (100.0%) |
| 45 to 54 Years | 45 (100.0%) | 17 (100.0%) |
| 55 to 64 Years | 73 (100.0%) | 39 (100.0%) |
| 65 to 74 Years | 52 (100.0%) | 36 (100.0%) |
| 75 Years and over | 47 (100.0%) | 49 (100.0%) |
| Total | 349 (100.0%) | 272 (100.0%) |
Income Below Poverty Among Married-Couple Families in Perdido
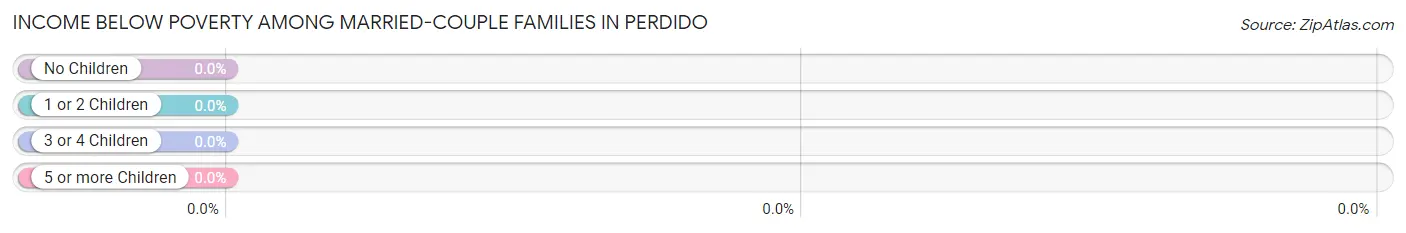
| Children | Above Poverty | Below Poverty |
| No Children | 95 (100.0%) | 0 (0.0%) |
| 1 or 2 Children | 25 (100.0%) | 0 (0.0%) |
| 3 or 4 Children | 13 (100.0%) | 0 (0.0%) |
| 5 or more Children | 0 (0.0%) | 0 (0.0%) |
| Total | 133 (100.0%) | 0 (0.0%) |
Income Below Poverty Among Single-Parent Households in Perdido
| Children | Single Father | Single Mother |
| No Children | 0 (0.0%) | 0 (0.0%) |
| 1 or 2 Children | 0 (0.0%) | 0 (0.0%) |
| 3 or 4 Children | 0 (0.0%) | 0 (0.0%) |
| 5 or more Children | 0 (0.0%) | 0 (0.0%) |
| Total | 0 (0.0%) | 0 (0.0%) |
Income Below Poverty Among Married-Couple vs Single-Parent Households in Perdido
| Children | Married-Couple Families | Single-Parent Households |
| No Children | 0 (0.0%) | 0 (0.0%) |
| 1 or 2 Children | 0 (0.0%) | 0 (0.0%) |
| 3 or 4 Children | 0 (0.0%) | 0 (0.0%) |
| 5 or more Children | 0 (0.0%) | 0 (0.0%) |
| Total | 0 (0.0%) | 0 (0.0%) |
Race in Perdido
The most populous races in Perdido are White / Caucasian (550 | 88.6%), Black / African American (49 | 7.9%), and Native / Alaskan (22 | 3.5%).
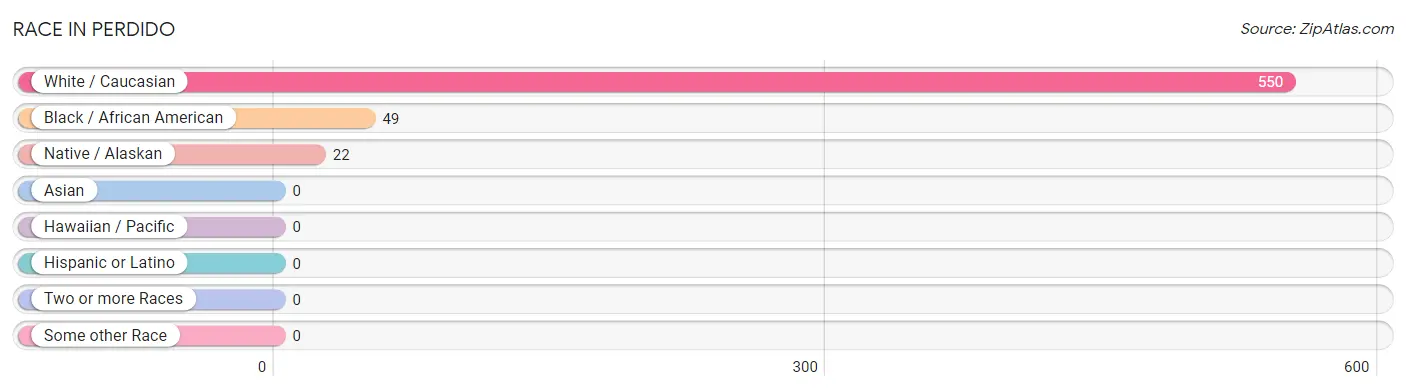
| Race | # Population | % Population |
| Asian | 0 | 0.0% |
| Black / African American | 49 | 7.9% |
| Hawaiian / Pacific | 0 | 0.0% |
| Hispanic or Latino | 0 | 0.0% |
| Native / Alaskan | 22 | 3.5% |
| White / Caucasian | 550 | 88.6% |
| Two or more Races | 0 | 0.0% |
| Some other Race | 0 | 0.0% |
| Total | 621 | 100.0% |
Ancestry in Perdido
The most populous ancestries reported in Perdido are American (176 | 28.3%), Irish (114 | 18.4%), English (98 | 15.8%), Scottish (38 | 6.1%), and German (23 | 3.7%), together accounting for 72.3% of all Perdido residents.
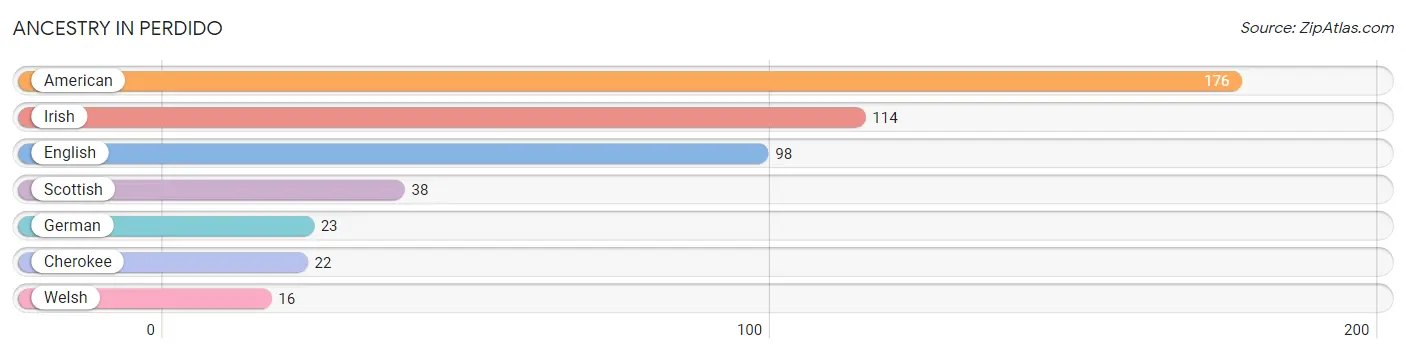
| Ancestry | # Population | % Population |
| American | 176 | 28.3% |
| Cherokee | 22 | 3.5% |
| English | 98 | 15.8% |
| German | 23 | 3.7% |
| Irish | 114 | 18.4% |
| Scottish | 38 | 6.1% |
| Welsh | 16 | 2.6% | View All 7 Rows |
Immigrants in Perdido

| Immigration Origin | # Population | % Population | View All 0 Rows |
Sex and Age in Perdido
Sex and Age in Perdido
The most populous age groups in Perdido are 55 to 59 Years (40 | 11.5%) for men and 70 to 74 Years (36 | 13.2%) for women.
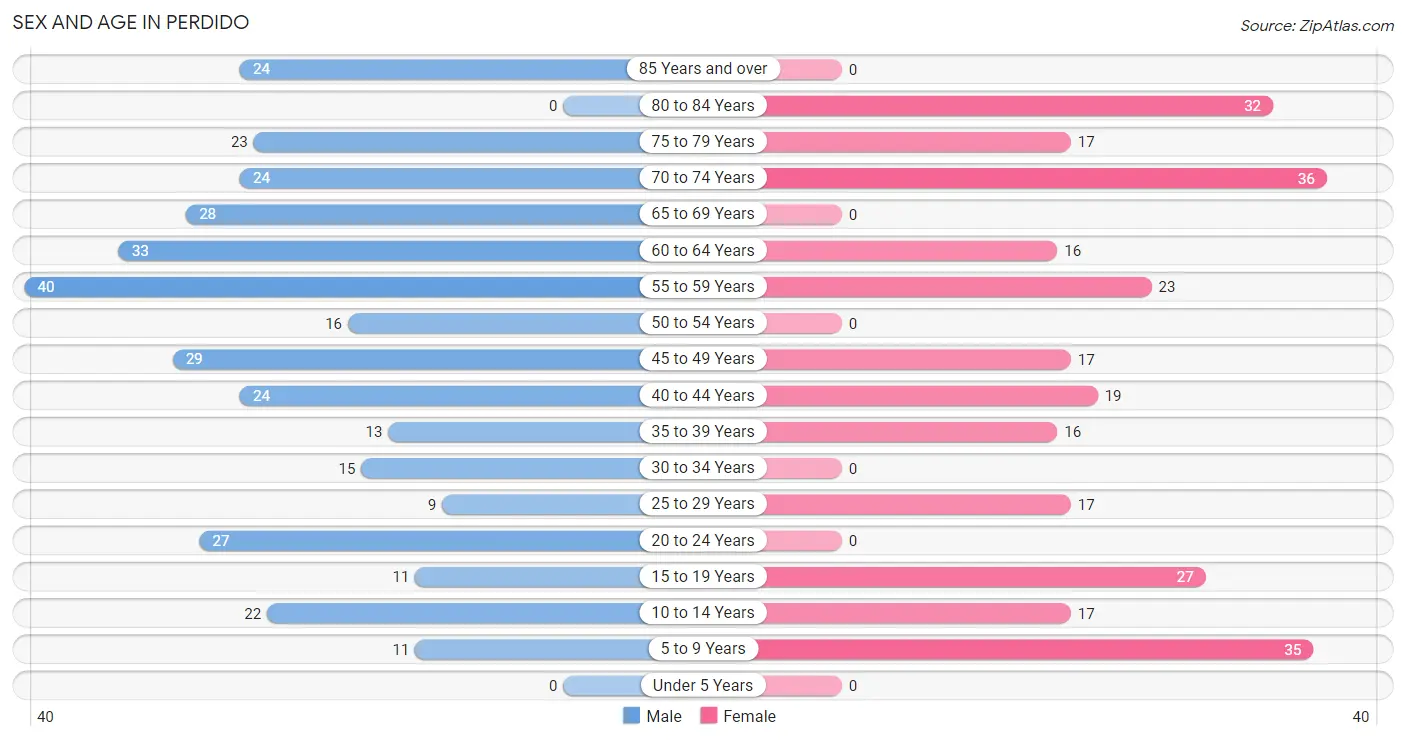
| Age Bracket | Male | Female |
| Under 5 Years | 0 (0.0%) | 0 (0.0%) |
| 5 to 9 Years | 11 (3.2%) | 35 (12.9%) |
| 10 to 14 Years | 22 (6.3%) | 17 (6.2%) |
| 15 to 19 Years | 11 (3.2%) | 27 (9.9%) |
| 20 to 24 Years | 27 (7.7%) | 0 (0.0%) |
| 25 to 29 Years | 9 (2.6%) | 17 (6.2%) |
| 30 to 34 Years | 15 (4.3%) | 0 (0.0%) |
| 35 to 39 Years | 13 (3.7%) | 16 (5.9%) |
| 40 to 44 Years | 24 (6.9%) | 19 (7.0%) |
| 45 to 49 Years | 29 (8.3%) | 17 (6.2%) |
| 50 to 54 Years | 16 (4.6%) | 0 (0.0%) |
| 55 to 59 Years | 40 (11.5%) | 23 (8.5%) |
| 60 to 64 Years | 33 (9.5%) | 16 (5.9%) |
| 65 to 69 Years | 28 (8.0%) | 0 (0.0%) |
| 70 to 74 Years | 24 (6.9%) | 36 (13.2%) |
| 75 to 79 Years | 23 (6.6%) | 17 (6.2%) |
| 80 to 84 Years | 0 (0.0%) | 32 (11.8%) |
| 85 Years and over | 24 (6.9%) | 0 (0.0%) |
| Total | 349 (100.0%) | 272 (100.0%) |
Families and Households in Perdido
Median Family Size in Perdido
The median family size in Perdido is 3.25 persons per family, with single male/father families (13 | 8.5%) accounting for the largest median family size of 3.69 persons per family. On the other hand, single female/mother families (7 | 4.6%) represent the smallest median family size with 2.71 persons per family.
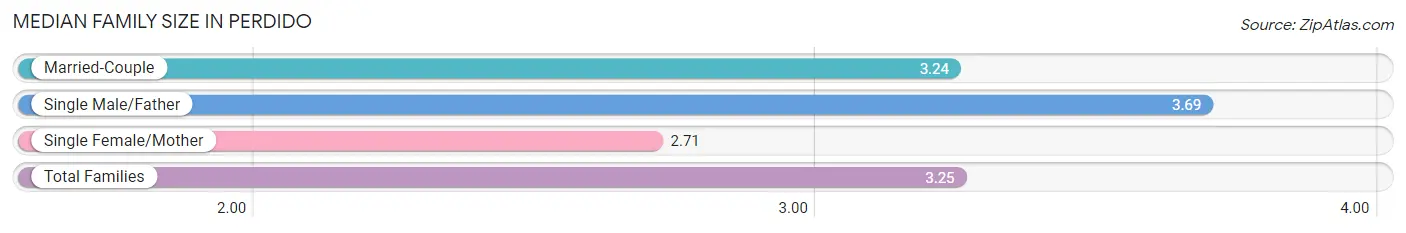
| Family Type | # Families | Family Size |
| Married-Couple | 133 (86.9%) | 3.24 |
| Single Male/Father | 13 (8.5%) | 3.69 |
| Single Female/Mother | 7 (4.6%) | 2.71 |
| Total Families | 153 (100.0%) | 3.25 |
Median Household Size in Perdido
The median household size in Perdido is 2.53 persons per household, with single male/father households (13 | 5.3%) accounting for the largest median household size of 3.69 persons per household. non-family households (92 | 37.6%) represent the smallest median household size with 1.34 persons per household.
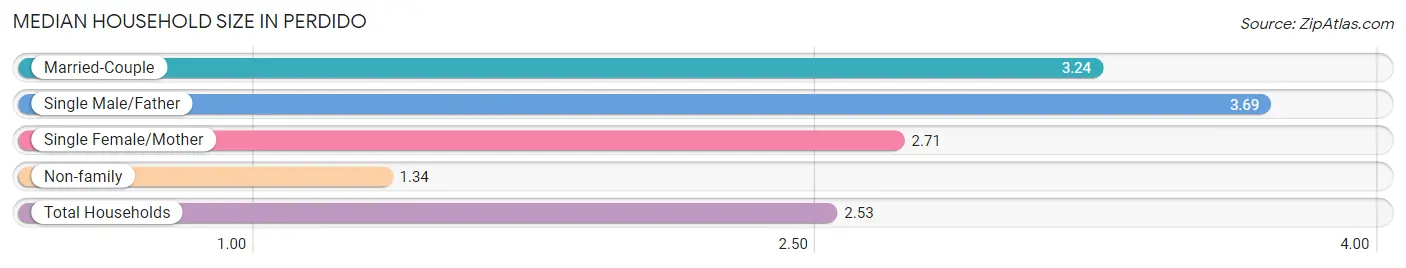
| Household Type | # Households | Household Size |
| Married-Couple | 133 (54.3%) | 3.24 |
| Single Male/Father | 13 (5.3%) | 3.69 |
| Single Female/Mother | 7 (2.9%) | 2.71 |
| Non-family | 92 (37.6%) | 1.34 |
| Total Households | 245 (100.0%) | 2.53 |
Household Size by Marriage Status in Perdido
Out of a total of 245 households in Perdido, 153 (62.5%) are family households, while 92 (37.6%) are nonfamily households. The most numerous type of family households are 2-person households, comprising 95, and the most common type of nonfamily households are 1-person households, comprising 65.
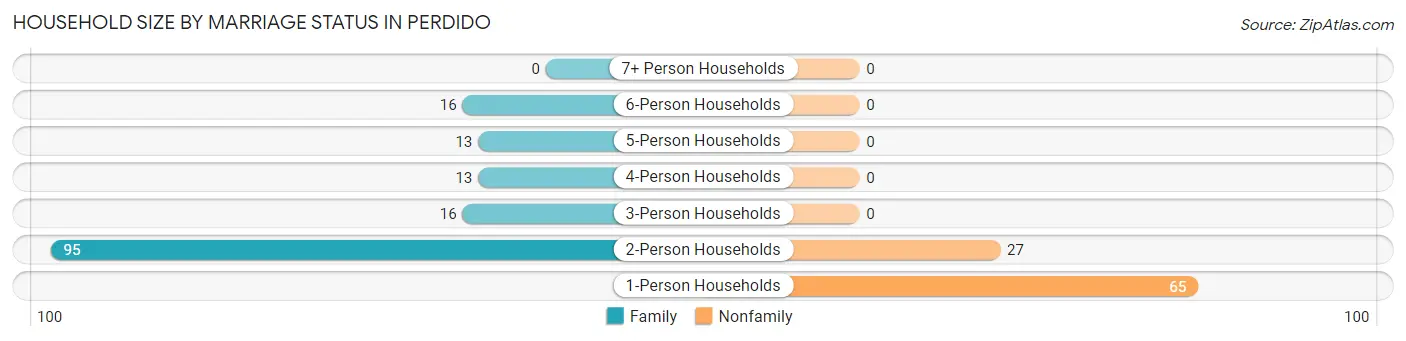
| Household Size | Family Households | Nonfamily Households |
| 1-Person Households | - | 65 (26.5%) |
| 2-Person Households | 95 (38.8%) | 27 (11.0%) |
| 3-Person Households | 16 (6.5%) | 0 (0.0%) |
| 4-Person Households | 13 (5.3%) | 0 (0.0%) |
| 5-Person Households | 13 (5.3%) | 0 (0.0%) |
| 6-Person Households | 16 (6.5%) | 0 (0.0%) |
| 7+ Person Households | 0 (0.0%) | 0 (0.0%) |
| Total | 153 (62.5%) | 92 (37.6%) |
Female Fertility in Perdido
Fertility by Age in Perdido
| Age Bracket | Women with Births | Births / 1,000 Women |
| 15 to 19 years | 0 (0.0%) | 0.0 |
| 20 to 34 years | 0 (0.0%) | 0.0 |
| 35 to 50 years | 0 (0.0%) | 0.0 |
| Total | 0 (0.0%) | 0.0 |
Fertility by Age by Marriage Status in Perdido
| Age Bracket | Married | Unmarried |
| 15 to 19 years | 0 (0.0%) | 0 (0.0%) |
| 20 to 34 years | 0 (0.0%) | 0 (0.0%) |
| 35 to 50 years | 0 (0.0%) | 0 (0.0%) |
| Total | 0 (0.0%) | 0 (0.0%) |
Fertility by Education in Perdido
| Educational Attainment | Women with Births | Births / 1,000 Women |
| Less than High School | 0 (0.0%) | 0.0 |
| High School Diploma | 0 (0.0%) | 0.0 |
| College or Associate's Degree | 0 (0.0%) | 0.0 |
| Bachelor's Degree | 0 (0.0%) | 0.0 |
| Graduate Degree | 0 (0.0%) | 0.0 |
| Total | 0 (0.0%) | 0.0 |
Fertility by Education by Marriage Status in Perdido
| Educational Attainment | Married | Unmarried |
| Less than High School | 0 (0.0%) | 0 (0.0%) |
| High School Diploma | 0 (0.0%) | 0 (0.0%) |
| College or Associate's Degree | 0 (0.0%) | 0 (0.0%) |
| Bachelor's Degree | 0 (0.0%) | 0 (0.0%) |
| Graduate Degree | 0 (0.0%) | 0 (0.0%) |
| Total | 0 (0.0%) | 0 (0.0%) |
Employment Characteristics in Perdido
Employment by Class of Employer in Perdido
Among the 239 employed individuals in Perdido, private company employees (116 | 48.5%), not-for-profit organizations (50 | 20.9%), and state government employees (40 | 16.7%) make up the most common classes of employment.
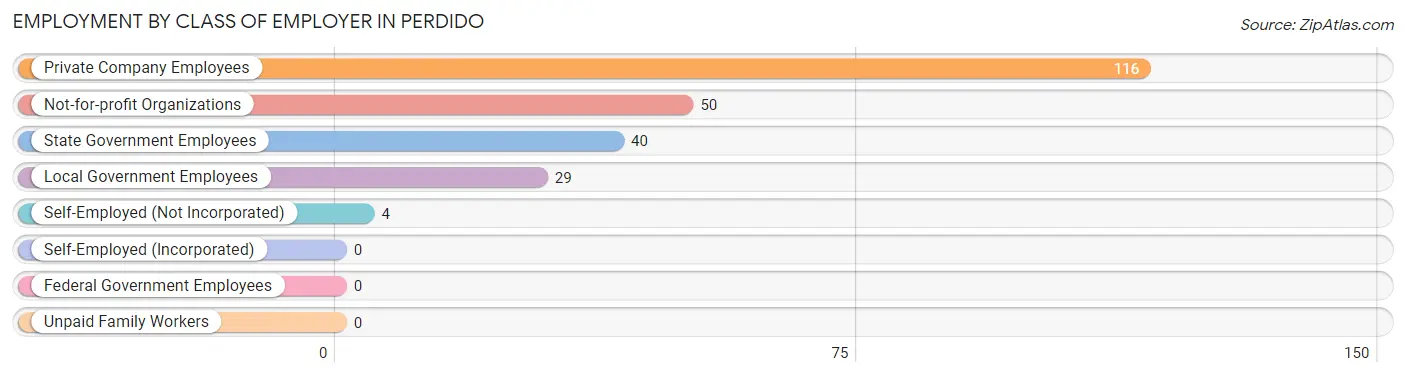
| Employer Class | # Employees | % Employees |
| Private Company Employees | 116 | 48.5% |
| Self-Employed (Incorporated) | 0 | 0.0% |
| Self-Employed (Not Incorporated) | 4 | 1.7% |
| Not-for-profit Organizations | 50 | 20.9% |
| Local Government Employees | 29 | 12.1% |
| State Government Employees | 40 | 16.7% |
| Federal Government Employees | 0 | 0.0% |
| Unpaid Family Workers | 0 | 0.0% |
| Total | 239 | 100.0% |
Employment Status by Age in Perdido
According to the labor force statistics for Perdido, out of the total population over 16 years of age (525), 48.4% or 254 individuals are in the labor force, with 5.9% or 15 of them unemployed. The age group with the highest labor force participation rate is 16 to 19 years, with 100.0% or 27 individuals in the labor force. Within the labor force, the 30 to 34 years age range has the highest percentage of unemployed individuals, with 100.0% or 15 of them being unemployed.
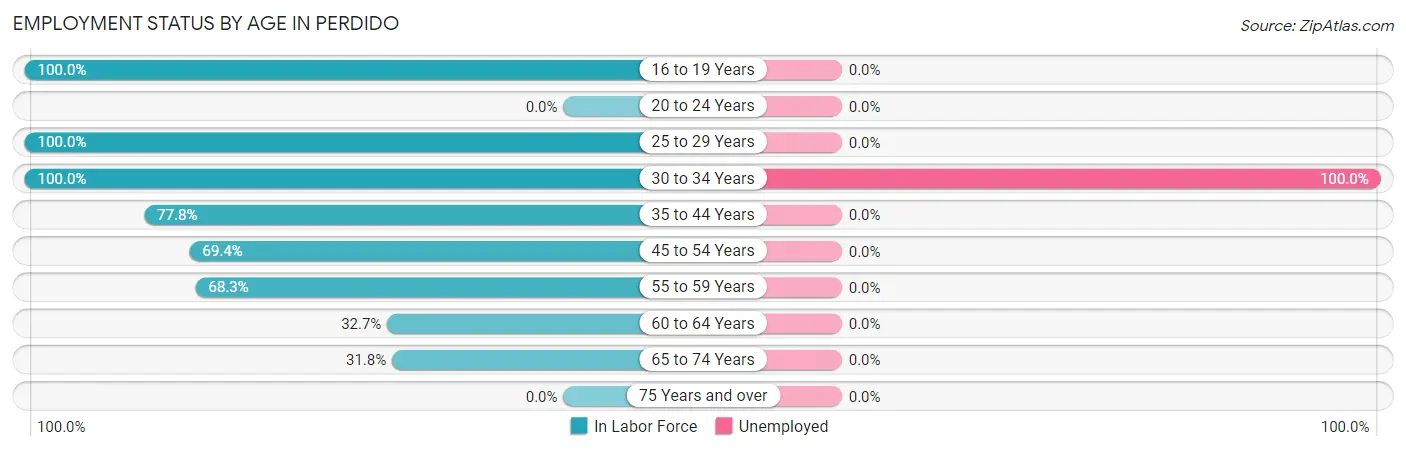
| Age Bracket | In Labor Force | Unemployed |
| 16 to 19 Years | 27 (100.0%) | 0 (0.0%) |
| 20 to 24 Years | 0 (0.0%) | 0 (0.0%) |
| 25 to 29 Years | 26 (100.0%) | 0 (0.0%) |
| 30 to 34 Years | 15 (100.0%) | 15 (100.0%) |
| 35 to 44 Years | 56 (77.8%) | 0 (0.0%) |
| 45 to 54 Years | 43 (69.4%) | 0 (0.0%) |
| 55 to 59 Years | 43 (68.3%) | 0 (0.0%) |
| 60 to 64 Years | 16 (32.7%) | 0 (0.0%) |
| 65 to 74 Years | 28 (31.8%) | 0 (0.0%) |
| 75 Years and over | 0 (0.0%) | 0 (0.0%) |
| Total | 254 (48.4%) | 15 (5.9%) |
Employment Status by Educational Attainment in Perdido
According to labor force statistics for Perdido, 69.3% of individuals (199) out of the total population between 25 and 64 years of age (287) are in the labor force, with 7.5% or 15 of them being unemployed. The group with the highest labor force participation rate are those with the educational attainment of high school diploma, with 100.0% or 109 individuals in the labor force. Within the labor force, individuals with less than high school education have the highest percentage of unemployment, with 100.0% or 15 of them being unemployed.
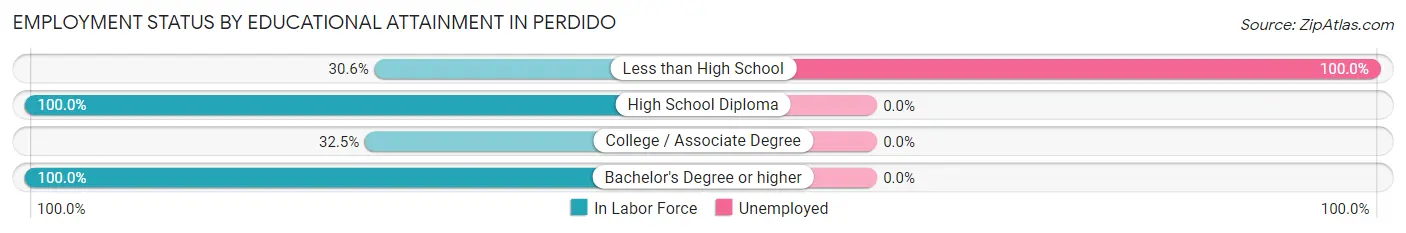
| Educational Attainment | In Labor Force | Unemployed |
| Less than High School | 15 (30.6%) | 49 (100.0%) |
| High School Diploma | 109 (100.0%) | 0 (0.0%) |
| College / Associate Degree | 26 (32.5%) | 0 (0.0%) |
| Bachelor's Degree or higher | 49 (100.0%) | 0 (0.0%) |
| Total | 199 (69.3%) | 22 (7.5%) |
Employment Occupations by Sex in Perdido
Management, Business, Science and Arts Occupations
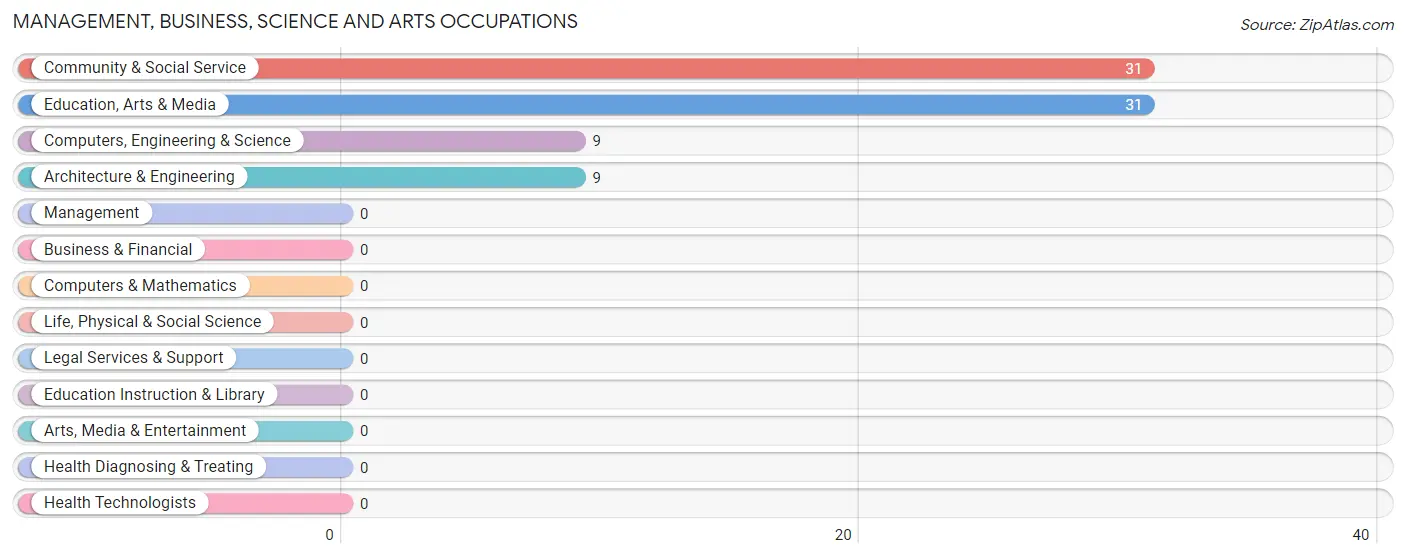
The most common Management, Business, Science and Arts occupations in Perdido are Community & Social Service (31 | 13.0%), Education, Arts & Media (31 | 13.0%), Computers, Engineering & Science (9 | 3.8%), and Architecture & Engineering (9 | 3.8%).
Management, Business, Science and Arts Occupations by Sex
Within the Management, Business, Science and Arts occupations in Perdido, the most male-oriented occupations are Computers, Engineering & Science (100.0%), and Architecture & Engineering (100.0%), while the most female-oriented occupations are Community & Social Service (100.0%), and Education, Arts & Media (100.0%).
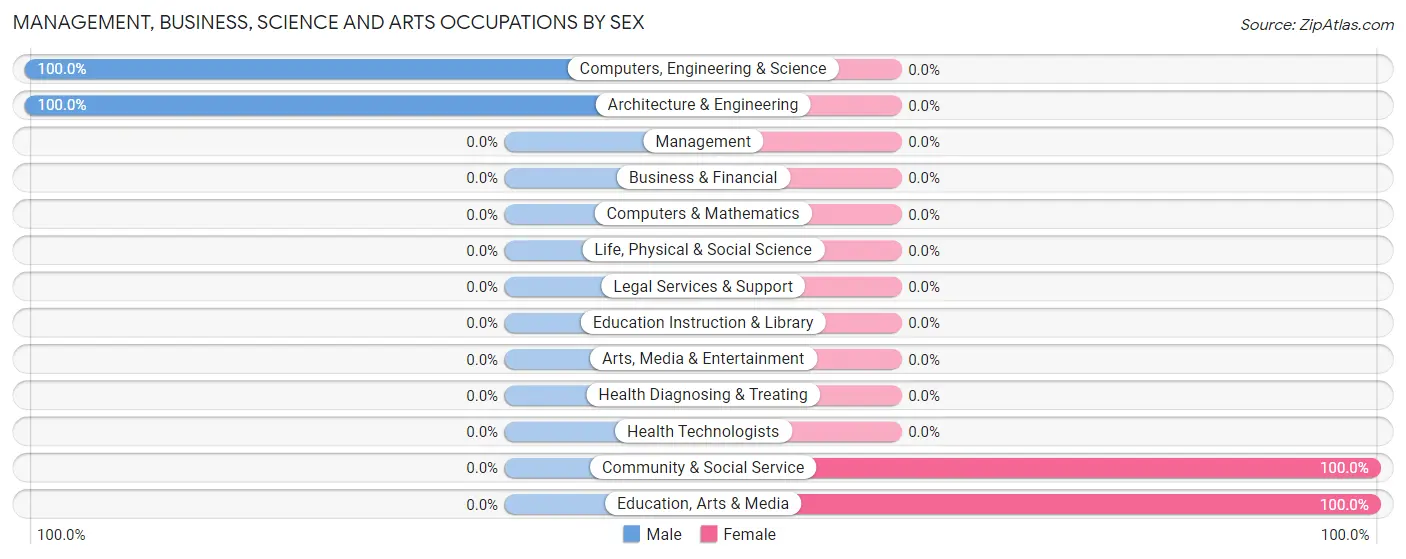
| Occupation | Male | Female |
| Management | 0 (0.0%) | 0 (0.0%) |
| Business & Financial | 0 (0.0%) | 0 (0.0%) |
| Computers, Engineering & Science | 9 (100.0%) | 0 (0.0%) |
| Computers & Mathematics | 0 (0.0%) | 0 (0.0%) |
| Architecture & Engineering | 9 (100.0%) | 0 (0.0%) |
| Life, Physical & Social Science | 0 (0.0%) | 0 (0.0%) |
| Community & Social Service | 0 (0.0%) | 31 (100.0%) |
| Education, Arts & Media | 0 (0.0%) | 31 (100.0%) |
| Legal Services & Support | 0 (0.0%) | 0 (0.0%) |
| Education Instruction & Library | 0 (0.0%) | 0 (0.0%) |
| Arts, Media & Entertainment | 0 (0.0%) | 0 (0.0%) |
| Health Diagnosing & Treating | 0 (0.0%) | 0 (0.0%) |
| Health Technologists | 0 (0.0%) | 0 (0.0%) |
| Total (Category) | 9 (22.5%) | 31 (77.5%) |
| Total (Overall) | 145 (60.7%) | 94 (39.3%) |
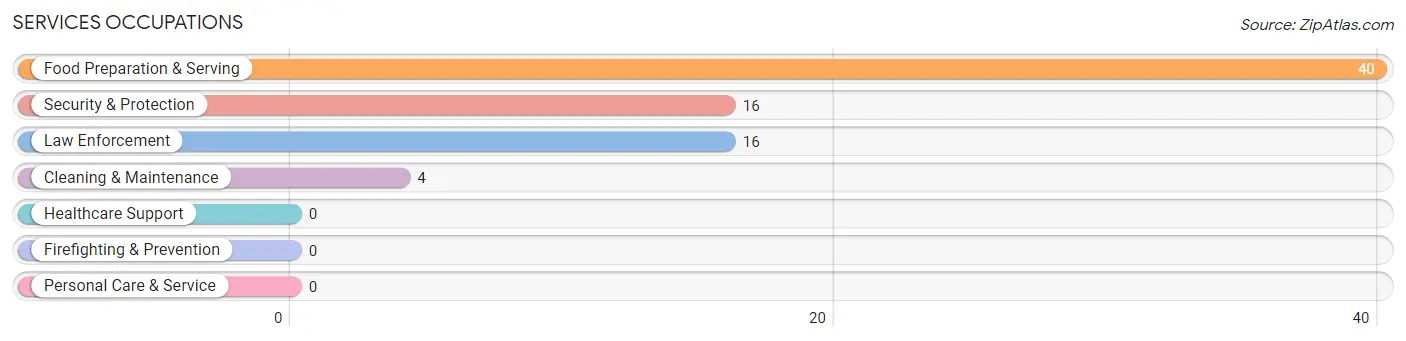
Services Occupations
The most common Services occupations in Perdido are Food Preparation & Serving (40 | 16.7%), Security & Protection (16 | 6.7%), Law Enforcement (16 | 6.7%), and Cleaning & Maintenance (4 | 1.7%).
Services Occupations by Sex
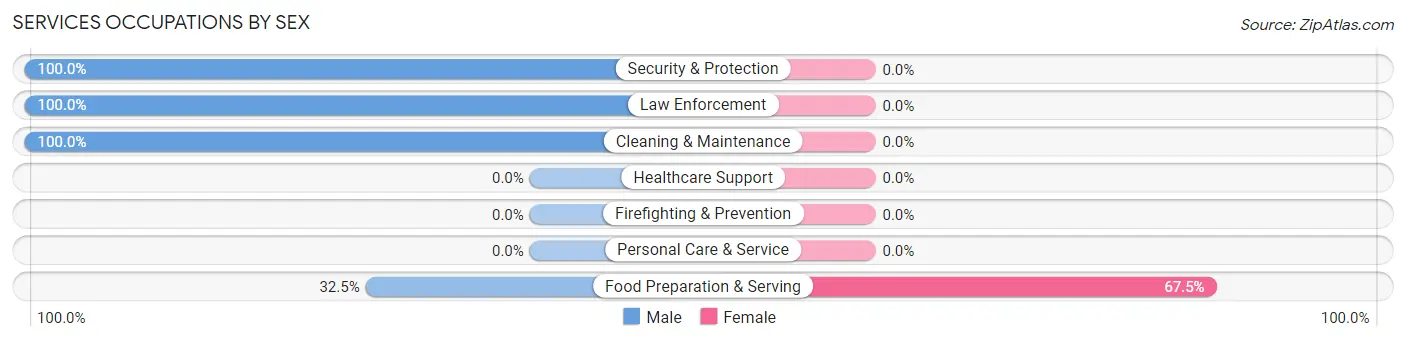
| Occupation | Male | Female |
| Healthcare Support | 0 (0.0%) | 0 (0.0%) |
| Security & Protection | 16 (100.0%) | 0 (0.0%) |
| Firefighting & Prevention | 0 (0.0%) | 0 (0.0%) |
| Law Enforcement | 16 (100.0%) | 0 (0.0%) |
| Food Preparation & Serving | 13 (32.5%) | 27 (67.5%) |
| Cleaning & Maintenance | 4 (100.0%) | 0 (0.0%) |
| Personal Care & Service | 0 (0.0%) | 0 (0.0%) |
| Total (Category) | 33 (55.0%) | 27 (45.0%) |
| Total (Overall) | 145 (60.7%) | 94 (39.3%) |
Sales and Office Occupations
The most common Sales and Office occupations in Perdido are Sales & Related (45 | 18.8%), and Office & Administration (43 | 18.0%).

Sales and Office Occupations by Sex
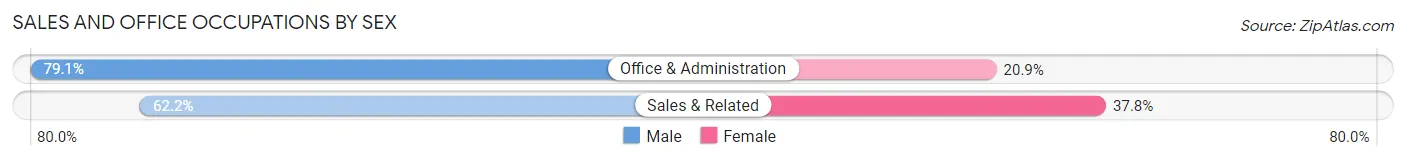
| Occupation | Male | Female |
| Sales & Related | 28 (62.2%) | 17 (37.8%) |
| Office & Administration | 34 (79.1%) | 9 (20.9%) |
| Total (Category) | 62 (70.5%) | 26 (29.5%) |
| Total (Overall) | 145 (60.7%) | 94 (39.3%) |
Natural Resources, Construction and Maintenance Occupations
The most common Natural Resources, Construction and Maintenance occupations in Perdido are Construction & Extraction (29 | 12.1%), and Installation, Maintenance & Repair (12 | 5.0%).
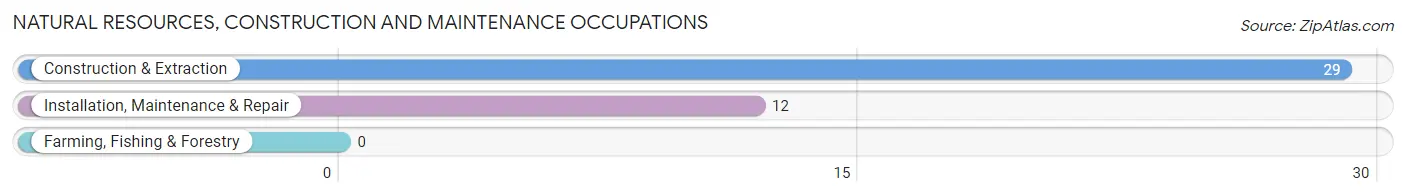
Natural Resources, Construction and Maintenance Occupations by Sex
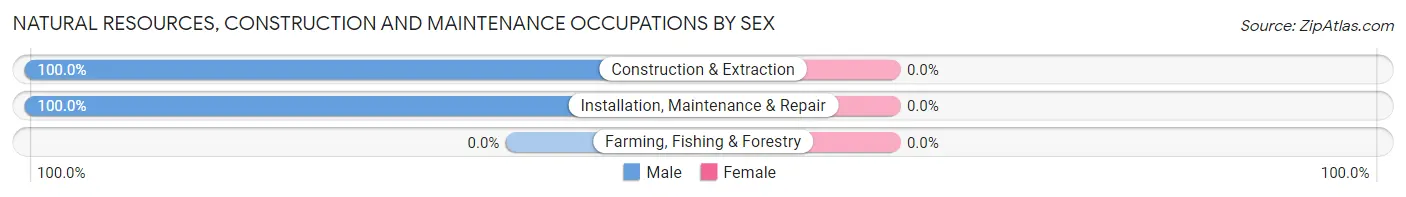
| Occupation | Male | Female |
| Farming, Fishing & Forestry | 0 (0.0%) | 0 (0.0%) |
| Construction & Extraction | 29 (100.0%) | 0 (0.0%) |
| Installation, Maintenance & Repair | 12 (100.0%) | 0 (0.0%) |
| Total (Category) | 41 (100.0%) | 0 (0.0%) |
| Total (Overall) | 145 (60.7%) | 94 (39.3%) |
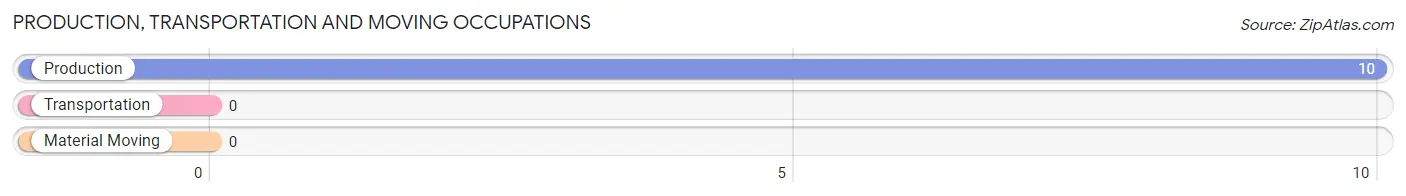
Production, Transportation and Moving Occupations
The most common Production, Transportation and Moving occupations in Perdido are , and Production (10 | 4.2%).
Production, Transportation and Moving Occupations by Sex
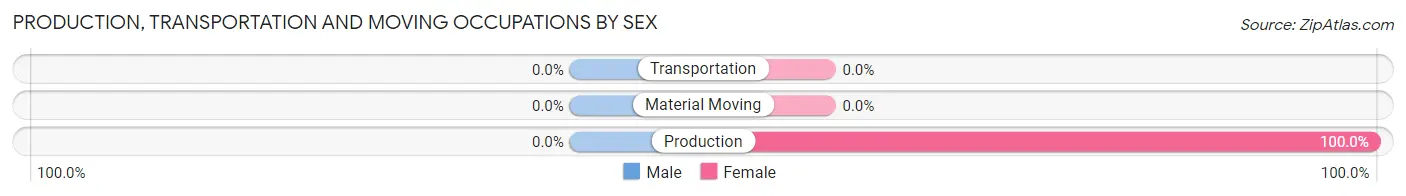
| Occupation | Male | Female |
| Production | 0 (0.0%) | 10 (100.0%) |
| Transportation | 0 (0.0%) | 0 (0.0%) |
| Material Moving | 0 (0.0%) | 0 (0.0%) |
| Total (Category) | 0 (0.0%) | 10 (100.0%) |
| Total (Overall) | 145 (60.7%) | 94 (39.3%) |
Employment Industries by Sex in Perdido
Employment Industries in Perdido
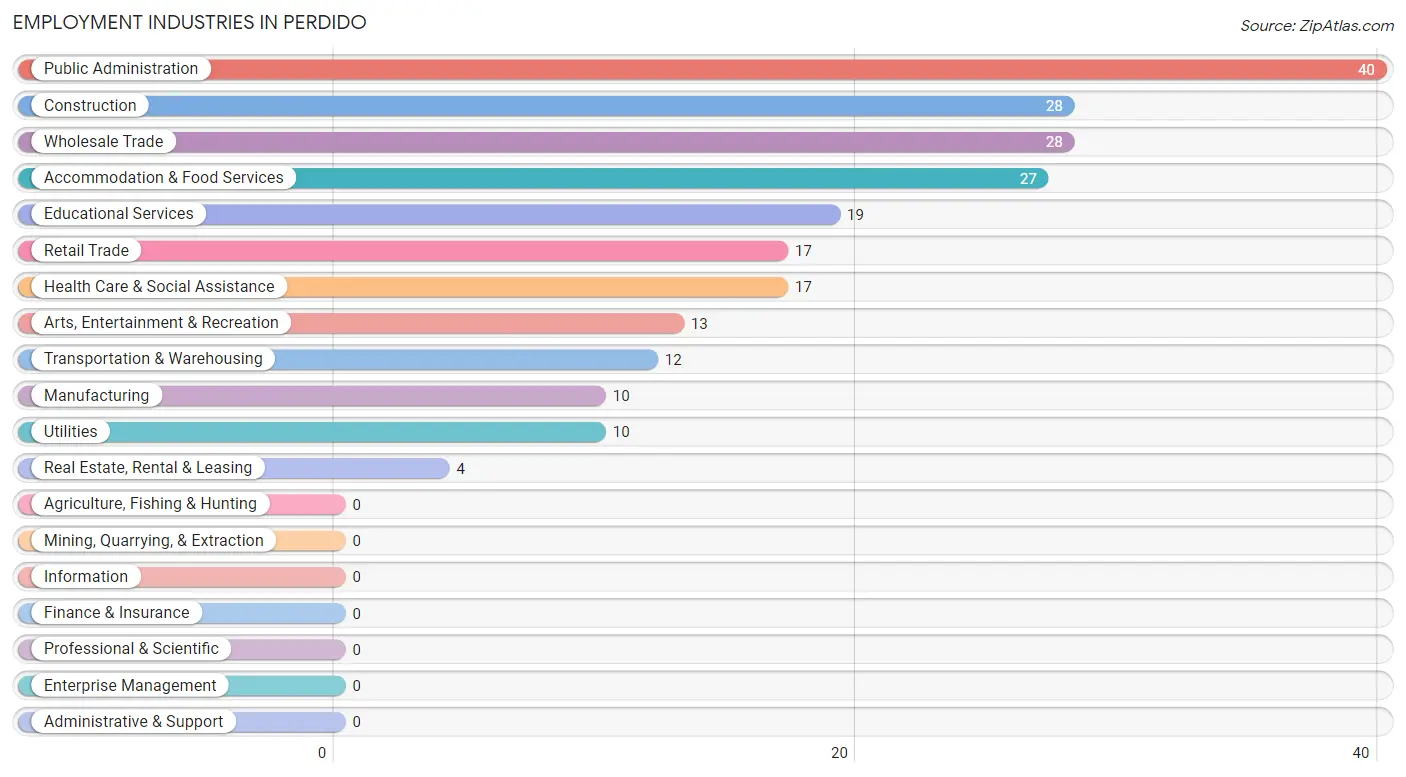
The major employment industries in Perdido include Public Administration (40 | 16.7%), Construction (28 | 11.7%), Wholesale Trade (28 | 11.7%), Accommodation & Food Services (27 | 11.3%), and Educational Services (19 | 8.0%).
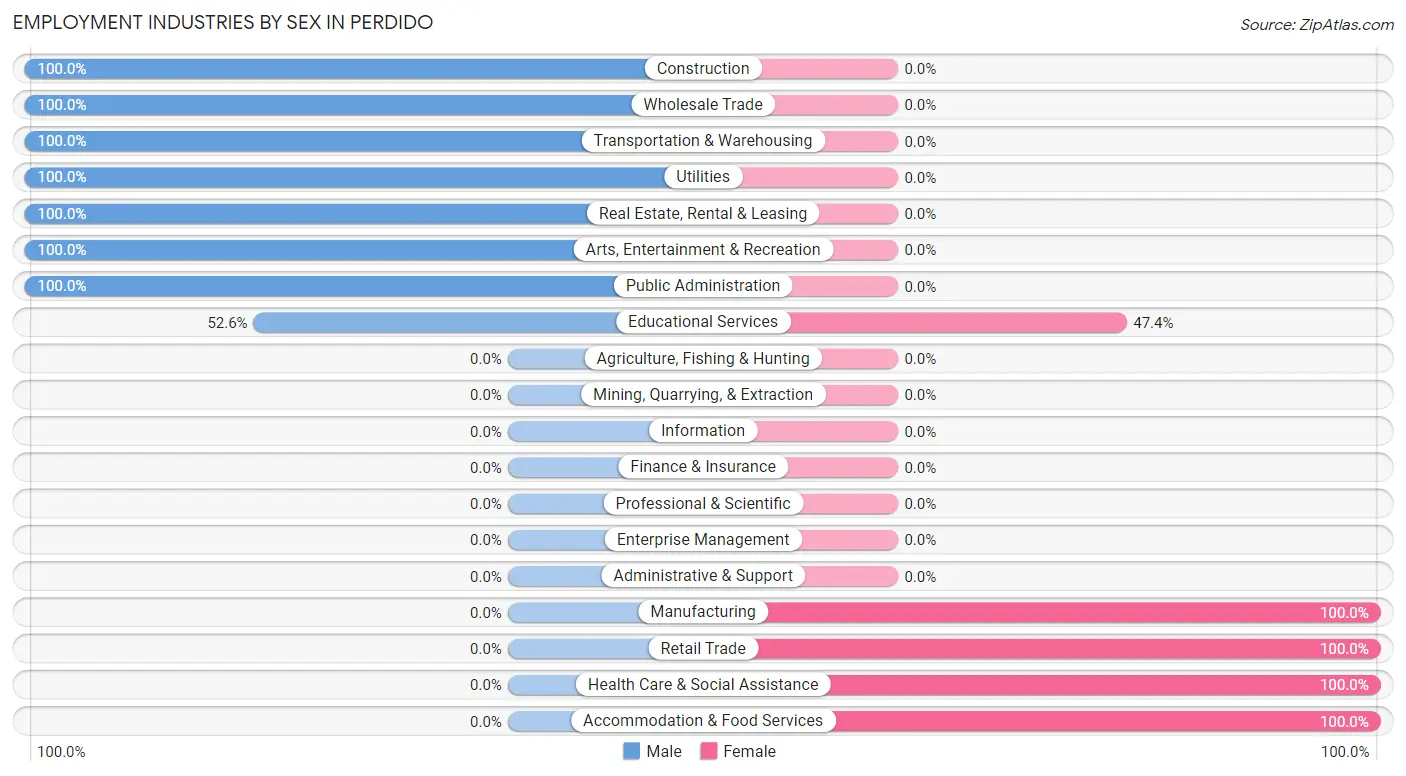
Employment Industries by Sex in Perdido
The Perdido industries that see more men than women are Construction (100.0%), Wholesale Trade (100.0%), and Transportation & Warehousing (100.0%), whereas the industries that tend to have a higher number of women are Manufacturing (100.0%), Retail Trade (100.0%), and Health Care & Social Assistance (100.0%).
| Industry | Male | Female |
| Agriculture, Fishing & Hunting | 0 (0.0%) | 0 (0.0%) |
| Mining, Quarrying, & Extraction | 0 (0.0%) | 0 (0.0%) |
| Construction | 28 (100.0%) | 0 (0.0%) |
| Manufacturing | 0 (0.0%) | 10 (100.0%) |
| Wholesale Trade | 28 (100.0%) | 0 (0.0%) |
| Retail Trade | 0 (0.0%) | 17 (100.0%) |
| Transportation & Warehousing | 12 (100.0%) | 0 (0.0%) |
| Utilities | 10 (100.0%) | 0 (0.0%) |
| Information | 0 (0.0%) | 0 (0.0%) |
| Finance & Insurance | 0 (0.0%) | 0 (0.0%) |
| Real Estate, Rental & Leasing | 4 (100.0%) | 0 (0.0%) |
| Professional & Scientific | 0 (0.0%) | 0 (0.0%) |
| Enterprise Management | 0 (0.0%) | 0 (0.0%) |
| Administrative & Support | 0 (0.0%) | 0 (0.0%) |
| Educational Services | 10 (52.6%) | 9 (47.4%) |
| Health Care & Social Assistance | 0 (0.0%) | 17 (100.0%) |
| Arts, Entertainment & Recreation | 13 (100.0%) | 0 (0.0%) |
| Accommodation & Food Services | 0 (0.0%) | 27 (100.0%) |
| Public Administration | 40 (100.0%) | 0 (0.0%) |
| Total | 145 (60.7%) | 94 (39.3%) |
Education in Perdido
School Enrollment in Perdido
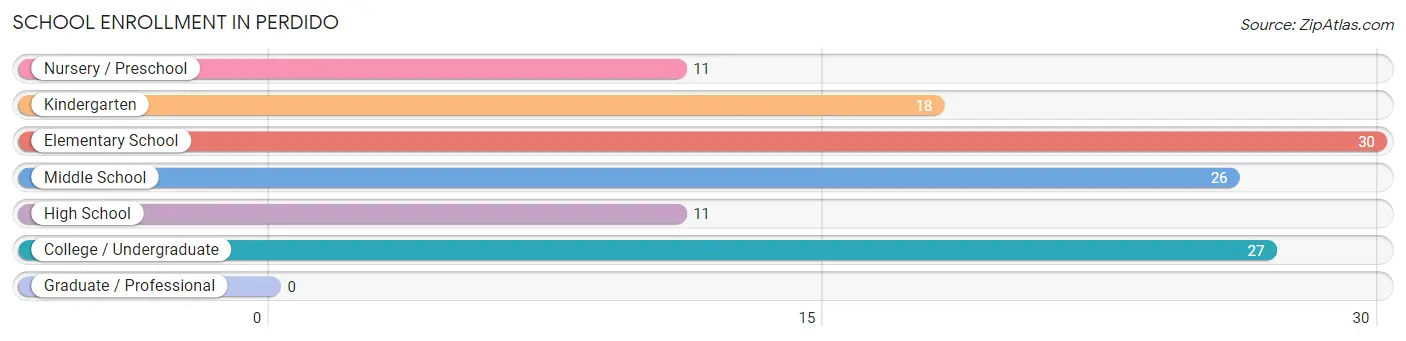
The most common levels of schooling among the 123 students in Perdido are elementary school (30 | 24.4%), college / undergraduate (27 | 22.0%), and middle school (26 | 21.1%).
| School Level | # Students | % Students |
| Nursery / Preschool | 11 | 8.9% |
| Kindergarten | 18 | 14.6% |
| Elementary School | 30 | 24.4% |
| Middle School | 26 | 21.1% |
| High School | 11 | 8.9% |
| College / Undergraduate | 27 | 22.0% |
| Graduate / Professional | 0 | 0.0% |
| Total | 123 | 100.0% |
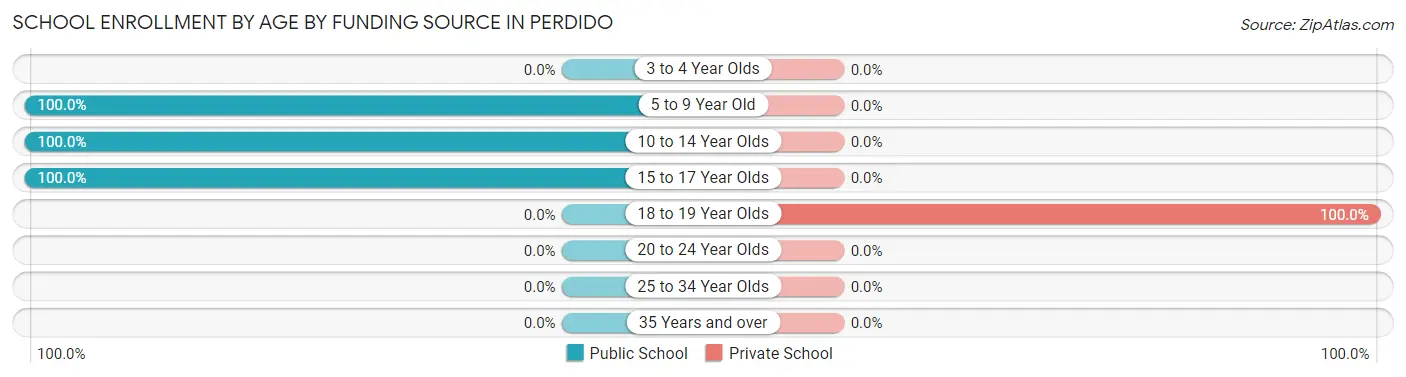
School Enrollment by Age by Funding Source in Perdido
Out of a total of 123 students who are enrolled in schools in Perdido, 27 (22.0%) attend a private institution, while the remaining 96 (78.0%) are enrolled in public schools. The age group of 18 to 19 year olds has the highest likelihood of being enrolled in private schools, with 27 (100.0% in the age bracket) enrolled. Conversely, the age group of 5 to 9 year old has the lowest likelihood of being enrolled in a private school, with 46 (100.0% in the age bracket) attending a public institution.
| Age Bracket | Public School | Private School |
| 3 to 4 Year Olds | 0 (0.0%) | 0 (0.0%) |
| 5 to 9 Year Old | 46 (100.0%) | 0 (0.0%) |
| 10 to 14 Year Olds | 39 (100.0%) | 0 (0.0%) |
| 15 to 17 Year Olds | 11 (100.0%) | 0 (0.0%) |
| 18 to 19 Year Olds | 0 (0.0%) | 27 (100.0%) |
| 20 to 24 Year Olds | 0 (0.0%) | 0 (0.0%) |
| 25 to 34 Year Olds | 0 (0.0%) | 0 (0.0%) |
| 35 Years and over | 0 (0.0%) | 0 (0.0%) |
| Total | 96 (78.0%) | 27 (22.0%) |
Educational Attainment by Field of Study in Perdido
Arts & humanities (40 | 38.1%), social sciences (28 | 26.7%), liberal arts & history (28 | 26.7%), and business (9 | 8.6%) are the most common fields of study among 105 individuals in Perdido who have obtained a bachelor's degree or higher.
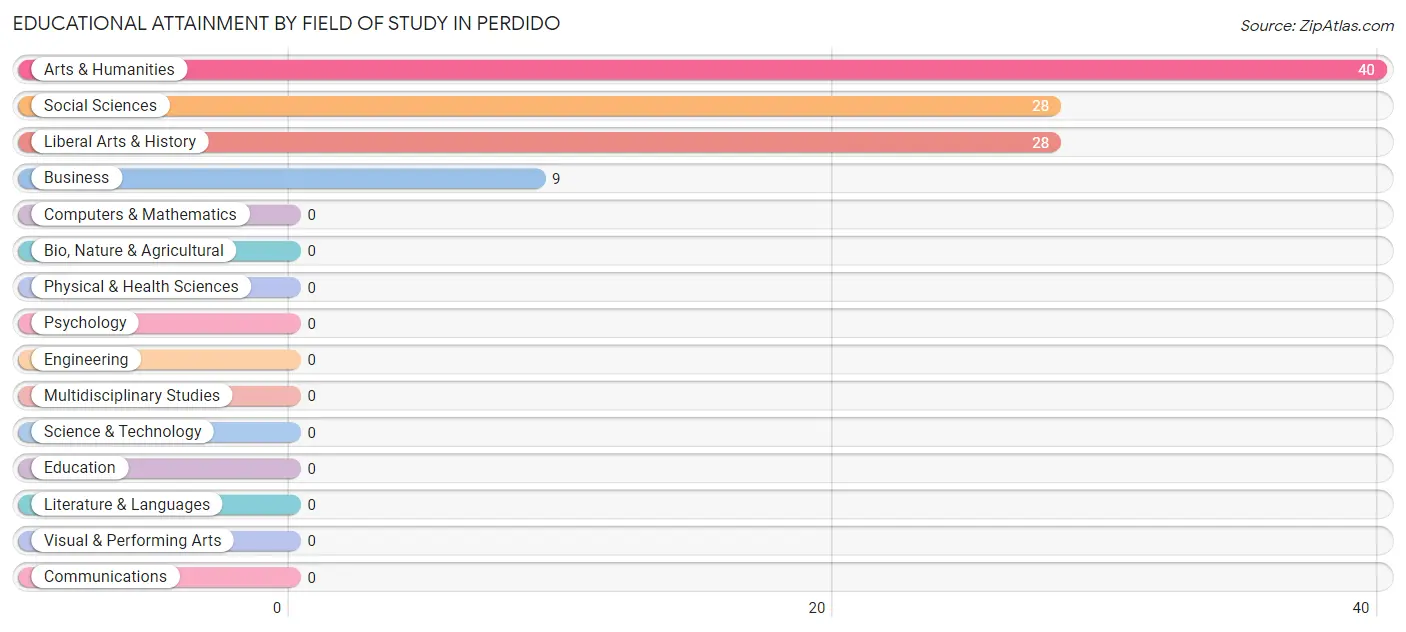
| Field of Study | # Graduates | % Graduates |
| Computers & Mathematics | 0 | 0.0% |
| Bio, Nature & Agricultural | 0 | 0.0% |
| Physical & Health Sciences | 0 | 0.0% |
| Psychology | 0 | 0.0% |
| Social Sciences | 28 | 26.7% |
| Engineering | 0 | 0.0% |
| Multidisciplinary Studies | 0 | 0.0% |
| Science & Technology | 0 | 0.0% |
| Business | 9 | 8.6% |
| Education | 0 | 0.0% |
| Literature & Languages | 0 | 0.0% |
| Liberal Arts & History | 28 | 26.7% |
| Visual & Performing Arts | 0 | 0.0% |
| Communications | 0 | 0.0% |
| Arts & Humanities | 40 | 38.1% |
| Total | 105 | 100.0% |
Transportation & Commute in Perdido
Vehicle Availability by Sex in Perdido
The most prevalent vehicle ownership categories in Perdido are males with 2 vehicles (66, accounting for 45.5%) and females with 2 vehicles (17, making up 70.2%).
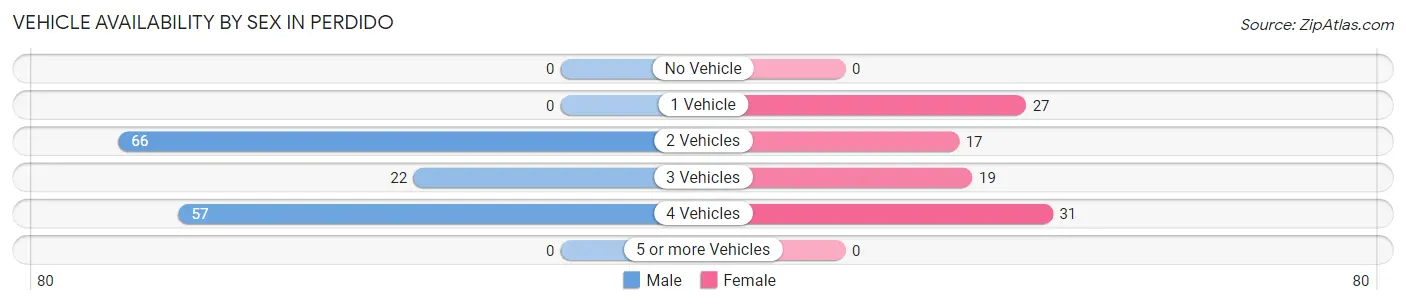
| Vehicles Available | Male | Female |
| No Vehicle | 0 (0.0%) | 0 (0.0%) |
| 1 Vehicle | 0 (0.0%) | 27 (28.7%) |
| 2 Vehicles | 66 (45.5%) | 17 (18.1%) |
| 3 Vehicles | 22 (15.2%) | 19 (20.2%) |
| 4 Vehicles | 57 (39.3%) | 31 (33.0%) |
| 5 or more Vehicles | 0 (0.0%) | 0 (0.0%) |
| Total | 145 (100.0%) | 94 (100.0%) |
Commute Time in Perdido
The most frequently occuring commute durations in Perdido are 20 to 24 minutes (56 commuters, 26.5%), 25 to 29 minutes (52 commuters, 24.6%), and 15 to 19 minutes (33 commuters, 15.6%).
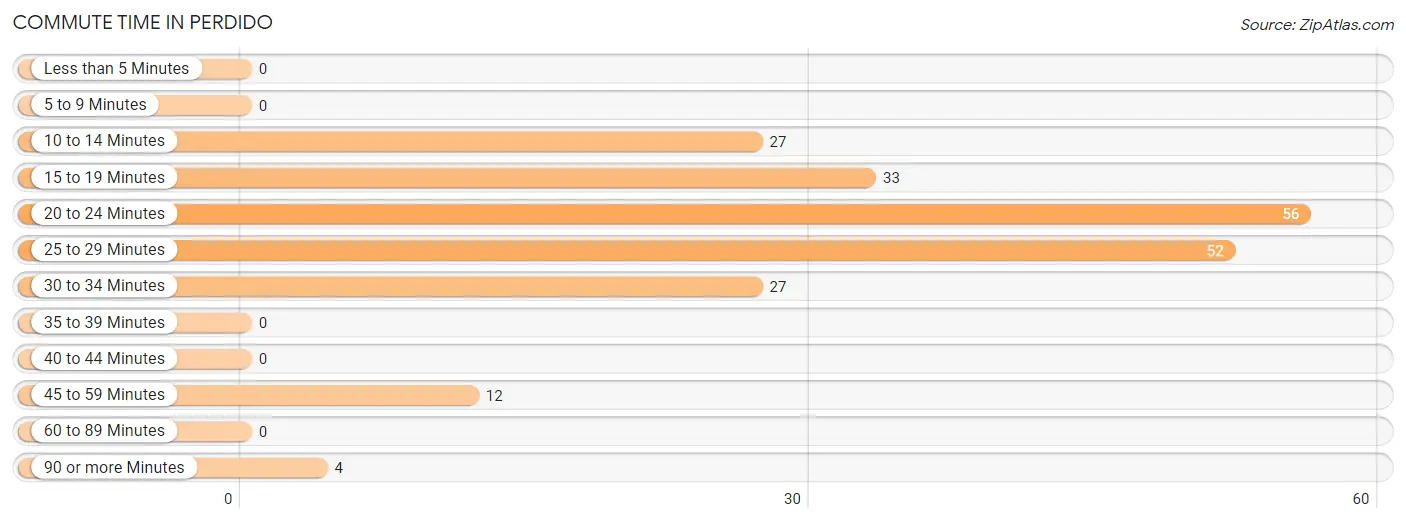
| Commute Time | # Commuters | % Commuters |
| Less than 5 Minutes | 0 | 0.0% |
| 5 to 9 Minutes | 0 | 0.0% |
| 10 to 14 Minutes | 27 | 12.8% |
| 15 to 19 Minutes | 33 | 15.6% |
| 20 to 24 Minutes | 56 | 26.5% |
| 25 to 29 Minutes | 52 | 24.6% |
| 30 to 34 Minutes | 27 | 12.8% |
| 35 to 39 Minutes | 0 | 0.0% |
| 40 to 44 Minutes | 0 | 0.0% |
| 45 to 59 Minutes | 12 | 5.7% |
| 60 to 89 Minutes | 0 | 0.0% |
| 90 or more Minutes | 4 | 1.9% |
Commute Time by Sex in Perdido
The most common commute times in Perdido are 20 to 24 minutes (56 commuters, 47.9%) for males and 10 to 14 minutes (27 commuters, 28.7%) for females.
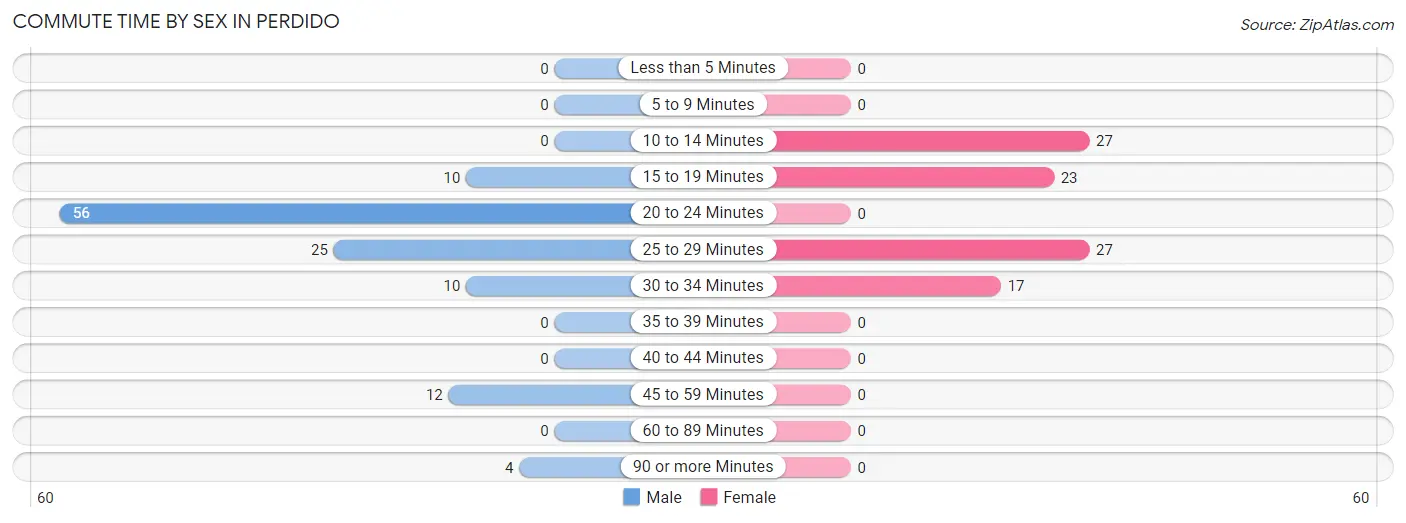
| Commute Time | Male | Female |
| Less than 5 Minutes | 0 (0.0%) | 0 (0.0%) |
| 5 to 9 Minutes | 0 (0.0%) | 0 (0.0%) |
| 10 to 14 Minutes | 0 (0.0%) | 27 (28.7%) |
| 15 to 19 Minutes | 10 (8.6%) | 23 (24.5%) |
| 20 to 24 Minutes | 56 (47.9%) | 0 (0.0%) |
| 25 to 29 Minutes | 25 (21.4%) | 27 (28.7%) |
| 30 to 34 Minutes | 10 (8.6%) | 17 (18.1%) |
| 35 to 39 Minutes | 0 (0.0%) | 0 (0.0%) |
| 40 to 44 Minutes | 0 (0.0%) | 0 (0.0%) |
| 45 to 59 Minutes | 12 (10.3%) | 0 (0.0%) |
| 60 to 89 Minutes | 0 (0.0%) | 0 (0.0%) |
| 90 or more Minutes | 4 (3.4%) | 0 (0.0%) |
Time of Departure to Work by Sex in Perdido
The most frequent times of departure to work in Perdido are 7:00 AM to 7:29 AM (59, 50.4%) for males and 10:00 AM to 10:59 AM (27, 28.7%) for females.
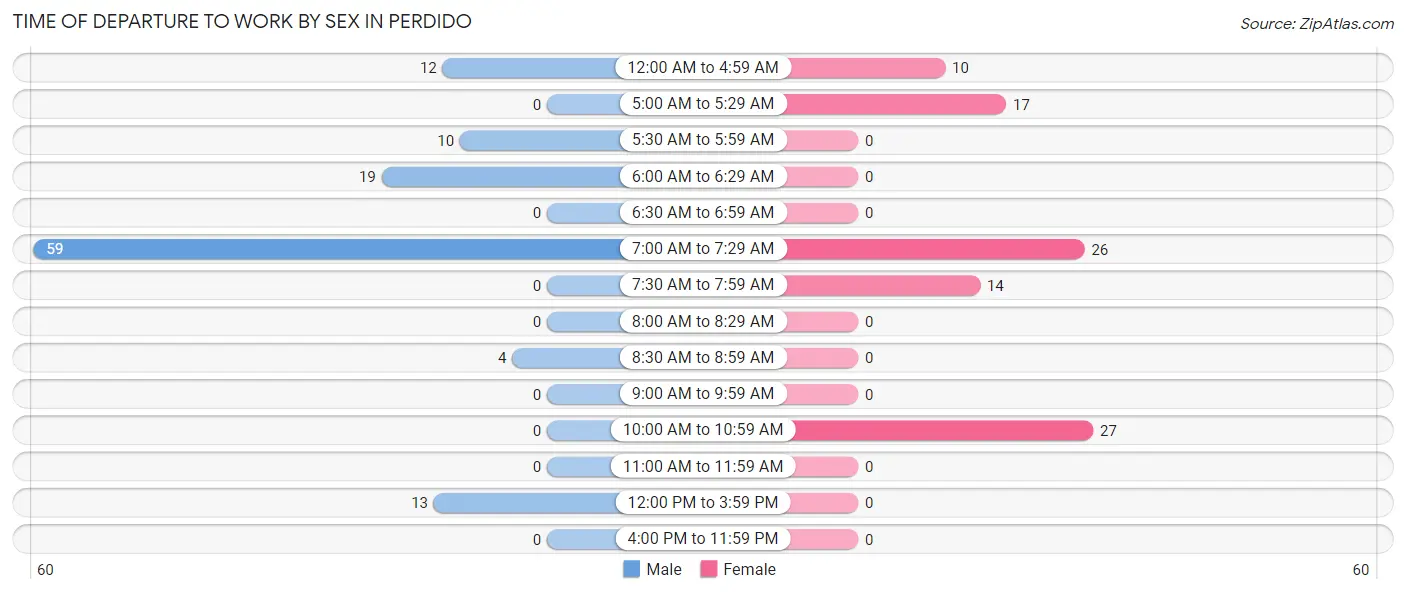
| Time of Departure | Male | Female |
| 12:00 AM to 4:59 AM | 12 (10.3%) | 10 (10.6%) |
| 5:00 AM to 5:29 AM | 0 (0.0%) | 17 (18.1%) |
| 5:30 AM to 5:59 AM | 10 (8.6%) | 0 (0.0%) |
| 6:00 AM to 6:29 AM | 19 (16.2%) | 0 (0.0%) |
| 6:30 AM to 6:59 AM | 0 (0.0%) | 0 (0.0%) |
| 7:00 AM to 7:29 AM | 59 (50.4%) | 26 (27.7%) |
| 7:30 AM to 7:59 AM | 0 (0.0%) | 14 (14.9%) |
| 8:00 AM to 8:29 AM | 0 (0.0%) | 0 (0.0%) |
| 8:30 AM to 8:59 AM | 4 (3.4%) | 0 (0.0%) |
| 9:00 AM to 9:59 AM | 0 (0.0%) | 0 (0.0%) |
| 10:00 AM to 10:59 AM | 0 (0.0%) | 27 (28.7%) |
| 11:00 AM to 11:59 AM | 0 (0.0%) | 0 (0.0%) |
| 12:00 PM to 3:59 PM | 13 (11.1%) | 0 (0.0%) |
| 4:00 PM to 11:59 PM | 0 (0.0%) | 0 (0.0%) |
| Total | 117 (100.0%) | 94 (100.0%) |
Housing Occupancy in Perdido
Occupancy by Ownership in Perdido
Of the total 245 dwellings in Perdido, owner-occupied units account for 212 (86.5%), while renter-occupied units make up 33 (13.5%).
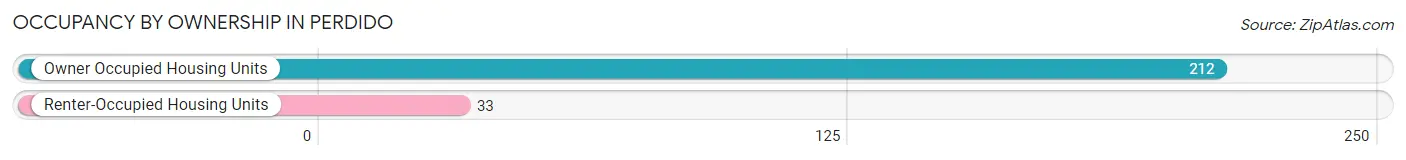
| Occupancy | # Housing Units | % Housing Units |
| Owner Occupied Housing Units | 212 | 86.5% |
| Renter-Occupied Housing Units | 33 | 13.5% |
| Total Occupied Housing Units | 245 | 100.0% |
Occupancy by Household Size in Perdido
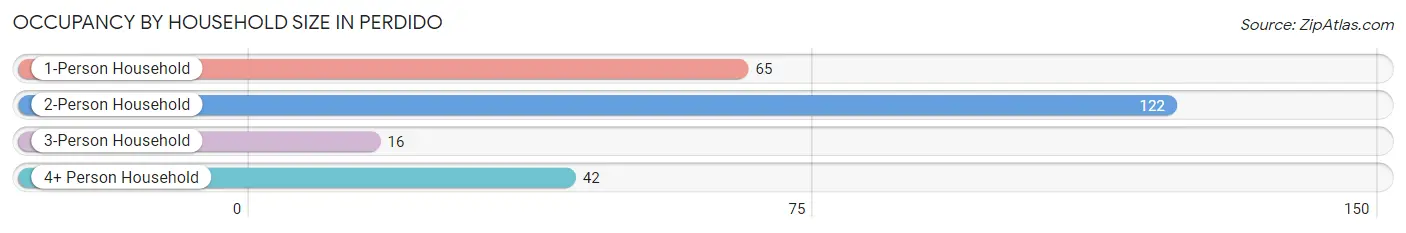
| Household Size | # Housing Units | % Housing Units |
| 1-Person Household | 65 | 26.5% |
| 2-Person Household | 122 | 49.8% |
| 3-Person Household | 16 | 6.5% |
| 4+ Person Household | 42 | 17.1% |
| Total Housing Units | 245 | 100.0% |
Occupancy by Ownership by Household Size in Perdido
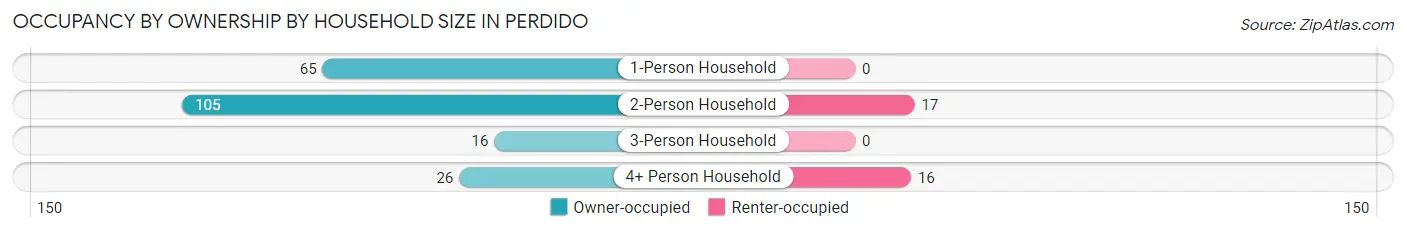
| Household Size | Owner-occupied | Renter-occupied |
| 1-Person Household | 65 (100.0%) | 0 (0.0%) |
| 2-Person Household | 105 (86.1%) | 17 (13.9%) |
| 3-Person Household | 16 (100.0%) | 0 (0.0%) |
| 4+ Person Household | 26 (61.9%) | 16 (38.1%) |
| Total Housing Units | 212 (86.5%) | 33 (13.5%) |
Occupancy by Educational Attainment in Perdido
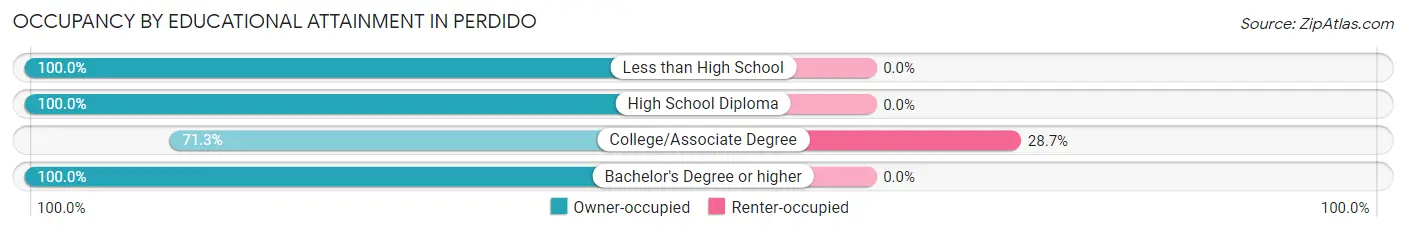
| Household Size | Owner-occupied | Renter-occupied |
| Less than High School | 9 (100.0%) | 0 (0.0%) |
| High School Diploma | 68 (100.0%) | 0 (0.0%) |
| College/Associate Degree | 82 (71.3%) | 33 (28.7%) |
| Bachelor's Degree or higher | 53 (100.0%) | 0 (0.0%) |
Occupancy by Age of Householder in Perdido
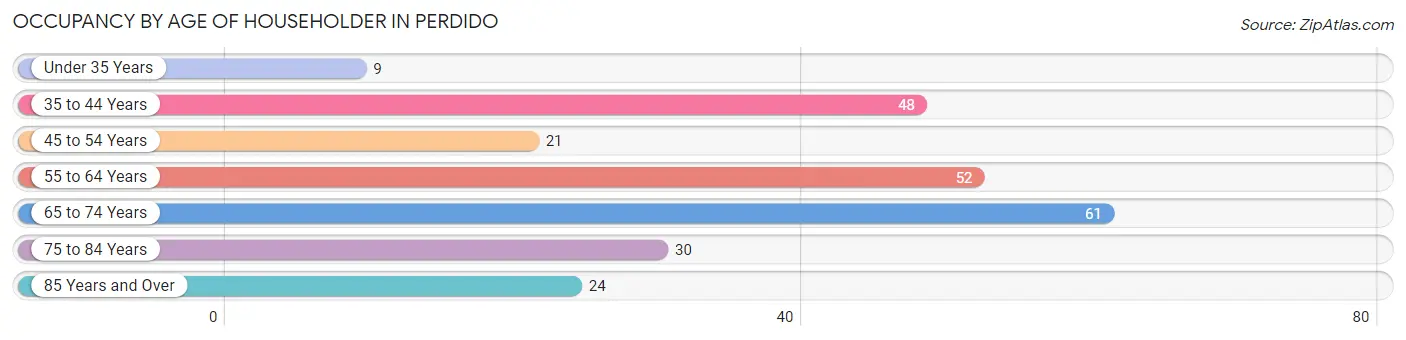
| Age Bracket | # Households | % Households |
| Under 35 Years | 9 | 3.7% |
| 35 to 44 Years | 48 | 19.6% |
| 45 to 54 Years | 21 | 8.6% |
| 55 to 64 Years | 52 | 21.2% |
| 65 to 74 Years | 61 | 24.9% |
| 75 to 84 Years | 30 | 12.2% |
| 85 Years and Over | 24 | 9.8% |
| Total | 245 | 100.0% |
Housing Finances in Perdido
Median Income by Occupancy in Perdido
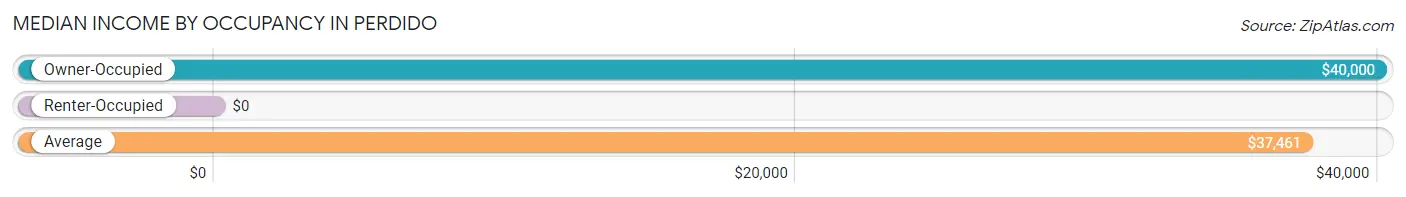
| Occupancy Type | # Households | Median Income |
| Owner-Occupied | 212 (86.5%) | $40,000 |
| Renter-Occupied | 33 (13.5%) | $0 |
| Average | 245 (100.0%) | $37,461 |
Occupancy by Householder Income Bracket in Perdido
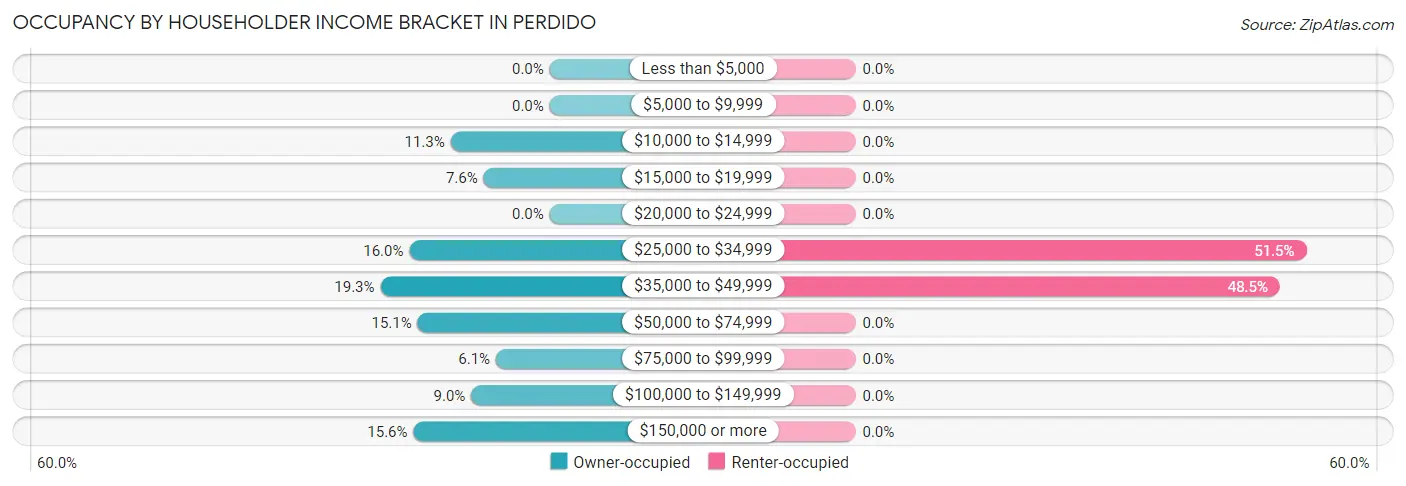
| Income Bracket | Owner-occupied | Renter-occupied |
| Less than $5,000 | 0 (0.0%) | 0 (0.0%) |
| $5,000 to $9,999 | 0 (0.0%) | 0 (0.0%) |
| $10,000 to $14,999 | 24 (11.3%) | 0 (0.0%) |
| $15,000 to $19,999 | 16 (7.5%) | 0 (0.0%) |
| $20,000 to $24,999 | 0 (0.0%) | 0 (0.0%) |
| $25,000 to $34,999 | 34 (16.0%) | 17 (51.5%) |
| $35,000 to $49,999 | 41 (19.3%) | 16 (48.5%) |
| $50,000 to $74,999 | 32 (15.1%) | 0 (0.0%) |
| $75,000 to $99,999 | 13 (6.1%) | 0 (0.0%) |
| $100,000 to $149,999 | 19 (9.0%) | 0 (0.0%) |
| $150,000 or more | 33 (15.6%) | 0 (0.0%) |
| Total | 212 (100.0%) | 33 (100.0%) |
Monthly Housing Cost Tiers in Perdido
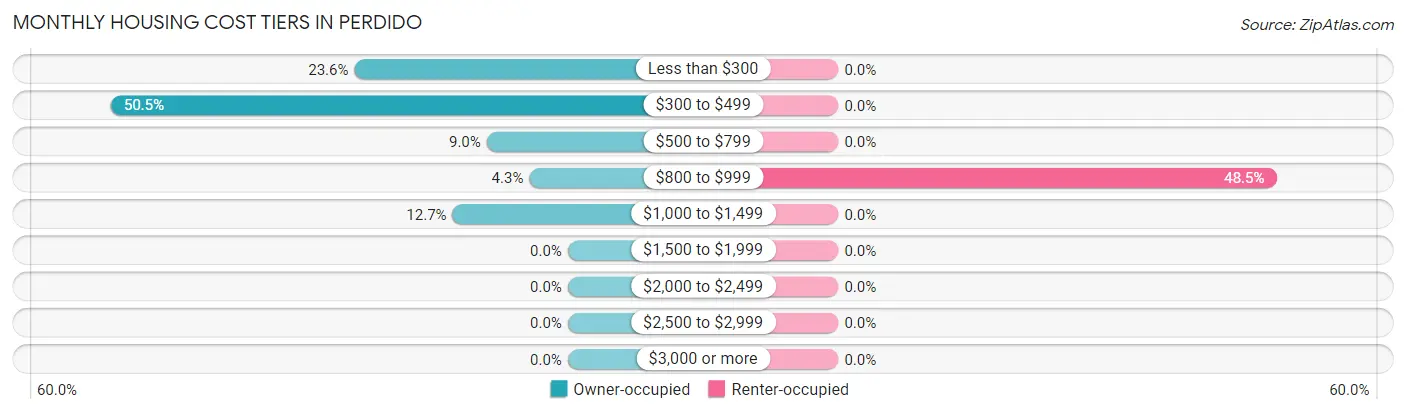
| Monthly Cost | Owner-occupied | Renter-occupied |
| Less than $300 | 50 (23.6%) | 0 (0.0%) |
| $300 to $499 | 107 (50.5%) | 0 (0.0%) |
| $500 to $799 | 19 (9.0%) | 0 (0.0%) |
| $800 to $999 | 9 (4.3%) | 16 (48.5%) |
| $1,000 to $1,499 | 27 (12.7%) | 0 (0.0%) |
| $1,500 to $1,999 | 0 (0.0%) | 0 (0.0%) |
| $2,000 to $2,499 | 0 (0.0%) | 0 (0.0%) |
| $2,500 to $2,999 | 0 (0.0%) | 0 (0.0%) |
| $3,000 or more | 0 (0.0%) | 0 (0.0%) |
| Total | 212 (100.0%) | 33 (100.0%) |
Physical Housing Characteristics in Perdido
Housing Structures in Perdido
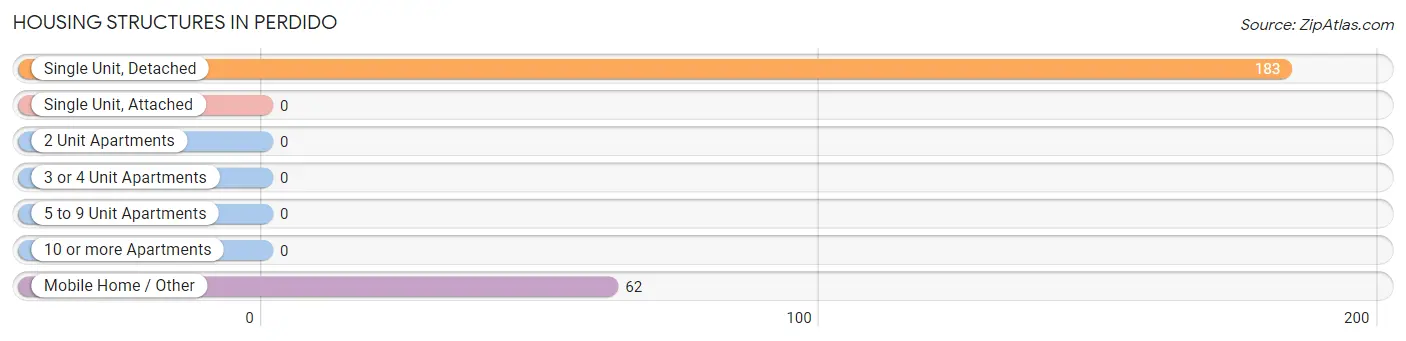
| Structure Type | # Housing Units | % Housing Units |
| Single Unit, Detached | 183 | 74.7% |
| Single Unit, Attached | 0 | 0.0% |
| 2 Unit Apartments | 0 | 0.0% |
| 3 or 4 Unit Apartments | 0 | 0.0% |
| 5 to 9 Unit Apartments | 0 | 0.0% |
| 10 or more Apartments | 0 | 0.0% |
| Mobile Home / Other | 62 | 25.3% |
| Total | 245 | 100.0% |
Housing Structures by Occupancy in Perdido
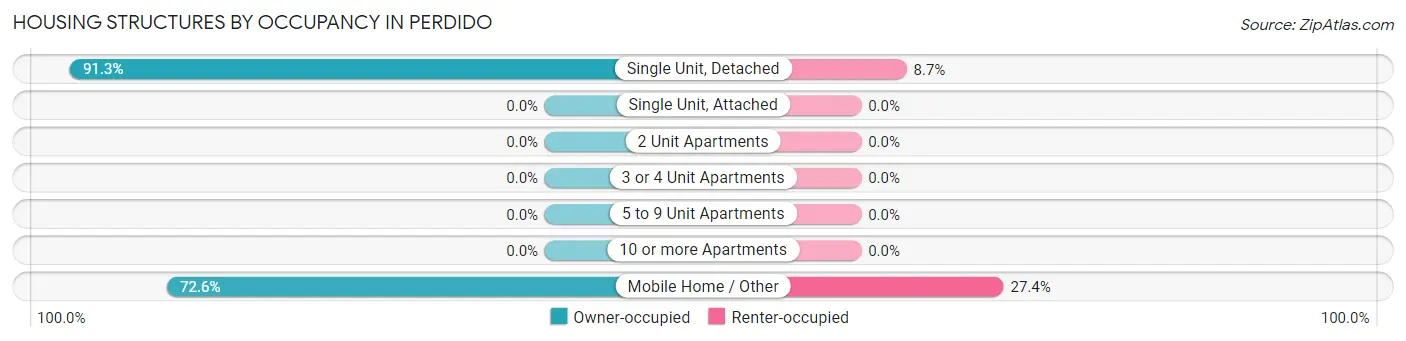
| Structure Type | Owner-occupied | Renter-occupied |
| Single Unit, Detached | 167 (91.3%) | 16 (8.7%) |
| Single Unit, Attached | 0 (0.0%) | 0 (0.0%) |
| 2 Unit Apartments | 0 (0.0%) | 0 (0.0%) |
| 3 or 4 Unit Apartments | 0 (0.0%) | 0 (0.0%) |
| 5 to 9 Unit Apartments | 0 (0.0%) | 0 (0.0%) |
| 10 or more Apartments | 0 (0.0%) | 0 (0.0%) |
| Mobile Home / Other | 45 (72.6%) | 17 (27.4%) |
| Total | 212 (86.5%) | 33 (13.5%) |
Housing Structures by Number of Rooms in Perdido
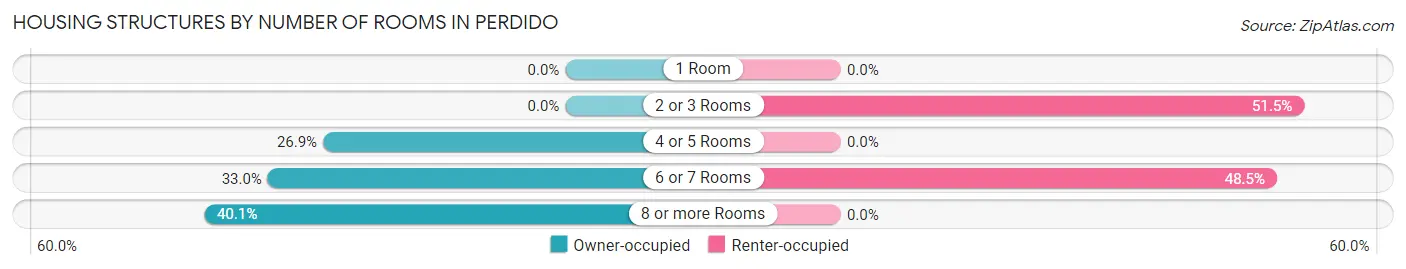
| Number of Rooms | Owner-occupied | Renter-occupied |
| 1 Room | 0 (0.0%) | 0 (0.0%) |
| 2 or 3 Rooms | 0 (0.0%) | 17 (51.5%) |
| 4 or 5 Rooms | 57 (26.9%) | 0 (0.0%) |
| 6 or 7 Rooms | 70 (33.0%) | 16 (48.5%) |
| 8 or more Rooms | 85 (40.1%) | 0 (0.0%) |
| Total | 212 (100.0%) | 33 (100.0%) |
Housing Structure by Heating Type in Perdido
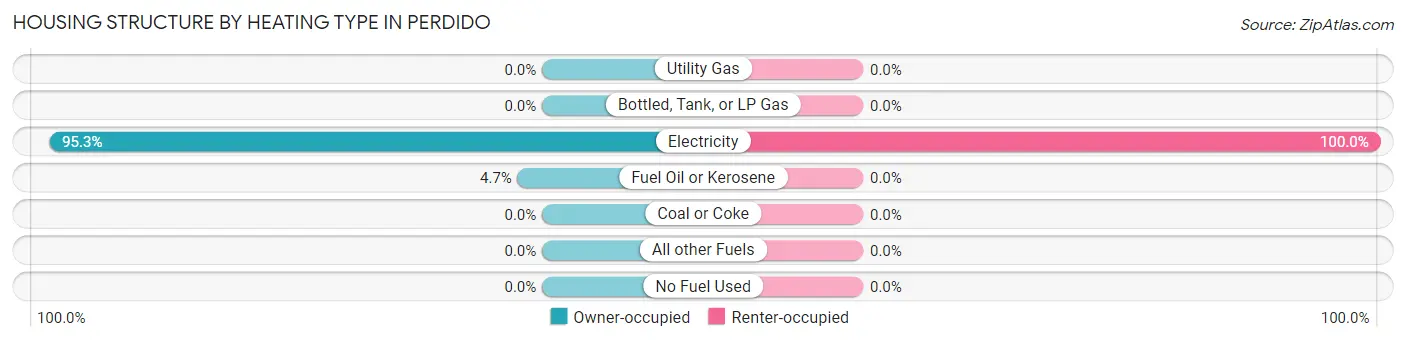
| Heating Type | Owner-occupied | Renter-occupied |
| Utility Gas | 0 (0.0%) | 0 (0.0%) |
| Bottled, Tank, or LP Gas | 0 (0.0%) | 0 (0.0%) |
| Electricity | 202 (95.3%) | 33 (100.0%) |
| Fuel Oil or Kerosene | 10 (4.7%) | 0 (0.0%) |
| Coal or Coke | 0 (0.0%) | 0 (0.0%) |
| All other Fuels | 0 (0.0%) | 0 (0.0%) |
| No Fuel Used | 0 (0.0%) | 0 (0.0%) |
| Total | 212 (100.0%) | 33 (100.0%) |
Household Vehicle Usage in Perdido
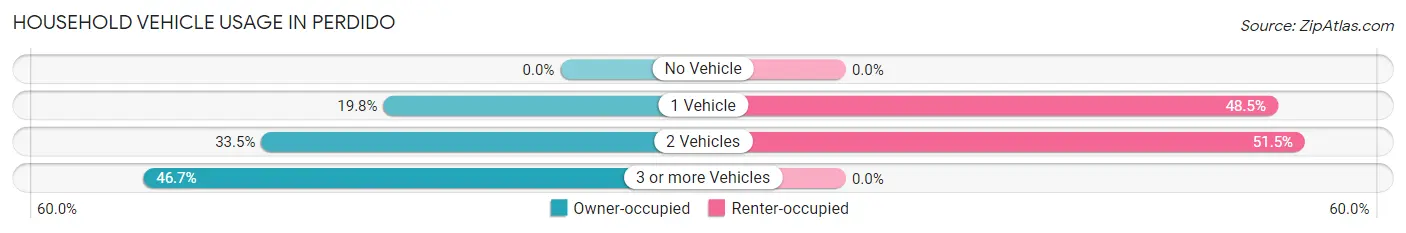
| Vehicles per Household | Owner-occupied | Renter-occupied |
| No Vehicle | 0 (0.0%) | 0 (0.0%) |
| 1 Vehicle | 42 (19.8%) | 16 (48.5%) |
| 2 Vehicles | 71 (33.5%) | 17 (51.5%) |
| 3 or more Vehicles | 99 (46.7%) | 0 (0.0%) |
| Total | 212 (100.0%) | 33 (100.0%) |
Real Estate & Mortgages in Perdido
Real Estate and Mortgage Overview in Perdido
| Characteristic | Without Mortgage | With Mortgage |
| Housing Units | 148 | 64 |
| Median Property Value | - | - |
| Median Household Income | $36,484 | $0 |
| Monthly Housing Costs | $339 | $0 |
| Real Estate Taxes | $431 | $19 |
Property Value by Mortgage Status in Perdido
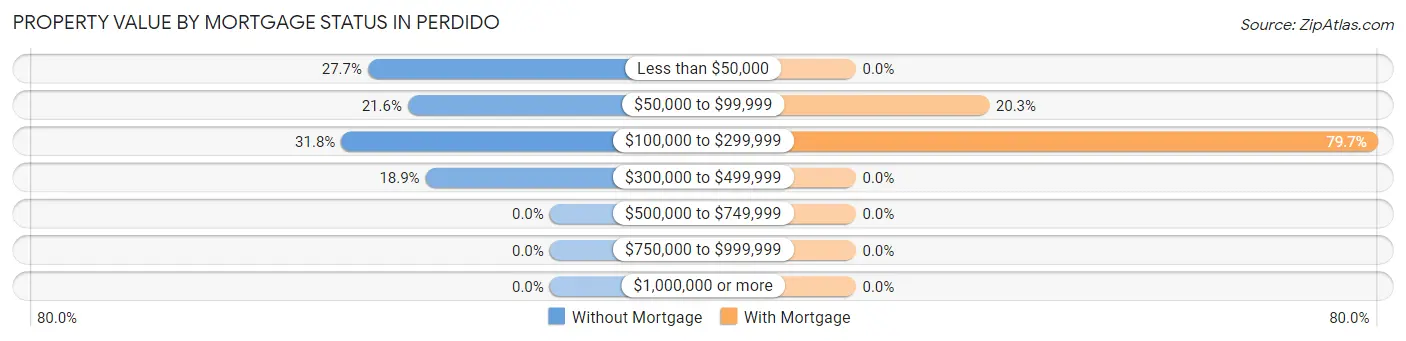
| Property Value | Without Mortgage | With Mortgage |
| Less than $50,000 | 41 (27.7%) | 0 (0.0%) |
| $50,000 to $99,999 | 32 (21.6%) | 13 (20.3%) |
| $100,000 to $299,999 | 47 (31.8%) | 51 (79.7%) |
| $300,000 to $499,999 | 28 (18.9%) | 0 (0.0%) |
| $500,000 to $749,999 | 0 (0.0%) | 0 (0.0%) |
| $750,000 to $999,999 | 0 (0.0%) | 0 (0.0%) |
| $1,000,000 or more | 0 (0.0%) | 0 (0.0%) |
| Total | 148 (100.0%) | 64 (100.0%) |
Household Income by Mortgage Status in Perdido
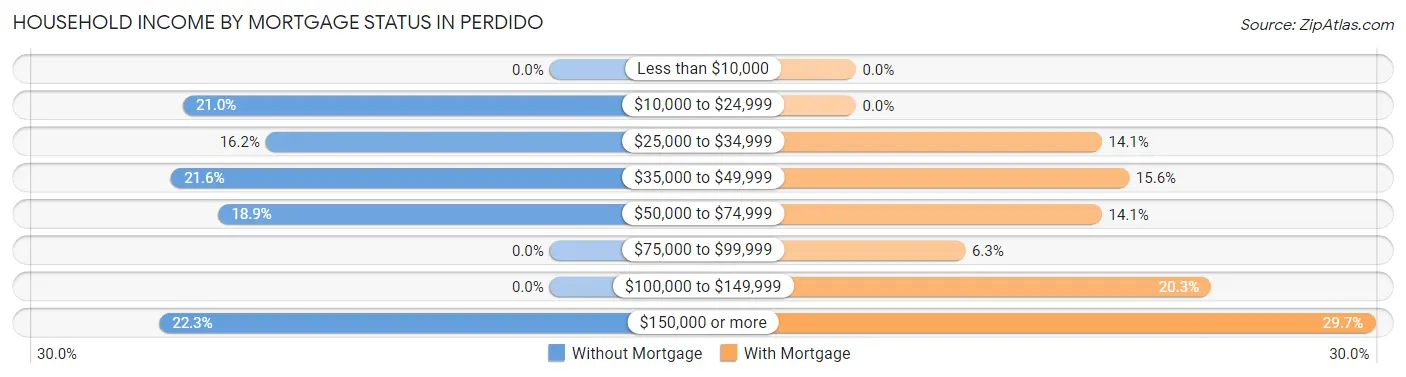
| Household Income | Without Mortgage | With Mortgage |
| Less than $10,000 | 0 (0.0%) | 0 (0.0%) |
| $10,000 to $24,999 | 31 (20.9%) | 0 (0.0%) |
| $25,000 to $34,999 | 24 (16.2%) | 9 (14.1%) |
| $35,000 to $49,999 | 32 (21.6%) | 10 (15.6%) |
| $50,000 to $74,999 | 28 (18.9%) | 9 (14.1%) |
| $75,000 to $99,999 | 0 (0.0%) | 4 (6.2%) |
| $100,000 to $149,999 | 0 (0.0%) | 13 (20.3%) |
| $150,000 or more | 33 (22.3%) | 19 (29.7%) |
| Total | 148 (100.0%) | 64 (100.0%) |
Property Value to Household Income Ratio in Perdido
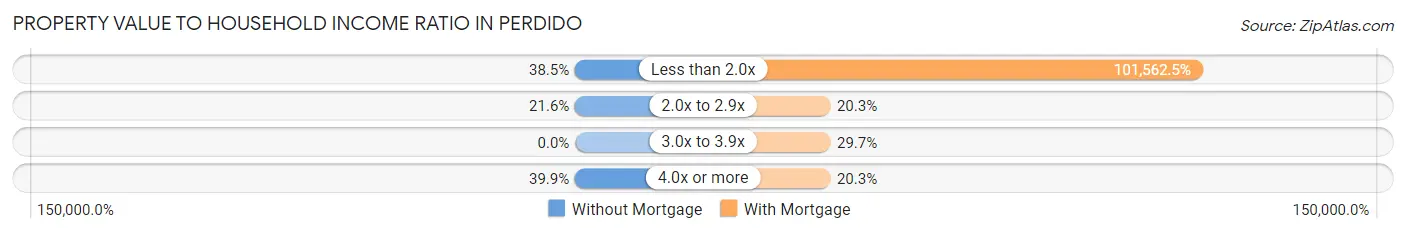
| Value-to-Income Ratio | Without Mortgage | With Mortgage |
| Less than 2.0x | 57 (38.5%) | 65,000 (101,562.5%) |
| 2.0x to 2.9x | 32 (21.6%) | 13 (20.3%) |
| 3.0x to 3.9x | 0 (0.0%) | 19 (29.7%) |
| 4.0x or more | 59 (39.9%) | 13 (20.3%) |
| Total | 148 (100.0%) | 64 (100.0%) |
Real Estate Taxes by Mortgage Status in Perdido
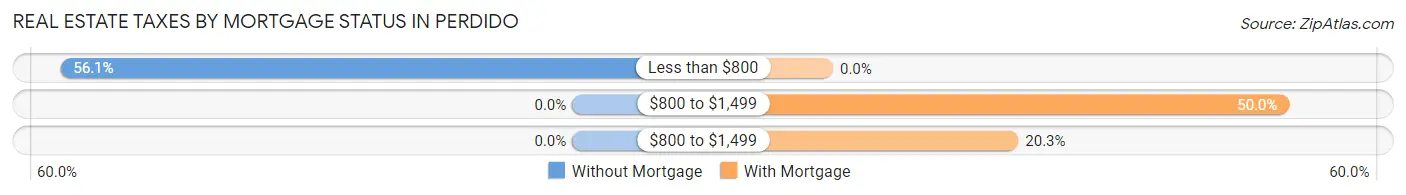
| Property Taxes | Without Mortgage | With Mortgage |
| Less than $800 | 83 (56.1%) | 0 (0.0%) |
| $800 to $1,499 | 0 (0.0%) | 32 (50.0%) |
| $800 to $1,499 | 0 (0.0%) | 13 (20.3%) |
| Total | 148 (100.0%) | 64 (100.0%) |
Health & Disability in Perdido
Health Insurance Coverage by Age in Perdido
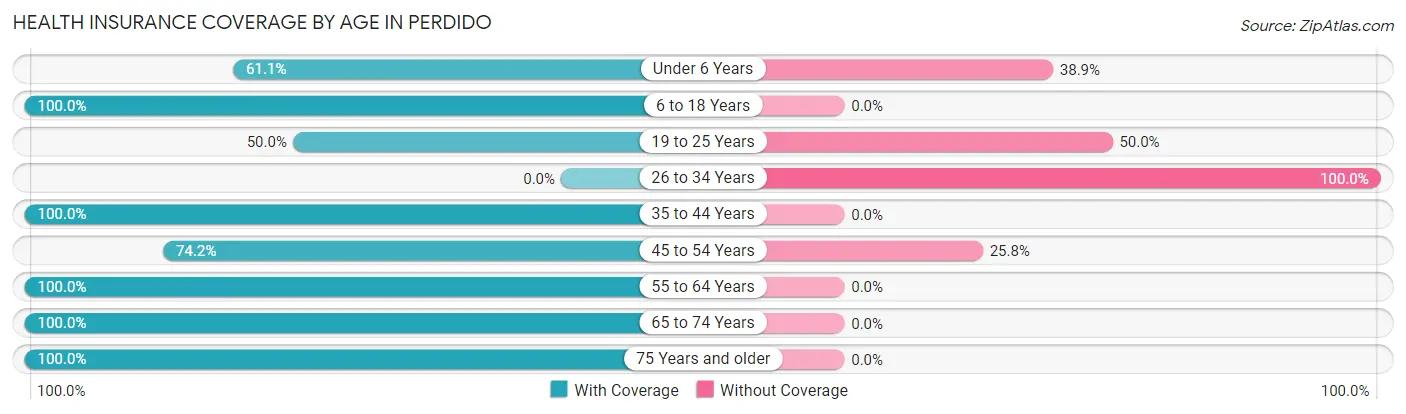
| Age Bracket | With Coverage | Without Coverage |
| Under 6 Years | 11 (61.1%) | 7 (38.9%) |
| 6 to 18 Years | 78 (100.0%) | 0 (0.0%) |
| 19 to 25 Years | 27 (50.0%) | 27 (50.0%) |
| 26 to 34 Years | 0 (0.0%) | 41 (100.0%) |
| 35 to 44 Years | 72 (100.0%) | 0 (0.0%) |
| 45 to 54 Years | 46 (74.2%) | 16 (25.8%) |
| 55 to 64 Years | 112 (100.0%) | 0 (0.0%) |
| 65 to 74 Years | 88 (100.0%) | 0 (0.0%) |
| 75 Years and older | 96 (100.0%) | 0 (0.0%) |
| Total | 530 (85.4%) | 91 (14.6%) |
Health Insurance Coverage by Citizenship Status in Perdido
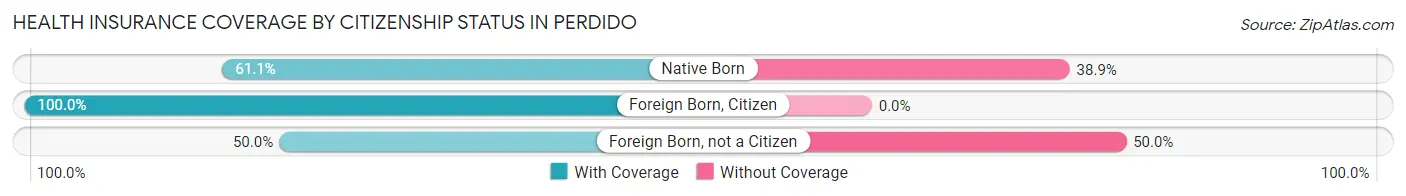
| Citizenship Status | With Coverage | Without Coverage |
| Native Born | 11 (61.1%) | 7 (38.9%) |
| Foreign Born, Citizen | 78 (100.0%) | 0 (0.0%) |
| Foreign Born, not a Citizen | 27 (50.0%) | 27 (50.0%) |
Health Insurance Coverage by Household Income in Perdido
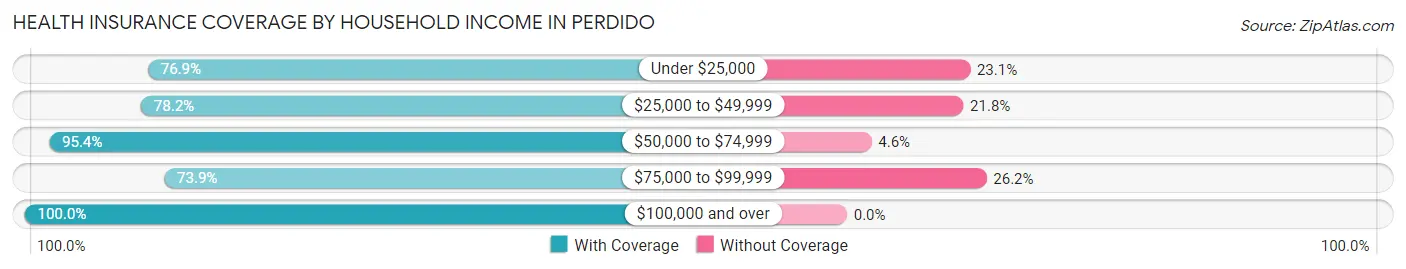
| Household Income | With Coverage | Without Coverage |
| Under $25,000 | 40 (76.9%) | 12 (23.1%) |
| $25,000 to $49,999 | 208 (78.2%) | 58 (21.8%) |
| $50,000 to $74,999 | 83 (95.4%) | 4 (4.6%) |
| $75,000 to $99,999 | 48 (73.9%) | 17 (26.2%) |
| $100,000 and over | 151 (100.0%) | 0 (0.0%) |
Public vs Private Health Insurance Coverage by Age in Perdido
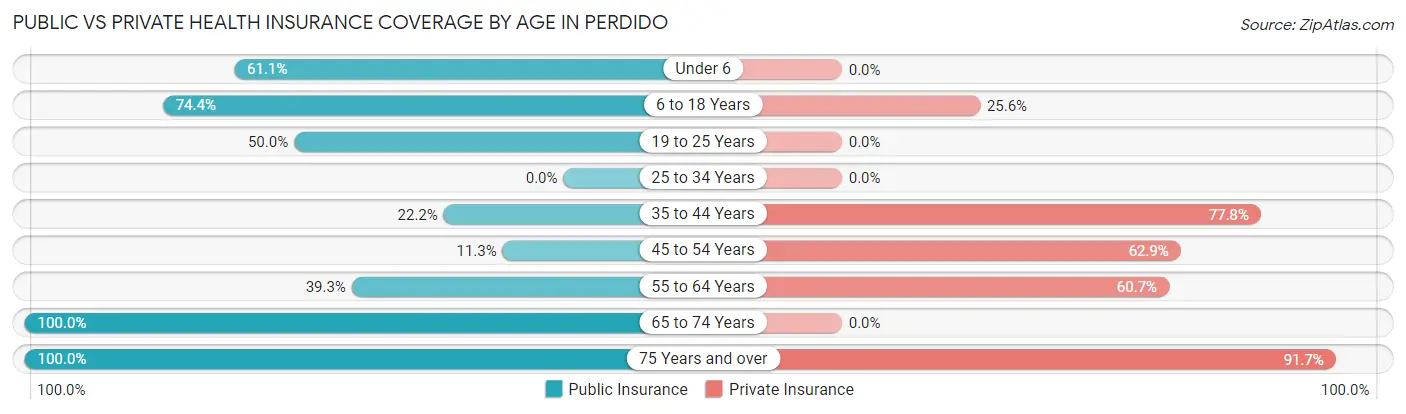
| Age Bracket | Public Insurance | Private Insurance |
| Under 6 | 11 (61.1%) | 0 (0.0%) |
| 6 to 18 Years | 58 (74.4%) | 20 (25.6%) |
| 19 to 25 Years | 27 (50.0%) | 0 (0.0%) |
| 25 to 34 Years | 0 (0.0%) | 0 (0.0%) |
| 35 to 44 Years | 16 (22.2%) | 56 (77.8%) |
| 45 to 54 Years | 7 (11.3%) | 39 (62.9%) |
| 55 to 64 Years | 44 (39.3%) | 68 (60.7%) |
| 65 to 74 Years | 88 (100.0%) | 0 (0.0%) |
| 75 Years and over | 96 (100.0%) | 88 (91.7%) |
| Total | 347 (55.9%) | 271 (43.6%) |
Disability Status by Sex by Age in Perdido
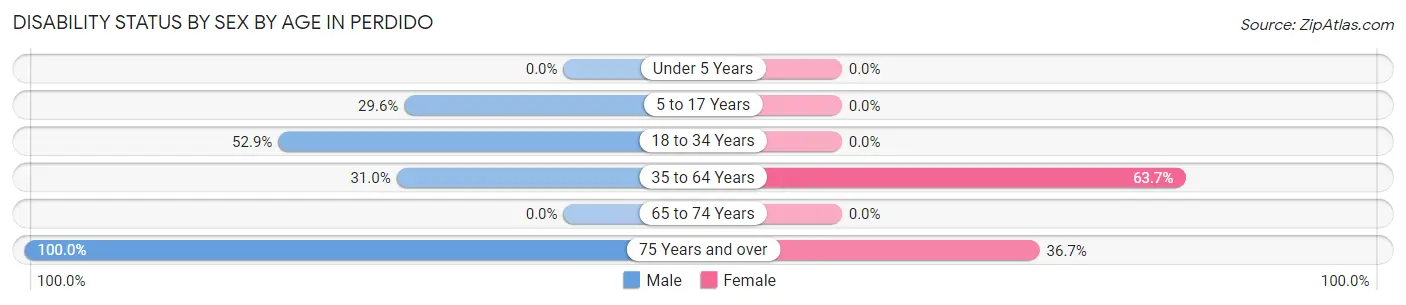
| Age Bracket | Male | Female |
| Under 5 Years | 0 (0.0%) | 0 (0.0%) |
| 5 to 17 Years | 13 (29.5%) | 0 (0.0%) |
| 18 to 34 Years | 27 (52.9%) | 0 (0.0%) |
| 35 to 64 Years | 48 (31.0%) | 58 (63.7%) |
| 65 to 74 Years | 0 (0.0%) | 0 (0.0%) |
| 75 Years and over | 47 (100.0%) | 18 (36.7%) |
Disability Class by Sex by Age in Perdido
Disability Class: Hearing Difficulty
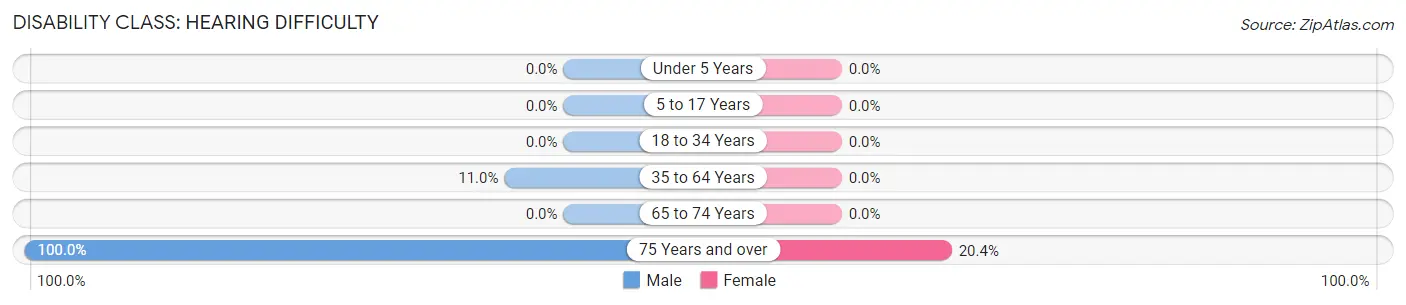
| Age Bracket | Male | Female |
| Under 5 Years | 0 (0.0%) | 0 (0.0%) |
| 5 to 17 Years | 0 (0.0%) | 0 (0.0%) |
| 18 to 34 Years | 0 (0.0%) | 0 (0.0%) |
| 35 to 64 Years | 17 (11.0%) | 0 (0.0%) |
| 65 to 74 Years | 0 (0.0%) | 0 (0.0%) |
| 75 Years and over | 47 (100.0%) | 10 (20.4%) |
Disability Class: Vision Difficulty
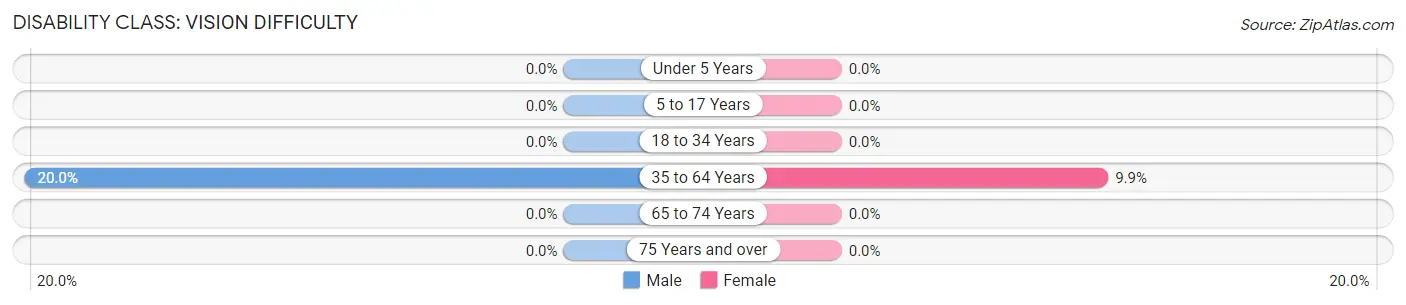
| Age Bracket | Male | Female |
| Under 5 Years | 0 (0.0%) | 0 (0.0%) |
| 5 to 17 Years | 0 (0.0%) | 0 (0.0%) |
| 18 to 34 Years | 0 (0.0%) | 0 (0.0%) |
| 35 to 64 Years | 31 (20.0%) | 9 (9.9%) |
| 65 to 74 Years | 0 (0.0%) | 0 (0.0%) |
| 75 Years and over | 0 (0.0%) | 0 (0.0%) |
Disability Class: Cognitive Difficulty
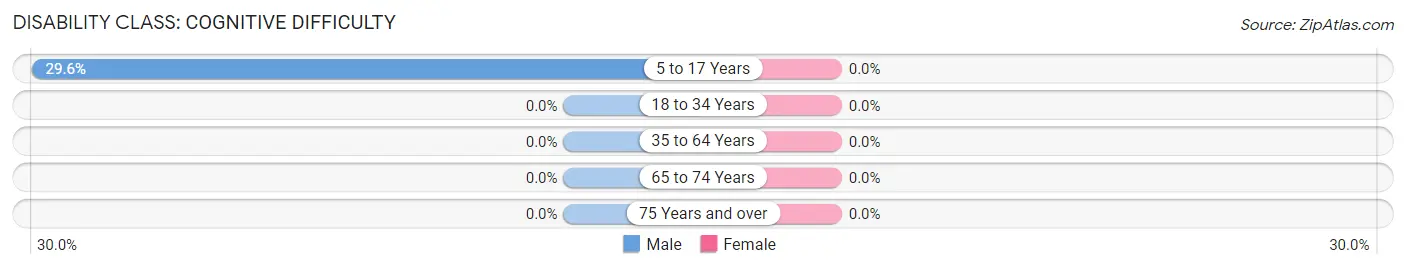
| Age Bracket | Male | Female |
| 5 to 17 Years | 13 (29.5%) | 0 (0.0%) |
| 18 to 34 Years | 0 (0.0%) | 0 (0.0%) |
| 35 to 64 Years | 0 (0.0%) | 0 (0.0%) |
| 65 to 74 Years | 0 (0.0%) | 0 (0.0%) |
| 75 Years and over | 0 (0.0%) | 0 (0.0%) |
Disability Class: Ambulatory Difficulty
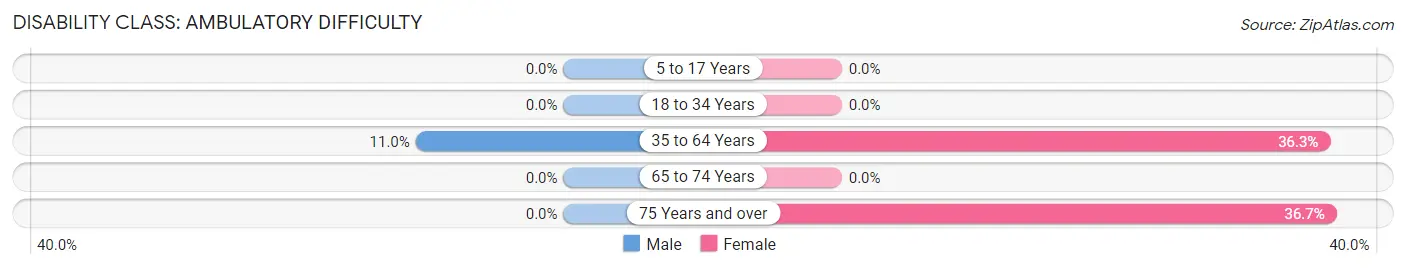
| Age Bracket | Male | Female |
| 5 to 17 Years | 0 (0.0%) | 0 (0.0%) |
| 18 to 34 Years | 0 (0.0%) | 0 (0.0%) |
| 35 to 64 Years | 17 (11.0%) | 33 (36.3%) |
| 65 to 74 Years | 0 (0.0%) | 0 (0.0%) |
| 75 Years and over | 0 (0.0%) | 18 (36.7%) |
Disability Class: Self-Care Difficulty
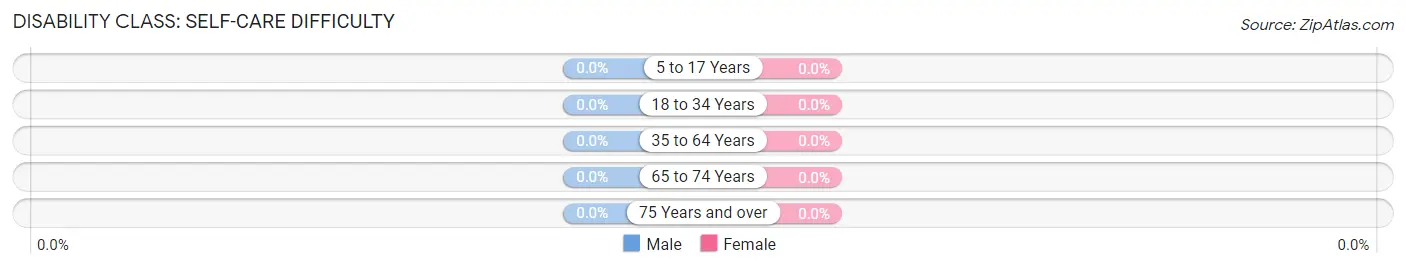
| Age Bracket | Male | Female |
| 5 to 17 Years | 0 (0.0%) | 0 (0.0%) |
| 18 to 34 Years | 0 (0.0%) | 0 (0.0%) |
| 35 to 64 Years | 0 (0.0%) | 0 (0.0%) |
| 65 to 74 Years | 0 (0.0%) | 0 (0.0%) |
| 75 Years and over | 0 (0.0%) | 0 (0.0%) |
Technology Access in Perdido
Computing Device Access in Perdido
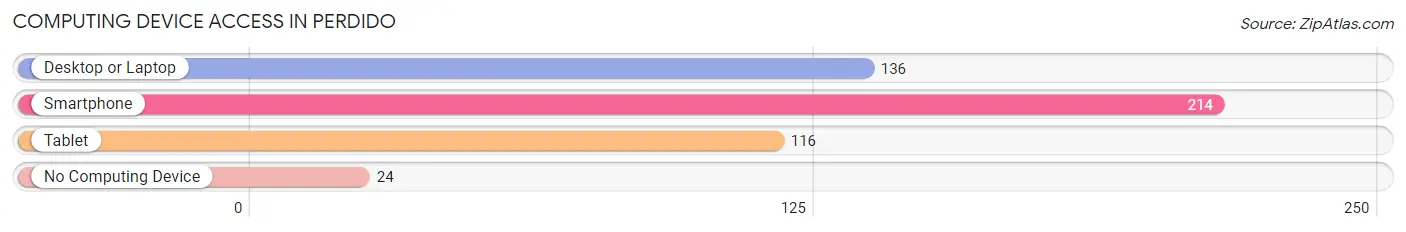
| Device Type | # Households | % Households |
| Desktop or Laptop | 136 | 55.5% |
| Smartphone | 214 | 87.4% |
| Tablet | 116 | 47.3% |
| No Computing Device | 24 | 9.8% |
| Total | 245 | 100.0% |
Internet Access in Perdido
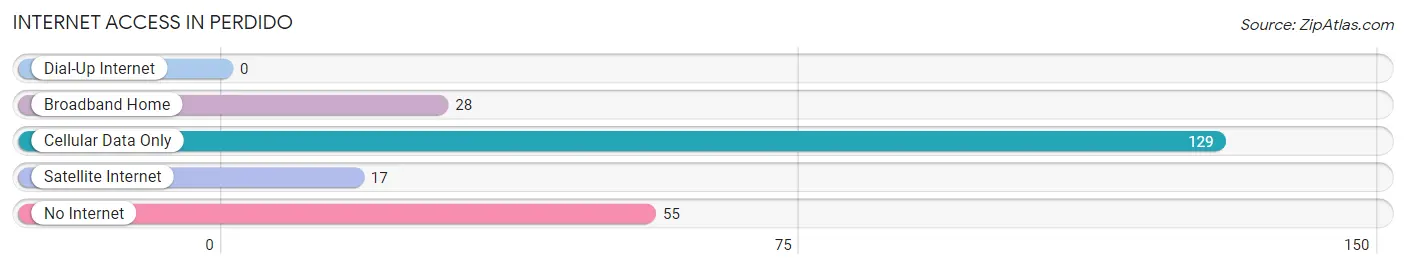
| Internet Type | # Households | % Households |
| Dial-Up Internet | 0 | 0.0% |
| Broadband Home | 28 | 11.4% |
| Cellular Data Only | 129 | 52.6% |
| Satellite Internet | 17 | 6.9% |
| No Internet | 55 | 22.5% |
| Total | 245 | 100.0% |
Perdido Summary
History
Perdido, Alabama is a small unincorporated community located in Baldwin County, Alabama. It is situated on the Perdido River, which forms the border between Alabama and Florida. The area was first settled in the early 1800s by settlers from the Creek Nation. The town was originally known as “Perdido Station” and was a stop on the Mobile and Great Northern Railroad. The town was officially incorporated in 1887 and was named after the Perdido River.
The town of Perdido has a rich history of agriculture and timber production. The area was known for its production of cotton, corn, and other crops. The timber industry was also an important part of the local economy. The town was also home to several sawmills and lumber companies.
In the early 1900s, the town of Perdido was a popular destination for tourists. The area was known for its beautiful scenery and its abundance of wildlife. The town was also home to several resorts and hotels.
Geography
Perdido is located in Baldwin County, Alabama. It is situated on the Perdido River, which forms the border between Alabama and Florida. The town is located approximately 25 miles south of Mobile, Alabama and approximately 40 miles east of Pensacola, Florida.
The town of Perdido is located in a rural area and is surrounded by forests and wetlands. The area is known for its abundance of wildlife, including deer, wild turkeys, and alligators. The town is also home to several small lakes and ponds.
Economy
The economy of Perdido is largely based on agriculture and timber production. The area is known for its production of cotton, corn, and other crops. The timber industry is also an important part of the local economy. The town is also home to several sawmills and lumber companies.
In recent years, the town of Perdido has become a popular destination for tourists. The area is known for its beautiful scenery and its abundance of wildlife. The town is also home to several resorts and hotels.
Demographics
As of the 2010 census, the population of Perdido was 1,845. The racial makeup of the town was 97.3% White, 0.7% African American, 0.2% Native American, 0.2% Asian, 0.1% Pacific Islander, 0.3% from other races, and 1.3% from two or more races. Hispanic or Latino of any race were 1.3% of the population.
The median income for a household in Perdido was $37,500, and the median income for a family was $45,000. The per capita income for the town was $19,000. About 11.3% of families and 14.2% of the population were below the poverty line, including 18.2% of those under age 18 and 8.3% of those age 65 or over.
Common Questions
What is Per Capita Income in Perdido?
Per Capita income in Perdido is $37,138.
What is the Median Family Income in Perdido?
Median Family Income in Perdido is $48,984.
What is the Median Household income in Perdido?
Median Household Income in Perdido is $37,461.
What is Inequality or Gini Index in Perdido?
Inequality or Gini Index in Perdido is 0.56.
What is the Total Population of Perdido?
Total Population of Perdido is 621.
What is the Total Male Population of Perdido?
Total Male Population of Perdido is 349.
What is the Total Female Population of Perdido?
Total Female Population of Perdido is 272.
What is the Ratio of Males per 100 Females in Perdido?
There are 128.31 Males per 100 Females in Perdido.
What is the Ratio of Females per 100 Males in Perdido?
There are 77.94 Females per 100 Males in Perdido.
What is the Median Population Age in Perdido?
Median Population Age in Perdido is 52.1 Years.
What is the Average Family Size in Perdido
Average Family Size in Perdido is 3.2 People.
What is the Average Household Size in Perdido
Average Household Size in Perdido is 2.5 People.
How Large is the Labor Force in Perdido?
There are 254 People in the Labor Forcein in Perdido.
What is the Percentage of People in the Labor Force in Perdido?
48.4% of People are in the Labor Force in Perdido.
What is the Unemployment Rate in Perdido?
Unemployment Rate in Perdido is 5.9%.