Immigrants from Uzbekistan Disability
COMPARE
Immigrants from Uzbekistan
Select to Compare
Disability
Immigrants from Uzbekistan Disability
11.3%
DISABILITY
94.9/ 100
METRIC RATING
112th/ 347
METRIC RANK
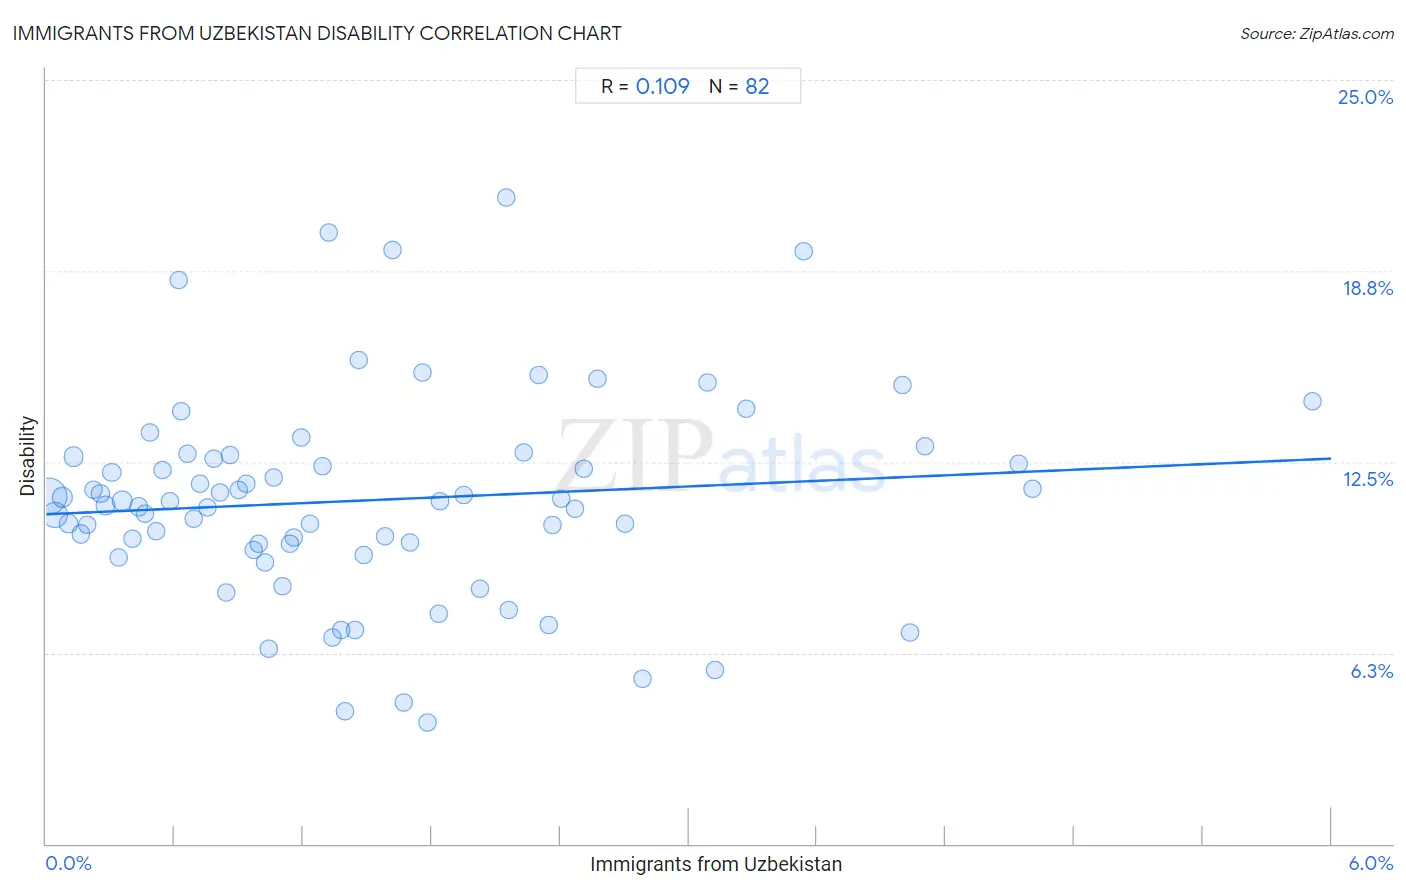
Immigrants from Uzbekistan Disability Correlation Chart
The statistical analysis conducted on geographies consisting of 118,739,828 people shows a poor positive correlation between the proportion of Immigrants from Uzbekistan and percentage of population with a disability in the United States with a correlation coefficient (R) of 0.109 and weighted average of 11.3%. On average, for every 1% (one percent) increase in Immigrants from Uzbekistan within a typical geography, there is an increase of 0.30% in percentage of population with a disability.
It is essential to understand that the correlation between the percentage of Immigrants from Uzbekistan and percentage of population with a disability does not imply a direct cause-and-effect relationship. It remains uncertain whether the presence of Immigrants from Uzbekistan influences an upward or downward trend in the level of percentage of population with a disability within an area, or if Immigrants from Uzbekistan simply ended up residing in those areas with higher or lower levels of percentage of population with a disability due to other factors.
Demographics Similar to Immigrants from Uzbekistan by Disability
In terms of disability, the demographic groups most similar to Immigrants from Uzbekistan are Guyanese (11.3%, a difference of 0.040%), Immigrants from Syria (11.3%, a difference of 0.050%), Immigrants from Philippines (11.3%, a difference of 0.060%), Immigrants from South Eastern Asia (11.3%, a difference of 0.12%), and Immigrants from Northern Europe (11.3%, a difference of 0.17%).
| Demographics | Rating | Rank | Disability |
| Immigrants from Kazakhstan | 96.4 /100 | #105 | Exceptional 11.3% |
| Immigrants from Eastern Europe | 96.3 /100 | #106 | Exceptional 11.3% |
| Nicaraguans | 96.2 /100 | #107 | Exceptional 11.3% |
| Immigrants from Nigeria | 96.0 /100 | #108 | Exceptional 11.3% |
| Immigrants from Uganda | 95.7 /100 | #109 | Exceptional 11.3% |
| Immigrants from Denmark | 95.6 /100 | #110 | Exceptional 11.3% |
| Immigrants from South Eastern Asia | 95.4 /100 | #111 | Exceptional 11.3% |
| Immigrants from Uzbekistan | 94.9 /100 | #112 | Exceptional 11.3% |
| Guyanese | 94.7 /100 | #113 | Exceptional 11.3% |
| Immigrants from Syria | 94.7 /100 | #114 | Exceptional 11.3% |
| Immigrants from Philippines | 94.6 /100 | #115 | Exceptional 11.3% |
| Immigrants from Northern Europe | 94.1 /100 | #116 | Exceptional 11.3% |
| Luxembourgers | 93.9 /100 | #117 | Exceptional 11.3% |
| Koreans | 93.8 /100 | #118 | Exceptional 11.3% |
| Central Americans | 93.5 /100 | #119 | Exceptional 11.4% |
Immigrants from Uzbekistan Disability Correlation Summary
| Measurement | Immigrants from Uzbekistan Data | Disability Data |
| Minimum | 0.011% | 4.0% |
| Maximum | 5.9% | 21.1% |
| Range | 5.9% | 17.2% |
| Mean | 1.5% | 11.2% |
| Median | 1.2% | 11.2% |
| Interquartile 25% (IQ1) | 0.62% | 9.8% |
| Interquartile 75% (IQ3) | 2.2% | 12.7% |
| Interquartile Range (IQR) | 1.5% | 2.9% |
| Standard Deviation (Sample) | 1.2% | 3.4% |
| Standard Deviation (Population) | 1.2% | 3.4% |
Correlation Details
| Immigrants from Uzbekistan Percentile | Sample Size | Disability |
[ 0.0% - 0.5% ] 0.011% | 55,989,810 | 11.4% |
[ 0.0% - 0.5% ] 0.040% | 22,615,047 | 10.8% |
[ 0.0% - 0.5% ] 0.074% | 8,382,862 | 11.3% |
[ 0.0% - 0.5% ] 0.10% | 4,891,774 | 10.5% |
[ 0.0% - 0.5% ] 0.13% | 4,627,317 | 12.7% |
[ 0.0% - 0.5% ] 0.16% | 2,388,485 | 10.2% |
[ 0.0% - 0.5% ] 0.19% | 1,439,084 | 10.5% |
[ 0.0% - 0.5% ] 0.22% | 1,442,507 | 11.6% |
[ 0.0% - 0.5% ] 0.25% | 1,263,971 | 11.4% |
[ 0.0% - 0.5% ] 0.28% | 901,897 | 11.1% |
[ 0.0% - 0.5% ] 0.31% | 425,857 | 12.2% |
[ 0.0% - 0.5% ] 0.34% | 518,173 | 9.4% |
[ 0.0% - 0.5% ] 0.36% | 9,002,227 | 11.2% |
[ 0.0% - 0.5% ] 0.40% | 363,976 | 10.0% |
[ 0.0% - 0.5% ] 0.43% | 363,231 | 11.0% |
[ 0.0% - 0.5% ] 0.46% | 338,944 | 10.8% |
[ 0.0% - 0.5% ] 0.48% | 281,789 | 13.5% |
[ 0.5% - 1.0% ] 0.51% | 216,747 | 10.2% |
[ 0.5% - 1.0% ] 0.54% | 111,316 | 12.2% |
[ 0.5% - 1.0% ] 0.58% | 220,161 | 11.2% |
[ 0.5% - 1.0% ] 0.62% | 31,481 | 18.5% |
[ 0.5% - 1.0% ] 0.63% | 99,719 | 14.2% |
[ 0.5% - 1.0% ] 0.66% | 140,451 | 12.8% |
[ 0.5% - 1.0% ] 0.69% | 114,951 | 10.6% |
[ 0.5% - 1.0% ] 0.72% | 96,218 | 11.8% |
[ 0.5% - 1.0% ] 0.75% | 257,562 | 11.0% |
[ 0.5% - 1.0% ] 0.78% | 232,772 | 12.6% |
[ 0.5% - 1.0% ] 0.81% | 90,057 | 11.5% |
[ 0.5% - 1.0% ] 0.84% | 56,560 | 8.2% |
[ 0.5% - 1.0% ] 0.86% | 64,140 | 12.7% |
[ 0.5% - 1.0% ] 0.90% | 137,135 | 11.6% |
[ 0.5% - 1.0% ] 0.93% | 92,335 | 11.8% |
[ 0.5% - 1.0% ] 0.97% | 102,693 | 9.6% |
[ 0.5% - 1.0% ] 0.99% | 82,538 | 9.8% |
[ 1.0% - 1.5% ] 1.02% | 51,127 | 9.2% |
[ 1.0% - 1.5% ] 1.04% | 1,350 | 6.4% |
[ 1.0% - 1.5% ] 1.06% | 23,946 | 12.0% |
[ 1.0% - 1.5% ] 1.10% | 40,746 | 8.4% |
[ 1.0% - 1.5% ] 1.14% | 82,462 | 9.8% |
[ 1.0% - 1.5% ] 1.15% | 4,851 | 10.0% |
[ 1.0% - 1.5% ] 1.19% | 61,086 | 13.3% |
[ 1.0% - 1.5% ] 1.23% | 6,333 | 10.5% |
[ 1.0% - 1.5% ] 1.29% | 40,208 | 12.3% |
[ 1.0% - 1.5% ] 1.32% | 47,893 | 20.0% |
[ 1.0% - 1.5% ] 1.34% | 6,570 | 6.8% |
[ 1.0% - 1.5% ] 1.38% | 83,109 | 7.0% |
[ 1.0% - 1.5% ] 1.40% | 5,016 | 4.3% |
[ 1.0% - 1.5% ] 1.44% | 15,495 | 7.0% |
[ 1.0% - 1.5% ] 1.46% | 1,232 | 15.8% |
[ 1.0% - 1.5% ] 1.48% | 23,244 | 9.5% |
[ 1.5% - 2.0% ] 1.58% | 7,590 | 10.1% |
[ 1.5% - 2.0% ] 1.62% | 13,472 | 19.4% |
[ 1.5% - 2.0% ] 1.67% | 1,017 | 4.6% |
[ 1.5% - 2.0% ] 1.70% | 43,286 | 9.8% |
[ 1.5% - 2.0% ] 1.76% | 6,766 | 15.4% |
[ 1.5% - 2.0% ] 1.78% | 2,022 | 4.0% |
[ 1.5% - 2.0% ] 1.83% | 6,115 | 7.5% |
[ 1.5% - 2.0% ] 1.84% | 2,992 | 11.2% |
[ 1.5% - 2.0% ] 1.95% | 6,714 | 11.4% |
[ 2.0% - 2.5% ] 2.02% | 80,575 | 8.3% |
[ 2.0% - 2.5% ] 2.15% | 279 | 21.1% |
[ 2.0% - 2.5% ] 2.16% | 509 | 7.7% |
[ 2.0% - 2.5% ] 2.23% | 14,291 | 12.8% |
[ 2.0% - 2.5% ] 2.30% | 8,913 | 15.3% |
[ 2.0% - 2.5% ] 2.35% | 1,748 | 7.2% |
[ 2.0% - 2.5% ] 2.36% | 81,109 | 10.4% |
[ 2.0% - 2.5% ] 2.40% | 90,796 | 11.3% |
[ 2.0% - 2.5% ] 2.47% | 80,113 | 11.0% |
[ 2.5% - 3.0% ] 2.51% | 1,116 | 12.3% |
[ 2.5% - 3.0% ] 2.57% | 20,127 | 15.2% |
[ 2.5% - 3.0% ] 2.70% | 75,212 | 10.5% |
[ 2.5% - 3.0% ] 2.78% | 40,260 | 5.4% |
[ 3.0% - 3.5% ] 3.08% | 33,648 | 15.1% |
[ 3.0% - 3.5% ] 3.12% | 737 | 5.7% |
[ 3.0% - 3.5% ] 3.27% | 428 | 14.3% |
[ 3.5% - 4.0% ] 3.54% | 3,136 | 19.4% |
[ 4.0% - 4.5% ] 4.00% | 83,069 | 15.0% |
[ 4.0% - 4.5% ] 4.03% | 1,289 | 6.9% |
[ 4.0% - 4.5% ] 4.10% | 90,245 | 13.0% |
[ 4.5% - 5.0% ] 4.54% | 47,230 | 12.5% |
[ 4.5% - 5.0% ] 4.61% | 13,659 | 11.6% |
[ 5.5% - 6.0% ] 5.91% | 2,910 | 14.5% |