Immigrants from Uzbekistan Married-couple Households
COMPARE
Immigrants from Uzbekistan
Select to Compare
Married-couple Households
Immigrants from Uzbekistan Married-couple Households
45.4%
MARRIED-COUPLE HOUSEHOLDS
8.4/ 100
METRIC RATING
209th/ 347
METRIC RANK
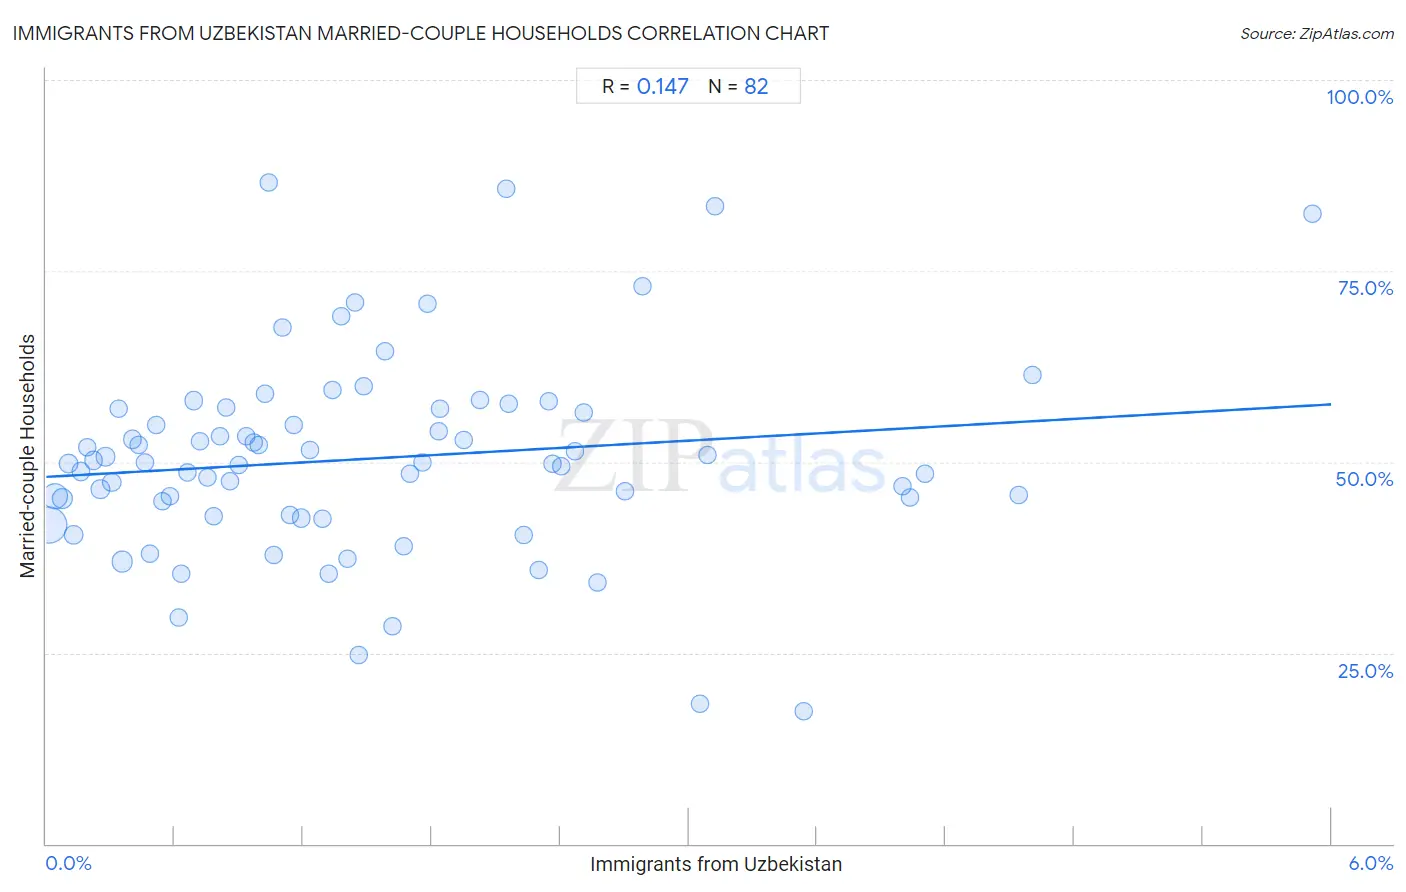
Immigrants from Uzbekistan Married-couple Households Correlation Chart
The statistical analysis conducted on geographies consisting of 118,716,463 people shows a poor positive correlation between the proportion of Immigrants from Uzbekistan and percentage of married-couple family households in the United States with a correlation coefficient (R) of 0.147 and weighted average of 45.4%. On average, for every 1% (one percent) increase in Immigrants from Uzbekistan within a typical geography, there is an increase of 1.6% in percentage of married-couple family households.
It is essential to understand that the correlation between the percentage of Immigrants from Uzbekistan and percentage of married-couple family households does not imply a direct cause-and-effect relationship. It remains uncertain whether the presence of Immigrants from Uzbekistan influences an upward or downward trend in the level of percentage of married-couple family households within an area, or if Immigrants from Uzbekistan simply ended up residing in those areas with higher or lower levels of percentage of married-couple family households due to other factors.
Demographics Similar to Immigrants from Uzbekistan by Married-couple Households
In terms of married-couple households, the demographic groups most similar to Immigrants from Uzbekistan are Hispanic or Latino (45.4%, a difference of 0.040%), Immigrants from France (45.4%, a difference of 0.050%), Cuban (45.4%, a difference of 0.090%), Immigrants from Spain (45.3%, a difference of 0.14%), and Uruguayan (45.5%, a difference of 0.23%).
| Demographics | Rating | Rank | Married-couple Households |
| Immigrants from Central America | 14.2 /100 | #202 | Poor 45.7% |
| Alaska Natives | 13.0 /100 | #203 | Poor 45.6% |
| Aleuts | 12.5 /100 | #204 | Poor 45.6% |
| Nepalese | 11.9 /100 | #205 | Poor 45.6% |
| Uruguayans | 10.4 /100 | #206 | Poor 45.5% |
| Immigrants from France | 8.8 /100 | #207 | Tragic 45.4% |
| Hispanics or Latinos | 8.7 /100 | #208 | Tragic 45.4% |
| Immigrants from Uzbekistan | 8.4 /100 | #209 | Tragic 45.4% |
| Cubans | 7.7 /100 | #210 | Tragic 45.4% |
| Immigrants from Spain | 7.3 /100 | #211 | Tragic 45.3% |
| Creek | 6.4 /100 | #212 | Tragic 45.3% |
| Yakama | 5.8 /100 | #213 | Tragic 45.2% |
| Japanese | 5.7 /100 | #214 | Tragic 45.2% |
| Immigrants from Nepal | 5.6 /100 | #215 | Tragic 45.2% |
| Immigrants from Portugal | 5.6 /100 | #216 | Tragic 45.2% |
Immigrants from Uzbekistan Married-couple Households Correlation Summary
| Measurement | Immigrants from Uzbekistan Data | Married-couple Households Data |
| Minimum | 0.011% | 17.4% |
| Maximum | 5.9% | 86.6% |
| Range | 5.9% | 69.2% |
| Mean | 1.5% | 50.4% |
| Median | 1.2% | 49.8% |
| Interquartile 25% (IQ1) | 0.62% | 43.1% |
| Interquartile 75% (IQ3) | 2.2% | 56.9% |
| Interquartile Range (IQR) | 1.5% | 13.9% |
| Standard Deviation (Sample) | 1.2% | 13.1% |
| Standard Deviation (Population) | 1.2% | 13.0% |
Correlation Details
| Immigrants from Uzbekistan Percentile | Sample Size | Married-couple Households |
[ 0.0% - 0.5% ] 0.011% | 55,989,810 | 41.7% |
[ 0.0% - 0.5% ] 0.040% | 22,612,415 | 45.4% |
[ 0.0% - 0.5% ] 0.074% | 8,363,573 | 45.2% |
[ 0.0% - 0.5% ] 0.10% | 4,891,774 | 49.7% |
[ 0.0% - 0.5% ] 0.13% | 4,627,317 | 40.5% |
[ 0.0% - 0.5% ] 0.16% | 2,388,485 | 48.8% |
[ 0.0% - 0.5% ] 0.19% | 1,439,084 | 52.0% |
[ 0.0% - 0.5% ] 0.22% | 1,433,752 | 50.2% |
[ 0.0% - 0.5% ] 0.25% | 1,263,971 | 46.4% |
[ 0.0% - 0.5% ] 0.28% | 901,897 | 50.7% |
[ 0.0% - 0.5% ] 0.31% | 425,857 | 47.3% |
[ 0.0% - 0.5% ] 0.34% | 518,173 | 57.0% |
[ 0.0% - 0.5% ] 0.36% | 9,002,227 | 36.9% |
[ 0.0% - 0.5% ] 0.40% | 363,976 | 52.9% |
[ 0.0% - 0.5% ] 0.43% | 363,231 | 52.2% |
[ 0.0% - 0.5% ] 0.46% | 338,944 | 50.0% |
[ 0.0% - 0.5% ] 0.48% | 281,789 | 38.0% |
[ 0.5% - 1.0% ] 0.51% | 216,747 | 54.9% |
[ 0.5% - 1.0% ] 0.54% | 111,316 | 44.8% |
[ 0.5% - 1.0% ] 0.58% | 220,161 | 45.5% |
[ 0.5% - 1.0% ] 0.62% | 31,481 | 29.6% |
[ 0.5% - 1.0% ] 0.63% | 99,719 | 35.4% |
[ 0.5% - 1.0% ] 0.66% | 140,451 | 48.6% |
[ 0.5% - 1.0% ] 0.69% | 114,951 | 58.0% |
[ 0.5% - 1.0% ] 0.72% | 96,218 | 52.6% |
[ 0.5% - 1.0% ] 0.75% | 257,562 | 48.0% |
[ 0.5% - 1.0% ] 0.78% | 232,772 | 42.9% |
[ 0.5% - 1.0% ] 0.81% | 90,057 | 53.3% |
[ 0.5% - 1.0% ] 0.84% | 56,560 | 57.2% |
[ 0.5% - 1.0% ] 0.86% | 64,140 | 47.5% |
[ 0.5% - 1.0% ] 0.90% | 137,135 | 49.7% |
[ 0.5% - 1.0% ] 0.93% | 92,335 | 53.4% |
[ 0.5% - 1.0% ] 0.97% | 102,693 | 52.5% |
[ 0.5% - 1.0% ] 0.99% | 82,538 | 52.2% |
[ 1.0% - 1.5% ] 1.02% | 51,127 | 58.8% |
[ 1.0% - 1.5% ] 1.04% | 1,350 | 86.6% |
[ 1.0% - 1.5% ] 1.06% | 23,946 | 37.8% |
[ 1.0% - 1.5% ] 1.10% | 40,746 | 67.6% |
[ 1.0% - 1.5% ] 1.14% | 82,462 | 43.1% |
[ 1.0% - 1.5% ] 1.15% | 4,851 | 54.8% |
[ 1.0% - 1.5% ] 1.19% | 61,086 | 42.6% |
[ 1.0% - 1.5% ] 1.23% | 6,333 | 51.5% |
[ 1.0% - 1.5% ] 1.29% | 40,208 | 42.6% |
[ 1.0% - 1.5% ] 1.32% | 47,893 | 35.3% |
[ 1.0% - 1.5% ] 1.34% | 6,570 | 59.4% |
[ 1.0% - 1.5% ] 1.38% | 83,109 | 69.1% |
[ 1.0% - 1.5% ] 1.41% | 427 | 37.4% |
[ 1.0% - 1.5% ] 1.44% | 11,015 | 70.9% |
[ 1.0% - 1.5% ] 1.46% | 1,232 | 24.6% |
[ 1.0% - 1.5% ] 1.48% | 23,244 | 59.8% |
[ 1.5% - 2.0% ] 1.58% | 7,590 | 64.4% |
[ 1.5% - 2.0% ] 1.62% | 13,472 | 28.5% |
[ 1.5% - 2.0% ] 1.67% | 1,017 | 39.0% |
[ 1.5% - 2.0% ] 1.70% | 43,286 | 48.4% |
[ 1.5% - 2.0% ] 1.76% | 6,766 | 49.8% |
[ 1.5% - 2.0% ] 1.78% | 2,022 | 70.7% |
[ 1.5% - 2.0% ] 1.83% | 6,115 | 54.0% |
[ 1.5% - 2.0% ] 1.84% | 2,992 | 56.9% |
[ 1.5% - 2.0% ] 1.95% | 6,714 | 52.8% |
[ 2.0% - 2.5% ] 2.02% | 80,575 | 58.1% |
[ 2.0% - 2.5% ] 2.15% | 279 | 85.7% |
[ 2.0% - 2.5% ] 2.16% | 509 | 57.6% |
[ 2.0% - 2.5% ] 2.23% | 14,291 | 40.5% |
[ 2.0% - 2.5% ] 2.30% | 8,913 | 35.8% |
[ 2.0% - 2.5% ] 2.35% | 1,748 | 58.0% |
[ 2.0% - 2.5% ] 2.36% | 81,109 | 49.7% |
[ 2.0% - 2.5% ] 2.40% | 90,796 | 49.4% |
[ 2.0% - 2.5% ] 2.47% | 80,113 | 51.4% |
[ 2.5% - 3.0% ] 2.51% | 1,116 | 56.4% |
[ 2.5% - 3.0% ] 2.57% | 20,127 | 34.3% |
[ 2.5% - 3.0% ] 2.70% | 75,212 | 46.1% |
[ 2.5% - 3.0% ] 2.78% | 40,260 | 73.0% |
[ 3.0% - 3.5% ] 3.05% | 16,808 | 18.4% |
[ 3.0% - 3.5% ] 3.08% | 33,648 | 50.9% |
[ 3.0% - 3.5% ] 3.12% | 737 | 83.4% |
[ 3.5% - 4.0% ] 3.54% | 3,136 | 17.4% |
[ 4.0% - 4.5% ] 4.00% | 83,069 | 46.8% |
[ 4.0% - 4.5% ] 4.03% | 1,289 | 45.3% |
[ 4.0% - 4.5% ] 4.10% | 90,245 | 48.4% |
[ 4.5% - 5.0% ] 4.54% | 47,230 | 45.7% |
[ 4.5% - 5.0% ] 4.61% | 13,659 | 61.4% |
[ 5.5% - 6.0% ] 5.91% | 2,910 | 82.5% |