Immigrants from Uzbekistan Married-Couple Family Poverty
COMPARE
Immigrants from Uzbekistan
Select to Compare
Married-Couple Family Poverty
Immigrants from Uzbekistan Married-Couple Family Poverty
6.6%
POVERTY | MARRIED-COUPLE FAMILIES
0.0/ 100
METRIC RATING
295th/ 347
METRIC RANK
Immigrants from Uzbekistan Married-Couple Family Poverty Correlation Chart
The statistical analysis conducted on geographies consisting of 118,451,122 people shows a mild positive correlation between the proportion of Immigrants from Uzbekistan and poverty level among married-couple families in the United States with a correlation coefficient (R) of 0.308 and weighted average of 6.6%. On average, for every 1% (one percent) increase in Immigrants from Uzbekistan within a typical geography, there is an increase of 1.2% in poverty level among married-couple families.
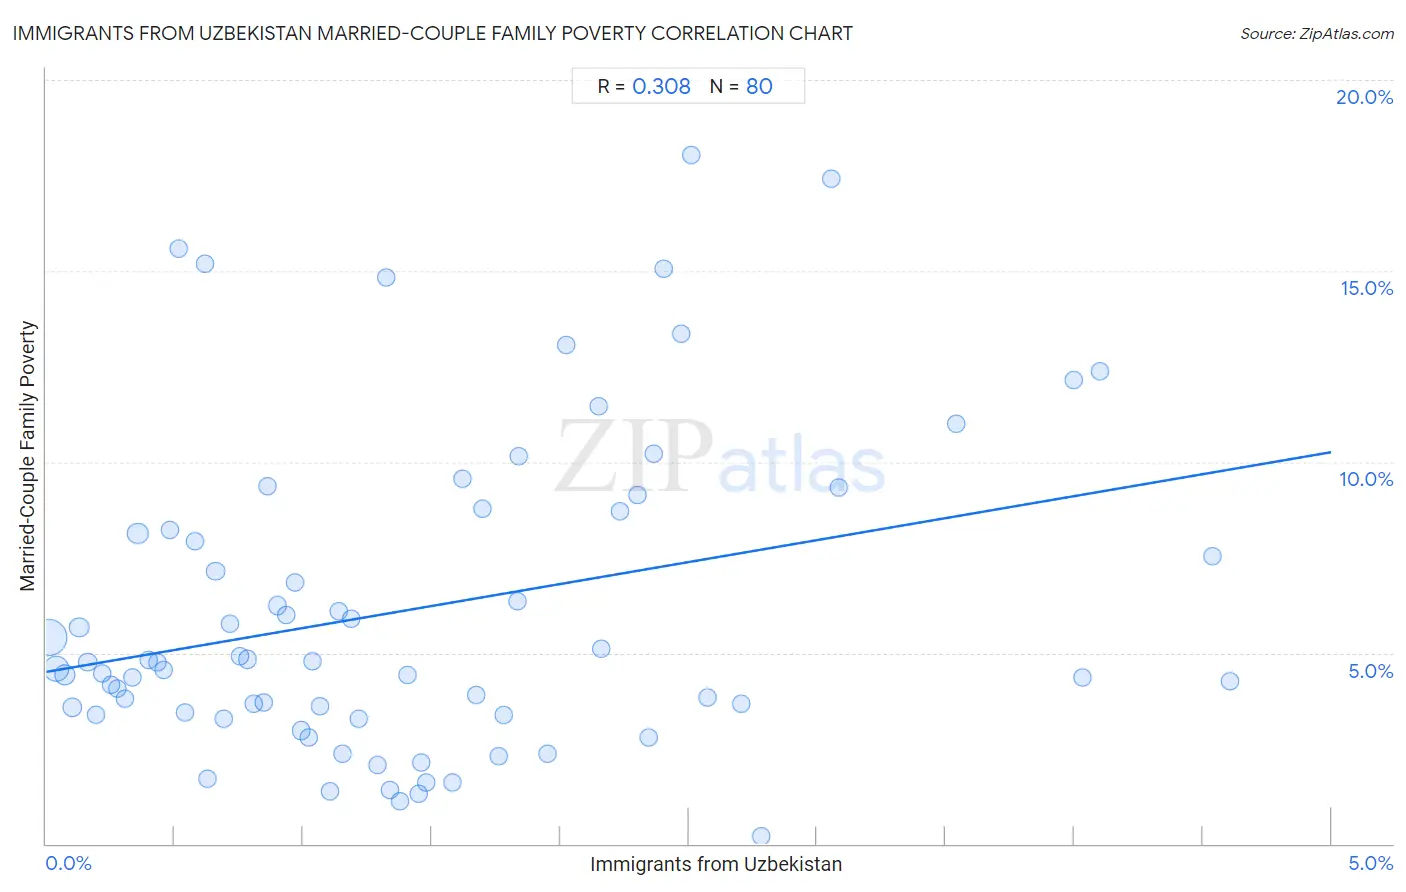
It is essential to understand that the correlation between the percentage of Immigrants from Uzbekistan and poverty level among married-couple families does not imply a direct cause-and-effect relationship. It remains uncertain whether the presence of Immigrants from Uzbekistan influences an upward or downward trend in the level of poverty level among married-couple families within an area, or if Immigrants from Uzbekistan simply ended up residing in those areas with higher or lower levels of poverty level among married-couple families due to other factors.
Demographics Similar to Immigrants from Uzbekistan by Married-Couple Family Poverty
In terms of married-couple family poverty, the demographic groups most similar to Immigrants from Uzbekistan are U.S. Virgin Islander (6.6%, a difference of 0.10%), Kiowa (6.6%, a difference of 0.11%), Immigrants from Guyana (6.7%, a difference of 0.18%), Bahamian (6.6%, a difference of 0.29%), and Nicaraguan (6.7%, a difference of 0.73%).
| Demographics | Rating | Rank | Married-Couple Family Poverty |
| Salvadorans | 0.0 /100 | #288 | Tragic 6.5% |
| Nepalese | 0.0 /100 | #289 | Tragic 6.5% |
| Immigrants from Barbados | 0.0 /100 | #290 | Tragic 6.5% |
| Belizeans | 0.0 /100 | #291 | Tragic 6.5% |
| Immigrants from Lebanon | 0.0 /100 | #292 | Tragic 6.6% |
| Arapaho | 0.0 /100 | #293 | Tragic 6.6% |
| Bahamians | 0.0 /100 | #294 | Tragic 6.6% |
| Immigrants from Uzbekistan | 0.0 /100 | #295 | Tragic 6.6% |
| U.S. Virgin Islanders | 0.0 /100 | #296 | Tragic 6.6% |
| Kiowa | 0.0 /100 | #297 | Tragic 6.6% |
| Immigrants from Guyana | 0.0 /100 | #298 | Tragic 6.7% |
| Nicaraguans | 0.0 /100 | #299 | Tragic 6.7% |
| Immigrants from Belize | 0.0 /100 | #300 | Tragic 6.7% |
| Central Americans | 0.0 /100 | #301 | Tragic 6.7% |
| Immigrants from Ecuador | 0.0 /100 | #302 | Tragic 6.7% |
Immigrants from Uzbekistan Married-Couple Family Poverty Correlation Summary
| Measurement | Immigrants from Uzbekistan Data | Married-Couple Family Poverty Data |
| Minimum | 0.011% | 0.18% |
| Maximum | 4.6% | 18.0% |
| Range | 4.6% | 17.8% |
| Mean | 1.4% | 6.2% |
| Median | 1.2% | 4.7% |
| Interquartile 25% (IQ1) | 0.60% | 3.4% |
| Interquartile 75% (IQ3) | 2.1% | 8.5% |
| Interquartile Range (IQR) | 1.5% | 5.0% |
| Standard Deviation (Sample) | 1.1% | 4.1% |
| Standard Deviation (Population) | 1.1% | 4.1% |
Correlation Details
| Immigrants from Uzbekistan Percentile | Sample Size | Married-Couple Family Poverty |
[ 0.0% - 0.5% ] 0.011% | 55,965,114 | 5.4% |
[ 0.0% - 0.5% ] 0.040% | 22,604,557 | 4.6% |
[ 0.0% - 0.5% ] 0.074% | 8,350,291 | 4.4% |
[ 0.0% - 0.5% ] 0.10% | 4,833,854 | 3.6% |
[ 0.0% - 0.5% ] 0.13% | 4,627,317 | 5.7% |
[ 0.0% - 0.5% ] 0.16% | 2,385,796 | 4.8% |
[ 0.0% - 0.5% ] 0.19% | 1,439,084 | 3.4% |
[ 0.0% - 0.5% ] 0.22% | 1,406,878 | 4.5% |
[ 0.0% - 0.5% ] 0.25% | 1,244,085 | 4.2% |
[ 0.0% - 0.5% ] 0.28% | 901,897 | 4.1% |
[ 0.0% - 0.5% ] 0.31% | 406,081 | 3.8% |
[ 0.0% - 0.5% ] 0.34% | 512,191 | 4.4% |
[ 0.0% - 0.5% ] 0.36% | 9,002,227 | 8.1% |
[ 0.0% - 0.5% ] 0.40% | 362,037 | 4.8% |
[ 0.0% - 0.5% ] 0.43% | 363,231 | 4.7% |
[ 0.0% - 0.5% ] 0.46% | 330,476 | 4.5% |
[ 0.0% - 0.5% ] 0.48% | 279,906 | 8.2% |
[ 0.5% - 1.0% ] 0.51% | 211,529 | 15.6% |
[ 0.5% - 1.0% ] 0.54% | 111,316 | 3.4% |
[ 0.5% - 1.0% ] 0.58% | 220,161 | 7.9% |
[ 0.5% - 1.0% ] 0.62% | 31,481 | 15.2% |
[ 0.5% - 1.0% ] 0.63% | 99,719 | 1.7% |
[ 0.5% - 1.0% ] 0.66% | 133,699 | 7.1% |
[ 0.5% - 1.0% ] 0.69% | 114,951 | 3.3% |
[ 0.5% - 1.0% ] 0.72% | 96,218 | 5.8% |
[ 0.5% - 1.0% ] 0.75% | 254,139 | 4.9% |
[ 0.5% - 1.0% ] 0.78% | 232,772 | 4.8% |
[ 0.5% - 1.0% ] 0.81% | 90,057 | 3.7% |
[ 0.5% - 1.0% ] 0.85% | 37,249 | 3.7% |
[ 0.5% - 1.0% ] 0.86% | 62,412 | 9.4% |
[ 0.5% - 1.0% ] 0.90% | 119,256 | 6.2% |
[ 0.5% - 1.0% ] 0.93% | 92,335 | 6.0% |
[ 0.5% - 1.0% ] 0.97% | 102,693 | 6.8% |
[ 0.5% - 1.0% ] 0.99% | 82,538 | 3.0% |
[ 1.0% - 1.5% ] 1.02% | 51,127 | 2.8% |
[ 1.0% - 1.5% ] 1.04% | 1,350 | 4.8% |
[ 1.0% - 1.5% ] 1.06% | 23,946 | 3.6% |
[ 1.0% - 1.5% ] 1.10% | 40,746 | 1.4% |
[ 1.0% - 1.5% ] 1.14% | 82,462 | 6.1% |
[ 1.0% - 1.5% ] 1.15% | 1,474 | 2.3% |
[ 1.0% - 1.5% ] 1.19% | 55,418 | 5.9% |
[ 1.0% - 1.5% ] 1.22% | 1,973 | 3.3% |
[ 1.0% - 1.5% ] 1.29% | 40,208 | 2.1% |
[ 1.0% - 1.5% ] 1.32% | 47,893 | 14.8% |
[ 1.0% - 1.5% ] 1.34% | 6,570 | 1.4% |
[ 1.0% - 1.5% ] 1.38% | 83,109 | 1.1% |
[ 1.0% - 1.5% ] 1.41% | 427 | 4.4% |
[ 1.0% - 1.5% ] 1.45% | 8,290 | 1.3% |
[ 1.0% - 1.5% ] 1.46% | 1,232 | 2.1% |
[ 1.0% - 1.5% ] 1.48% | 23,244 | 1.6% |
[ 1.5% - 2.0% ] 1.58% | 7,590 | 1.6% |
[ 1.5% - 2.0% ] 1.62% | 13,472 | 9.6% |
[ 1.5% - 2.0% ] 1.67% | 1,017 | 3.9% |
[ 1.5% - 2.0% ] 1.70% | 43,286 | 8.8% |
[ 1.5% - 2.0% ] 1.76% | 6,766 | 2.3% |
[ 1.5% - 2.0% ] 1.78% | 2,022 | 3.4% |
[ 1.5% - 2.0% ] 1.83% | 6,115 | 6.3% |
[ 1.5% - 2.0% ] 1.84% | 2,992 | 10.1% |
[ 1.5% - 2.0% ] 1.95% | 6,714 | 2.4% |
[ 2.0% - 2.5% ] 2.02% | 80,575 | 13.1% |
[ 2.0% - 2.5% ] 2.15% | 279 | 11.5% |
[ 2.0% - 2.5% ] 2.16% | 509 | 5.1% |
[ 2.0% - 2.5% ] 2.23% | 14,291 | 8.7% |
[ 2.0% - 2.5% ] 2.30% | 8,913 | 9.1% |
[ 2.0% - 2.5% ] 2.35% | 1,748 | 2.8% |
[ 2.0% - 2.5% ] 2.36% | 81,109 | 10.2% |
[ 2.0% - 2.5% ] 2.40% | 90,796 | 15.0% |
[ 2.0% - 2.5% ] 2.47% | 80,113 | 13.3% |
[ 2.5% - 3.0% ] 2.51% | 1,116 | 18.0% |
[ 2.5% - 3.0% ] 2.57% | 20,127 | 3.8% |
[ 2.5% - 3.0% ] 2.70% | 75,212 | 3.7% |
[ 2.5% - 3.0% ] 2.78% | 40,260 | 0.18% |
[ 3.0% - 3.5% ] 3.05% | 16,808 | 17.4% |
[ 3.0% - 3.5% ] 3.08% | 33,648 | 9.3% |
[ 3.5% - 4.0% ] 3.54% | 3,136 | 11.0% |
[ 4.0% - 4.5% ] 4.00% | 83,069 | 12.1% |
[ 4.0% - 4.5% ] 4.03% | 1,289 | 4.4% |
[ 4.0% - 4.5% ] 4.10% | 90,245 | 12.4% |
[ 4.5% - 5.0% ] 4.54% | 47,230 | 7.5% |
[ 4.5% - 5.0% ] 4.61% | 13,659 | 4.3% |