Immigrants from Uzbekistan Disability Age 5 to 17
COMPARE
Immigrants from Uzbekistan
Select to Compare
Disability Age 5 to 17
Immigrants from Uzbekistan Disability Age 5 to 17
4.8%
DISABILITY | AGE 5 TO 17
100.0/ 100
METRIC RATING
19th/ 347
METRIC RANK
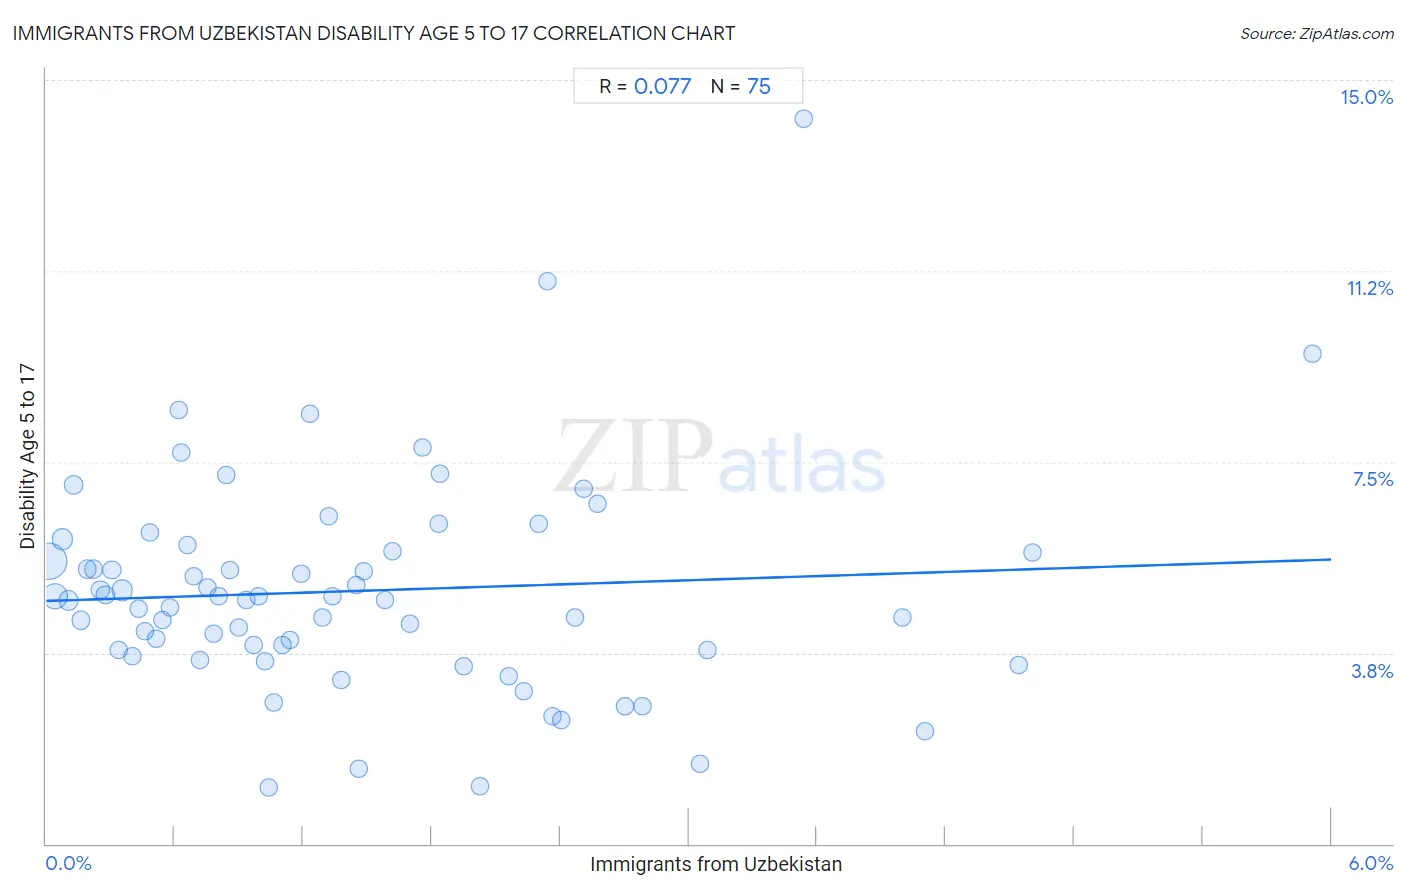
Immigrants from Uzbekistan Disability Age 5 to 17 Correlation Chart
The statistical analysis conducted on geographies consisting of 118,326,230 people shows a slight positive correlation between the proportion of Immigrants from Uzbekistan and percentage of population with a disability between the ages 5 and 17 in the United States with a correlation coefficient (R) of 0.077 and weighted average of 4.8%. On average, for every 1% (one percent) increase in Immigrants from Uzbekistan within a typical geography, there is an increase of 0.14% in percentage of population with a disability between the ages 5 and 17.
It is essential to understand that the correlation between the percentage of Immigrants from Uzbekistan and percentage of population with a disability between the ages 5 and 17 does not imply a direct cause-and-effect relationship. It remains uncertain whether the presence of Immigrants from Uzbekistan influences an upward or downward trend in the level of percentage of population with a disability between the ages 5 and 17 within an area, or if Immigrants from Uzbekistan simply ended up residing in those areas with higher or lower levels of percentage of population with a disability between the ages 5 and 17 due to other factors.
Demographics Similar to Immigrants from Uzbekistan by Disability Age 5 to 17
In terms of disability age 5 to 17, the demographic groups most similar to Immigrants from Uzbekistan are Burmese (4.8%, a difference of 0.38%), Immigrants from South Central Asia (4.7%, a difference of 0.49%), Arapaho (4.7%, a difference of 0.51%), Yup'ik (4.8%, a difference of 0.60%), and Asian (4.8%, a difference of 0.94%).
| Demographics | Rating | Rank | Disability Age 5 to 17 |
| Iranians | 100.0 /100 | #12 | Exceptional 4.6% |
| Thais | 100.0 /100 | #13 | Exceptional 4.7% |
| Immigrants from Korea | 100.0 /100 | #14 | Exceptional 4.7% |
| Chinese | 100.0 /100 | #15 | Exceptional 4.7% |
| Immigrants from Singapore | 100.0 /100 | #16 | Exceptional 4.7% |
| Arapaho | 100.0 /100 | #17 | Exceptional 4.7% |
| Immigrants from South Central Asia | 100.0 /100 | #18 | Exceptional 4.7% |
| Immigrants from Uzbekistan | 100.0 /100 | #19 | Exceptional 4.8% |
| Burmese | 100.0 /100 | #20 | Exceptional 4.8% |
| Yup'ik | 100.0 /100 | #21 | Exceptional 4.8% |
| Asians | 100.0 /100 | #22 | Exceptional 4.8% |
| Immigrants from Bolivia | 100.0 /100 | #23 | Exceptional 4.8% |
| Immigrants from Lebanon | 100.0 /100 | #24 | Exceptional 4.8% |
| Immigrants from Asia | 100.0 /100 | #25 | Exceptional 4.8% |
| Bhutanese | 100.0 /100 | #26 | Exceptional 4.9% |
Immigrants from Uzbekistan Disability Age 5 to 17 Correlation Summary
| Measurement | Immigrants from Uzbekistan Data | Disability Age 5 to 17 Data |
| Minimum | 0.011% | 1.1% |
| Maximum | 5.9% | 14.2% |
| Range | 5.9% | 13.1% |
| Mean | 1.4% | 5.0% |
| Median | 1.1% | 4.8% |
| Interquartile 25% (IQ1) | 0.54% | 3.8% |
| Interquartile 75% (IQ3) | 2.2% | 5.7% |
| Interquartile Range (IQR) | 1.6% | 1.9% |
| Standard Deviation (Sample) | 1.2% | 2.1% |
| Standard Deviation (Population) | 1.2% | 2.1% |
Correlation Details
| Immigrants from Uzbekistan Percentile | Sample Size | Disability Age 5 to 17 |
[ 0.0% - 0.5% ] 0.011% | 55,954,563 | 5.5% |
[ 0.0% - 0.5% ] 0.040% | 22,550,351 | 4.9% |
[ 0.0% - 0.5% ] 0.074% | 8,347,785 | 6.0% |
[ 0.0% - 0.5% ] 0.10% | 4,854,507 | 4.8% |
[ 0.0% - 0.5% ] 0.13% | 4,537,296 | 7.0% |
[ 0.0% - 0.5% ] 0.16% | 2,348,481 | 4.4% |
[ 0.0% - 0.5% ] 0.19% | 1,415,988 | 5.4% |
[ 0.0% - 0.5% ] 0.22% | 1,439,338 | 5.4% |
[ 0.0% - 0.5% ] 0.25% | 1,243,843 | 5.0% |
[ 0.0% - 0.5% ] 0.28% | 877,272 | 4.9% |
[ 0.0% - 0.5% ] 0.31% | 425,857 | 5.4% |
[ 0.0% - 0.5% ] 0.34% | 518,173 | 3.8% |
[ 0.0% - 0.5% ] 0.36% | 9,002,227 | 5.0% |
[ 0.0% - 0.5% ] 0.40% | 363,481 | 3.7% |
[ 0.0% - 0.5% ] 0.43% | 363,231 | 4.6% |
[ 0.0% - 0.5% ] 0.46% | 338,944 | 4.2% |
[ 0.0% - 0.5% ] 0.48% | 278,043 | 6.1% |
[ 0.5% - 1.0% ] 0.51% | 215,191 | 4.0% |
[ 0.5% - 1.0% ] 0.54% | 106,291 | 4.4% |
[ 0.5% - 1.0% ] 0.58% | 220,161 | 4.6% |
[ 0.5% - 1.0% ] 0.62% | 31,481 | 8.5% |
[ 0.5% - 1.0% ] 0.63% | 99,719 | 7.7% |
[ 0.5% - 1.0% ] 0.66% | 140,451 | 5.9% |
[ 0.5% - 1.0% ] 0.69% | 114,951 | 5.2% |
[ 0.5% - 1.0% ] 0.72% | 96,218 | 3.6% |
[ 0.5% - 1.0% ] 0.75% | 254,139 | 5.0% |
[ 0.5% - 1.0% ] 0.78% | 227,619 | 4.1% |
[ 0.5% - 1.0% ] 0.81% | 89,203 | 4.9% |
[ 0.5% - 1.0% ] 0.84% | 56,560 | 7.2% |
[ 0.5% - 1.0% ] 0.86% | 62,412 | 5.4% |
[ 0.5% - 1.0% ] 0.90% | 137,135 | 4.2% |
[ 0.5% - 1.0% ] 0.93% | 92,335 | 4.8% |
[ 0.5% - 1.0% ] 0.97% | 102,693 | 3.9% |
[ 0.5% - 1.0% ] 0.99% | 82,538 | 4.9% |
[ 1.0% - 1.5% ] 1.02% | 51,127 | 3.6% |
[ 1.0% - 1.5% ] 1.04% | 1,350 | 1.1% |
[ 1.0% - 1.5% ] 1.06% | 23,946 | 2.8% |
[ 1.0% - 1.5% ] 1.11% | 33,096 | 3.9% |
[ 1.0% - 1.5% ] 1.14% | 82,462 | 4.0% |
[ 1.0% - 1.5% ] 1.19% | 61,086 | 5.3% |
[ 1.0% - 1.5% ] 1.23% | 5,930 | 8.4% |
[ 1.0% - 1.5% ] 1.29% | 40,208 | 4.4% |
[ 1.0% - 1.5% ] 1.32% | 47,893 | 6.4% |
[ 1.0% - 1.5% ] 1.34% | 6,570 | 4.8% |
[ 1.0% - 1.5% ] 1.38% | 83,109 | 3.2% |
[ 1.0% - 1.5% ] 1.45% | 8,290 | 5.1% |
[ 1.0% - 1.5% ] 1.46% | 1,232 | 1.5% |
[ 1.0% - 1.5% ] 1.48% | 23,244 | 5.4% |
[ 1.5% - 2.0% ] 1.58% | 7,590 | 4.8% |
[ 1.5% - 2.0% ] 1.62% | 10,380 | 5.7% |
[ 1.5% - 2.0% ] 1.70% | 43,286 | 4.3% |
[ 1.5% - 2.0% ] 1.76% | 6,766 | 7.8% |
[ 1.5% - 2.0% ] 1.83% | 6,115 | 6.3% |
[ 1.5% - 2.0% ] 1.84% | 2,992 | 7.3% |
[ 1.5% - 2.0% ] 1.95% | 6,714 | 3.5% |
[ 2.0% - 2.5% ] 2.02% | 80,575 | 1.1% |
[ 2.0% - 2.5% ] 2.16% | 509 | 3.3% |
[ 2.0% - 2.5% ] 2.23% | 14,291 | 3.0% |
[ 2.0% - 2.5% ] 2.30% | 8,913 | 6.3% |
[ 2.0% - 2.5% ] 2.34% | 641 | 11.0% |
[ 2.0% - 2.5% ] 2.36% | 81,109 | 2.5% |
[ 2.0% - 2.5% ] 2.40% | 90,796 | 2.4% |
[ 2.0% - 2.5% ] 2.47% | 80,113 | 4.5% |
[ 2.5% - 3.0% ] 2.51% | 1,116 | 7.0% |
[ 2.5% - 3.0% ] 2.57% | 20,127 | 6.7% |
[ 2.5% - 3.0% ] 2.70% | 75,212 | 2.7% |
[ 2.5% - 3.0% ] 2.78% | 40,260 | 2.7% |
[ 3.0% - 3.5% ] 3.05% | 16,808 | 1.6% |
[ 3.0% - 3.5% ] 3.08% | 33,648 | 3.8% |
[ 3.5% - 4.0% ] 3.54% | 3,136 | 14.2% |
[ 4.0% - 4.5% ] 4.00% | 83,069 | 4.4% |
[ 4.0% - 4.5% ] 4.10% | 90,245 | 2.2% |
[ 4.5% - 5.0% ] 4.54% | 47,230 | 3.5% |
[ 4.5% - 5.0% ] 4.61% | 13,659 | 5.7% |
[ 5.5% - 6.0% ] 5.91% | 2,910 | 9.6% |