Immigrants from Jordan Self-Care Disability
COMPARE
Immigrants from Jordan
Select to Compare
Self-Care Disability
Immigrants from Jordan Self-Care Disability
2.4%
SELF-CARE DISABILITY
97.7/ 100
METRIC RATING
91st/ 347
METRIC RANK
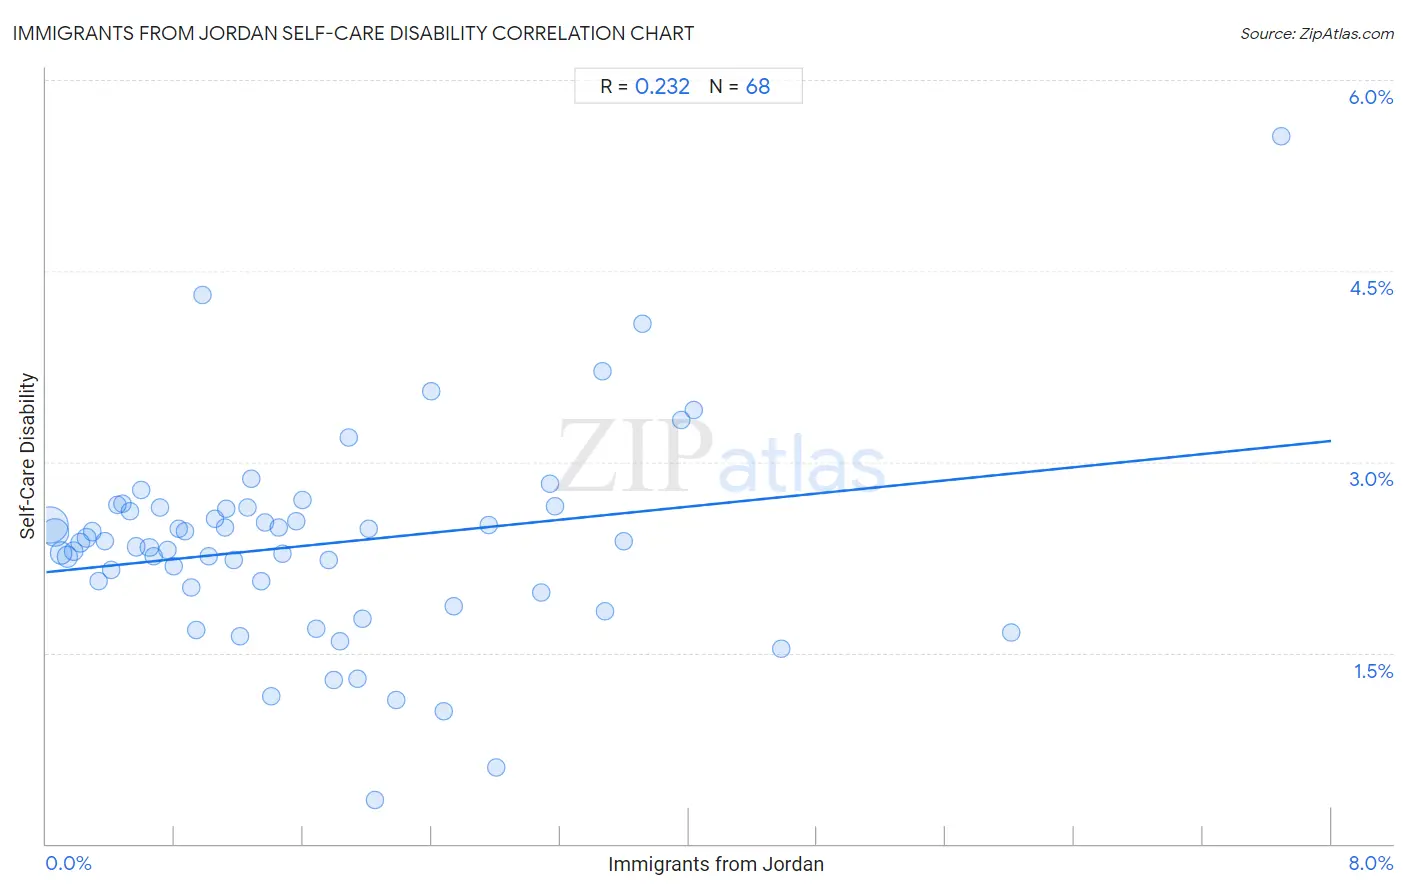
Immigrants from Jordan Self-Care Disability Correlation Chart
The statistical analysis conducted on geographies consisting of 181,224,885 people shows a weak positive correlation between the proportion of Immigrants from Jordan and percentage of population with self-care disability in the United States with a correlation coefficient (R) of 0.232 and weighted average of 2.4%. On average, for every 1% (one percent) increase in Immigrants from Jordan within a typical geography, there is an increase of 0.13% in percentage of population with self-care disability.
It is essential to understand that the correlation between the percentage of Immigrants from Jordan and percentage of population with self-care disability does not imply a direct cause-and-effect relationship. It remains uncertain whether the presence of Immigrants from Jordan influences an upward or downward trend in the level of percentage of population with self-care disability within an area, or if Immigrants from Jordan simply ended up residing in those areas with higher or lower levels of percentage of population with self-care disability due to other factors.
Demographics Similar to Immigrants from Jordan by Self-Care Disability
In terms of self-care disability, the demographic groups most similar to Immigrants from Jordan are Immigrants from Czechoslovakia (2.4%, a difference of 0.010%), Icelander (2.4%, a difference of 0.14%), Immigrants from Congo (2.4%, a difference of 0.15%), Sierra Leonean (2.4%, a difference of 0.20%), and Lithuanian (2.4%, a difference of 0.20%).
| Demographics | Rating | Rank | Self-Care Disability |
| Immigrants from Spain | 98.7 /100 | #84 | Exceptional 2.3% |
| Estonians | 98.3 /100 | #85 | Exceptional 2.3% |
| Immigrants from Northern Africa | 98.2 /100 | #86 | Exceptional 2.3% |
| Sierra Leoneans | 98.0 /100 | #87 | Exceptional 2.4% |
| Lithuanians | 98.0 /100 | #88 | Exceptional 2.4% |
| Immigrants from Congo | 98.0 /100 | #89 | Exceptional 2.4% |
| Immigrants from Czechoslovakia | 97.7 /100 | #90 | Exceptional 2.4% |
| Immigrants from Jordan | 97.7 /100 | #91 | Exceptional 2.4% |
| Icelanders | 97.4 /100 | #92 | Exceptional 2.4% |
| Immigrants from Latvia | 97.0 /100 | #93 | Exceptional 2.4% |
| Macedonians | 96.9 /100 | #94 | Exceptional 2.4% |
| Immigrants from Asia | 96.9 /100 | #95 | Exceptional 2.4% |
| Immigrants from Chile | 96.7 /100 | #96 | Exceptional 2.4% |
| Swiss | 96.6 /100 | #97 | Exceptional 2.4% |
| Immigrants from Poland | 96.4 /100 | #98 | Exceptional 2.4% |
Immigrants from Jordan Self-Care Disability Correlation Summary
| Measurement | Immigrants from Jordan Data | Self-Care Disability Data |
| Minimum | 0.021% | 0.35% |
| Maximum | 7.7% | 5.6% |
| Range | 7.7% | 5.2% |
| Mean | 1.7% | 2.4% |
| Median | 1.3% | 2.4% |
| Interquartile 25% (IQ1) | 0.66% | 2.0% |
| Interquartile 75% (IQ3) | 2.3% | 2.6% |
| Interquartile Range (IQR) | 1.6% | 0.64% |
| Standard Deviation (Sample) | 1.4% | 0.80% |
| Standard Deviation (Population) | 1.4% | 0.80% |
Correlation Details
| Immigrants from Jordan Percentile | Sample Size | Self-Care Disability |
[ 0.0% - 0.5% ] 0.021% | 83,069,791 | 2.5% |
[ 0.0% - 0.5% ] 0.057% | 44,510,240 | 2.4% |
[ 0.0% - 0.5% ] 0.094% | 18,159,664 | 2.3% |
[ 0.0% - 0.5% ] 0.13% | 11,969,970 | 2.3% |
[ 0.0% - 0.5% ] 0.17% | 6,007,812 | 2.3% |
[ 0.0% - 0.5% ] 0.21% | 3,675,120 | 2.4% |
[ 0.0% - 0.5% ] 0.25% | 2,755,180 | 2.4% |
[ 0.0% - 0.5% ] 0.29% | 2,191,677 | 2.5% |
[ 0.0% - 0.5% ] 0.33% | 1,215,731 | 2.1% |
[ 0.0% - 0.5% ] 0.36% | 1,138,839 | 2.4% |
[ 0.0% - 0.5% ] 0.40% | 805,480 | 2.2% |
[ 0.0% - 0.5% ] 0.44% | 1,243,678 | 2.7% |
[ 0.0% - 0.5% ] 0.48% | 337,325 | 2.7% |
[ 0.5% - 1.0% ] 0.52% | 469,065 | 2.6% |
[ 0.5% - 1.0% ] 0.56% | 415,682 | 2.3% |
[ 0.5% - 1.0% ] 0.59% | 423,170 | 2.8% |
[ 0.5% - 1.0% ] 0.64% | 360,990 | 2.3% |
[ 0.5% - 1.0% ] 0.67% | 277,337 | 2.3% |
[ 0.5% - 1.0% ] 0.71% | 160,740 | 2.6% |
[ 0.5% - 1.0% ] 0.75% | 282,201 | 2.3% |
[ 0.5% - 1.0% ] 0.79% | 167,823 | 2.2% |
[ 0.5% - 1.0% ] 0.83% | 48,630 | 2.5% |
[ 0.5% - 1.0% ] 0.86% | 110,348 | 2.5% |
[ 0.5% - 1.0% ] 0.90% | 176,938 | 2.0% |
[ 0.5% - 1.0% ] 0.93% | 85,562 | 1.7% |
[ 0.5% - 1.0% ] 0.98% | 7,782 | 4.3% |
[ 1.0% - 1.5% ] 1.01% | 74,840 | 2.3% |
[ 1.0% - 1.5% ] 1.05% | 10,403 | 2.5% |
[ 1.0% - 1.5% ] 1.11% | 138,607 | 2.5% |
[ 1.0% - 1.5% ] 1.12% | 82,468 | 2.6% |
[ 1.0% - 1.5% ] 1.17% | 52,627 | 2.2% |
[ 1.0% - 1.5% ] 1.21% | 92,277 | 1.6% |
[ 1.0% - 1.5% ] 1.25% | 83,024 | 2.6% |
[ 1.0% - 1.5% ] 1.28% | 64,439 | 2.9% |
[ 1.0% - 1.5% ] 1.33% | 44,281 | 2.1% |
[ 1.0% - 1.5% ] 1.36% | 37,601 | 2.5% |
[ 1.0% - 1.5% ] 1.40% | 54,590 | 1.2% |
[ 1.0% - 1.5% ] 1.44% | 28,464 | 2.5% |
[ 1.0% - 1.5% ] 1.47% | 14,894 | 2.3% |
[ 1.5% - 2.0% ] 1.56% | 8,220 | 2.5% |
[ 1.5% - 2.0% ] 1.59% | 36,556 | 2.7% |
[ 1.5% - 2.0% ] 1.68% | 12,525 | 1.7% |
[ 1.5% - 2.0% ] 1.76% | 16,613 | 2.2% |
[ 1.5% - 2.0% ] 1.79% | 51,537 | 1.3% |
[ 1.5% - 2.0% ] 1.83% | 25,489 | 1.6% |
[ 1.5% - 2.0% ] 1.88% | 1,221 | 3.2% |
[ 1.5% - 2.0% ] 1.94% | 21,760 | 1.3% |
[ 1.5% - 2.0% ] 1.97% | 6,496 | 1.8% |
[ 2.0% - 2.5% ] 2.01% | 14,915 | 2.5% |
[ 2.0% - 2.5% ] 2.05% | 6,549 | 0.35% |
[ 2.0% - 2.5% ] 2.18% | 2,160 | 1.1% |
[ 2.0% - 2.5% ] 2.40% | 8,171 | 3.5% |
[ 2.0% - 2.5% ] 2.47% | 7,763 | 1.0% |
[ 2.5% - 3.0% ] 2.54% | 13,291 | 1.9% |
[ 2.5% - 3.0% ] 2.76% | 15,452 | 2.5% |
[ 2.5% - 3.0% ] 2.80% | 9,960 | 0.60% |
[ 3.0% - 3.5% ] 3.08% | 29,883 | 2.0% |
[ 3.0% - 3.5% ] 3.14% | 3,317 | 2.8% |
[ 3.0% - 3.5% ] 3.16% | 8,535 | 2.7% |
[ 3.0% - 3.5% ] 3.46% | 7,804 | 3.7% |
[ 3.0% - 3.5% ] 3.48% | 28,568 | 1.8% |
[ 3.5% - 4.0% ] 3.60% | 8,919 | 2.4% |
[ 3.5% - 4.0% ] 3.71% | 2,453 | 4.1% |
[ 3.5% - 4.0% ] 3.95% | 11,084 | 3.3% |
[ 4.0% - 4.5% ] 4.03% | 10,859 | 3.4% |
[ 4.5% - 5.0% ] 4.58% | 1,289 | 1.5% |
[ 6.0% - 6.5% ] 6.01% | 8,024 | 1.7% |
[ 7.5% - 8.0% ] 7.69% | 182 | 5.6% |