Immigrants from Jordan 4 or more Vehicles in Household
COMPARE
Immigrants from Jordan
Select to Compare
4 or more Vehicles in Household
Immigrants from Jordan 4 or more Vehicles in Household
6.5%
4+ VEHICLES AVAILABLE
73.7/ 100
METRIC RATING
148th/ 347
METRIC RANK
Immigrants from Jordan 4 or more Vehicles in Household Correlation Chart
The statistical analysis conducted on geographies consisting of 180,706,112 people shows a slight positive correlation between the proportion of Immigrants from Jordan and percentage of households with 4 or more vehicles available in the United States with a correlation coefficient (R) of 0.060 and weighted average of 6.5%. On average, for every 1% (one percent) increase in Immigrants from Jordan within a typical geography, there is an increase of 0.10% in percentage of households with 4 or more vehicles available.
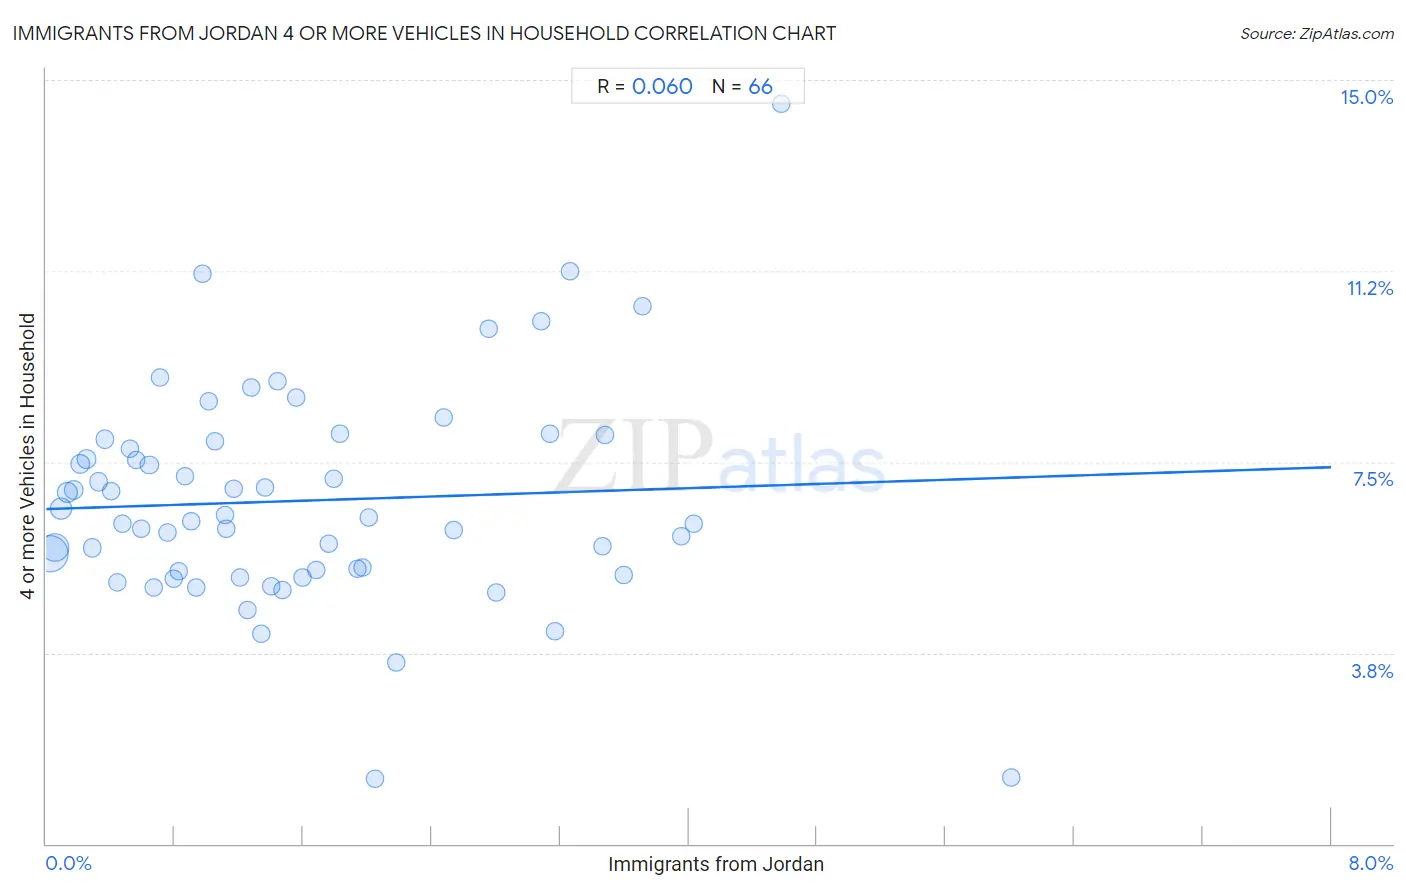
It is essential to understand that the correlation between the percentage of Immigrants from Jordan and percentage of households with 4 or more vehicles available does not imply a direct cause-and-effect relationship. It remains uncertain whether the presence of Immigrants from Jordan influences an upward or downward trend in the level of percentage of households with 4 or more vehicles available within an area, or if Immigrants from Jordan simply ended up residing in those areas with higher or lower levels of percentage of households with 4 or more vehicles available due to other factors.
Demographics Similar to Immigrants from Jordan by 4 or more Vehicles in Household
In terms of 4 or more vehicles in household, the demographic groups most similar to Immigrants from Jordan are Greek (6.5%, a difference of 0.0%), Immigrants from Iran (6.5%, a difference of 0.040%), New Zealander (6.5%, a difference of 0.040%), Immigrants from Costa Rica (6.5%, a difference of 0.090%), and Immigrants from Hong Kong (6.5%, a difference of 0.18%).
| Demographics | Rating | Rank | 4 or more Vehicles in Household |
| Australians | 80.8 /100 | #141 | Excellent 6.6% |
| Immigrants from Iraq | 79.4 /100 | #142 | Good 6.5% |
| Immigrants from Canada | 78.6 /100 | #143 | Good 6.5% |
| Immigrants from North America | 78.5 /100 | #144 | Good 6.5% |
| Croatians | 77.8 /100 | #145 | Good 6.5% |
| Immigrants from Costa Rica | 74.4 /100 | #146 | Good 6.5% |
| Immigrants from Iran | 73.9 /100 | #147 | Good 6.5% |
| Immigrants from Jordan | 73.7 /100 | #148 | Good 6.5% |
| Greeks | 73.6 /100 | #149 | Good 6.5% |
| New Zealanders | 73.3 /100 | #150 | Good 6.5% |
| Immigrants from Hong Kong | 72.2 /100 | #151 | Good 6.5% |
| Yuman | 72.1 /100 | #152 | Good 6.5% |
| Immigrants from Armenia | 71.2 /100 | #153 | Good 6.5% |
| Central American Indians | 71.1 /100 | #154 | Good 6.5% |
| Iroquois | 70.4 /100 | #155 | Good 6.5% |
Immigrants from Jordan 4 or more Vehicles in Household Correlation Summary
| Measurement | Immigrants from Jordan Data | 4 or more Vehicles in Household Data |
| Minimum | 0.021% | 1.3% |
| Maximum | 6.0% | 14.5% |
| Range | 6.0% | 13.3% |
| Mean | 1.6% | 6.7% |
| Median | 1.3% | 6.4% |
| Interquartile 25% (IQ1) | 0.64% | 5.3% |
| Interquartile 75% (IQ3) | 2.2% | 7.9% |
| Interquartile Range (IQR) | 1.5% | 2.6% |
| Standard Deviation (Sample) | 1.3% | 2.2% |
| Standard Deviation (Population) | 1.3% | 2.2% |
Correlation Details
| Immigrants from Jordan Percentile | Sample Size | 4 or more Vehicles in Household |
[ 0.0% - 0.5% ] 0.021% | 82,943,754 | 5.7% |
[ 0.0% - 0.5% ] 0.057% | 44,318,346 | 5.8% |
[ 0.0% - 0.5% ] 0.094% | 18,094,240 | 6.6% |
[ 0.0% - 0.5% ] 0.13% | 11,900,515 | 6.9% |
[ 0.0% - 0.5% ] 0.17% | 5,996,299 | 7.0% |
[ 0.0% - 0.5% ] 0.21% | 3,653,385 | 7.5% |
[ 0.0% - 0.5% ] 0.25% | 2,755,180 | 7.6% |
[ 0.0% - 0.5% ] 0.29% | 2,171,124 | 5.8% |
[ 0.0% - 0.5% ] 0.33% | 1,221,782 | 7.1% |
[ 0.0% - 0.5% ] 0.36% | 1,138,839 | 7.9% |
[ 0.0% - 0.5% ] 0.40% | 805,480 | 6.9% |
[ 0.0% - 0.5% ] 0.44% | 1,243,678 | 5.1% |
[ 0.0% - 0.5% ] 0.48% | 329,994 | 6.3% |
[ 0.5% - 1.0% ] 0.52% | 467,572 | 7.8% |
[ 0.5% - 1.0% ] 0.56% | 422,672 | 7.5% |
[ 0.5% - 1.0% ] 0.59% | 423,170 | 6.2% |
[ 0.5% - 1.0% ] 0.64% | 360,990 | 7.4% |
[ 0.5% - 1.0% ] 0.67% | 277,337 | 5.0% |
[ 0.5% - 1.0% ] 0.71% | 160,740 | 9.2% |
[ 0.5% - 1.0% ] 0.75% | 282,201 | 6.1% |
[ 0.5% - 1.0% ] 0.79% | 167,823 | 5.2% |
[ 0.5% - 1.0% ] 0.83% | 48,630 | 5.3% |
[ 0.5% - 1.0% ] 0.86% | 110,348 | 7.2% |
[ 0.5% - 1.0% ] 0.90% | 176,938 | 6.3% |
[ 0.5% - 1.0% ] 0.93% | 85,562 | 5.0% |
[ 0.5% - 1.0% ] 0.98% | 7,782 | 11.2% |
[ 1.0% - 1.5% ] 1.01% | 74,840 | 8.7% |
[ 1.0% - 1.5% ] 1.05% | 10,403 | 7.9% |
[ 1.0% - 1.5% ] 1.11% | 132,921 | 6.5% |
[ 1.0% - 1.5% ] 1.12% | 82,468 | 6.2% |
[ 1.0% - 1.5% ] 1.17% | 52,627 | 7.0% |
[ 1.0% - 1.5% ] 1.21% | 92,277 | 5.2% |
[ 1.0% - 1.5% ] 1.25% | 83,024 | 4.6% |
[ 1.0% - 1.5% ] 1.28% | 64,439 | 9.0% |
[ 1.0% - 1.5% ] 1.33% | 44,281 | 4.1% |
[ 1.0% - 1.5% ] 1.36% | 37,601 | 7.0% |
[ 1.0% - 1.5% ] 1.40% | 54,590 | 5.1% |
[ 1.0% - 1.5% ] 1.44% | 26,616 | 9.1% |
[ 1.0% - 1.5% ] 1.47% | 14,360 | 5.0% |
[ 1.5% - 2.0% ] 1.56% | 8,220 | 8.8% |
[ 1.5% - 2.0% ] 1.59% | 36,930 | 5.2% |
[ 1.5% - 2.0% ] 1.68% | 12,525 | 5.4% |
[ 1.5% - 2.0% ] 1.76% | 16,613 | 5.9% |
[ 1.5% - 2.0% ] 1.79% | 51,537 | 7.2% |
[ 1.5% - 2.0% ] 1.83% | 25,489 | 8.1% |
[ 1.5% - 2.0% ] 1.94% | 21,760 | 5.4% |
[ 1.5% - 2.0% ] 1.97% | 6,496 | 5.4% |
[ 2.0% - 2.5% ] 2.01% | 14,915 | 6.4% |
[ 2.0% - 2.5% ] 2.05% | 6,549 | 1.3% |
[ 2.0% - 2.5% ] 2.18% | 2,160 | 3.6% |
[ 2.0% - 2.5% ] 2.47% | 7,763 | 8.4% |
[ 2.5% - 3.0% ] 2.54% | 13,291 | 6.2% |
[ 2.5% - 3.0% ] 2.76% | 15,452 | 10.1% |
[ 2.5% - 3.0% ] 2.80% | 9,960 | 4.9% |
[ 3.0% - 3.5% ] 3.08% | 29,883 | 10.3% |
[ 3.0% - 3.5% ] 3.14% | 3,317 | 8.1% |
[ 3.0% - 3.5% ] 3.16% | 8,535 | 4.2% |
[ 3.0% - 3.5% ] 3.26% | 889 | 11.2% |
[ 3.0% - 3.5% ] 3.46% | 7,804 | 5.8% |
[ 3.0% - 3.5% ] 3.48% | 28,568 | 8.0% |
[ 3.5% - 4.0% ] 3.60% | 8,919 | 5.3% |
[ 3.5% - 4.0% ] 3.71% | 2,453 | 10.5% |
[ 3.5% - 4.0% ] 3.95% | 11,084 | 6.0% |
[ 4.0% - 4.5% ] 4.03% | 10,859 | 6.3% |
[ 4.5% - 5.0% ] 4.58% | 1,289 | 14.5% |
[ 6.0% - 6.5% ] 6.01% | 8,024 | 1.3% |