Immigrants from Jordan GED/Equivalency
COMPARE
Immigrants from Jordan
Select to Compare
GED/Equivalency
Immigrants from Jordan GED/Equivalency
86.8%
GED/EQUIVALENCY
90.8/ 100
METRIC RATING
122nd/ 347
METRIC RANK
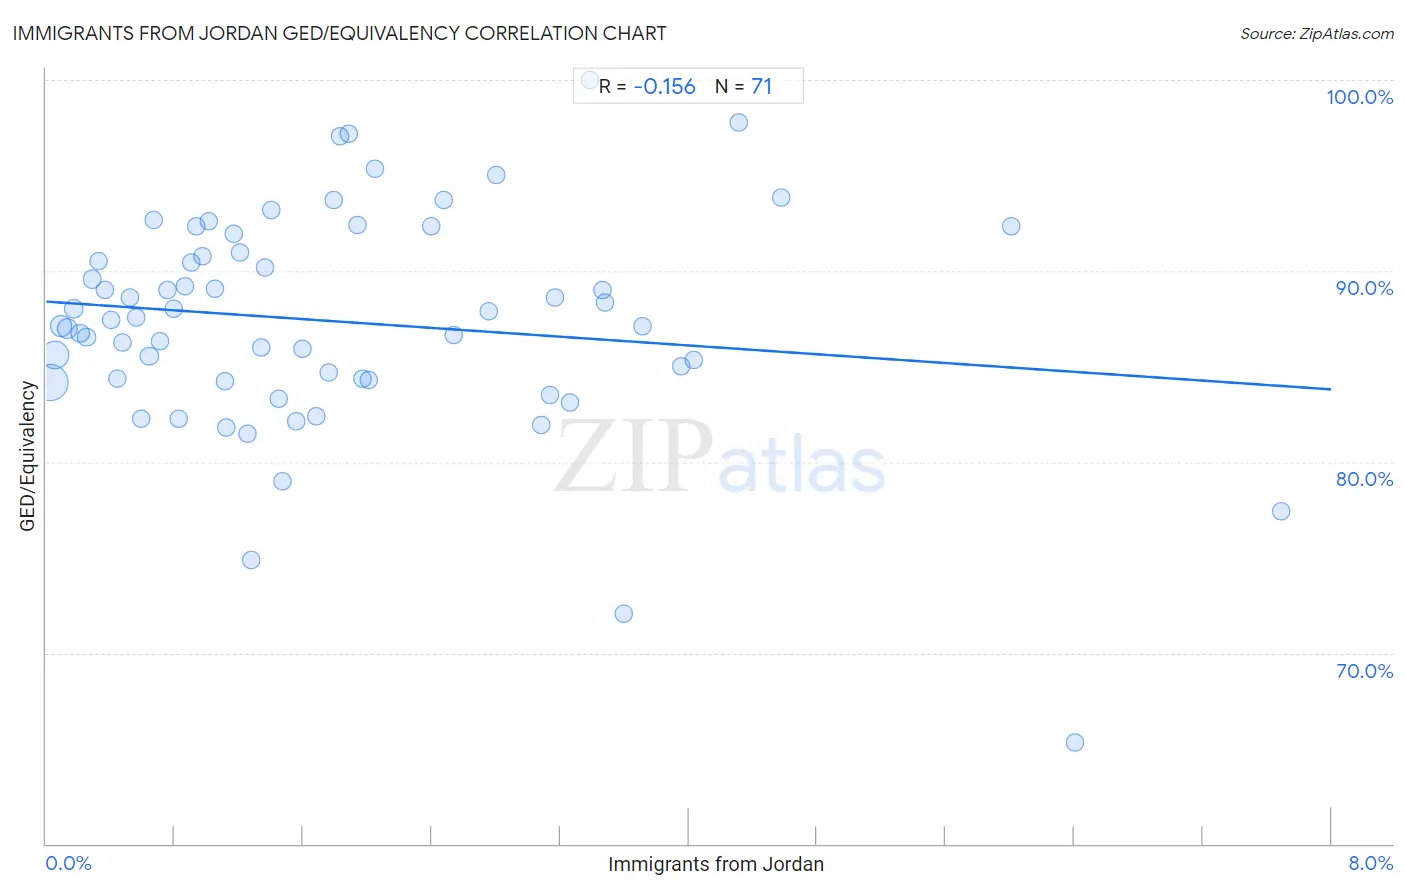
Immigrants from Jordan GED/Equivalency Correlation Chart
The statistical analysis conducted on geographies consisting of 181,276,674 people shows a poor negative correlation between the proportion of Immigrants from Jordan and percentage of population with at least ged/equivalency education in the United States with a correlation coefficient (R) of -0.156 and weighted average of 86.8%. On average, for every 1% (one percent) increase in Immigrants from Jordan within a typical geography, there is a decrease of 0.58% in percentage of population with at least ged/equivalency education.
It is essential to understand that the correlation between the percentage of Immigrants from Jordan and percentage of population with at least ged/equivalency education does not imply a direct cause-and-effect relationship. It remains uncertain whether the presence of Immigrants from Jordan influences an upward or downward trend in the level of percentage of population with at least ged/equivalency education within an area, or if Immigrants from Jordan simply ended up residing in those areas with higher or lower levels of percentage of population with at least ged/equivalency education due to other factors.
Demographics Similar to Immigrants from Jordan by GED/Equivalency
In terms of ged/equivalency, the demographic groups most similar to Immigrants from Jordan are Immigrants from Lebanon (86.8%, a difference of 0.0%), Immigrants from Italy (86.7%, a difference of 0.020%), Immigrants from Egypt (86.7%, a difference of 0.030%), Celtic (86.7%, a difference of 0.030%), and Asian (86.7%, a difference of 0.030%).
| Demographics | Rating | Rank | GED/Equivalency |
| Mongolians | 94.6 /100 | #115 | Exceptional 87.0% |
| Swiss | 94.5 /100 | #116 | Exceptional 87.0% |
| Immigrants from Hong Kong | 93.8 /100 | #117 | Exceptional 86.9% |
| French Canadians | 93.2 /100 | #118 | Exceptional 86.9% |
| Immigrants from China | 93.2 /100 | #119 | Exceptional 86.9% |
| Scotch-Irish | 91.6 /100 | #120 | Exceptional 86.8% |
| Immigrants from Lebanon | 90.9 /100 | #121 | Exceptional 86.8% |
| Immigrants from Jordan | 90.8 /100 | #122 | Exceptional 86.8% |
| Immigrants from Italy | 90.5 /100 | #123 | Exceptional 86.7% |
| Immigrants from Egypt | 90.4 /100 | #124 | Exceptional 86.7% |
| Celtics | 90.4 /100 | #125 | Exceptional 86.7% |
| Asians | 90.3 /100 | #126 | Exceptional 86.7% |
| Argentineans | 89.7 /100 | #127 | Excellent 86.7% |
| Yugoslavians | 89.5 /100 | #128 | Excellent 86.7% |
| Immigrants from Ukraine | 88.9 /100 | #129 | Excellent 86.7% |
Immigrants from Jordan GED/Equivalency Correlation Summary
| Measurement | Immigrants from Jordan Data | GED/Equivalency Data |
| Minimum | 0.021% | 65.3% |
| Maximum | 7.7% | 100.0% |
| Range | 7.7% | 34.7% |
| Mean | 1.8% | 87.3% |
| Median | 1.4% | 87.4% |
| Interquartile 25% (IQ1) | 0.67% | 84.3% |
| Interquartile 75% (IQ3) | 2.8% | 91.0% |
| Interquartile Range (IQR) | 2.1% | 6.6% |
| Standard Deviation (Sample) | 1.6% | 5.8% |
| Standard Deviation (Population) | 1.6% | 5.8% |
Correlation Details
| Immigrants from Jordan Percentile | Sample Size | GED/Equivalency |
[ 0.0% - 0.5% ] 0.021% | 83,069,791 | 84.2% |
[ 0.0% - 0.5% ] 0.057% | 44,519,035 | 85.6% |
[ 0.0% - 0.5% ] 0.094% | 18,173,093 | 87.1% |
[ 0.0% - 0.5% ] 0.13% | 11,975,600 | 87.0% |
[ 0.0% - 0.5% ] 0.17% | 6,007,812 | 88.0% |
[ 0.0% - 0.5% ] 0.21% | 3,675,120 | 86.7% |
[ 0.0% - 0.5% ] 0.25% | 2,755,180 | 86.5% |
[ 0.0% - 0.5% ] 0.29% | 2,191,677 | 89.6% |
[ 0.0% - 0.5% ] 0.33% | 1,221,782 | 90.5% |
[ 0.0% - 0.5% ] 0.36% | 1,138,839 | 89.0% |
[ 0.0% - 0.5% ] 0.40% | 805,480 | 87.4% |
[ 0.0% - 0.5% ] 0.44% | 1,247,677 | 84.4% |
[ 0.0% - 0.5% ] 0.48% | 337,325 | 86.3% |
[ 0.5% - 1.0% ] 0.52% | 469,065 | 88.6% |
[ 0.5% - 1.0% ] 0.56% | 422,672 | 87.5% |
[ 0.5% - 1.0% ] 0.59% | 423,170 | 82.3% |
[ 0.5% - 1.0% ] 0.64% | 360,990 | 85.6% |
[ 0.5% - 1.0% ] 0.67% | 277,337 | 92.7% |
[ 0.5% - 1.0% ] 0.71% | 160,740 | 86.3% |
[ 0.5% - 1.0% ] 0.75% | 282,201 | 89.0% |
[ 0.5% - 1.0% ] 0.79% | 167,823 | 88.0% |
[ 0.5% - 1.0% ] 0.83% | 48,630 | 82.3% |
[ 0.5% - 1.0% ] 0.86% | 110,348 | 89.2% |
[ 0.5% - 1.0% ] 0.90% | 176,938 | 90.4% |
[ 0.5% - 1.0% ] 0.93% | 85,562 | 92.3% |
[ 0.5% - 1.0% ] 0.98% | 7,782 | 90.7% |
[ 1.0% - 1.5% ] 1.01% | 74,840 | 92.6% |
[ 1.0% - 1.5% ] 1.05% | 14,982 | 89.1% |
[ 1.0% - 1.5% ] 1.11% | 138,607 | 84.2% |
[ 1.0% - 1.5% ] 1.12% | 82,468 | 81.8% |
[ 1.0% - 1.5% ] 1.17% | 52,627 | 92.0% |
[ 1.0% - 1.5% ] 1.21% | 92,277 | 91.0% |
[ 1.0% - 1.5% ] 1.25% | 83,024 | 81.5% |
[ 1.0% - 1.5% ] 1.28% | 64,439 | 74.8% |
[ 1.0% - 1.5% ] 1.33% | 44,655 | 86.0% |
[ 1.0% - 1.5% ] 1.36% | 37,601 | 90.2% |
[ 1.0% - 1.5% ] 1.40% | 54,590 | 93.2% |
[ 1.0% - 1.5% ] 1.44% | 28,464 | 83.3% |
[ 1.0% - 1.5% ] 1.47% | 14,894 | 79.0% |
[ 1.5% - 2.0% ] 1.56% | 8,220 | 82.1% |
[ 1.5% - 2.0% ] 1.59% | 36,930 | 85.9% |
[ 1.5% - 2.0% ] 1.68% | 12,525 | 82.4% |
[ 1.5% - 2.0% ] 1.76% | 16,613 | 84.7% |
[ 1.5% - 2.0% ] 1.79% | 51,537 | 93.7% |
[ 1.5% - 2.0% ] 1.83% | 25,489 | 97.1% |
[ 1.5% - 2.0% ] 1.88% | 1,221 | 97.2% |
[ 1.5% - 2.0% ] 1.94% | 21,760 | 92.4% |
[ 1.5% - 2.0% ] 1.97% | 6,496 | 84.3% |
[ 2.0% - 2.5% ] 2.01% | 14,915 | 84.3% |
[ 2.0% - 2.5% ] 2.05% | 6,549 | 95.4% |
[ 2.0% - 2.5% ] 2.40% | 8,171 | 92.3% |
[ 2.0% - 2.5% ] 2.47% | 7,763 | 93.7% |
[ 2.5% - 3.0% ] 2.54% | 13,291 | 86.6% |
[ 2.5% - 3.0% ] 2.76% | 15,452 | 87.9% |
[ 2.5% - 3.0% ] 2.80% | 9,960 | 95.0% |
[ 3.0% - 3.5% ] 3.08% | 29,883 | 81.9% |
[ 3.0% - 3.5% ] 3.14% | 3,317 | 83.5% |
[ 3.0% - 3.5% ] 3.16% | 8,535 | 88.6% |
[ 3.0% - 3.5% ] 3.26% | 889 | 83.1% |
[ 3.0% - 3.5% ] 3.39% | 1,506 | 100.0% |
[ 3.0% - 3.5% ] 3.46% | 7,804 | 89.0% |
[ 3.0% - 3.5% ] 3.48% | 28,568 | 88.4% |
[ 3.5% - 4.0% ] 3.60% | 8,919 | 72.0% |
[ 3.5% - 4.0% ] 3.71% | 2,453 | 87.1% |
[ 3.5% - 4.0% ] 3.95% | 11,084 | 85.0% |
[ 4.0% - 4.5% ] 4.03% | 11,259 | 85.3% |
[ 4.0% - 4.5% ] 4.31% | 371 | 97.8% |
[ 4.5% - 5.0% ] 4.58% | 1,289 | 93.8% |
[ 6.0% - 6.5% ] 6.01% | 8,024 | 92.4% |
[ 6.0% - 6.5% ] 6.41% | 562 | 65.3% |
[ 7.5% - 8.0% ] 7.69% | 182 | 77.4% |