Immigrants from Jordan Disability Age 5 to 17
COMPARE
Immigrants from Jordan
Select to Compare
Disability Age 5 to 17
Immigrants from Jordan Disability Age 5 to 17
5.3%
DISABILITY | AGE 5 TO 17
99.1/ 100
METRIC RATING
94th/ 347
METRIC RANK
Immigrants from Jordan Disability Age 5 to 17 Correlation Chart
The statistical analysis conducted on geographies consisting of 180,773,997 people shows a mild negative correlation between the proportion of Immigrants from Jordan and percentage of population with a disability between the ages 5 and 17 in the United States with a correlation coefficient (R) of -0.399 and weighted average of 5.3%. On average, for every 1% (one percent) increase in Immigrants from Jordan within a typical geography, there is a decrease of 0.54% in percentage of population with a disability between the ages 5 and 17.
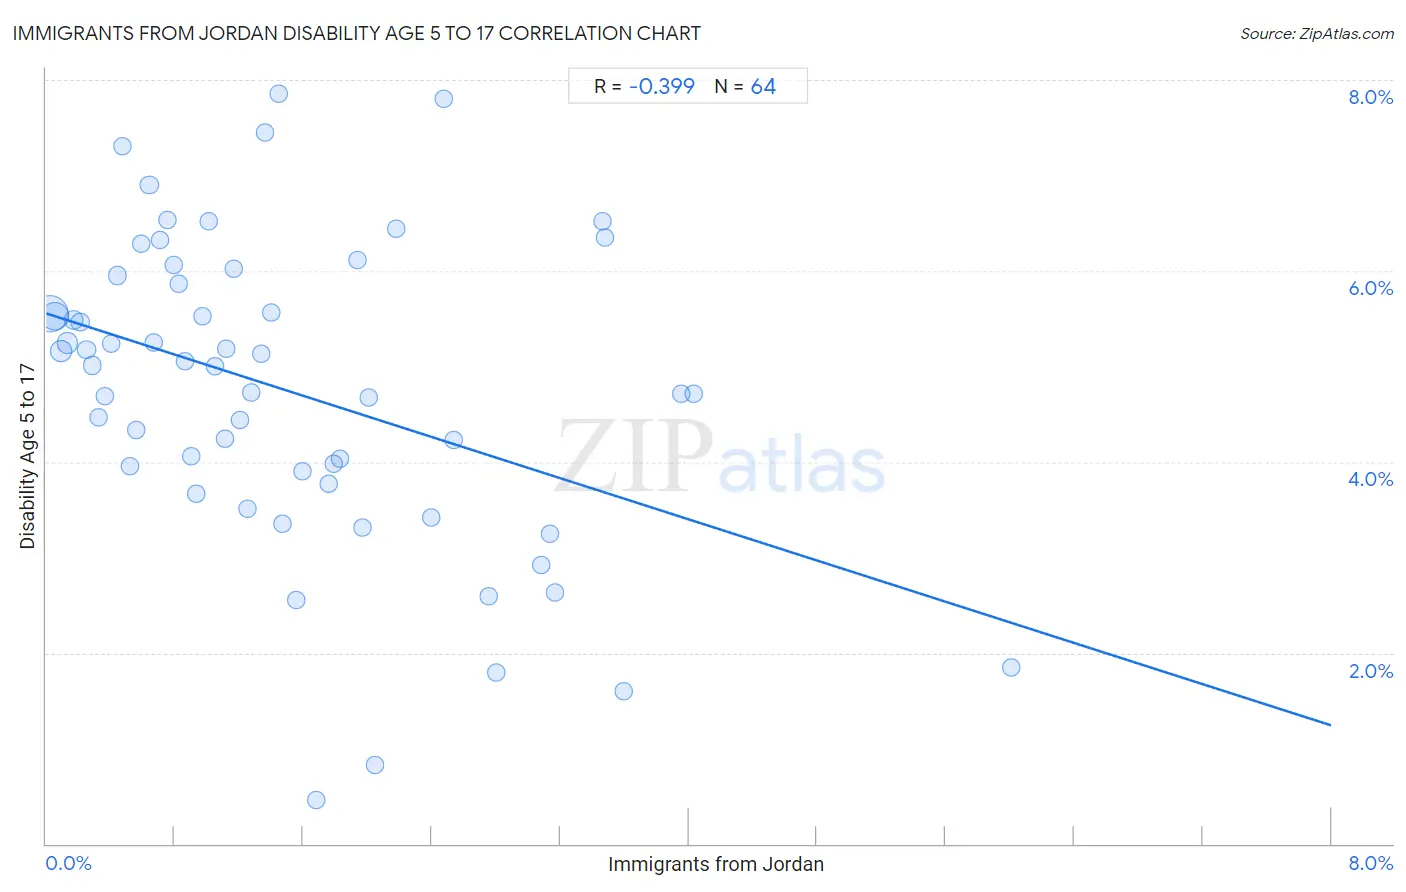
It is essential to understand that the correlation between the percentage of Immigrants from Jordan and percentage of population with a disability between the ages 5 and 17 does not imply a direct cause-and-effect relationship. It remains uncertain whether the presence of Immigrants from Jordan influences an upward or downward trend in the level of percentage of population with a disability between the ages 5 and 17 within an area, or if Immigrants from Jordan simply ended up residing in those areas with higher or lower levels of percentage of population with a disability between the ages 5 and 17 due to other factors.
Demographics Similar to Immigrants from Jordan by Disability Age 5 to 17
In terms of disability age 5 to 17, the demographic groups most similar to Immigrants from Jordan are Immigrants from Grenada (5.3%, a difference of 0.020%), Immigrants from Peru (5.3%, a difference of 0.070%), Luxembourger (5.3%, a difference of 0.14%), Mongolian (5.3%, a difference of 0.16%), and Immigrants from El Salvador (5.3%, a difference of 0.18%).
| Demographics | Rating | Rank | Disability Age 5 to 17 |
| Eastern Europeans | 99.4 /100 | #87 | Exceptional 5.2% |
| Immigrants from Croatia | 99.4 /100 | #88 | Exceptional 5.2% |
| Immigrants from Spain | 99.4 /100 | #89 | Exceptional 5.2% |
| Immigrants from Kuwait | 99.4 /100 | #90 | Exceptional 5.3% |
| Mongolians | 99.2 /100 | #91 | Exceptional 5.3% |
| Luxembourgers | 99.2 /100 | #92 | Exceptional 5.3% |
| Immigrants from Peru | 99.1 /100 | #93 | Exceptional 5.3% |
| Immigrants from Jordan | 99.1 /100 | #94 | Exceptional 5.3% |
| Immigrants from Grenada | 99.1 /100 | #95 | Exceptional 5.3% |
| Immigrants from El Salvador | 99.0 /100 | #96 | Exceptional 5.3% |
| Immigrants from Europe | 99.0 /100 | #97 | Exceptional 5.3% |
| Immigrants from Austria | 98.9 /100 | #98 | Exceptional 5.3% |
| Cambodians | 98.8 /100 | #99 | Exceptional 5.3% |
| Nepalese | 98.7 /100 | #100 | Exceptional 5.3% |
| Menominee | 98.7 /100 | #101 | Exceptional 5.3% |
Immigrants from Jordan Disability Age 5 to 17 Correlation Summary
| Measurement | Immigrants from Jordan Data | Disability Age 5 to 17 Data |
| Minimum | 0.021% | 0.46% |
| Maximum | 6.0% | 7.9% |
| Range | 6.0% | 7.4% |
| Mean | 1.5% | 4.7% |
| Median | 1.2% | 5.0% |
| Interquartile 25% (IQ1) | 0.62% | 3.8% |
| Interquartile 75% (IQ3) | 2.0% | 5.9% |
| Interquartile Range (IQR) | 1.4% | 2.1% |
| Standard Deviation (Sample) | 1.2% | 1.6% |
| Standard Deviation (Population) | 1.2% | 1.6% |
Correlation Details
| Immigrants from Jordan Percentile | Sample Size | Disability Age 5 to 17 |
[ 0.0% - 0.5% ] 0.021% | 83,005,533 | 5.6% |
[ 0.0% - 0.5% ] 0.057% | 44,466,826 | 5.5% |
[ 0.0% - 0.5% ] 0.094% | 18,139,806 | 5.2% |
[ 0.0% - 0.5% ] 0.13% | 11,953,744 | 5.2% |
[ 0.0% - 0.5% ] 0.17% | 5,948,850 | 5.5% |
[ 0.0% - 0.5% ] 0.21% | 3,642,397 | 5.5% |
[ 0.0% - 0.5% ] 0.25% | 2,726,643 | 5.2% |
[ 0.0% - 0.5% ] 0.29% | 2,162,801 | 5.0% |
[ 0.0% - 0.5% ] 0.33% | 1,195,382 | 4.5% |
[ 0.0% - 0.5% ] 0.36% | 1,131,890 | 4.7% |
[ 0.0% - 0.5% ] 0.40% | 794,973 | 5.2% |
[ 0.0% - 0.5% ] 0.44% | 1,183,116 | 6.0% |
[ 0.0% - 0.5% ] 0.48% | 337,325 | 7.3% |
[ 0.5% - 1.0% ] 0.52% | 455,175 | 4.0% |
[ 0.5% - 1.0% ] 0.56% | 421,777 | 4.3% |
[ 0.5% - 1.0% ] 0.59% | 410,247 | 6.3% |
[ 0.5% - 1.0% ] 0.64% | 360,681 | 6.9% |
[ 0.5% - 1.0% ] 0.67% | 274,745 | 5.3% |
[ 0.5% - 1.0% ] 0.71% | 158,741 | 6.3% |
[ 0.5% - 1.0% ] 0.75% | 282,201 | 6.5% |
[ 0.5% - 1.0% ] 0.79% | 167,823 | 6.1% |
[ 0.5% - 1.0% ] 0.83% | 48,630 | 5.9% |
[ 0.5% - 1.0% ] 0.86% | 88,600 | 5.0% |
[ 0.5% - 1.0% ] 0.90% | 176,938 | 4.1% |
[ 0.5% - 1.0% ] 0.93% | 85,562 | 3.7% |
[ 0.5% - 1.0% ] 0.98% | 7,782 | 5.5% |
[ 1.0% - 1.5% ] 1.01% | 72,913 | 6.5% |
[ 1.0% - 1.5% ] 1.05% | 14,982 | 5.0% |
[ 1.0% - 1.5% ] 1.11% | 134,389 | 4.2% |
[ 1.0% - 1.5% ] 1.12% | 82,468 | 5.2% |
[ 1.0% - 1.5% ] 1.17% | 52,627 | 6.0% |
[ 1.0% - 1.5% ] 1.21% | 91,203 | 4.4% |
[ 1.0% - 1.5% ] 1.25% | 79,932 | 3.5% |
[ 1.0% - 1.5% ] 1.28% | 64,439 | 4.7% |
[ 1.0% - 1.5% ] 1.33% | 44,281 | 5.1% |
[ 1.0% - 1.5% ] 1.36% | 37,601 | 7.4% |
[ 1.0% - 1.5% ] 1.40% | 54,590 | 5.6% |
[ 1.0% - 1.5% ] 1.44% | 28,464 | 7.9% |
[ 1.0% - 1.5% ] 1.47% | 14,360 | 3.3% |
[ 1.5% - 2.0% ] 1.56% | 8,220 | 2.6% |
[ 1.5% - 2.0% ] 1.59% | 36,556 | 3.9% |
[ 1.5% - 2.0% ] 1.68% | 12,525 | 0.46% |
[ 1.5% - 2.0% ] 1.76% | 16,613 | 3.8% |
[ 1.5% - 2.0% ] 1.79% | 50,647 | 4.0% |
[ 1.5% - 2.0% ] 1.83% | 25,489 | 4.0% |
[ 1.5% - 2.0% ] 1.94% | 21,760 | 6.1% |
[ 1.5% - 2.0% ] 1.97% | 6,496 | 3.3% |
[ 2.0% - 2.5% ] 2.01% | 14,915 | 4.7% |
[ 2.0% - 2.5% ] 2.05% | 6,549 | 0.83% |
[ 2.0% - 2.5% ] 2.18% | 2,160 | 6.4% |
[ 2.0% - 2.5% ] 2.40% | 8,171 | 3.4% |
[ 2.0% - 2.5% ] 2.47% | 7,763 | 7.8% |
[ 2.5% - 3.0% ] 2.54% | 13,291 | 4.2% |
[ 2.5% - 3.0% ] 2.76% | 15,452 | 2.6% |
[ 2.5% - 3.0% ] 2.80% | 9,960 | 1.8% |
[ 3.0% - 3.5% ] 3.08% | 29,883 | 2.9% |
[ 3.0% - 3.5% ] 3.14% | 3,317 | 3.3% |
[ 3.0% - 3.5% ] 3.16% | 8,535 | 2.6% |
[ 3.0% - 3.5% ] 3.46% | 7,804 | 6.5% |
[ 3.0% - 3.5% ] 3.48% | 28,568 | 6.4% |
[ 3.5% - 4.0% ] 3.60% | 8,919 | 1.6% |
[ 3.5% - 4.0% ] 3.95% | 11,084 | 4.7% |
[ 4.0% - 4.5% ] 4.03% | 10,859 | 4.7% |
[ 6.0% - 6.5% ] 6.01% | 8,024 | 1.8% |