Guamanian/Chamorro Female Unemployment

COMPARE

Guamanian/Chamorro
Race
Ancestry
AfghanAfricanAlaska NativeAlaskan AthabascanAlbanianAleutAlsatianAmericanApacheArabArapahoArgentineanArmenianAssyrian/Chaldean/SyriacAustralianAustrianBahamianBangladeshiBarbadianBasqueBelgianBelizeanBermudanBhutaneseBlackfeetBolivianBrazilianBritishBritish West IndianBulgarianBurmeseCajunCambodianCanadianCape VerdeanCarpatho RusynCelticCentral AmericanCentral American IndianCherokeeCheyenneChickasawChileanChineseChippewaChoctawColombianColvilleComancheCosta RicanCreeCreekCroatianCrowCubanCypriotCzechCzechoslovakianDanishDelawareDominicanDutchDutch West IndianEastern EuropeanEcuadorianEgyptianEnglishEstonianEthiopianEuropeanFijianFilipinoFinnishFrenchFrench American IndianFrench CanadianGermanGerman RussianGhanaianGreekGuamanian/ChamorroGuatemalanGuyaneseHaitianHmongHonduranHopiHoumaHungarianIcelanderIndian (Asian)IndonesianInupiatIranianIraqiIrishIroquoisIsraeliItalianJamaicanJapaneseJordanianKenyanKiowaKoreanLaotianLatvianLebaneseLiberianLithuanianLumbeeLuxembourgerMacedonianMalaysianMalteseMarshalleseMenomineeMexicanMexican American IndianMongolianMoroccanNative HawaiianNavajoNepaleseNew ZealanderNicaraguanNigerianNorthern EuropeanNorwegianOkinawanOsageOttawaPaiutePakistaniPalestinianPanamanianParaguayanPennsylvania GermanPeruvianPimaPolishPortuguesePotawatomiPuebloPuerto RicanPuget Sound SalishRomanianRussianSalvadoranSamoanScandinavianScotch-IrishScottishSeminoleSenegaleseSerbianShoshoneSierra LeoneanSiouxSlavicSlovakSloveneSomaliSouth AfricanSouth AmericanSouth American IndianSoviet UnionSpaniardSpanishSpanish AmericanSpanish American IndianSri LankanSubsaharan AfricanSudaneseSwedishSwissSyrianTaiwaneseThaiTlingit-HaidaTohono O'OdhamTonganTrinidadian and TobagonianTsimshianTurkishU.S. Virgin IslanderUgandanUkrainianUruguayanUteVenezuelanVietnameseWelshWest IndianYakamaYaquiYugoslavianYumanYup'ikZimbabwean
Immigration
NonimmigrantsImmigrantsAfghanistanAfricaAlbaniaArgentinaArmeniaAsiaAustraliaAustriaBahamasBangladeshBarbadosBelarusBelgiumBelizeBoliviaBosnia and HerzegovinaBrazilBulgariaBurma/MyanmarCabo VerdeCambodiaCameroonCanadaCaribbeanCentral AmericaChileChinaColombiaCongoCosta RicaCroatiaCubaCzechoslovakiaDenmarkDominicaDominican RepublicEastern AfricaEastern AsiaEastern EuropeEcuadorEgyptEl SalvadorEnglandEritreaEthiopiaEuropeFijiFranceGermanyGhanaGreeceGrenadaGuatemalaGuyanaHaitiHondurasHong KongHungaryIndiaIndonesiaIranIraqIrelandIsraelItalyJamaicaJapanJordanKazakhstanKenyaKoreaKuwaitLaosLatin AmericaLatviaLebanonLiberiaLithuaniaMalaysiaMexicoMicronesiaMiddle AfricaMoldovaMoroccoNepalNetherlandsNicaraguaNigeriaNorth AmericaNorth MacedoniaNorthern AfricaNorthern EuropeNorwayOceaniaPakistanPanamaPeruPhilippinesPolandPortugalRomaniaRussiaSaudi ArabiaScotlandSenegalSerbiaSierra LeoneSingaporeSomaliaSouth AfricaSouth AmericaSouth Central AsiaSouth Eastern AsiaSouthern EuropeSpainSri LankaSt. Vincent and the GrenadinesSudanSwedenSwitzerlandSyriaTaiwanThailandTrinidad and TobagoTurkeyUgandaUkraineUruguayUzbekistanVenezuelaVietnamWest IndiesWestern AfricaWestern AsiaWestern EuropeYemenZaireZimbabweAzores
Select to Compare
Race
Ancestry
AfghanAfricanAlaska NativeAlaskan AthabascanAlbanianAleutAlsatianAmericanApacheArabArapahoArgentineanArmenianAssyrian/Chaldean/SyriacAustralianAustrianBahamianBangladeshiBarbadianBasqueBelgianBelizeanBermudanBhutaneseBlackfeetBolivianBrazilianBritishBritish West IndianBulgarianBurmeseCajunCambodianCanadianCape VerdeanCarpatho RusynCelticCentral AmericanCentral American IndianCherokeeCheyenneChickasawChileanChineseChippewaChoctawColombianColvilleComancheCosta RicanCreeCreekCroatianCrowCubanCypriotCzechCzechoslovakianDanishDelawareDominicanDutchDutch West IndianEastern EuropeanEcuadorianEgyptianEnglishEstonianEthiopianEuropeanFijianFilipinoFinnishFrenchFrench American IndianFrench CanadianGermanGerman RussianGhanaianGreekGuatemalanGuyaneseHaitianHmongHonduranHopiHoumaHungarianIcelanderIndian (Asian)IndonesianInupiatIranianIraqiIrishIroquoisIsraeliItalianJamaicanJapaneseJordanianKenyanKiowaKoreanLaotianLatvianLebaneseLiberianLithuanianLumbeeLuxembourgerMacedonianMalaysianMalteseMarshalleseMenomineeMexicanMexican American IndianMongolianMoroccanNative HawaiianNavajoNepaleseNew ZealanderNicaraguanNigerianNorthern EuropeanNorwegianOkinawanOsageOttawaPaiutePakistaniPalestinianPanamanianParaguayanPennsylvania GermanPeruvianPimaPolishPortuguesePotawatomiPuebloPuerto RicanPuget Sound SalishRomanianRussianSalvadoranSamoanScandinavianScotch-IrishScottishSeminoleSenegaleseSerbianShoshoneSierra LeoneanSiouxSlavicSlovakSloveneSomaliSouth AfricanSouth AmericanSouth American IndianSoviet UnionSpaniardSpanishSpanish AmericanSpanish American IndianSri LankanSubsaharan AfricanSudaneseSwedishSwissSyrianTaiwaneseThaiTlingit-HaidaTohono O'OdhamTonganTrinidadian and TobagonianTsimshianTurkishU.S. Virgin IslanderUgandanUkrainianUruguayanUteVenezuelanVietnameseWelshWest IndianYakamaYaquiYugoslavianYumanYup'ikZimbabwean
Immigration
NonimmigrantsImmigrantsAfghanistanAfricaAlbaniaArgentinaArmeniaAsiaAustraliaAustriaBahamasBangladeshBarbadosBelarusBelgiumBelizeBoliviaBosnia and HerzegovinaBrazilBulgariaBurma/MyanmarCabo VerdeCambodiaCameroonCanadaCaribbeanCentral AmericaChileChinaColombiaCongoCosta RicaCroatiaCubaCzechoslovakiaDenmarkDominicaDominican RepublicEastern AfricaEastern AsiaEastern EuropeEcuadorEgyptEl SalvadorEnglandEritreaEthiopiaEuropeFijiFranceGermanyGhanaGreeceGrenadaGuatemalaGuyanaHaitiHondurasHong KongHungaryIndiaIndonesiaIranIraqIrelandIsraelItalyJamaicaJapanJordanKazakhstanKenyaKoreaKuwaitLaosLatin AmericaLatviaLebanonLiberiaLithuaniaMalaysiaMexicoMicronesiaMiddle AfricaMoldovaMoroccoNepalNetherlandsNicaraguaNigeriaNorth AmericaNorth MacedoniaNorthern AfricaNorthern EuropeNorwayOceaniaPakistanPanamaPeruPhilippinesPolandPortugalRomaniaRussiaSaudi ArabiaScotlandSenegalSerbiaSierra LeoneSingaporeSomaliaSouth AfricaSouth AmericaSouth Central AsiaSouth Eastern AsiaSouthern EuropeSpainSri LankaSt. Vincent and the GrenadinesSudanSwedenSwitzerlandSyriaTaiwanThailandTrinidad and TobagoTurkeyUgandaUkraineUruguayUzbekistanVenezuelaVietnamWest IndiesWestern AfricaWestern AsiaWestern EuropeYemenZaireZimbabweAzores
Female Unemployment
Income
Poverty
Unemployment
Labor Participation
Family Structure
Vehicle Availability
Education Level
Disability

Guamanian/Chamorro Female Unemployment
Tragic

5.6%
UNEMPLOYMENT | FEMALES
1.4/ 100
METRIC RATING
245th/ 347
METRIC RANK

Guamanian/Chamorro Female Unemployment Correlation Chart

The statistical analysis conducted on geographies consisting of 221,394,828 people shows a very strong positive correlation between the proportion of Guamanians/Chamorros and unemploymnet rate among females in the United States with a correlation coefficient (R) of 0.832 and weighted average of 5.6%. On average, for every 1% (one percent) increase in Guamanians/Chamorros within a typical geography, there is an increase of 2.0% in unemploymnet rate among females.
Guamanian/Chamorro Female Unemployment
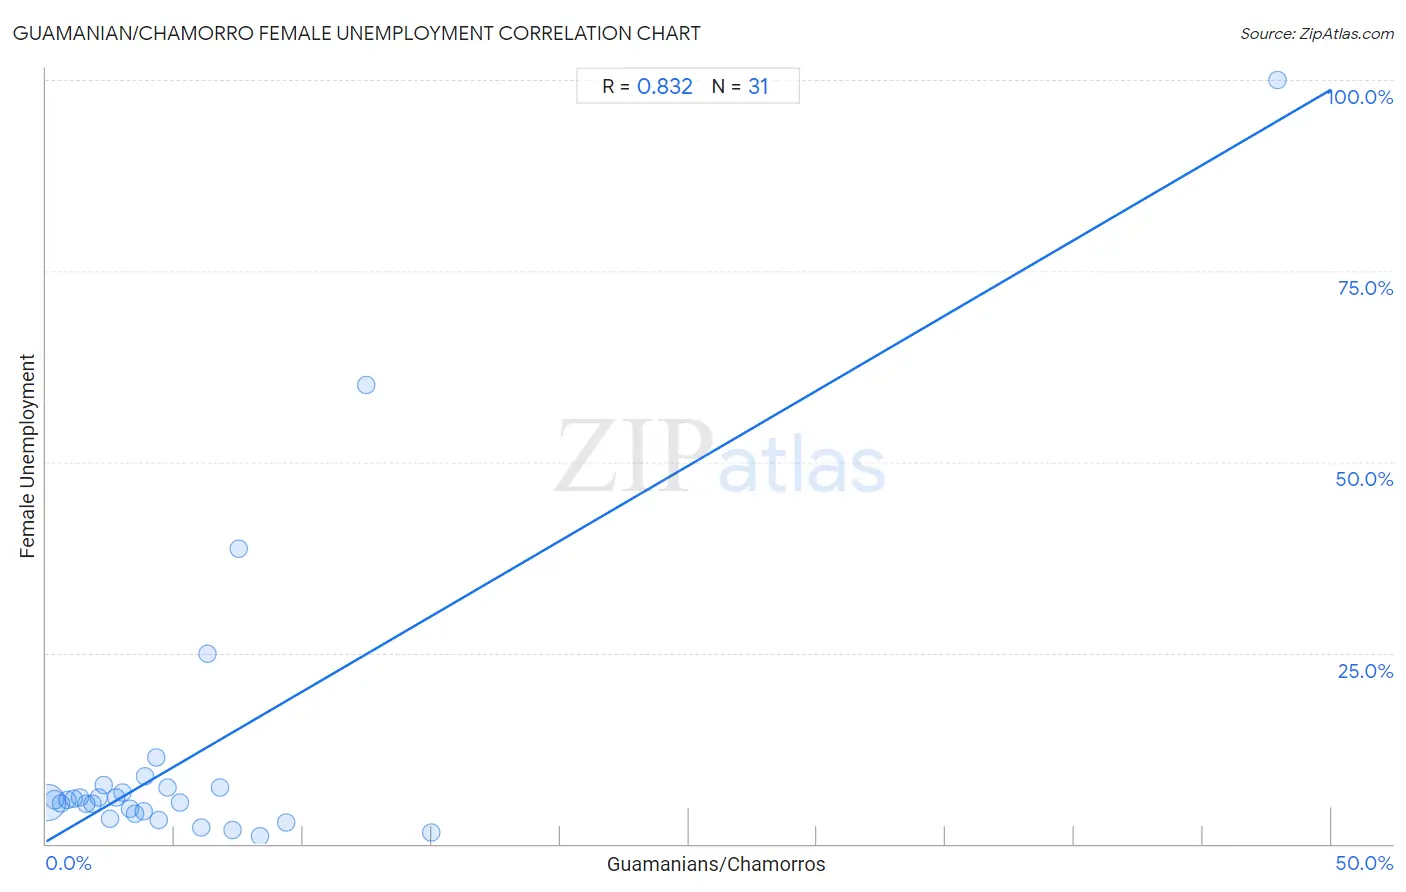
It is essential to understand that the correlation between the percentage of Guamanians/Chamorros and unemploymnet rate among females does not imply a direct cause-and-effect relationship. It remains uncertain whether the presence of Guamanians/Chamorros influences an upward or downward trend in the level of unemploymnet rate among females within an area, or if Guamanians/Chamorros simply ended up residing in those areas with higher or lower levels of unemploymnet rate among females due to other factors.

Demographics Similar to Guamanians/Chamorros by Female Unemployment

In terms of female unemployment, the demographic groups most similar to Guamanians/Chamorros are Immigrants from Liberia (5.6%, a difference of 0.14%), Japanese (5.6%, a difference of 0.23%), Immigrants from Western Asia (5.6%, a difference of 0.31%), Cree (5.6%, a difference of 0.47%), and Immigrants from Uzbekistan (5.6%, a difference of 0.51%).
DemographicsRating | RankFemale Unemployment
Sierra Leoneans
3.2
/100
|
#238
Tragic
5.5%
Aleuts
3.0
/100
|
#239
Tragic
5.5%
Immigrants from South America
2.9
/100
|
#240
Tragic
5.5%
South American Indians
2.8
/100
|
#241
Tragic
5.5%
Marshallese
2.3
/100
|
#242
Tragic
5.6%
Spanish Americans
2.2
/100
|
#243
Tragic
5.6%
Immigrants from Liberia
1.5
/100
|
#244
Tragic
5.6%
Guamanians/Chamorros
1.4
/100
|
#245
Tragic
5.6%
Japanese
1.2
/100
|
#246
Tragic
5.6%
Immigrants from Western Asia
1.1
/100
|
#247
Tragic
5.6%
Cree
1.0
/100
|
#248
Tragic
5.6%
Immigrants from Uzbekistan
1.0
/100
|
#249
Tragic
5.6%
Immigrants from Syria
0.8
/100
|
#250
Tragic
5.6%
Assyrians/Chaldeans/Syriacs
0.8
/100
|
#251
Tragic
5.6%
Cajuns
0.7
/100
|
#252
Tragic
5.7%

Guamanian/Chamorro Female Unemployment Correlation Summary

MeasurementGuamanian/Chamorro DataFemale Unemployment Data
Minimum0.066%1.0%
Maximum47.9%100.0%
Range47.8%99.0%
Mean5.8%11.7%
Median3.8%5.7%
Interquartile 25% (IQ1)1.8%3.9%
Interquartile 75% (IQ3)6.8%7.4%
Interquartile Range (IQR)5.0%3.5%
Standard Deviation (Sample)8.6%20.3%
Standard Deviation (Population)8.4%19.9%

Correlation Details

Guamanian/Chamorro PercentileSample SizeFemale Unemployment
[
0.0%
-
0.5%
]
0.066%
190,702,7455.4%
[
0.0%
-
0.5%
]
0.33%
19,974,6645.7%
[
0.5%
-
1.0%
]
0.58%
5,555,3455.3%
[
0.5%
-
1.0%
]
0.82%
2,502,9175.8%
[
1.0%
-
1.5%
]
1.08%
1,240,2885.9%
[
1.0%
-
1.5%
]
1.30%
463,3776.1%
[
1.5%
-
2.0%
]
1.55%
382,8965.2%
[
1.5%
-
2.0%
]
1.79%
176,4685.3%
[
2.0%
-
2.5%
]
2.04%
124,2566.1%
[
2.0%
-
2.5%
]
2.22%
63,4307.7%
[
2.0%
-
2.5%
]
2.49%
46,7533.3%
[
2.5%
-
3.0%
]
2.74%
17,8336.0%
[
2.5%
-
3.0%
]
2.99%
24,7056.7%
[
3.0%
-
3.5%
]
3.26%
27,2044.5%
[
3.0%
-
3.5%
]
3.44%
33,6763.9%
[
3.5%
-
4.0%
]
3.78%
6,9654.2%
[
3.5%
-
4.0%
]
3.87%
4,2438.9%
[
4.0%
-
4.5%
]
4.26%
2,97811.2%
[
4.0%
-
4.5%
]
4.40%
4,8423.0%
[
4.5%
-
5.0%
]
4.73%
24,6847.4%
[
5.0%
-
5.5%
]
5.22%
1,9745.5%
[
6.0%
-
6.5%
]
6.05%
2,1152.1%
[
6.0%
-
6.5%
]
6.27%
1,61124.9%
[
6.5%
-
7.0%
]
6.75%
8597.3%
[
7.0%
-
7.5%
]
7.27%
1,1281.8%
[
7.0%
-
7.5%
]
7.50%
92038.7%
[
8.0%
-
8.5%
]
8.30%
4,6481.0%
[
9.0%
-
9.5%
]
9.34%
5782.8%
[
12.0%
-
12.5%
]
12.46%
31360.0%
[
14.5%
-
15.0%
]
14.97%
2941.5%
[
47.5%
-
48.0%
]
47.90%
119100.0%