Guamanian/Chamorro Female Disability

COMPARE

Guamanian/Chamorro
Race
Ancestry
AfghanAfricanAlaska NativeAlaskan AthabascanAlbanianAleutAlsatianAmericanApacheArabArapahoArgentineanArmenianAssyrian/Chaldean/SyriacAustralianAustrianBahamianBangladeshiBarbadianBasqueBelgianBelizeanBermudanBhutaneseBlackfeetBolivianBrazilianBritishBritish West IndianBulgarianBurmeseCajunCambodianCanadianCape VerdeanCarpatho RusynCelticCentral AmericanCentral American IndianCherokeeCheyenneChickasawChileanChineseChippewaChoctawColombianColvilleComancheCosta RicanCreeCreekCroatianCrowCubanCypriotCzechCzechoslovakianDanishDelawareDominicanDutchDutch West IndianEastern EuropeanEcuadorianEgyptianEnglishEstonianEthiopianEuropeanFijianFilipinoFinnishFrenchFrench American IndianFrench CanadianGermanGerman RussianGhanaianGreekGuamanian/ChamorroGuatemalanGuyaneseHaitianHmongHonduranHopiHoumaHungarianIcelanderIndian (Asian)IndonesianInupiatIranianIraqiIrishIroquoisIsraeliItalianJamaicanJapaneseJordanianKenyanKiowaKoreanLaotianLatvianLebaneseLiberianLithuanianLumbeeLuxembourgerMacedonianMalaysianMalteseMarshalleseMenomineeMexicanMexican American IndianMongolianMoroccanNative HawaiianNavajoNepaleseNew ZealanderNicaraguanNigerianNorthern EuropeanNorwegianOkinawanOsageOttawaPaiutePakistaniPalestinianPanamanianParaguayanPennsylvania GermanPeruvianPimaPolishPortuguesePotawatomiPuebloPuerto RicanPuget Sound SalishRomanianRussianSalvadoranSamoanScandinavianScotch-IrishScottishSeminoleSenegaleseSerbianShoshoneSierra LeoneanSiouxSlavicSlovakSloveneSomaliSouth AfricanSouth AmericanSouth American IndianSoviet UnionSpaniardSpanishSpanish AmericanSpanish American IndianSri LankanSubsaharan AfricanSudaneseSwedishSwissSyrianTaiwaneseThaiTlingit-HaidaTohono O'OdhamTonganTrinidadian and TobagonianTsimshianTurkishU.S. Virgin IslanderUgandanUkrainianUruguayanUteVenezuelanVietnameseWelshWest IndianYakamaYaquiYugoslavianYumanYup'ikZimbabwean
Immigration
NonimmigrantsImmigrantsAfghanistanAfricaAlbaniaArgentinaArmeniaAsiaAustraliaAustriaBahamasBangladeshBarbadosBelarusBelgiumBelizeBoliviaBosnia and HerzegovinaBrazilBulgariaBurma/MyanmarCabo VerdeCambodiaCameroonCanadaCaribbeanCentral AmericaChileChinaColombiaCongoCosta RicaCroatiaCubaCzechoslovakiaDenmarkDominicaDominican RepublicEastern AfricaEastern AsiaEastern EuropeEcuadorEgyptEl SalvadorEnglandEritreaEthiopiaEuropeFijiFranceGermanyGhanaGreeceGrenadaGuatemalaGuyanaHaitiHondurasHong KongHungaryIndiaIndonesiaIranIraqIrelandIsraelItalyJamaicaJapanJordanKazakhstanKenyaKoreaKuwaitLaosLatin AmericaLatviaLebanonLiberiaLithuaniaMalaysiaMexicoMicronesiaMiddle AfricaMoldovaMoroccoNepalNetherlandsNicaraguaNigeriaNorth AmericaNorth MacedoniaNorthern AfricaNorthern EuropeNorwayOceaniaPakistanPanamaPeruPhilippinesPolandPortugalRomaniaRussiaSaudi ArabiaScotlandSenegalSerbiaSierra LeoneSingaporeSomaliaSouth AfricaSouth AmericaSouth Central AsiaSouth Eastern AsiaSouthern EuropeSpainSri LankaSt. Vincent and the GrenadinesSudanSwedenSwitzerlandSyriaTaiwanThailandTrinidad and TobagoTurkeyUgandaUkraineUruguayUzbekistanVenezuelaVietnamWest IndiesWestern AfricaWestern AsiaWestern EuropeYemenZaireZimbabweAzores
Select to Compare
Race
Ancestry
AfghanAfricanAlaska NativeAlaskan AthabascanAlbanianAleutAlsatianAmericanApacheArabArapahoArgentineanArmenianAssyrian/Chaldean/SyriacAustralianAustrianBahamianBangladeshiBarbadianBasqueBelgianBelizeanBermudanBhutaneseBlackfeetBolivianBrazilianBritishBritish West IndianBulgarianBurmeseCajunCambodianCanadianCape VerdeanCarpatho RusynCelticCentral AmericanCentral American IndianCherokeeCheyenneChickasawChileanChineseChippewaChoctawColombianColvilleComancheCosta RicanCreeCreekCroatianCrowCubanCypriotCzechCzechoslovakianDanishDelawareDominicanDutchDutch West IndianEastern EuropeanEcuadorianEgyptianEnglishEstonianEthiopianEuropeanFijianFilipinoFinnishFrenchFrench American IndianFrench CanadianGermanGerman RussianGhanaianGreekGuatemalanGuyaneseHaitianHmongHonduranHopiHoumaHungarianIcelanderIndian (Asian)IndonesianInupiatIranianIraqiIrishIroquoisIsraeliItalianJamaicanJapaneseJordanianKenyanKiowaKoreanLaotianLatvianLebaneseLiberianLithuanianLumbeeLuxembourgerMacedonianMalaysianMalteseMarshalleseMenomineeMexicanMexican American IndianMongolianMoroccanNative HawaiianNavajoNepaleseNew ZealanderNicaraguanNigerianNorthern EuropeanNorwegianOkinawanOsageOttawaPaiutePakistaniPalestinianPanamanianParaguayanPennsylvania GermanPeruvianPimaPolishPortuguesePotawatomiPuebloPuerto RicanPuget Sound SalishRomanianRussianSalvadoranSamoanScandinavianScotch-IrishScottishSeminoleSenegaleseSerbianShoshoneSierra LeoneanSiouxSlavicSlovakSloveneSomaliSouth AfricanSouth AmericanSouth American IndianSoviet UnionSpaniardSpanishSpanish AmericanSpanish American IndianSri LankanSubsaharan AfricanSudaneseSwedishSwissSyrianTaiwaneseThaiTlingit-HaidaTohono O'OdhamTonganTrinidadian and TobagonianTsimshianTurkishU.S. Virgin IslanderUgandanUkrainianUruguayanUteVenezuelanVietnameseWelshWest IndianYakamaYaquiYugoslavianYumanYup'ikZimbabwean
Immigration
NonimmigrantsImmigrantsAfghanistanAfricaAlbaniaArgentinaArmeniaAsiaAustraliaAustriaBahamasBangladeshBarbadosBelarusBelgiumBelizeBoliviaBosnia and HerzegovinaBrazilBulgariaBurma/MyanmarCabo VerdeCambodiaCameroonCanadaCaribbeanCentral AmericaChileChinaColombiaCongoCosta RicaCroatiaCubaCzechoslovakiaDenmarkDominicaDominican RepublicEastern AfricaEastern AsiaEastern EuropeEcuadorEgyptEl SalvadorEnglandEritreaEthiopiaEuropeFijiFranceGermanyGhanaGreeceGrenadaGuatemalaGuyanaHaitiHondurasHong KongHungaryIndiaIndonesiaIranIraqIrelandIsraelItalyJamaicaJapanJordanKazakhstanKenyaKoreaKuwaitLaosLatin AmericaLatviaLebanonLiberiaLithuaniaMalaysiaMexicoMicronesiaMiddle AfricaMoldovaMoroccoNepalNetherlandsNicaraguaNigeriaNorth AmericaNorth MacedoniaNorthern AfricaNorthern EuropeNorwayOceaniaPakistanPanamaPeruPhilippinesPolandPortugalRomaniaRussiaSaudi ArabiaScotlandSenegalSerbiaSierra LeoneSingaporeSomaliaSouth AfricaSouth AmericaSouth Central AsiaSouth Eastern AsiaSouthern EuropeSpainSri LankaSt. Vincent and the GrenadinesSudanSwedenSwitzerlandSyriaTaiwanThailandTrinidad and TobagoTurkeyUgandaUkraineUruguayUzbekistanVenezuelaVietnamWest IndiesWestern AfricaWestern AsiaWestern EuropeYemenZaireZimbabweAzores
Female Disability
Income
Poverty
Unemployment
Labor Participation
Family Structure
Vehicle Availability
Education Level
Disability

Guamanian/Chamorro Female Disability
Tragic

12.5%
DISABILITY | FEMALES
9.5/ 100
METRIC RATING
223rd/ 347
METRIC RANK

Guamanian/Chamorro Female Disability Correlation Chart

The statistical analysis conducted on geographies consisting of 221,879,045 people shows a mild positive correlation between the proportion of Guamanians/Chamorros and percentage of females with a disability in the United States with a correlation coefficient (R) of 0.392 and weighted average of 12.5%. On average, for every 1% (one percent) increase in Guamanians/Chamorros within a typical geography, there is an increase of 0.44% in percentage of females with a disability.
Guamanian/Chamorro Female Disability
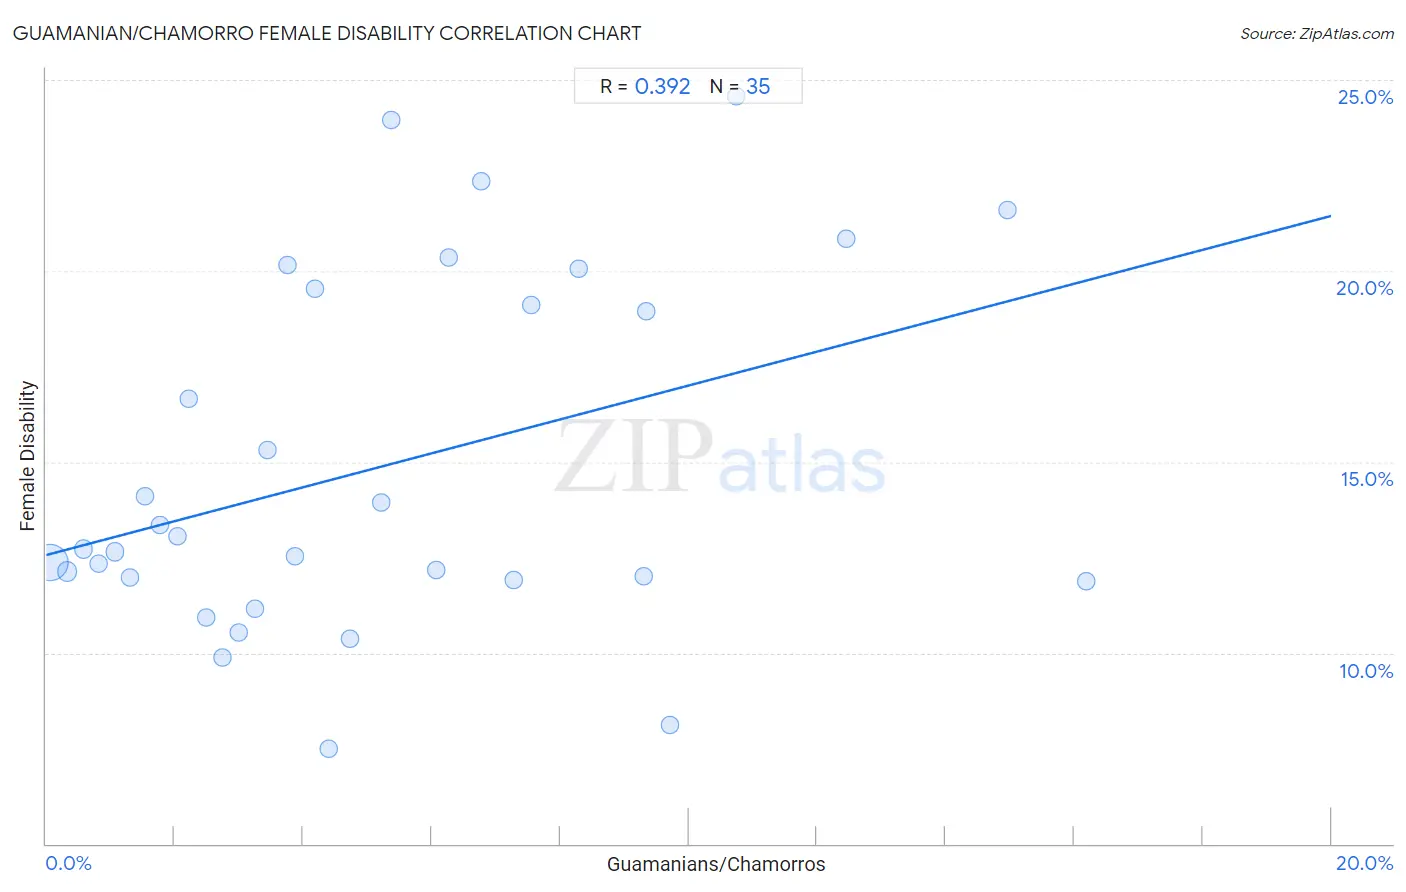
It is essential to understand that the correlation between the percentage of Guamanians/Chamorros and percentage of females with a disability does not imply a direct cause-and-effect relationship. It remains uncertain whether the presence of Guamanians/Chamorros influences an upward or downward trend in the level of percentage of females with a disability within an area, or if Guamanians/Chamorros simply ended up residing in those areas with higher or lower levels of percentage of females with a disability due to other factors.

Demographics Similar to Guamanians/Chamorros by Female Disability

In terms of female disability, the demographic groups most similar to Guamanians/Chamorros are Belizean (12.5%, a difference of 0.020%), Polish (12.5%, a difference of 0.12%), Italian (12.4%, a difference of 0.13%), Native Hawaiian (12.4%, a difference of 0.14%), and Bahamian (12.4%, a difference of 0.16%).
DemographicsRating | RankFemale Disability
Immigrants from Burma/Myanmar
13.3
/100
|
#216
Poor
12.4%
British
12.7
/100
|
#217
Poor
12.4%
Immigrants from Bahamas
12.5
/100
|
#218
Poor
12.4%
Europeans
12.1
/100
|
#219
Poor
12.4%
Bahamians
11.1
/100
|
#220
Poor
12.4%
Native Hawaiians
10.8
/100
|
#221
Poor
12.4%
Italians
10.7
/100
|
#222
Poor
12.4%
Guamanians/Chamorros
9.5
/100
|
#223
Tragic
12.5%
Belizeans
9.3
/100
|
#224
Tragic
12.5%
Poles
8.4
/100
|
#225
Tragic
12.5%
Hispanics or Latinos
8.0
/100
|
#226
Tragic
12.5%
Assyrians/Chaldeans/Syriacs
8.0
/100
|
#227
Tragic
12.5%
Immigrants from Cambodia
7.8
/100
|
#228
Tragic
12.5%
Hungarians
7.2
/100
|
#229
Tragic
12.5%
Immigrants from Belize
7.0
/100
|
#230
Tragic
12.5%

Guamanian/Chamorro Female Disability Correlation Summary

MeasurementGuamanian/Chamorro DataFemale Disability Data
Minimum0.066%7.5%
Maximum16.2%24.6%
Range16.1%17.1%
Mean5.2%14.9%
Median4.2%12.7%
Interquartile 25% (IQ1)2.0%11.9%
Interquartile 75% (IQ3)7.5%19.5%
Interquartile Range (IQR)5.5%7.6%
Standard Deviation (Sample)4.1%4.7%
Standard Deviation (Population)4.1%4.6%

Correlation Details

Guamanian/Chamorro PercentileSample SizeFemale Disability
[
0.0%
-
0.5%
]
0.066%
190,845,15312.4%
[
0.0%
-
0.5%
]
0.33%
20,056,04112.1%
[
0.5%
-
1.0%
]
0.58%
5,624,07812.7%
[
0.5%
-
1.0%
]
0.82%
2,549,88512.3%
[
1.0%
-
1.5%
]
1.08%
1,257,58212.6%
[
1.0%
-
1.5%
]
1.29%
477,45912.0%
[
1.5%
-
2.0%
]
1.54%
411,72814.1%
[
1.5%
-
2.0%
]
1.78%
203,35013.4%
[
2.0%
-
2.5%
]
2.04%
135,54913.1%
[
2.0%
-
2.5%
]
2.22%
66,56416.6%
[
2.0%
-
2.5%
]
2.49%
49,70310.9%
[
2.5%
-
3.0%
]
2.74%
24,7129.9%
[
2.5%
-
3.0%
]
2.99%
30,24110.5%
[
3.0%
-
3.5%
]
3.26%
27,98811.2%
[
3.0%
-
3.5%
]
3.45%
45,98415.3%
[
3.5%
-
4.0%
]
3.75%
9,68020.2%
[
3.5%
-
4.0%
]
3.86%
4,60812.5%
[
4.0%
-
4.5%
]
4.19%
7,78219.5%
[
4.0%
-
4.5%
]
4.41%
5,3797.5%
[
4.5%
-
5.0%
]
4.72%
25,53510.4%
[
5.0%
-
5.5%
]
5.22%
1,97414.0%
[
5.0%
-
5.5%
]
5.38%
18624.0%
[
6.0%
-
6.5%
]
6.07%
4,75812.2%
[
6.0%
-
6.5%
]
6.27%
1,61120.3%
[
6.5%
-
7.0%
]
6.77%
1,38822.4%
[
7.0%
-
7.5%
]
7.27%
1,21111.9%
[
7.5%
-
8.0%
]
7.55%
1,66919.1%
[
8.0%
-
8.5%
]
8.29%
5,26220.1%
[
9.0%
-
9.5%
]
9.30%
17212.0%
[
9.0%
-
9.5%
]
9.34%
57818.9%
[
9.5%
-
10.0%
]
9.70%
4028.1%
[
10.5%
-
11.0%
]
10.74%
12124.6%
[
12.0%
-
12.5%
]
12.46%
31320.9%
[
14.5%
-
15.0%
]
14.97%
29421.6%
[
16.0%
-
16.5%
]
16.19%
10511.9%