Guamanian/Chamorro Unemployment
COMPARE
Guamanian/Chamorro
Select to Compare
Unemployment
Guamanian/Chamorro Unemployment
5.5%
UNEMPLOYMENT
6.3/ 100
METRIC RATING
228th/ 347
METRIC RANK
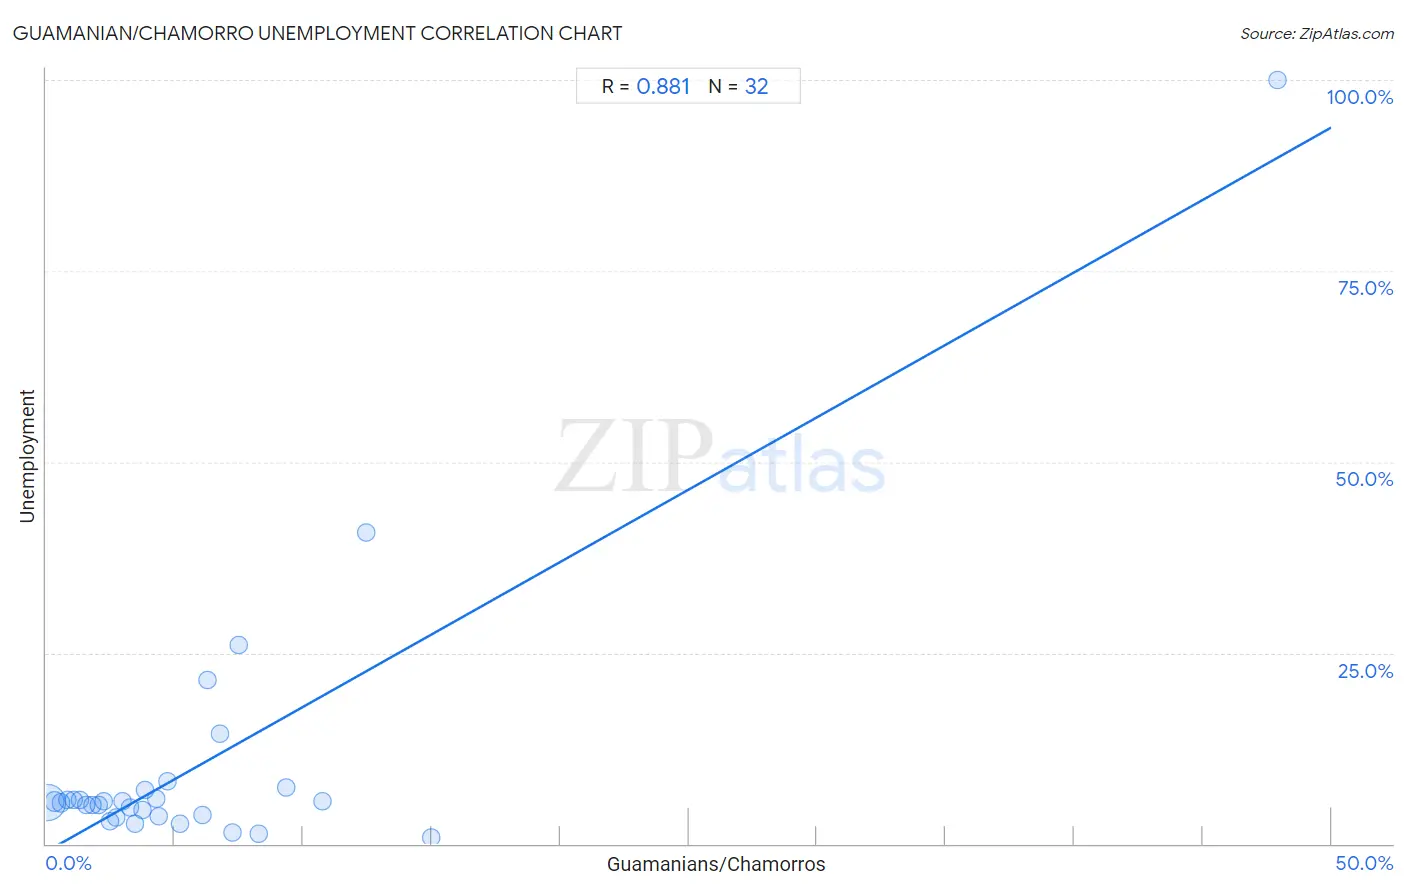
Guamanian/Chamorro Unemployment Correlation Chart
The statistical analysis conducted on geographies consisting of 221,788,183 people shows a very strong positive correlation between the proportion of Guamanians/Chamorros and unemployment in the United States with a correlation coefficient (R) of 0.881 and weighted average of 5.5%. On average, for every 1% (one percent) increase in Guamanians/Chamorros within a typical geography, there is an increase of 1.9% in unemployment.
It is essential to understand that the correlation between the percentage of Guamanians/Chamorros and unemployment does not imply a direct cause-and-effect relationship. It remains uncertain whether the presence of Guamanians/Chamorros influences an upward or downward trend in the level of unemployment within an area, or if Guamanians/Chamorros simply ended up residing in those areas with higher or lower levels of unemployment due to other factors.
Demographics Similar to Guamanians/Chamorros by Unemployment
In terms of unemployment, the demographic groups most similar to Guamanians/Chamorros are Immigrants from Lebanon (5.5%, a difference of 0.15%), Samoan (5.5%, a difference of 0.18%), Hawaiian (5.5%, a difference of 0.26%), Ottawa (5.5%, a difference of 0.26%), and South American Indian (5.5%, a difference of 0.33%).
| Demographics | Rating | Rank | Unemployment |
| Immigrants from Philippines | 10.4 /100 | #221 | Poor 5.4% |
| Iroquois | 10.3 /100 | #222 | Poor 5.4% |
| Seminole | 9.2 /100 | #223 | Tragic 5.4% |
| Israelis | 8.8 /100 | #224 | Tragic 5.4% |
| South American Indians | 7.8 /100 | #225 | Tragic 5.5% |
| Samoans | 7.1 /100 | #226 | Tragic 5.5% |
| Immigrants from Lebanon | 7.0 /100 | #227 | Tragic 5.5% |
| Guamanians/Chamorros | 6.3 /100 | #228 | Tragic 5.5% |
| Hawaiians | 5.4 /100 | #229 | Tragic 5.5% |
| Ottawa | 5.4 /100 | #230 | Tragic 5.5% |
| Immigrants from Africa | 4.9 /100 | #231 | Tragic 5.5% |
| Comanche | 4.9 /100 | #232 | Tragic 5.5% |
| Immigrants from Syria | 4.8 /100 | #233 | Tragic 5.5% |
| Panamanians | 4.7 /100 | #234 | Tragic 5.5% |
| Immigrants from Panama | 3.4 /100 | #235 | Tragic 5.5% |
Guamanian/Chamorro Unemployment Correlation Summary
| Measurement | Guamanian/Chamorro Data | Unemployment Data |
| Minimum | 0.066% | 0.80% |
| Maximum | 47.9% | 100.0% |
| Range | 47.8% | 99.2% |
| Mean | 6.0% | 10.3% |
| Median | 3.8% | 5.5% |
| Interquartile 25% (IQ1) | 1.9% | 3.6% |
| Interquartile 75% (IQ3) | 7.0% | 6.5% |
| Interquartile Range (IQR) | 5.1% | 2.8% |
| Standard Deviation (Sample) | 8.5% | 18.2% |
| Standard Deviation (Population) | 8.3% | 17.9% |
Correlation Details
| Guamanian/Chamorro Percentile | Sample Size | Unemployment |
[ 0.0% - 0.5% ] 0.066% | 190,832,471 | 5.4% |
[ 0.0% - 0.5% ] 0.33% | 20,030,095 | 5.6% |
[ 0.5% - 1.0% ] 0.58% | 5,609,816 | 5.4% |
[ 0.5% - 1.0% ] 0.82% | 2,543,926 | 5.7% |
[ 1.0% - 1.5% ] 1.08% | 1,255,367 | 5.7% |
[ 1.0% - 1.5% ] 1.29% | 476,241 | 5.7% |
[ 1.5% - 2.0% ] 1.55% | 408,536 | 5.1% |
[ 1.5% - 2.0% ] 1.78% | 190,584 | 5.1% |
[ 2.0% - 2.5% ] 2.04% | 133,569 | 5.1% |
[ 2.0% - 2.5% ] 2.22% | 66,350 | 5.6% |
[ 2.0% - 2.5% ] 2.49% | 49,703 | 2.9% |
[ 2.5% - 3.0% ] 2.74% | 24,712 | 3.5% |
[ 2.5% - 3.0% ] 2.99% | 29,553 | 5.5% |
[ 3.0% - 3.5% ] 3.26% | 27,204 | 4.8% |
[ 3.0% - 3.5% ] 3.45% | 45,984 | 2.6% |
[ 3.5% - 4.0% ] 3.75% | 8,180 | 4.4% |
[ 3.5% - 4.0% ] 3.86% | 4,608 | 7.1% |
[ 4.0% - 4.5% ] 4.26% | 2,978 | 5.9% |
[ 4.0% - 4.5% ] 4.40% | 4,842 | 3.6% |
[ 4.5% - 5.0% ] 4.73% | 24,967 | 8.2% |
[ 5.0% - 5.5% ] 5.22% | 1,974 | 2.7% |
[ 6.0% - 6.5% ] 6.07% | 4,758 | 3.7% |
[ 6.0% - 6.5% ] 6.27% | 1,642 | 21.5% |
[ 6.5% - 7.0% ] 6.77% | 1,388 | 14.4% |
[ 7.0% - 7.5% ] 7.27% | 1,128 | 1.5% |
[ 7.0% - 7.5% ] 7.50% | 920 | 26.0% |
[ 8.0% - 8.5% ] 8.29% | 5,262 | 1.4% |
[ 9.0% - 9.5% ] 9.34% | 578 | 7.4% |
[ 10.5% - 11.0% ] 10.74% | 121 | 5.6% |
[ 12.0% - 12.5% ] 12.46% | 313 | 40.7% |
[ 14.5% - 15.0% ] 14.97% | 294 | 0.80% |
[ 47.5% - 48.0% ] 47.90% | 119 | 100.0% |