Guamanian/Chamorro No Vehicles in Household
COMPARE
Guamanian/Chamorro
Select to Compare
No Vehicles in Household
Guamanian/Chamorro No Vehicles in Household
8.0%
NO VEHICLES AVAILABLE
99.9/ 100
METRIC RATING
49th/ 347
METRIC RANK
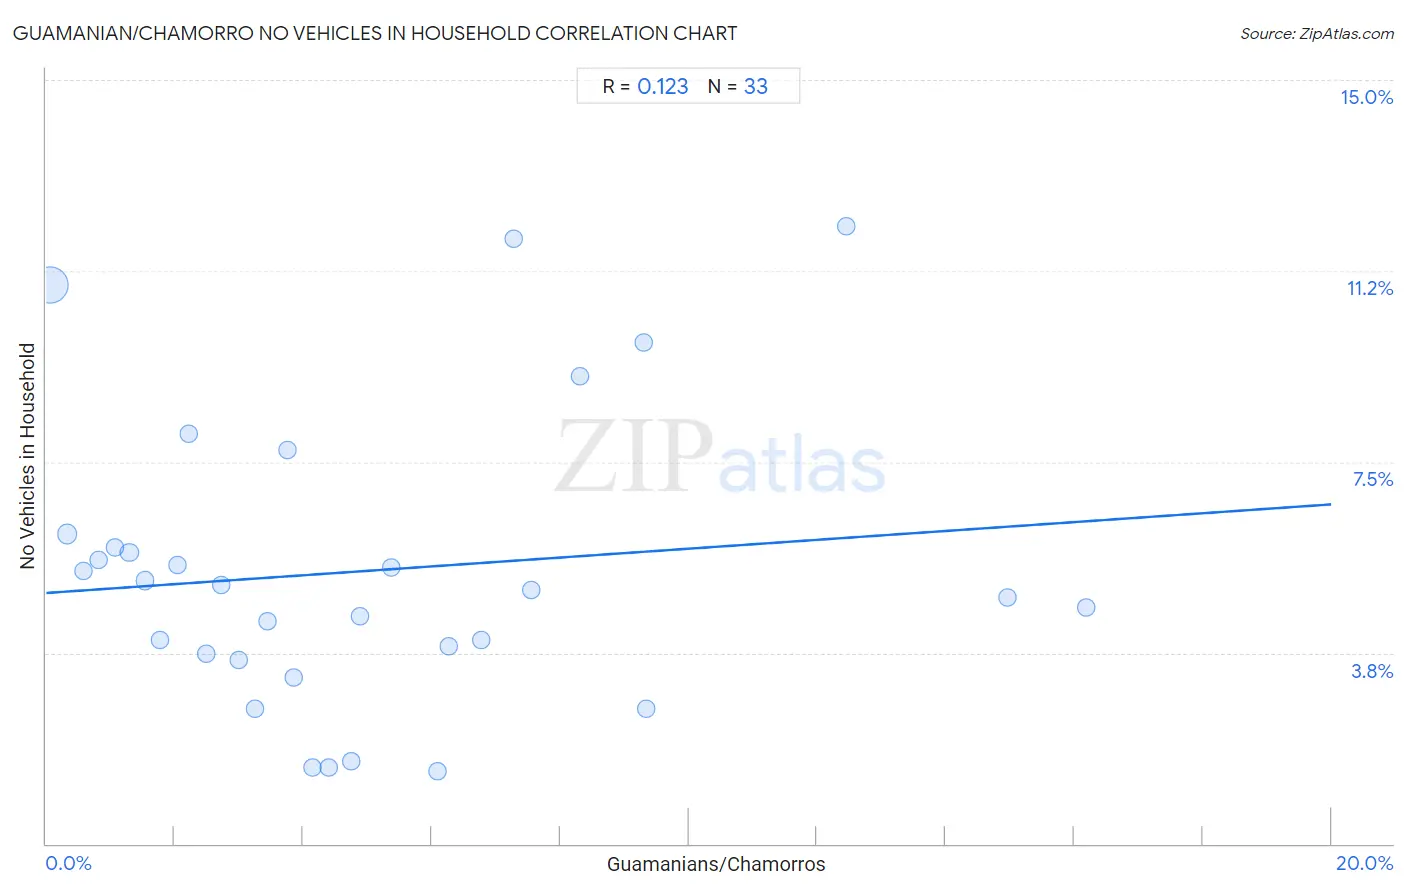
Guamanian/Chamorro No Vehicles in Household Correlation Chart
The statistical analysis conducted on geographies consisting of 221,696,459 people shows a poor positive correlation between the proportion of Guamanians/Chamorros and percentage of households with no vehicle available in the United States with a correlation coefficient (R) of 0.123 and weighted average of 8.0%. On average, for every 1% (one percent) increase in Guamanians/Chamorros within a typical geography, there is an increase of 0.087% in percentage of households with no vehicle available.
It is essential to understand that the correlation between the percentage of Guamanians/Chamorros and percentage of households with no vehicle available does not imply a direct cause-and-effect relationship. It remains uncertain whether the presence of Guamanians/Chamorros influences an upward or downward trend in the level of percentage of households with no vehicle available within an area, or if Guamanians/Chamorros simply ended up residing in those areas with higher or lower levels of percentage of households with no vehicle available due to other factors.
Demographics Similar to Guamanians/Chamorros by No Vehicles in Household
In terms of no vehicles in household, the demographic groups most similar to Guamanians/Chamorros are Belgian (8.0%, a difference of 0.070%), Afghan (8.0%, a difference of 0.17%), Korean (8.0%, a difference of 0.17%), Northern European (7.9%, a difference of 0.65%), and Hawaiian (8.0%, a difference of 0.75%).
| Demographics | Rating | Rank | No Vehicles in Household |
| Swiss | 99.9 /100 | #42 | Exceptional 7.9% |
| Chickasaw | 99.9 /100 | #43 | Exceptional 7.9% |
| Choctaw | 99.9 /100 | #44 | Exceptional 7.9% |
| Nonimmigrants | 99.9 /100 | #45 | Exceptional 7.9% |
| Spanish | 99.9 /100 | #46 | Exceptional 7.9% |
| Northern Europeans | 99.9 /100 | #47 | Exceptional 7.9% |
| Afghans | 99.9 /100 | #48 | Exceptional 8.0% |
| Guamanians/Chamorros | 99.9 /100 | #49 | Exceptional 8.0% |
| Belgians | 99.9 /100 | #50 | Exceptional 8.0% |
| Koreans | 99.9 /100 | #51 | Exceptional 8.0% |
| Hawaiians | 99.9 /100 | #52 | Exceptional 8.0% |
| Slovenes | 99.9 /100 | #53 | Exceptional 8.0% |
| Immigrants from Venezuela | 99.9 /100 | #54 | Exceptional 8.1% |
| Celtics | 99.9 /100 | #55 | Exceptional 8.1% |
| Immigrants from Afghanistan | 99.9 /100 | #56 | Exceptional 8.1% |
Guamanian/Chamorro No Vehicles in Household Correlation Summary
| Measurement | Guamanian/Chamorro Data | No Vehicles in Household Data |
| Minimum | 0.066% | 1.4% |
| Maximum | 16.2% | 12.1% |
| Range | 16.1% | 10.7% |
| Mean | 4.9% | 5.4% |
| Median | 3.9% | 5.0% |
| Interquartile 25% (IQ1) | 1.9% | 3.7% |
| Interquartile 75% (IQ3) | 7.0% | 6.0% |
| Interquartile Range (IQR) | 5.1% | 2.3% |
| Standard Deviation (Sample) | 4.0% | 2.9% |
| Standard Deviation (Population) | 4.0% | 2.8% |
Correlation Details
| Guamanian/Chamorro Percentile | Sample Size | No Vehicles in Household |
[ 0.0% - 0.5% ] 0.066% | 190,817,670 | 11.0% |
[ 0.0% - 0.5% ] 0.33% | 19,997,434 | 6.1% |
[ 0.5% - 1.0% ] 0.58% | 5,588,846 | 5.4% |
[ 0.5% - 1.0% ] 0.82% | 2,549,026 | 5.6% |
[ 1.0% - 1.5% ] 1.08% | 1,236,402 | 5.8% |
[ 1.0% - 1.5% ] 1.29% | 466,509 | 5.7% |
[ 1.5% - 2.0% ] 1.54% | 407,046 | 5.2% |
[ 1.5% - 2.0% ] 1.78% | 202,770 | 4.0% |
[ 2.0% - 2.5% ] 2.04% | 134,624 | 5.5% |
[ 2.0% - 2.5% ] 2.22% | 64,940 | 8.1% |
[ 2.0% - 2.5% ] 2.49% | 48,937 | 3.7% |
[ 2.5% - 3.0% ] 2.73% | 20,132 | 5.1% |
[ 2.5% - 3.0% ] 2.99% | 29,862 | 3.6% |
[ 3.0% - 3.5% ] 3.26% | 27,988 | 2.6% |
[ 3.0% - 3.5% ] 3.45% | 45,984 | 4.4% |
[ 3.5% - 4.0% ] 3.75% | 8,180 | 7.7% |
[ 3.5% - 4.0% ] 3.85% | 2,674 | 3.3% |
[ 4.0% - 4.5% ] 4.14% | 4,804 | 1.5% |
[ 4.0% - 4.5% ] 4.40% | 5,199 | 1.5% |
[ 4.5% - 5.0% ] 4.74% | 18,866 | 1.6% |
[ 4.5% - 5.0% ] 4.88% | 3,748 | 4.5% |
[ 5.0% - 5.5% ] 5.38% | 186 | 5.4% |
[ 6.0% - 6.5% ] 6.09% | 2,643 | 1.4% |
[ 6.0% - 6.5% ] 6.27% | 1,611 | 3.9% |
[ 6.5% - 7.0% ] 6.77% | 1,388 | 4.0% |
[ 7.0% - 7.5% ] 7.27% | 1,211 | 11.9% |
[ 7.5% - 8.0% ] 7.55% | 1,669 | 5.0% |
[ 8.0% - 8.5% ] 8.30% | 4,648 | 9.2% |
[ 9.0% - 9.5% ] 9.30% | 172 | 9.8% |
[ 9.0% - 9.5% ] 9.34% | 578 | 2.7% |
[ 12.0% - 12.5% ] 12.46% | 313 | 12.1% |
[ 14.5% - 15.0% ] 14.97% | 294 | 4.8% |
[ 16.0% - 16.5% ] 16.19% | 105 | 4.7% |