Cape Verdean Male Disability
COMPARE
Cape Verdean
Select to Compare
Male Disability
Cape Verdean Male Disability
12.8%
DISABILITY | MALES
0.0/ 100
METRIC RATING
287th/ 347
METRIC RANK
Cape Verdean Male Disability Correlation Chart
The statistical analysis conducted on geographies consisting of 107,575,167 people shows a moderate positive correlation between the proportion of Cape Verdeans and percentage of males with a disability in the United States with a correlation coefficient (R) of 0.432 and weighted average of 12.8%. On average, for every 1% (one percent) increase in Cape Verdeans within a typical geography, there is an increase of 0.27% in percentage of males with a disability.
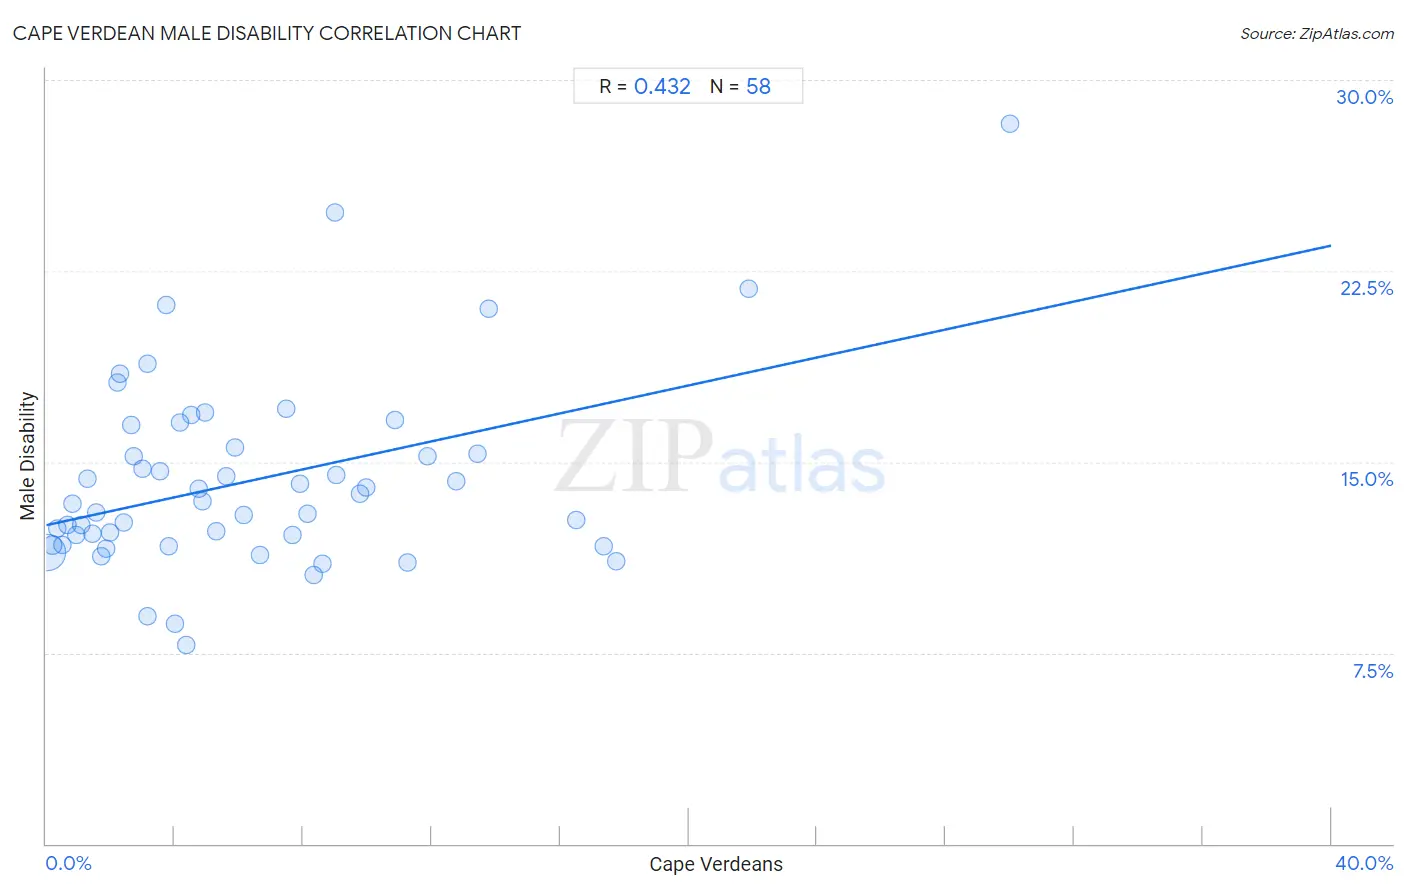
It is essential to understand that the correlation between the percentage of Cape Verdeans and percentage of males with a disability does not imply a direct cause-and-effect relationship. It remains uncertain whether the presence of Cape Verdeans influences an upward or downward trend in the level of percentage of males with a disability within an area, or if Cape Verdeans simply ended up residing in those areas with higher or lower levels of percentage of males with a disability due to other factors.
Demographics Similar to Cape Verdeans by Male Disability
In terms of male disability, the demographic groups most similar to Cape Verdeans are Scottish (12.8%, a difference of 0.070%), Welsh (12.7%, a difference of 0.12%), Spanish (12.7%, a difference of 0.13%), Yup'ik (12.8%, a difference of 0.19%), and Immigrants from Cabo Verde (12.8%, a difference of 0.38%).
| Demographics | Rating | Rank | Male Disability |
| Dutch | 0.0 /100 | #280 | Tragic 12.7% |
| Sioux | 0.0 /100 | #281 | Tragic 12.7% |
| Irish | 0.0 /100 | #282 | Tragic 12.7% |
| Germans | 0.0 /100 | #283 | Tragic 12.7% |
| Spanish | 0.0 /100 | #284 | Tragic 12.7% |
| Welsh | 0.0 /100 | #285 | Tragic 12.7% |
| Scottish | 0.0 /100 | #286 | Tragic 12.8% |
| Cape Verdeans | 0.0 /100 | #287 | Tragic 12.8% |
| Yup'ik | 0.0 /100 | #288 | Tragic 12.8% |
| Immigrants from Cabo Verde | 0.0 /100 | #289 | Tragic 12.8% |
| Pima | 0.0 /100 | #290 | Tragic 12.8% |
| Whites/Caucasians | 0.0 /100 | #291 | Tragic 12.8% |
| English | 0.0 /100 | #292 | Tragic 12.8% |
| Yaqui | 0.0 /100 | #293 | Tragic 12.9% |
| Marshallese | 0.0 /100 | #294 | Tragic 12.9% |
Cape Verdean Male Disability Correlation Summary
| Measurement | Cape Verdean Data | Male Disability Data |
| Minimum | 0.026% | 7.8% |
| Maximum | 30.0% | 28.3% |
| Range | 30.0% | 20.5% |
| Mean | 6.4% | 14.3% |
| Median | 4.6% | 13.4% |
| Interquartile 25% (IQ1) | 2.2% | 11.7% |
| Interquartile 75% (IQ3) | 9.0% | 15.6% |
| Interquartile Range (IQR) | 6.8% | 3.8% |
| Standard Deviation (Sample) | 5.9% | 3.7% |
| Standard Deviation (Population) | 5.9% | 3.7% |
Correlation Details
| Cape Verdean Percentile | Sample Size | Male Disability |
[ 0.0% - 0.5% ] 0.026% | 93,899,905 | 11.4% |
[ 0.0% - 0.5% ] 0.21% | 5,696,790 | 11.7% |
[ 0.0% - 0.5% ] 0.35% | 2,099,284 | 12.4% |
[ 0.5% - 1.0% ] 0.52% | 1,165,041 | 11.7% |
[ 0.5% - 1.0% ] 0.67% | 704,325 | 12.5% |
[ 0.5% - 1.0% ] 0.82% | 465,586 | 13.4% |
[ 0.5% - 1.0% ] 0.93% | 120,046 | 12.1% |
[ 1.0% - 1.5% ] 1.11% | 281,636 | 12.5% |
[ 1.0% - 1.5% ] 1.28% | 285,083 | 14.3% |
[ 1.0% - 1.5% ] 1.45% | 353,017 | 12.2% |
[ 1.5% - 2.0% ] 1.56% | 107,323 | 13.0% |
[ 1.5% - 2.0% ] 1.72% | 159,156 | 11.3% |
[ 1.5% - 2.0% ] 1.88% | 775,156 | 11.6% |
[ 1.5% - 2.0% ] 2.00% | 61,946 | 12.2% |
[ 2.0% - 2.5% ] 2.20% | 37,789 | 18.1% |
[ 2.0% - 2.5% ] 2.30% | 23,879 | 18.4% |
[ 2.0% - 2.5% ] 2.42% | 11,509 | 12.6% |
[ 2.5% - 3.0% ] 2.66% | 128,771 | 16.4% |
[ 2.5% - 3.0% ] 2.71% | 31,214 | 15.2% |
[ 2.5% - 3.0% ] 2.98% | 59,378 | 14.7% |
[ 3.0% - 3.5% ] 3.14% | 52,431 | 8.9% |
[ 3.0% - 3.5% ] 3.15% | 4,660 | 18.9% |
[ 3.5% - 4.0% ] 3.53% | 26,472 | 14.6% |
[ 3.5% - 4.0% ] 3.73% | 17,164 | 21.2% |
[ 3.5% - 4.0% ] 3.82% | 46,858 | 11.7% |
[ 4.0% - 4.5% ] 4.02% | 8,303 | 8.7% |
[ 4.0% - 4.5% ] 4.18% | 19,604 | 16.6% |
[ 4.0% - 4.5% ] 4.34% | 7,690 | 7.8% |
[ 4.5% - 5.0% ] 4.52% | 13,092 | 16.8% |
[ 4.5% - 5.0% ] 4.73% | 63,899 | 13.9% |
[ 4.5% - 5.0% ] 4.88% | 51,915 | 13.4% |
[ 4.5% - 5.0% ] 4.96% | 26,821 | 17.0% |
[ 5.0% - 5.5% ] 5.28% | 6,802 | 12.3% |
[ 5.5% - 6.0% ] 5.59% | 44,718 | 14.4% |
[ 5.5% - 6.0% ] 5.88% | 55,336 | 15.6% |
[ 6.0% - 6.5% ] 6.16% | 25,084 | 12.9% |
[ 6.5% - 7.0% ] 6.64% | 32,969 | 11.4% |
[ 7.0% - 7.5% ] 7.47% | 4,406 | 17.1% |
[ 7.5% - 8.0% ] 7.67% | 5,305 | 12.1% |
[ 7.5% - 8.0% ] 7.90% | 16,286 | 14.1% |
[ 8.0% - 8.5% ] 8.15% | 12,599 | 13.0% |
[ 8.0% - 8.5% ] 8.34% | 5,074 | 10.5% |
[ 8.5% - 9.0% ] 8.60% | 24,705 | 11.0% |
[ 8.5% - 9.0% ] 8.98% | 2,605 | 24.8% |
[ 9.0% - 9.5% ] 9.02% | 31,903 | 14.5% |
[ 9.5% - 10.0% ] 9.75% | 100,620 | 13.7% |
[ 9.5% - 10.0% ] 9.94% | 75,658 | 14.0% |
[ 10.5% - 11.0% ] 10.85% | 10,530 | 16.6% |
[ 11.0% - 11.5% ] 11.25% | 3,468 | 11.0% |
[ 11.5% - 12.0% ] 11.86% | 47,677 | 15.2% |
[ 12.5% - 13.0% ] 12.76% | 46,623 | 14.2% |
[ 13.0% - 13.5% ] 13.43% | 3,024 | 15.3% |
[ 13.5% - 14.0% ] 13.77% | 1,460 | 21.0% |
[ 16.5% - 17.0% ] 16.51% | 35,488 | 12.7% |
[ 17.0% - 17.5% ] 17.34% | 104,713 | 11.7% |
[ 17.5% - 18.0% ] 17.76% | 69,225 | 11.1% |
[ 21.5% - 22.0% ] 21.87% | 1,820 | 21.8% |
[ 30.0% - 30.5% ] 30.02% | 1,326 | 28.3% |