Cape Verdean vs Czech Disability Age Under 5
COMPARE
Cape Verdean
Czech
Disability Age Under 5
Disability Age Under 5 Comparison
Cape Verdeans
Czechs
1.7%
DISABILITY AGE UNDER 5
0.0/ 100
METRIC RATING
309th/ 347
METRIC RANK
1.5%
DISABILITY AGE UNDER 5
0.0/ 100
METRIC RATING
290th/ 347
METRIC RANK
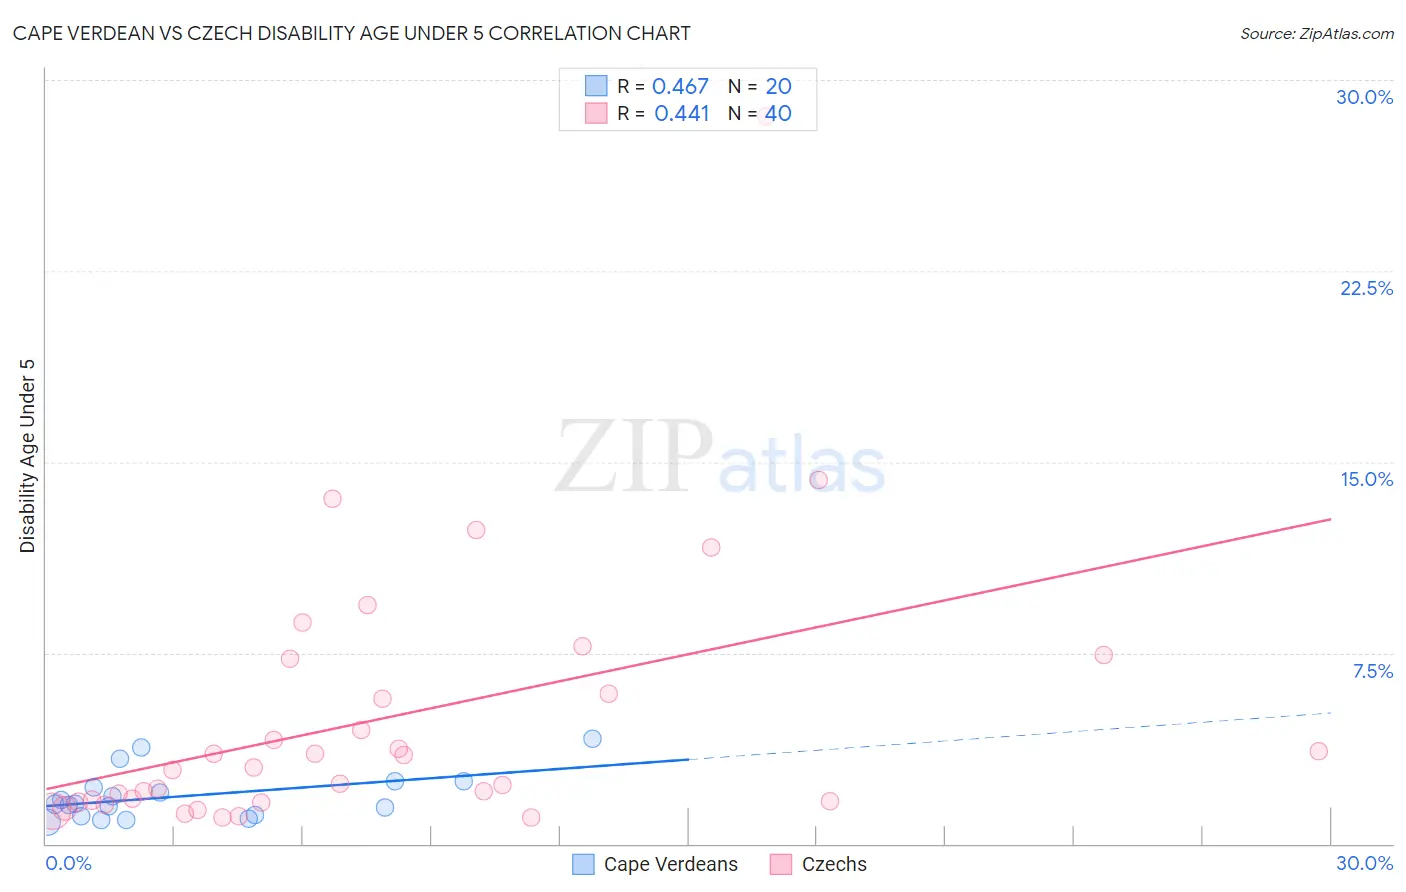
Cape Verdean vs Czech Disability Age Under 5 Correlation Chart
The statistical analysis conducted on geographies consisting of 80,346,766 people shows a moderate positive correlation between the proportion of Cape Verdeans and percentage of population with a disability under the age of 5 in the United States with a correlation coefficient (R) of 0.467 and weighted average of 1.7%. Similarly, the statistical analysis conducted on geographies consisting of 237,038,678 people shows a moderate positive correlation between the proportion of Czechs and percentage of population with a disability under the age of 5 in the United States with a correlation coefficient (R) of 0.441 and weighted average of 1.5%, a difference of 7.1%.
Disability Age Under 5 Correlation Summary
| Measurement | Cape Verdean | Czech |
| Minimum | 0.85% | 1.0% |
| Maximum | 4.1% | 28.6% |
| Range | 3.3% | 27.5% |
| Mean | 1.9% | 4.9% |
| Median | 1.6% | 2.9% |
| Interquartile 25% (IQ1) | 1.1% | 1.7% |
| Interquartile 75% (IQ3) | 2.3% | 6.6% |
| Interquartile Range (IQR) | 1.2% | 4.9% |
| Standard Deviation (Sample) | 0.95% | 5.3% |
| Standard Deviation (Population) | 0.93% | 5.2% |
Demographics Similar to Cape Verdeans and Czechs by Disability Age Under 5
In terms of disability age under 5, the demographic groups most similar to Cape Verdeans are Navajo (1.6%, a difference of 0.63%), Scottish (1.6%, a difference of 0.77%), Creek (1.6%, a difference of 0.84%), Blackfeet (1.6%, a difference of 0.87%), and Seminole (1.6%, a difference of 1.0%). Similarly, the demographic groups most similar to Czechs are Northern European (1.6%, a difference of 0.10%), Hungarian (1.5%, a difference of 0.13%), Italian (1.6%, a difference of 0.24%), Lithuanian (1.6%, a difference of 0.70%), and Swedish (1.6%, a difference of 1.9%).
| Demographics | Rating | Rank | Disability Age Under 5 |
| Hungarians | 0.0 /100 | #289 | Tragic 1.5% |
| Czechs | 0.0 /100 | #290 | Tragic 1.5% |
| Northern Europeans | 0.0 /100 | #291 | Tragic 1.6% |
| Italians | 0.0 /100 | #292 | Tragic 1.6% |
| Lithuanians | 0.0 /100 | #293 | Tragic 1.6% |
| Swedes | 0.0 /100 | #294 | Tragic 1.6% |
| Finns | 0.0 /100 | #295 | Tragic 1.6% |
| Poles | 0.0 /100 | #296 | Tragic 1.6% |
| Immigrants | Nonimmigrants | 0.0 /100 | #297 | Tragic 1.6% |
| Cajuns | 0.0 /100 | #298 | Tragic 1.6% |
| Portuguese | 0.0 /100 | #299 | Tragic 1.6% |
| Shoshone | 0.0 /100 | #300 | Tragic 1.6% |
| German Russians | 0.0 /100 | #301 | Tragic 1.6% |
| Welsh | 0.0 /100 | #302 | Tragic 1.6% |
| Swiss | 0.0 /100 | #303 | Tragic 1.6% |
| Seminole | 0.0 /100 | #304 | Tragic 1.6% |
| Blackfeet | 0.0 /100 | #305 | Tragic 1.6% |
| Creek | 0.0 /100 | #306 | Tragic 1.6% |
| Scottish | 0.0 /100 | #307 | Tragic 1.6% |
| Navajo | 0.0 /100 | #308 | Tragic 1.6% |
| Cape Verdeans | 0.0 /100 | #309 | Tragic 1.7% |