Cape Verdean 1 or more Vehicles in Household
COMPARE
Cape Verdean
Select to Compare
1 or more Vehicles in Household
Cape Verdean 1 or more Vehicles in Household
84.5%
1+ VEHICLES AVAILABLE
0.0/ 100
METRIC RATING
312th/ 347
METRIC RANK
Cape Verdean 1 or more Vehicles in Household Correlation Chart
The statistical analysis conducted on geographies consisting of 107,533,487 people shows a poor negative correlation between the proportion of Cape Verdeans and percentage of households with 1 or more vehicles available in the United States with a correlation coefficient (R) of -0.114 and weighted average of 84.5%. On average, for every 1% (one percent) increase in Cape Verdeans within a typical geography, there is a decrease of 0.15% in percentage of households with 1 or more vehicles available.
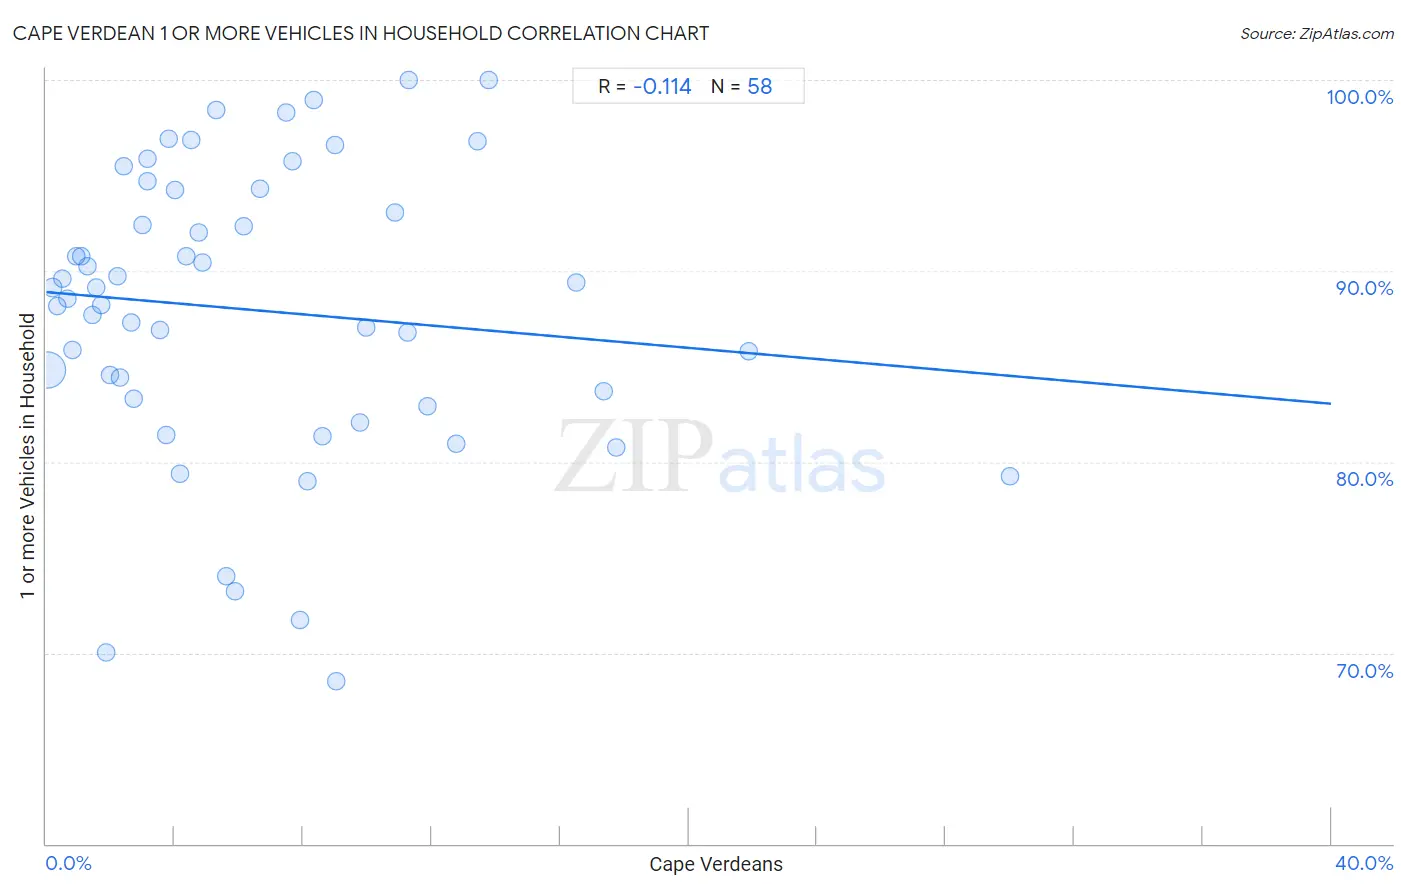
It is essential to understand that the correlation between the percentage of Cape Verdeans and percentage of households with 1 or more vehicles available does not imply a direct cause-and-effect relationship. It remains uncertain whether the presence of Cape Verdeans influences an upward or downward trend in the level of percentage of households with 1 or more vehicles available within an area, or if Cape Verdeans simply ended up residing in those areas with higher or lower levels of percentage of households with 1 or more vehicles available due to other factors.
Demographics Similar to Cape Verdeans by 1 or more Vehicles in Household
In terms of 1 or more vehicles in household, the demographic groups most similar to Cape Verdeans are Immigrants from Israel (84.5%, a difference of 0.020%), Albanian (84.4%, a difference of 0.090%), Puerto Rican (84.6%, a difference of 0.11%), U.S. Virgin Islander (84.6%, a difference of 0.15%), and Cypriot (84.4%, a difference of 0.16%).
| Demographics | Rating | Rank | 1 or more Vehicles in Household |
| Immigrants from China | 0.0 /100 | #305 | Tragic 84.9% |
| Immigrants from Western Africa | 0.0 /100 | #306 | Tragic 84.9% |
| Tohono O'odham | 0.0 /100 | #307 | Tragic 84.7% |
| Immigrants from Belize | 0.0 /100 | #308 | Tragic 84.7% |
| Immigrants from Haiti | 0.0 /100 | #309 | Tragic 84.7% |
| U.S. Virgin Islanders | 0.0 /100 | #310 | Tragic 84.6% |
| Puerto Ricans | 0.0 /100 | #311 | Tragic 84.6% |
| Cape Verdeans | 0.0 /100 | #312 | Tragic 84.5% |
| Immigrants from Israel | 0.0 /100 | #313 | Tragic 84.5% |
| Albanians | 0.0 /100 | #314 | Tragic 84.4% |
| Cypriots | 0.0 /100 | #315 | Tragic 84.4% |
| Alaska Natives | 0.0 /100 | #316 | Tragic 83.8% |
| Ghanaians | 0.0 /100 | #317 | Tragic 83.6% |
| Immigrants from Ghana | 0.0 /100 | #318 | Tragic 83.4% |
| Immigrants from Belarus | 0.0 /100 | #319 | Tragic 83.3% |
Cape Verdean 1 or more Vehicles in Household Correlation Summary
| Measurement | Cape Verdean Data | 1 or more Vehicles in Household Data |
| Minimum | 0.026% | 68.5% |
| Maximum | 30.0% | 100.0% |
| Range | 30.0% | 31.5% |
| Mean | 6.5% | 87.9% |
| Median | 4.6% | 88.8% |
| Interquartile 25% (IQ1) | 2.2% | 83.3% |
| Interquartile 75% (IQ3) | 9.0% | 94.3% |
| Interquartile Range (IQR) | 6.8% | 10.9% |
| Standard Deviation (Sample) | 5.9% | 7.6% |
| Standard Deviation (Population) | 5.9% | 7.6% |
Correlation Details
| Cape Verdean Percentile | Sample Size | 1 or more Vehicles in Household |
[ 0.0% - 0.5% ] 0.026% | 93,893,963 | 84.8% |
[ 0.0% - 0.5% ] 0.21% | 5,698,431 | 89.2% |
[ 0.0% - 0.5% ] 0.35% | 2,099,284 | 88.2% |
[ 0.5% - 1.0% ] 0.52% | 1,160,115 | 89.6% |
[ 0.5% - 1.0% ] 0.67% | 702,304 | 88.5% |
[ 0.5% - 1.0% ] 0.82% | 465,586 | 85.8% |
[ 0.5% - 1.0% ] 0.93% | 120,046 | 90.8% |
[ 1.0% - 1.5% ] 1.11% | 280,317 | 90.7% |
[ 1.0% - 1.5% ] 1.28% | 282,729 | 90.2% |
[ 1.0% - 1.5% ] 1.45% | 353,017 | 87.7% |
[ 1.5% - 2.0% ] 1.56% | 107,323 | 89.1% |
[ 1.5% - 2.0% ] 1.72% | 159,156 | 88.2% |
[ 1.5% - 2.0% ] 1.88% | 775,156 | 70.0% |
[ 1.5% - 2.0% ] 2.00% | 61,946 | 84.5% |
[ 2.0% - 2.5% ] 2.20% | 37,789 | 89.7% |
[ 2.0% - 2.5% ] 2.30% | 23,879 | 84.5% |
[ 2.0% - 2.5% ] 2.42% | 11,509 | 95.5% |
[ 2.5% - 3.0% ] 2.66% | 128,771 | 87.3% |
[ 2.5% - 3.0% ] 2.71% | 31,214 | 83.3% |
[ 2.5% - 3.0% ] 2.98% | 59,378 | 92.4% |
[ 3.0% - 3.5% ] 3.14% | 52,431 | 95.9% |
[ 3.0% - 3.5% ] 3.15% | 4,660 | 94.7% |
[ 3.5% - 4.0% ] 3.53% | 26,472 | 86.9% |
[ 3.5% - 4.0% ] 3.73% | 17,164 | 81.4% |
[ 3.5% - 4.0% ] 3.82% | 46,858 | 96.9% |
[ 4.0% - 4.5% ] 4.02% | 8,303 | 94.3% |
[ 4.0% - 4.5% ] 4.18% | 19,604 | 79.4% |
[ 4.0% - 4.5% ] 4.34% | 7,690 | 90.8% |
[ 4.5% - 5.0% ] 4.52% | 13,092 | 96.8% |
[ 4.5% - 5.0% ] 4.73% | 63,899 | 92.0% |
[ 4.5% - 5.0% ] 4.88% | 51,915 | 90.4% |
[ 5.0% - 5.5% ] 5.28% | 6,802 | 98.4% |
[ 5.5% - 6.0% ] 5.59% | 44,718 | 74.0% |
[ 5.5% - 6.0% ] 5.88% | 55,336 | 73.2% |
[ 6.0% - 6.5% ] 6.16% | 25,084 | 92.3% |
[ 6.5% - 7.0% ] 6.64% | 32,969 | 94.3% |
[ 7.0% - 7.5% ] 7.47% | 4,406 | 98.3% |
[ 7.5% - 8.0% ] 7.67% | 5,305 | 95.7% |
[ 7.5% - 8.0% ] 7.90% | 16,286 | 71.7% |
[ 8.0% - 8.5% ] 8.15% | 12,599 | 79.0% |
[ 8.0% - 8.5% ] 8.34% | 5,074 | 99.0% |
[ 8.5% - 9.0% ] 8.60% | 24,705 | 81.4% |
[ 8.5% - 9.0% ] 8.98% | 2,605 | 96.6% |
[ 9.0% - 9.5% ] 9.02% | 31,903 | 68.5% |
[ 9.5% - 10.0% ] 9.75% | 100,620 | 82.0% |
[ 9.5% - 10.0% ] 9.94% | 75,658 | 87.1% |
[ 10.5% - 11.0% ] 10.85% | 10,530 | 93.0% |
[ 11.0% - 11.5% ] 11.25% | 3,468 | 86.8% |
[ 11.0% - 11.5% ] 11.29% | 62 | 100.0% |
[ 11.5% - 12.0% ] 11.86% | 47,677 | 82.9% |
[ 12.5% - 13.0% ] 12.76% | 46,623 | 81.0% |
[ 13.0% - 13.5% ] 13.43% | 3,024 | 96.8% |
[ 13.5% - 14.0% ] 13.77% | 1,460 | 100.0% |
[ 16.5% - 17.0% ] 16.51% | 35,488 | 89.4% |
[ 17.0% - 17.5% ] 17.34% | 104,713 | 83.7% |
[ 17.5% - 18.0% ] 17.76% | 69,225 | 80.7% |
[ 21.5% - 22.0% ] 21.87% | 1,820 | 85.8% |
[ 30.0% - 30.5% ] 30.02% | 1,326 | 79.2% |