Cape Verdean Married-Couple Family Poverty

COMPARE

Cape Verdean
Race
Ancestry
AfghanAfricanAlaska NativeAlaskan AthabascanAlbanianAleutAlsatianAmericanApacheArabArapahoArgentineanArmenianAssyrian/Chaldean/SyriacAustralianAustrianBahamianBangladeshiBarbadianBasqueBelgianBelizeanBermudanBhutaneseBlackfeetBolivianBrazilianBritishBritish West IndianBulgarianBurmeseCajunCambodianCanadianCape VerdeanCarpatho RusynCelticCentral AmericanCentral American IndianCherokeeCheyenneChickasawChileanChineseChippewaChoctawColombianColvilleComancheCosta RicanCreeCreekCroatianCrowCubanCypriotCzechCzechoslovakianDanishDelawareDominicanDutchDutch West IndianEastern EuropeanEcuadorianEgyptianEnglishEstonianEthiopianEuropeanFijianFilipinoFinnishFrenchFrench American IndianFrench CanadianGermanGerman RussianGhanaianGreekGuamanian/ChamorroGuatemalanGuyaneseHaitianHmongHonduranHopiHoumaHungarianIcelanderIndian (Asian)IndonesianInupiatIranianIraqiIrishIroquoisIsraeliItalianJamaicanJapaneseJordanianKenyanKiowaKoreanLaotianLatvianLebaneseLiberianLithuanianLumbeeLuxembourgerMacedonianMalaysianMalteseMarshalleseMenomineeMexicanMexican American IndianMongolianMoroccanNative HawaiianNavajoNepaleseNew ZealanderNicaraguanNigerianNorthern EuropeanNorwegianOkinawanOsageOttawaPaiutePakistaniPalestinianPanamanianParaguayanPennsylvania GermanPeruvianPimaPolishPortuguesePotawatomiPuebloPuerto RicanPuget Sound SalishRomanianRussianSalvadoranSamoanScandinavianScotch-IrishScottishSeminoleSenegaleseSerbianShoshoneSierra LeoneanSiouxSlavicSlovakSloveneSomaliSouth AfricanSouth AmericanSouth American IndianSoviet UnionSpaniardSpanishSpanish AmericanSpanish American IndianSri LankanSubsaharan AfricanSudaneseSwedishSwissSyrianTaiwaneseThaiTlingit-HaidaTohono O'OdhamTonganTrinidadian and TobagonianTsimshianTurkishU.S. Virgin IslanderUgandanUkrainianUruguayanUteVenezuelanVietnameseWelshWest IndianYakamaYaquiYugoslavianYumanYup'ikZimbabwean
Immigration
NonimmigrantsImmigrantsAfghanistanAfricaAlbaniaArgentinaArmeniaAsiaAustraliaAustriaBahamasBangladeshBarbadosBelarusBelgiumBelizeBoliviaBosnia and HerzegovinaBrazilBulgariaBurma/MyanmarCabo VerdeCambodiaCameroonCanadaCaribbeanCentral AmericaChileChinaColombiaCongoCosta RicaCroatiaCubaCzechoslovakiaDenmarkDominicaDominican RepublicEastern AfricaEastern AsiaEastern EuropeEcuadorEgyptEl SalvadorEnglandEritreaEthiopiaEuropeFijiFranceGermanyGhanaGreeceGrenadaGuatemalaGuyanaHaitiHondurasHong KongHungaryIndiaIndonesiaIranIraqIrelandIsraelItalyJamaicaJapanJordanKazakhstanKenyaKoreaKuwaitLaosLatin AmericaLatviaLebanonLiberiaLithuaniaMalaysiaMexicoMicronesiaMiddle AfricaMoldovaMoroccoNepalNetherlandsNicaraguaNigeriaNorth AmericaNorth MacedoniaNorthern AfricaNorthern EuropeNorwayOceaniaPakistanPanamaPeruPhilippinesPolandPortugalRomaniaRussiaSaudi ArabiaScotlandSenegalSerbiaSierra LeoneSingaporeSomaliaSouth AfricaSouth AmericaSouth Central AsiaSouth Eastern AsiaSouthern EuropeSpainSri LankaSt. Vincent and the GrenadinesSudanSwedenSwitzerlandSyriaTaiwanThailandTrinidad and TobagoTurkeyUgandaUkraineUruguayUzbekistanVenezuelaVietnamWest IndiesWestern AfricaWestern AsiaWestern EuropeYemenZaireZimbabweAzores
Select to Compare
Race
Ancestry
AfghanAfricanAlaska NativeAlaskan AthabascanAlbanianAleutAlsatianAmericanApacheArabArapahoArgentineanArmenianAssyrian/Chaldean/SyriacAustralianAustrianBahamianBangladeshiBarbadianBasqueBelgianBelizeanBermudanBhutaneseBlackfeetBolivianBrazilianBritishBritish West IndianBulgarianBurmeseCajunCambodianCanadianCarpatho RusynCelticCentral AmericanCentral American IndianCherokeeCheyenneChickasawChileanChineseChippewaChoctawColombianColvilleComancheCosta RicanCreeCreekCroatianCrowCubanCypriotCzechCzechoslovakianDanishDelawareDominicanDutchDutch West IndianEastern EuropeanEcuadorianEgyptianEnglishEstonianEthiopianEuropeanFijianFilipinoFinnishFrenchFrench American IndianFrench CanadianGermanGerman RussianGhanaianGreekGuamanian/ChamorroGuatemalanGuyaneseHaitianHmongHonduranHopiHoumaHungarianIcelanderIndian (Asian)IndonesianInupiatIranianIraqiIrishIroquoisIsraeliItalianJamaicanJapaneseJordanianKenyanKiowaKoreanLaotianLatvianLebaneseLiberianLithuanianLumbeeLuxembourgerMacedonianMalaysianMalteseMarshalleseMenomineeMexicanMexican American IndianMongolianMoroccanNative HawaiianNavajoNepaleseNew ZealanderNicaraguanNigerianNorthern EuropeanNorwegianOkinawanOsageOttawaPaiutePakistaniPalestinianPanamanianParaguayanPennsylvania GermanPeruvianPimaPolishPortuguesePotawatomiPuebloPuerto RicanPuget Sound SalishRomanianRussianSalvadoranSamoanScandinavianScotch-IrishScottishSeminoleSenegaleseSerbianShoshoneSierra LeoneanSiouxSlavicSlovakSloveneSomaliSouth AfricanSouth AmericanSouth American IndianSoviet UnionSpaniardSpanishSpanish AmericanSpanish American IndianSri LankanSubsaharan AfricanSudaneseSwedishSwissSyrianTaiwaneseThaiTlingit-HaidaTohono O'OdhamTonganTrinidadian and TobagonianTsimshianTurkishU.S. Virgin IslanderUgandanUkrainianUruguayanUteVenezuelanVietnameseWelshWest IndianYakamaYaquiYugoslavianYumanYup'ikZimbabwean
Immigration
NonimmigrantsImmigrantsAfghanistanAfricaAlbaniaArgentinaArmeniaAsiaAustraliaAustriaBahamasBangladeshBarbadosBelarusBelgiumBelizeBoliviaBosnia and HerzegovinaBrazilBulgariaBurma/MyanmarCabo VerdeCambodiaCameroonCanadaCaribbeanCentral AmericaChileChinaColombiaCongoCosta RicaCroatiaCubaCzechoslovakiaDenmarkDominicaDominican RepublicEastern AfricaEastern AsiaEastern EuropeEcuadorEgyptEl SalvadorEnglandEritreaEthiopiaEuropeFijiFranceGermanyGhanaGreeceGrenadaGuatemalaGuyanaHaitiHondurasHong KongHungaryIndiaIndonesiaIranIraqIrelandIsraelItalyJamaicaJapanJordanKazakhstanKenyaKoreaKuwaitLaosLatin AmericaLatviaLebanonLiberiaLithuaniaMalaysiaMexicoMicronesiaMiddle AfricaMoldovaMoroccoNepalNetherlandsNicaraguaNigeriaNorth AmericaNorth MacedoniaNorthern AfricaNorthern EuropeNorwayOceaniaPakistanPanamaPeruPhilippinesPolandPortugalRomaniaRussiaSaudi ArabiaScotlandSenegalSerbiaSierra LeoneSingaporeSomaliaSouth AfricaSouth AmericaSouth Central AsiaSouth Eastern AsiaSouthern EuropeSpainSri LankaSt. Vincent and the GrenadinesSudanSwedenSwitzerlandSyriaTaiwanThailandTrinidad and TobagoTurkeyUgandaUkraineUruguayUzbekistanVenezuelaVietnamWest IndiesWestern AfricaWestern AsiaWestern EuropeYemenZaireZimbabweAzores
Married-Couple Family Poverty
Income
Poverty
Unemployment
Labor Participation
Family Structure
Vehicle Availability
Education Level
Disability

Cape Verdean Married-Couple Family Poverty
Fair

5.3%
POVERTY | MARRIED-COUPLE FAMILIES
30.7/ 100
METRIC RATING
192nd/ 347
METRIC RANK

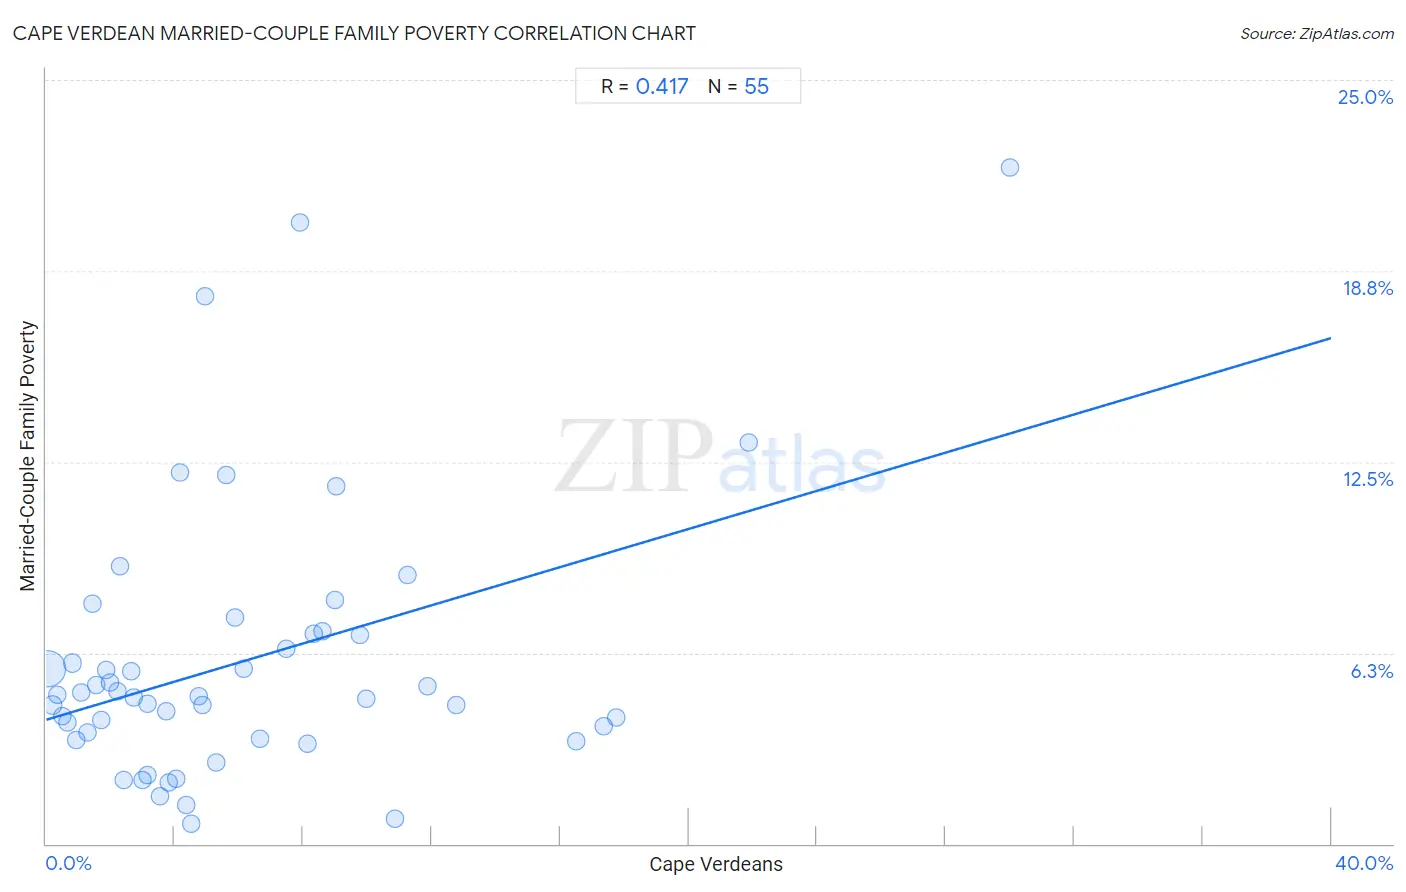
Cape Verdean Married-Couple Family Poverty Correlation Chart

The statistical analysis conducted on geographies consisting of 107,147,993 people shows a moderate positive correlation between the proportion of Cape Verdeans and poverty level among married-couple families in the United States with a correlation coefficient (R) of 0.417 and weighted average of 5.3%. On average, for every 1% (one percent) increase in Cape Verdeans within a typical geography, there is an increase of 0.31% in poverty level among married-couple families.
Cape Verdean Married-Couple Family Poverty
It is essential to understand that the correlation between the percentage of Cape Verdeans and poverty level among married-couple families does not imply a direct cause-and-effect relationship. It remains uncertain whether the presence of Cape Verdeans influences an upward or downward trend in the level of poverty level among married-couple families within an area, or if Cape Verdeans simply ended up residing in those areas with higher or lower levels of poverty level among married-couple families due to other factors.

Demographics Similar to Cape Verdeans by Married-Couple Family Poverty

In terms of married-couple family poverty, the demographic groups most similar to Cape Verdeans are Immigrants from Cabo Verde (5.3%, a difference of 0.030%), Ugandan (5.3%, a difference of 0.12%), Malaysian (5.4%, a difference of 0.17%), South American Indian (5.3%, a difference of 0.23%), and Israeli (5.3%, a difference of 0.32%).
DemographicsRating | RankMarried-Couple Family Poverty
Americans
35.4
/100
|
#185
Fair
5.3%
Hungarians
34.7
/100
|
#186
Fair
5.3%
Immigrants from Albania
33.8
/100
|
#187
Fair
5.3%
Israelis
33.1
/100
|
#188
Fair
5.3%
South American Indians
32.5
/100
|
#189
Fair
5.3%
Ugandans
31.6
/100
|
#190
Fair
5.3%
Immigrants from Cabo Verde
30.9
/100
|
#191
Fair
5.3%
Cape Verdeans
30.7
/100
|
#192
Fair
5.3%
Malaysians
29.5
/100
|
#193
Fair
5.4%
Immigrants from Israel
27.8
/100
|
#194
Fair
5.4%
Immigrants from the Azores
27.5
/100
|
#195
Fair
5.4%
Spaniards
27.4
/100
|
#196
Fair
5.4%
Liberians
26.3
/100
|
#197
Fair
5.4%
Immigrants from Belarus
26.2
/100
|
#198
Fair
5.4%
Uruguayans
25.0
/100
|
#199
Fair
5.4%

Cape Verdean Married-Couple Family Poverty Correlation Summary

MeasurementCape Verdean DataMarried-Couple Family Poverty Data
Minimum0.026%0.66%
Maximum30.0%22.2%
Range30.0%21.5%
Mean6.1%6.0%
Median4.3%4.8%
Interquartile 25% (IQ1)2.0%3.4%
Interquartile 75% (IQ3)8.6%6.9%
Interquartile Range (IQR)6.6%3.4%
Standard Deviation (Sample)5.9%4.4%
Standard Deviation (Population)5.8%4.4%

Correlation Details

Cape Verdean PercentileSample SizeMarried-Couple Family Poverty
[
0.0%
-
0.5%
]
0.026%
93,832,7995.7%
[
0.0%
-
0.5%
]
0.21%
5,578,1364.5%
[
0.0%
-
0.5%
]
0.35%
2,022,6814.9%
[
0.5%
-
1.0%
]
0.52%
1,100,2704.2%
[
0.5%
-
1.0%
]
0.66%
694,4904.0%
[
0.5%
-
1.0%
]
0.82%
462,7735.9%
[
0.5%
-
1.0%
]
0.93%
109,4203.4%
[
1.0%
-
1.5%
]
1.11%
277,6695.0%
[
1.0%
-
1.5%
]
1.28%
282,7293.6%
[
1.0%
-
1.5%
]
1.45%
336,6017.9%
[
1.5%
-
2.0%
]
1.56%
104,7175.2%
[
1.5%
-
2.0%
]
1.72%
155,1904.0%
[
1.5%
-
2.0%
]
1.88%
771,6715.7%
[
1.5%
-
2.0%
]
1.99%
55,4115.3%
[
2.0%
-
2.5%
]
2.20%
30,5585.0%
[
2.0%
-
2.5%
]
2.30%
16,8559.1%
[
2.0%
-
2.5%
]
2.41%
8,8552.1%
[
2.5%
-
3.0%
]
2.66%
128,7715.6%
[
2.5%
-
3.0%
]
2.71%
31,2144.8%
[
2.5%
-
3.0%
]
2.98%
58,9412.1%
[
3.0%
-
3.5%
]
3.15%
49,4382.2%
[
3.0%
-
3.5%
]
3.15%
4,6604.6%
[
3.5%
-
4.0%
]
3.53%
26,4721.6%
[
3.5%
-
4.0%
]
3.73%
17,1644.3%
[
3.5%
-
4.0%
]
3.82%
46,8582.0%
[
4.0%
-
4.5%
]
4.04%
5,5912.1%
[
4.0%
-
4.5%
]
4.18%
19,60412.1%
[
4.0%
-
4.5%
]
4.34%
7,6901.3%
[
4.5%
-
5.0%
]
4.52%
13,0920.66%
[
4.5%
-
5.0%
]
4.73%
59,4364.8%
[
4.5%
-
5.0%
]
4.88%
51,9154.5%
[
4.5%
-
5.0%
]
4.96%
26,82117.9%
[
5.0%
-
5.5%
]
5.28%
6,8022.7%
[
5.5%
-
6.0%
]
5.59%
44,71812.1%
[
5.5%
-
6.0%
]
5.88%
55,3367.4%
[
6.0%
-
6.5%
]
6.16%
25,0845.7%
[
6.5%
-
7.0%
]
6.64%
32,9693.4%
[
7.0%
-
7.5%
]
7.47%
4,4066.4%
[
7.5%
-
8.0%
]
7.90%
16,28620.3%
[
8.0%
-
8.5%
]
8.15%
12,4653.3%
[
8.0%
-
8.5%
]
8.34%
5,0746.9%
[
8.5%
-
9.0%
]
8.60%
24,7057.0%
[
8.5%
-
9.0%
]
8.98%
2,6058.0%
[
9.0%
-
9.5%
]
9.02%
31,90311.7%
[
9.5%
-
10.0%
]
9.75%
100,6206.8%
[
9.5%
-
10.0%
]
9.94%
75,6584.7%
[
10.5%
-
11.0%
]
10.85%
10,5300.83%
[
11.0%
-
11.5%
]
11.25%
3,4688.8%
[
11.5%
-
12.0%
]
11.86%
47,6775.2%
[
12.5%
-
13.0%
]
12.76%
46,6234.5%
[
16.5%
-
17.0%
]
16.51%
35,4883.3%
[
17.0%
-
17.5%
]
17.34%
104,7133.8%
[
17.5%
-
18.0%
]
17.76%
69,2254.1%
[
21.5%
-
22.0%
]
21.87%
1,82013.1%
[
30.0%
-
30.5%
]
30.02%
1,32622.2%