Bangladeshi Disability Age 5 to 17
COMPARE
Bangladeshi
Select to Compare
Disability Age 5 to 17
Bangladeshi Disability Age 5 to 17
5.8%
DISABILITY | AGE 5 TO 17
4.8/ 100
METRIC RATING
229th/ 347
METRIC RANK
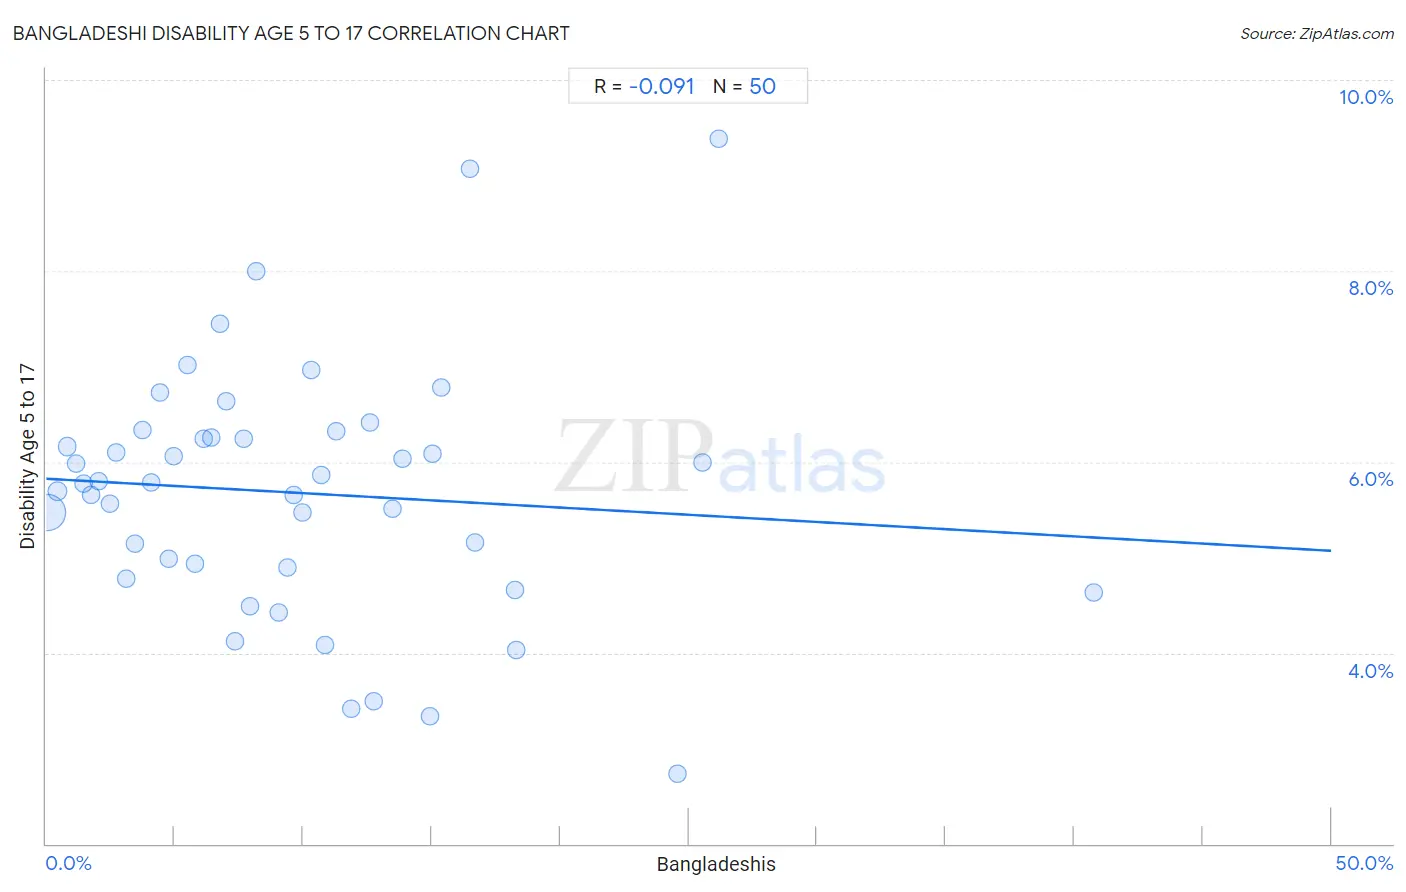
Bangladeshi Disability Age 5 to 17 Correlation Chart
The statistical analysis conducted on geographies consisting of 140,952,749 people shows a slight negative correlation between the proportion of Bangladeshis and percentage of population with a disability between the ages 5 and 17 in the United States with a correlation coefficient (R) of -0.091 and weighted average of 5.8%. On average, for every 1% (one percent) increase in Bangladeshis within a typical geography, there is a decrease of 0.015% in percentage of population with a disability between the ages 5 and 17.
It is essential to understand that the correlation between the percentage of Bangladeshis and percentage of population with a disability between the ages 5 and 17 does not imply a direct cause-and-effect relationship. It remains uncertain whether the presence of Bangladeshis influences an upward or downward trend in the level of percentage of population with a disability between the ages 5 and 17 within an area, or if Bangladeshis simply ended up residing in those areas with higher or lower levels of percentage of population with a disability between the ages 5 and 17 due to other factors.
Demographics Similar to Bangladeshis by Disability Age 5 to 17
In terms of disability age 5 to 17, the demographic groups most similar to Bangladeshis are Haitian (5.8%, a difference of 0.010%), Ghanaian (5.8%, a difference of 0.010%), European (5.8%, a difference of 0.080%), Swiss (5.8%, a difference of 0.090%), and British West Indian (5.8%, a difference of 0.17%).
| Demographics | Rating | Rank | Disability Age 5 to 17 |
| Immigrants from Sudan | 6.7 /100 | #222 | Tragic 5.8% |
| Alsatians | 6.0 /100 | #223 | Tragic 5.8% |
| Mexicans | 5.7 /100 | #224 | Tragic 5.8% |
| Guamanians/Chamorros | 5.6 /100 | #225 | Tragic 5.8% |
| British West Indians | 5.4 /100 | #226 | Tragic 5.8% |
| Swiss | 5.1 /100 | #227 | Tragic 5.8% |
| Haitians | 4.8 /100 | #228 | Tragic 5.8% |
| Bangladeshis | 4.8 /100 | #229 | Tragic 5.8% |
| Ghanaians | 4.7 /100 | #230 | Tragic 5.8% |
| Europeans | 4.5 /100 | #231 | Tragic 5.8% |
| Immigrants from Laos | 3.8 /100 | #232 | Tragic 5.8% |
| Immigrants from West Indies | 3.5 /100 | #233 | Tragic 5.8% |
| Immigrants from Kenya | 3.4 /100 | #234 | Tragic 5.8% |
| Malaysians | 3.4 /100 | #235 | Tragic 5.8% |
| Immigrants from Brazil | 3.2 /100 | #236 | Tragic 5.8% |
Bangladeshi Disability Age 5 to 17 Correlation Summary
| Measurement | Bangladeshi Data | Disability Age 5 to 17 Data |
| Minimum | 0.061% | 2.7% |
| Maximum | 40.7% | 9.4% |
| Range | 40.7% | 6.7% |
| Mean | 9.8% | 5.7% |
| Median | 8.0% | 5.8% |
| Interquartile 25% (IQ1) | 4.1% | 4.9% |
| Interquartile 75% (IQ3) | 13.5% | 6.3% |
| Interquartile Range (IQR) | 9.4% | 1.4% |
| Standard Deviation (Sample) | 7.9% | 1.3% |
| Standard Deviation (Population) | 7.8% | 1.3% |
Correlation Details
| Bangladeshi Percentile | Sample Size | Disability Age 5 to 17 |
[ 0.0% - 0.5% ] 0.061% | 114,649,537 | 5.5% |
[ 0.0% - 0.5% ] 0.45% | 8,693,845 | 5.7% |
[ 0.5% - 1.0% ] 0.80% | 3,528,317 | 6.2% |
[ 1.0% - 1.5% ] 1.16% | 1,814,066 | 6.0% |
[ 1.0% - 1.5% ] 1.45% | 1,948,193 | 5.8% |
[ 1.5% - 2.0% ] 1.75% | 2,113,959 | 5.7% |
[ 2.0% - 2.5% ] 2.04% | 1,189,122 | 5.8% |
[ 2.0% - 2.5% ] 2.47% | 714,287 | 5.6% |
[ 2.5% - 3.0% ] 2.73% | 623,498 | 6.1% |
[ 3.0% - 3.5% ] 3.13% | 466,161 | 4.8% |
[ 3.0% - 3.5% ] 3.47% | 935,988 | 5.1% |
[ 3.5% - 4.0% ] 3.73% | 323,207 | 6.3% |
[ 4.0% - 4.5% ] 4.10% | 530,061 | 5.8% |
[ 4.0% - 4.5% ] 4.42% | 290,206 | 6.7% |
[ 4.5% - 5.0% ] 4.76% | 30,701 | 5.0% |
[ 4.5% - 5.0% ] 4.98% | 761,348 | 6.1% |
[ 5.0% - 5.5% ] 5.48% | 167,116 | 7.0% |
[ 5.5% - 6.0% ] 5.77% | 106,494 | 4.9% |
[ 6.0% - 6.5% ] 6.12% | 174,663 | 6.2% |
[ 6.0% - 6.5% ] 6.44% | 62,099 | 6.3% |
[ 6.5% - 7.0% ] 6.76% | 170,696 | 7.4% |
[ 6.5% - 7.0% ] 6.99% | 50,484 | 6.6% |
[ 7.0% - 7.5% ] 7.32% | 10,557 | 4.1% |
[ 7.5% - 8.0% ] 7.66% | 37,988 | 6.2% |
[ 7.5% - 8.0% ] 7.92% | 42,735 | 4.5% |
[ 8.0% - 8.5% ] 8.18% | 52,886 | 8.0% |
[ 9.0% - 9.5% ] 9.03% | 148,369 | 4.4% |
[ 9.0% - 9.5% ] 9.40% | 51,035 | 4.9% |
[ 9.5% - 10.0% ] 9.63% | 136,085 | 5.7% |
[ 9.5% - 10.0% ] 9.96% | 134,205 | 5.5% |
[ 10.0% - 10.5% ] 10.33% | 63,402 | 7.0% |
[ 10.5% - 11.0% ] 10.72% | 70,827 | 5.9% |
[ 10.5% - 11.0% ] 10.85% | 31,292 | 4.1% |
[ 11.0% - 11.5% ] 11.27% | 308,806 | 6.3% |
[ 11.5% - 12.0% ] 11.89% | 32,912 | 3.4% |
[ 12.5% - 13.0% ] 12.59% | 2,208 | 6.4% |
[ 12.5% - 13.0% ] 12.76% | 84,951 | 3.5% |
[ 13.0% - 13.5% ] 13.48% | 13,459 | 5.5% |
[ 13.5% - 14.0% ] 13.86% | 95,310 | 6.0% |
[ 14.5% - 15.0% ] 14.91% | 932 | 3.3% |
[ 15.0% - 15.5% ] 15.04% | 13,116 | 6.1% |
[ 15.0% - 15.5% ] 15.39% | 132,092 | 6.8% |
[ 16.0% - 16.5% ] 16.48% | 6,790 | 9.1% |
[ 16.5% - 17.0% ] 16.66% | 34,220 | 5.2% |
[ 18.0% - 18.5% ] 18.23% | 7,581 | 4.7% |
[ 18.0% - 18.5% ] 18.31% | 17,716 | 4.0% |
[ 24.5% - 25.0% ] 24.55% | 1,218 | 2.7% |
[ 25.5% - 26.0% ] 25.55% | 57,662 | 6.0% |
[ 26.0% - 26.5% ] 26.16% | 19,613 | 9.4% |
[ 40.5% - 41.0% ] 40.74% | 734 | 4.6% |