Bangladeshi Unemployment Among Women with Children Ages 6 to 17 years

COMPARE

Bangladeshi
Race
Ancestry
AfghanAfricanAlaska NativeAlaskan AthabascanAlbanianAleutAlsatianAmericanApacheArabArapahoArgentineanArmenianAssyrian/Chaldean/SyriacAustralianAustrianBahamianBangladeshiBarbadianBasqueBelgianBelizeanBermudanBhutaneseBlackfeetBolivianBrazilianBritishBritish West IndianBulgarianBurmeseCajunCambodianCanadianCape VerdeanCarpatho RusynCelticCentral AmericanCentral American IndianCherokeeCheyenneChickasawChileanChineseChippewaChoctawColombianColvilleComancheCosta RicanCreeCreekCroatianCrowCubanCypriotCzechCzechoslovakianDanishDelawareDominicanDutchDutch West IndianEastern EuropeanEcuadorianEgyptianEnglishEstonianEthiopianEuropeanFijianFilipinoFinnishFrenchFrench American IndianFrench CanadianGermanGerman RussianGhanaianGreekGuamanian/ChamorroGuatemalanGuyaneseHaitianHmongHonduranHopiHoumaHungarianIcelanderIndian (Asian)IndonesianInupiatIranianIraqiIrishIroquoisIsraeliItalianJamaicanJapaneseJordanianKenyanKiowaKoreanLaotianLatvianLebaneseLiberianLithuanianLumbeeLuxembourgerMacedonianMalaysianMalteseMarshalleseMenomineeMexicanMexican American IndianMongolianMoroccanNative HawaiianNavajoNepaleseNew ZealanderNicaraguanNigerianNorthern EuropeanNorwegianOkinawanOsageOttawaPaiutePakistaniPalestinianPanamanianParaguayanPennsylvania GermanPeruvianPimaPolishPortuguesePotawatomiPuebloPuerto RicanPuget Sound SalishRomanianRussianSalvadoranSamoanScandinavianScotch-IrishScottishSeminoleSenegaleseSerbianShoshoneSierra LeoneanSiouxSlavicSlovakSloveneSomaliSouth AfricanSouth AmericanSouth American IndianSoviet UnionSpaniardSpanishSpanish AmericanSpanish American IndianSri LankanSubsaharan AfricanSudaneseSwedishSwissSyrianTaiwaneseThaiTlingit-HaidaTohono O'OdhamTonganTrinidadian and TobagonianTsimshianTurkishU.S. Virgin IslanderUgandanUkrainianUruguayanUteVenezuelanVietnameseWelshWest IndianYakamaYaquiYugoslavianYumanYup'ikZimbabwean
Immigration
NonimmigrantsImmigrantsAfghanistanAfricaAlbaniaArgentinaArmeniaAsiaAustraliaAustriaBahamasBangladeshBarbadosBelarusBelgiumBelizeBoliviaBosnia and HerzegovinaBrazilBulgariaBurma/MyanmarCabo VerdeCambodiaCameroonCanadaCaribbeanCentral AmericaChileChinaColombiaCongoCosta RicaCroatiaCubaCzechoslovakiaDenmarkDominicaDominican RepublicEastern AfricaEastern AsiaEastern EuropeEcuadorEgyptEl SalvadorEnglandEritreaEthiopiaEuropeFijiFranceGermanyGhanaGreeceGrenadaGuatemalaGuyanaHaitiHondurasHong KongHungaryIndiaIndonesiaIranIraqIrelandIsraelItalyJamaicaJapanJordanKazakhstanKenyaKoreaKuwaitLaosLatin AmericaLatviaLebanonLiberiaLithuaniaMalaysiaMexicoMicronesiaMiddle AfricaMoldovaMoroccoNepalNetherlandsNicaraguaNigeriaNorth AmericaNorth MacedoniaNorthern AfricaNorthern EuropeNorwayOceaniaPakistanPanamaPeruPhilippinesPolandPortugalRomaniaRussiaSaudi ArabiaScotlandSenegalSerbiaSierra LeoneSingaporeSomaliaSouth AfricaSouth AmericaSouth Central AsiaSouth Eastern AsiaSouthern EuropeSpainSri LankaSt. Vincent and the GrenadinesSudanSwedenSwitzerlandSyriaTaiwanThailandTrinidad and TobagoTurkeyUgandaUkraineUruguayUzbekistanVenezuelaVietnamWest IndiesWestern AfricaWestern AsiaWestern EuropeYemenZaireZimbabweAzores
Select to Compare
Race
Ancestry
AfghanAfricanAlaska NativeAlaskan AthabascanAlbanianAleutAlsatianAmericanApacheArabArapahoArgentineanArmenianAssyrian/Chaldean/SyriacAustralianAustrianBahamianBarbadianBasqueBelgianBelizeanBermudanBhutaneseBlackfeetBolivianBrazilianBritishBritish West IndianBulgarianBurmeseCajunCambodianCanadianCape VerdeanCarpatho RusynCelticCentral AmericanCentral American IndianCherokeeCheyenneChickasawChileanChineseChippewaChoctawColombianColvilleComancheCosta RicanCreeCreekCroatianCrowCubanCypriotCzechCzechoslovakianDanishDelawareDominicanDutchDutch West IndianEastern EuropeanEcuadorianEgyptianEnglishEstonianEthiopianEuropeanFijianFilipinoFinnishFrenchFrench American IndianFrench CanadianGermanGerman RussianGhanaianGreekGuamanian/ChamorroGuatemalanGuyaneseHaitianHmongHonduranHopiHoumaHungarianIcelanderIndian (Asian)IndonesianInupiatIranianIraqiIrishIroquoisIsraeliItalianJamaicanJapaneseJordanianKenyanKiowaKoreanLaotianLatvianLebaneseLiberianLithuanianLumbeeLuxembourgerMacedonianMalaysianMalteseMarshalleseMenomineeMexicanMexican American IndianMongolianMoroccanNative HawaiianNavajoNepaleseNew ZealanderNicaraguanNigerianNorthern EuropeanNorwegianOkinawanOsageOttawaPaiutePakistaniPalestinianPanamanianParaguayanPennsylvania GermanPeruvianPimaPolishPortuguesePotawatomiPuebloPuerto RicanPuget Sound SalishRomanianRussianSalvadoranSamoanScandinavianScotch-IrishScottishSeminoleSenegaleseSerbianShoshoneSierra LeoneanSiouxSlavicSlovakSloveneSomaliSouth AfricanSouth AmericanSouth American IndianSoviet UnionSpaniardSpanishSpanish AmericanSpanish American IndianSri LankanSubsaharan AfricanSudaneseSwedishSwissSyrianTaiwaneseThaiTlingit-HaidaTohono O'OdhamTonganTrinidadian and TobagonianTsimshianTurkishU.S. Virgin IslanderUgandanUkrainianUruguayanUteVenezuelanVietnameseWelshWest IndianYakamaYaquiYugoslavianYumanYup'ikZimbabwean
Immigration
NonimmigrantsImmigrantsAfghanistanAfricaAlbaniaArgentinaArmeniaAsiaAustraliaAustriaBahamasBangladeshBarbadosBelarusBelgiumBelizeBoliviaBosnia and HerzegovinaBrazilBulgariaBurma/MyanmarCabo VerdeCambodiaCameroonCanadaCaribbeanCentral AmericaChileChinaColombiaCongoCosta RicaCroatiaCubaCzechoslovakiaDenmarkDominicaDominican RepublicEastern AfricaEastern AsiaEastern EuropeEcuadorEgyptEl SalvadorEnglandEritreaEthiopiaEuropeFijiFranceGermanyGhanaGreeceGrenadaGuatemalaGuyanaHaitiHondurasHong KongHungaryIndiaIndonesiaIranIraqIrelandIsraelItalyJamaicaJapanJordanKazakhstanKenyaKoreaKuwaitLaosLatin AmericaLatviaLebanonLiberiaLithuaniaMalaysiaMexicoMicronesiaMiddle AfricaMoldovaMoroccoNepalNetherlandsNicaraguaNigeriaNorth AmericaNorth MacedoniaNorthern AfricaNorthern EuropeNorwayOceaniaPakistanPanamaPeruPhilippinesPolandPortugalRomaniaRussiaSaudi ArabiaScotlandSenegalSerbiaSierra LeoneSingaporeSomaliaSouth AfricaSouth AmericaSouth Central AsiaSouth Eastern AsiaSouthern EuropeSpainSri LankaSt. Vincent and the GrenadinesSudanSwedenSwitzerlandSyriaTaiwanThailandTrinidad and TobagoTurkeyUgandaUkraineUruguayUzbekistanVenezuelaVietnamWest IndiesWestern AfricaWestern AsiaWestern EuropeYemenZaireZimbabweAzores
Unemployment Among Women with Children Ages 6 to 17 years
Income
Poverty
Unemployment
Labor Participation
Family Structure
Vehicle Availability
Education Level
Disability

Bangladeshi Unemployment Among Women with Children Ages 6 to 17 years
Exceptional

7.4%
UNEMPLOYMENT | WOMEN W/ CHILDREN 6 TO 17
100.0/ 100
METRIC RATING
12th/ 347
METRIC RANK

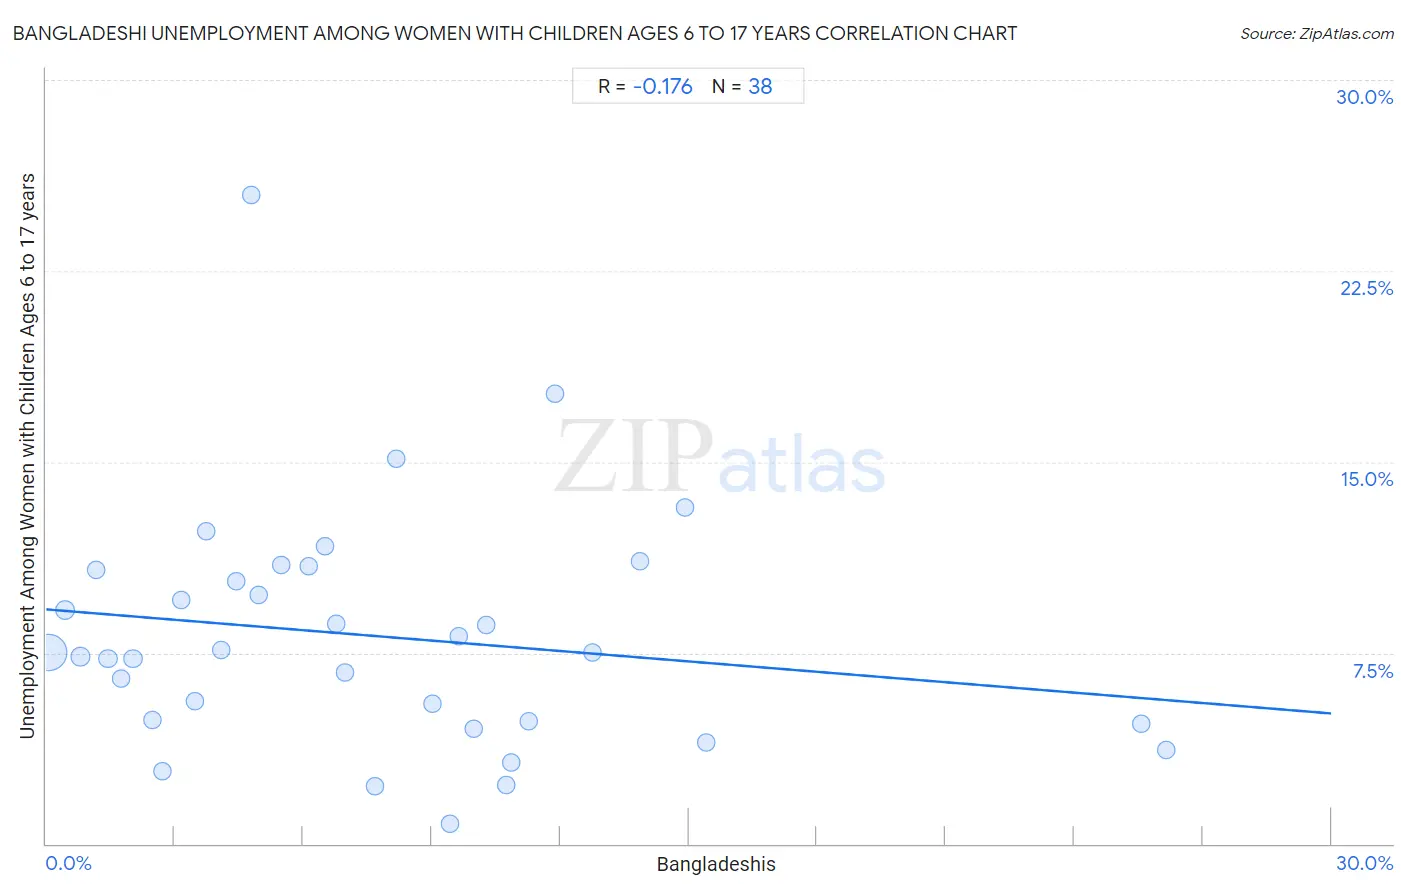
Bangladeshi Unemployment Among Women with Children Ages 6 to 17 years Correlation Chart

The statistical analysis conducted on geographies consisting of 118,644,853 people shows a poor negative correlation between the proportion of Bangladeshis and unemployment rate among women with children between the ages 6 and 17 in the United States with a correlation coefficient (R) of -0.176 and weighted average of 7.4%. On average, for every 1% (one percent) increase in Bangladeshis within a typical geography, there is a decrease of 0.14% in unemployment rate among women with children between the ages 6 and 17.
Bangladeshi Unemployment Among Women with Children Ages 6 to 17 years
It is essential to understand that the correlation between the percentage of Bangladeshis and unemployment rate among women with children between the ages 6 and 17 does not imply a direct cause-and-effect relationship. It remains uncertain whether the presence of Bangladeshis influences an upward or downward trend in the level of unemployment rate among women with children between the ages 6 and 17 within an area, or if Bangladeshis simply ended up residing in those areas with higher or lower levels of unemployment rate among women with children between the ages 6 and 17 due to other factors.

Demographics Similar to Bangladeshis by Unemployment Among Women with Children Ages 6 to 17 years

In terms of unemployment among women with children ages 6 to 17 years, the demographic groups most similar to Bangladeshis are Immigrants from Taiwan (7.3%, a difference of 0.33%), Indonesian (7.4%, a difference of 0.71%), Sudanese (7.4%, a difference of 0.75%), Immigrants from Fiji (7.3%, a difference of 1.0%), and Puget Sound Salish (7.5%, a difference of 1.8%).
DemographicsRating | RankUnemployment Among Women with Children Ages 6 to 17 years
Okinawans
100.0
/100
|
#5
Exceptional
7.0%
Tlingit-Haida
100.0
/100
|
#6
Exceptional
7.1%
Soviet Union
100.0
/100
|
#7
Exceptional
7.1%
Immigrants from Hong Kong
100.0
/100
|
#8
Exceptional
7.2%
Assyrians/Chaldeans/Syriacs
100.0
/100
|
#9
Exceptional
7.2%
Immigrants from Fiji
100.0
/100
|
#10
Exceptional
7.3%
Immigrants from Taiwan
100.0
/100
|
#11
Exceptional
7.3%
Bangladeshis
100.0
/100
|
#12
Exceptional
7.4%
Indonesians
100.0
/100
|
#13
Exceptional
7.4%
Sudanese
100.0
/100
|
#14
Exceptional
7.4%
Puget Sound Salish
100.0
/100
|
#15
Exceptional
7.5%
Immigrants from Burma/Myanmar
100.0
/100
|
#16
Exceptional
7.5%
Cambodians
100.0
/100
|
#17
Exceptional
7.5%
Afghans
100.0
/100
|
#18
Exceptional
7.6%
Filipinos
100.0
/100
|
#19
Exceptional
7.6%

Bangladeshi Unemployment Among Women with Children Ages 6 to 17 years Correlation Summary

MeasurementBangladeshi DataUnemployment Among Women with Children Ages 6 to 17 years Data
Minimum0.053%0.80%
Maximum26.2%25.5%
Range26.1%24.7%
Mean7.7%8.2%
Median6.6%7.5%
Interquartile 25% (IQ1)3.1%4.8%
Interquartile 75% (IQ3)10.7%10.8%
Interquartile Range (IQR)7.6%6.0%
Standard Deviation (Sample)6.1%4.7%
Standard Deviation (Population)6.0%4.6%

Correlation Details

Bangladeshi PercentileSample SizeUnemployment Among Women with Children Ages 6 to 17 years
[
0.0%
-
0.5%
]
0.053%
99,922,1177.5%
[
0.0%
-
0.5%
]
0.44%
5,992,2049.2%
[
0.5%
-
1.0%
]
0.80%
2,488,0897.4%
[
1.0%
-
1.5%
]
1.16%
1,234,18510.8%
[
1.0%
-
1.5%
]
1.44%
1,251,8617.3%
[
1.5%
-
2.0%
]
1.74%
1,693,4996.5%
[
2.0%
-
2.5%
]
2.03%
910,0977.2%
[
2.0%
-
2.5%
]
2.49%
545,0514.9%
[
2.5%
-
3.0%
]
2.72%
448,2862.9%
[
3.0%
-
3.5%
]
3.14%
271,6279.6%
[
3.0%
-
3.5%
]
3.47%
751,6105.6%
[
3.5%
-
4.0%
]
3.75%
171,56312.3%
[
4.0%
-
4.5%
]
4.08%
271,3007.6%
[
4.0%
-
4.5%
]
4.44%
170,65810.3%
[
4.5%
-
5.0%
]
4.78%
25,04125.5%
[
4.5%
-
5.0%
]
4.97%
699,0249.8%
[
5.0%
-
5.5%
]
5.48%
153,10310.9%
[
6.0%
-
6.5%
]
6.13%
166,88810.9%
[
6.5%
-
7.0%
]
6.51%
31,34511.7%
[
6.5%
-
7.0%
]
6.76%
135,9268.6%
[
6.5%
-
7.0%
]
6.99%
50,4846.7%
[
7.5%
-
8.0%
]
7.66%
36,7782.3%
[
8.0%
-
8.5%
]
8.16%
32,60315.1%
[
9.0%
-
9.5%
]
9.03%
142,8325.5%
[
9.0%
-
9.5%
]
9.41%
43,0420.80%
[
9.5%
-
10.0%
]
9.63%
134,4298.2%
[
9.5%
-
10.0%
]
9.98%
101,0964.5%
[
10.0%
-
10.5%
]
10.26%
14,8248.6%
[
10.5%
-
11.0%
]
10.74%
49,9922.3%
[
10.5%
-
11.0%
]
10.85%
31,2923.2%
[
11.0%
-
11.5%
]
11.27%
308,8064.8%
[
11.5%
-
12.0%
]
11.89%
32,91217.7%
[
12.5%
-
13.0%
]
12.76%
84,9517.5%
[
13.5%
-
14.0%
]
13.87%
82,17611.1%
[
14.5%
-
15.0%
]
14.91%
93213.2%
[
15.0%
-
15.5%
]
15.41%
86,9554.0%
[
25.5%
-
26.0%
]
25.55%
57,6624.7%
[
26.0%
-
26.5%
]
26.16%
19,6133.7%