Bangladeshi Wage/Income Gap

COMPARE

Bangladeshi
Race
Ancestry
AfghanAfricanAlaska NativeAlaskan AthabascanAlbanianAleutAlsatianAmericanApacheArabArapahoArgentineanArmenianAssyrian/Chaldean/SyriacAustralianAustrianBahamianBangladeshiBarbadianBasqueBelgianBelizeanBermudanBhutaneseBlackfeetBolivianBrazilianBritishBritish West IndianBulgarianBurmeseCajunCambodianCanadianCape VerdeanCarpatho RusynCelticCentral AmericanCentral American IndianCherokeeCheyenneChickasawChileanChineseChippewaChoctawColombianColvilleComancheCosta RicanCreeCreekCroatianCrowCubanCypriotCzechCzechoslovakianDanishDelawareDominicanDutchDutch West IndianEastern EuropeanEcuadorianEgyptianEnglishEstonianEthiopianEuropeanFijianFilipinoFinnishFrenchFrench American IndianFrench CanadianGermanGerman RussianGhanaianGreekGuamanian/ChamorroGuatemalanGuyaneseHaitianHmongHonduranHopiHoumaHungarianIcelanderIndian (Asian)IndonesianInupiatIranianIraqiIrishIroquoisIsraeliItalianJamaicanJapaneseJordanianKenyanKiowaKoreanLaotianLatvianLebaneseLiberianLithuanianLumbeeLuxembourgerMacedonianMalaysianMalteseMarshalleseMenomineeMexicanMexican American IndianMongolianMoroccanNative HawaiianNavajoNepaleseNew ZealanderNicaraguanNigerianNorthern EuropeanNorwegianOkinawanOsageOttawaPaiutePakistaniPalestinianPanamanianParaguayanPennsylvania GermanPeruvianPimaPolishPortuguesePotawatomiPuebloPuerto RicanPuget Sound SalishRomanianRussianSalvadoranSamoanScandinavianScotch-IrishScottishSeminoleSenegaleseSerbianShoshoneSierra LeoneanSiouxSlavicSlovakSloveneSomaliSouth AfricanSouth AmericanSouth American IndianSoviet UnionSpaniardSpanishSpanish AmericanSpanish American IndianSri LankanSubsaharan AfricanSudaneseSwedishSwissSyrianTaiwaneseThaiTlingit-HaidaTohono O'OdhamTonganTrinidadian and TobagonianTsimshianTurkishU.S. Virgin IslanderUgandanUkrainianUruguayanUteVenezuelanVietnameseWelshWest IndianYakamaYaquiYugoslavianYumanYup'ikZimbabwean
Immigration
NonimmigrantsImmigrantsAfghanistanAfricaAlbaniaArgentinaArmeniaAsiaAustraliaAustriaBahamasBangladeshBarbadosBelarusBelgiumBelizeBoliviaBosnia and HerzegovinaBrazilBulgariaBurma/MyanmarCabo VerdeCambodiaCameroonCanadaCaribbeanCentral AmericaChileChinaColombiaCongoCosta RicaCroatiaCubaCzechoslovakiaDenmarkDominicaDominican RepublicEastern AfricaEastern AsiaEastern EuropeEcuadorEgyptEl SalvadorEnglandEritreaEthiopiaEuropeFijiFranceGermanyGhanaGreeceGrenadaGuatemalaGuyanaHaitiHondurasHong KongHungaryIndiaIndonesiaIranIraqIrelandIsraelItalyJamaicaJapanJordanKazakhstanKenyaKoreaKuwaitLaosLatin AmericaLatviaLebanonLiberiaLithuaniaMalaysiaMexicoMicronesiaMiddle AfricaMoldovaMoroccoNepalNetherlandsNicaraguaNigeriaNorth AmericaNorth MacedoniaNorthern AfricaNorthern EuropeNorwayOceaniaPakistanPanamaPeruPhilippinesPolandPortugalRomaniaRussiaSaudi ArabiaScotlandSenegalSerbiaSierra LeoneSingaporeSomaliaSouth AfricaSouth AmericaSouth Central AsiaSouth Eastern AsiaSouthern EuropeSpainSri LankaSt. Vincent and the GrenadinesSudanSwedenSwitzerlandSyriaTaiwanThailandTrinidad and TobagoTurkeyUgandaUkraineUruguayUzbekistanVenezuelaVietnamWest IndiesWestern AfricaWestern AsiaWestern EuropeYemenZaireZimbabweAzores
Select to Compare
Race
Ancestry
AfghanAfricanAlaska NativeAlaskan AthabascanAlbanianAleutAlsatianAmericanApacheArabArapahoArgentineanArmenianAssyrian/Chaldean/SyriacAustralianAustrianBahamianBarbadianBasqueBelgianBelizeanBermudanBhutaneseBlackfeetBolivianBrazilianBritishBritish West IndianBulgarianBurmeseCajunCambodianCanadianCape VerdeanCarpatho RusynCelticCentral AmericanCentral American IndianCherokeeCheyenneChickasawChileanChineseChippewaChoctawColombianColvilleComancheCosta RicanCreeCreekCroatianCrowCubanCypriotCzechCzechoslovakianDanishDelawareDominicanDutchDutch West IndianEastern EuropeanEcuadorianEgyptianEnglishEstonianEthiopianEuropeanFijianFilipinoFinnishFrenchFrench American IndianFrench CanadianGermanGerman RussianGhanaianGreekGuamanian/ChamorroGuatemalanGuyaneseHaitianHmongHonduranHopiHoumaHungarianIcelanderIndian (Asian)IndonesianInupiatIranianIraqiIrishIroquoisIsraeliItalianJamaicanJapaneseJordanianKenyanKiowaKoreanLaotianLatvianLebaneseLiberianLithuanianLumbeeLuxembourgerMacedonianMalaysianMalteseMarshalleseMenomineeMexicanMexican American IndianMongolianMoroccanNative HawaiianNavajoNepaleseNew ZealanderNicaraguanNigerianNorthern EuropeanNorwegianOkinawanOsageOttawaPaiutePakistaniPalestinianPanamanianParaguayanPennsylvania GermanPeruvianPimaPolishPortuguesePotawatomiPuebloPuerto RicanPuget Sound SalishRomanianRussianSalvadoranSamoanScandinavianScotch-IrishScottishSeminoleSenegaleseSerbianShoshoneSierra LeoneanSiouxSlavicSlovakSloveneSomaliSouth AfricanSouth AmericanSouth American IndianSoviet UnionSpaniardSpanishSpanish AmericanSpanish American IndianSri LankanSubsaharan AfricanSudaneseSwedishSwissSyrianTaiwaneseThaiTlingit-HaidaTohono O'OdhamTonganTrinidadian and TobagonianTsimshianTurkishU.S. Virgin IslanderUgandanUkrainianUruguayanUteVenezuelanVietnameseWelshWest IndianYakamaYaquiYugoslavianYumanYup'ikZimbabwean
Immigration
NonimmigrantsImmigrantsAfghanistanAfricaAlbaniaArgentinaArmeniaAsiaAustraliaAustriaBahamasBangladeshBarbadosBelarusBelgiumBelizeBoliviaBosnia and HerzegovinaBrazilBulgariaBurma/MyanmarCabo VerdeCambodiaCameroonCanadaCaribbeanCentral AmericaChileChinaColombiaCongoCosta RicaCroatiaCubaCzechoslovakiaDenmarkDominicaDominican RepublicEastern AfricaEastern AsiaEastern EuropeEcuadorEgyptEl SalvadorEnglandEritreaEthiopiaEuropeFijiFranceGermanyGhanaGreeceGrenadaGuatemalaGuyanaHaitiHondurasHong KongHungaryIndiaIndonesiaIranIraqIrelandIsraelItalyJamaicaJapanJordanKazakhstanKenyaKoreaKuwaitLaosLatin AmericaLatviaLebanonLiberiaLithuaniaMalaysiaMexicoMicronesiaMiddle AfricaMoldovaMoroccoNepalNetherlandsNicaraguaNigeriaNorth AmericaNorth MacedoniaNorthern AfricaNorthern EuropeNorwayOceaniaPakistanPanamaPeruPhilippinesPolandPortugalRomaniaRussiaSaudi ArabiaScotlandSenegalSerbiaSierra LeoneSingaporeSomaliaSouth AfricaSouth AmericaSouth Central AsiaSouth Eastern AsiaSouthern EuropeSpainSri LankaSt. Vincent and the GrenadinesSudanSwedenSwitzerlandSyriaTaiwanThailandTrinidad and TobagoTurkeyUgandaUkraineUruguayUzbekistanVenezuelaVietnamWest IndiesWestern AfricaWestern AsiaWestern EuropeYemenZaireZimbabweAzores
Wage/Income Gap
Income
Poverty
Unemployment
Labor Participation
Family Structure
Vehicle Availability
Education Level
Disability

Bangladeshi Wage/Income Gap
Exceptional

22.2%
WAGE/INCOME GAP
100.0/ 100
METRIC RATING
53rd/ 347
METRIC RANK

Bangladeshi Wage/Income Gap Correlation Chart

The statistical analysis conducted on geographies consisting of 141,421,838 people shows a mild negative correlation between the proportion of Bangladeshis and wage/income gap percentage in the United States with a correlation coefficient (R) of -0.392 and weighted average of 22.2%. On average, for every 1% (one percent) increase in Bangladeshis within a typical geography, there is a decrease of 0.24% in wage/income gap percentage.
Bangladeshi Wage/Income Gap
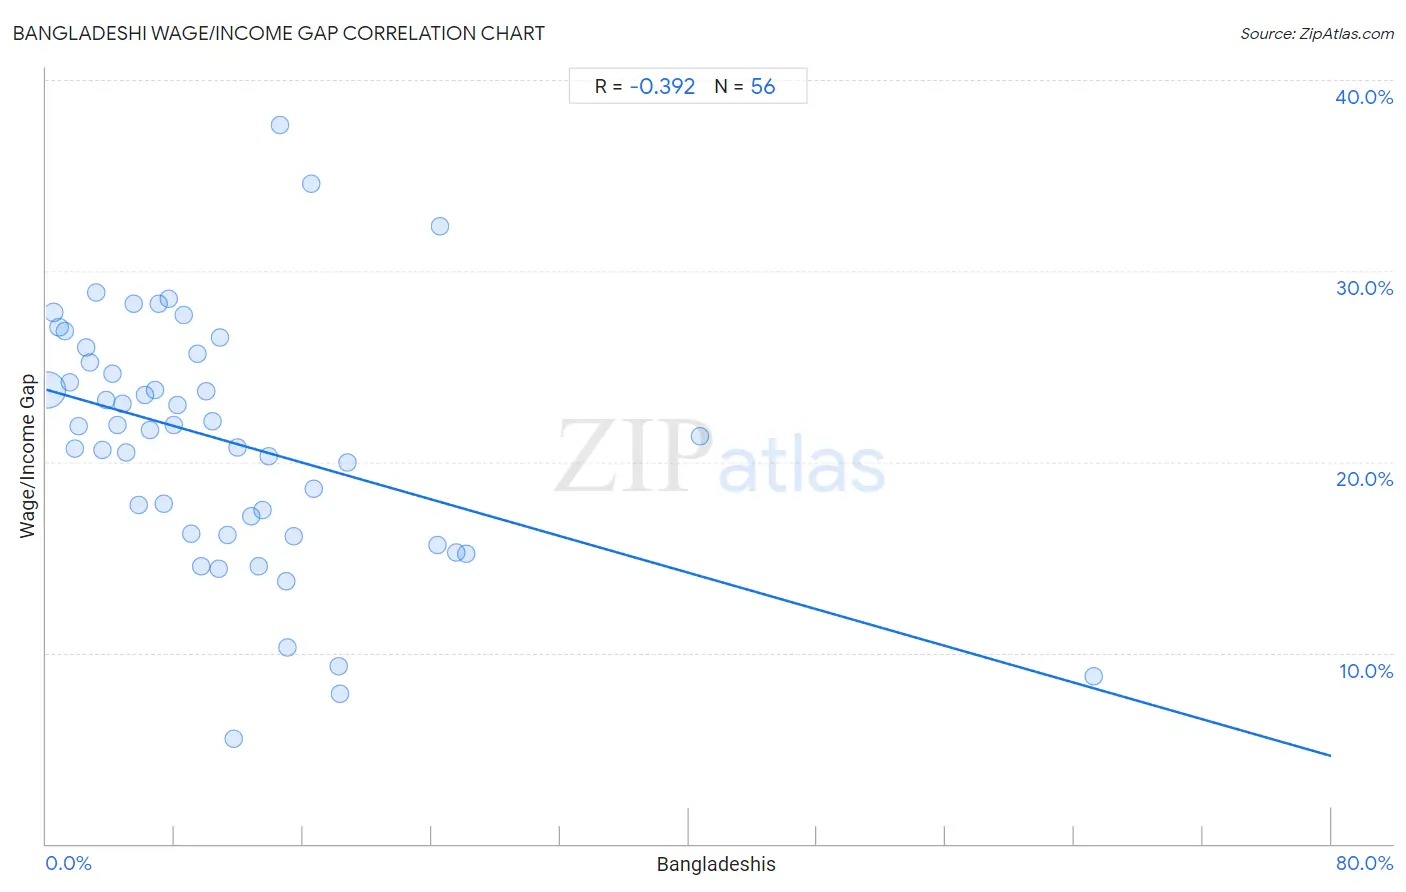
It is essential to understand that the correlation between the percentage of Bangladeshis and wage/income gap percentage does not imply a direct cause-and-effect relationship. It remains uncertain whether the presence of Bangladeshis influences an upward or downward trend in the level of wage/income gap percentage within an area, or if Bangladeshis simply ended up residing in those areas with higher or lower levels of wage/income gap percentage due to other factors.

Demographics Similar to Bangladeshis by Wage/Income Gap

In terms of wage/income gap, the demographic groups most similar to Bangladeshis are Immigrants from Cameroon (22.2%, a difference of 0.010%), Tohono O'odham (22.1%, a difference of 0.10%), Nepalese (22.2%, a difference of 0.23%), Immigrants from Western Africa (22.0%, a difference of 0.53%), and Immigrants from Zaire (22.3%, a difference of 0.63%).
DemographicsRating | RankWage/Income Gap
Immigrants from Ethiopia
100.0
/100
|
#46
Exceptional
21.6%
Immigrants from Congo
100.0
/100
|
#47
Exceptional
21.7%
Blacks/African Americans
100.0
/100
|
#48
Exceptional
21.7%
Ethiopians
100.0
/100
|
#49
Exceptional
21.8%
Immigrants from Western Africa
100.0
/100
|
#50
Exceptional
22.0%
Tohono O'odham
100.0
/100
|
#51
Exceptional
22.1%
Immigrants from Cameroon
100.0
/100
|
#52
Exceptional
22.2%
Bangladeshis
100.0
/100
|
#53
Exceptional
22.2%
Nepalese
100.0
/100
|
#54
Exceptional
22.2%
Immigrants from Zaire
100.0
/100
|
#55
Exceptional
22.3%
Immigrants from Ghana
100.0
/100
|
#56
Exceptional
22.3%
Ghanaians
100.0
/100
|
#57
Exceptional
22.3%
Immigrants from Cuba
100.0
/100
|
#58
Exceptional
22.4%
Navajo
100.0
/100
|
#59
Exceptional
22.4%
Immigrants from Middle Africa
100.0
/100
|
#60
Exceptional
22.4%

Bangladeshi Wage/Income Gap Correlation Summary

MeasurementBangladeshi DataWage/Income Gap Data
Minimum0.061%5.5%
Maximum65.2%37.6%
Range65.2%32.1%
Mean11.3%21.1%
Median9.2%21.8%
Interquartile 25% (IQ1)4.6%16.2%
Interquartile 75% (IQ3)14.7%25.4%
Interquartile Range (IQR)10.1%9.2%
Standard Deviation (Sample)10.7%6.5%
Standard Deviation (Population)10.6%6.5%

Correlation Details

Bangladeshi PercentileSample SizeWage/Income Gap
[
0.0%
-
0.5%
]
0.061%
114,902,17523.8%
[
0.0%
-
0.5%
]
0.45%
8,754,86627.8%
[
0.5%
-
1.0%
]
0.80%
3,567,11727.1%
[
1.0%
-
1.5%
]
1.16%
1,839,91626.8%
[
1.0%
-
1.5%
]
1.45%
1,972,89424.1%
[
1.5%
-
2.0%
]
1.75%
2,127,65820.7%
[
2.0%
-
2.5%
]
2.04%
1,193,35021.9%
[
2.0%
-
2.5%
]
2.47%
721,97826.0%
[
2.5%
-
3.0%
]
2.73%
624,93125.2%
[
3.0%
-
3.5%
]
3.13%
471,59028.9%
[
3.0%
-
3.5%
]
3.47%
937,03620.6%
[
3.5%
-
4.0%
]
3.73%
329,17723.2%
[
4.0%
-
4.5%
]
4.10%
536,75724.6%
[
4.0%
-
4.5%
]
4.42%
290,99722.0%
[
4.5%
-
5.0%
]
4.76%
30,70123.1%
[
4.5%
-
5.0%
]
4.98%
761,34820.5%
[
5.0%
-
5.5%
]
5.48%
167,00628.3%
[
5.5%
-
6.0%
]
5.77%
107,73017.8%
[
6.0%
-
6.5%
]
6.12%
174,66323.5%
[
6.0%
-
6.5%
]
6.44%
63,61221.7%
[
6.5%
-
7.0%
]
6.76%
170,69623.8%
[
6.5%
-
7.0%
]
6.99%
50,48428.3%
[
7.0%
-
7.5%
]
7.32%
10,55717.8%
[
7.5%
-
8.0%
]
7.66%
37,98828.5%
[
7.5%
-
8.0%
]
7.92%
42,73521.9%
[
8.0%
-
8.5%
]
8.18%
52,88623.0%
[
8.5%
-
9.0%
]
8.55%
12,68427.7%
[
9.0%
-
9.5%
]
9.03%
148,36916.2%
[
9.0%
-
9.5%
]
9.40%
51,10925.7%
[
9.5%
-
10.0%
]
9.63%
136,08514.5%
[
9.5%
-
10.0%
]
9.96%
134,20523.7%
[
10.0%
-
10.5%
]
10.33%
64,53122.1%
[
10.5%
-
11.0%
]
10.72%
70,82714.4%
[
10.5%
-
11.0%
]
10.85%
31,29226.5%
[
11.0%
-
11.5%
]
11.27%
308,80616.2%
[
11.5%
-
12.0%
]
11.69%
1,2155.5%
[
11.5%
-
12.0%
]
11.89%
32,91220.8%
[
12.5%
-
13.0%
]
12.76%
84,95117.2%
[
13.0%
-
13.5%
]
13.26%
2,00614.5%
[
13.0%
-
13.5%
]
13.48%
13,45917.5%
[
13.5%
-
14.0%
]
13.86%
95,31020.3%
[
14.5%
-
15.0%
]
14.53%
29637.6%
[
14.5%
-
15.0%
]
14.91%
93213.7%
[
15.0%
-
15.5%
]
15.04%
13,11610.3%
[
15.0%
-
15.5%
]
15.39%
132,06016.1%
[
16.0%
-
16.5%
]
16.48%
6,79034.6%
[
16.5%
-
17.0%
]
16.66%
34,22018.6%
[
18.0%
-
18.5%
]
18.23%
7,5819.3%
[
18.0%
-
18.5%
]
18.31%
17,7167.8%
[
18.5%
-
19.0%
]
18.74%
61919.9%
[
24.0%
-
24.5%
]
24.36%
39015.7%
[
24.5%
-
25.0%
]
24.55%
1,21832.3%
[
25.5%
-
26.0%
]
25.55%
57,66215.2%
[
26.0%
-
26.5%
]
26.16%
19,61315.2%
[
40.5%
-
41.0%
]
40.74%
73421.4%
[
65.0%
-
65.5%
]
65.25%
2828.8%