Bangladeshi Married-Couple Family Poverty

COMPARE

Bangladeshi
Race
Ancestry
AfghanAfricanAlaska NativeAlaskan AthabascanAlbanianAleutAlsatianAmericanApacheArabArapahoArgentineanArmenianAssyrian/Chaldean/SyriacAustralianAustrianBahamianBangladeshiBarbadianBasqueBelgianBelizeanBermudanBhutaneseBlackfeetBolivianBrazilianBritishBritish West IndianBulgarianBurmeseCajunCambodianCanadianCape VerdeanCarpatho RusynCelticCentral AmericanCentral American IndianCherokeeCheyenneChickasawChileanChineseChippewaChoctawColombianColvilleComancheCosta RicanCreeCreekCroatianCrowCubanCypriotCzechCzechoslovakianDanishDelawareDominicanDutchDutch West IndianEastern EuropeanEcuadorianEgyptianEnglishEstonianEthiopianEuropeanFijianFilipinoFinnishFrenchFrench American IndianFrench CanadianGermanGerman RussianGhanaianGreekGuamanian/ChamorroGuatemalanGuyaneseHaitianHmongHonduranHopiHoumaHungarianIcelanderIndian (Asian)IndonesianInupiatIranianIraqiIrishIroquoisIsraeliItalianJamaicanJapaneseJordanianKenyanKiowaKoreanLaotianLatvianLebaneseLiberianLithuanianLumbeeLuxembourgerMacedonianMalaysianMalteseMarshalleseMenomineeMexicanMexican American IndianMongolianMoroccanNative HawaiianNavajoNepaleseNew ZealanderNicaraguanNigerianNorthern EuropeanNorwegianOkinawanOsageOttawaPaiutePakistaniPalestinianPanamanianParaguayanPennsylvania GermanPeruvianPimaPolishPortuguesePotawatomiPuebloPuerto RicanPuget Sound SalishRomanianRussianSalvadoranSamoanScandinavianScotch-IrishScottishSeminoleSenegaleseSerbianShoshoneSierra LeoneanSiouxSlavicSlovakSloveneSomaliSouth AfricanSouth AmericanSouth American IndianSoviet UnionSpaniardSpanishSpanish AmericanSpanish American IndianSri LankanSubsaharan AfricanSudaneseSwedishSwissSyrianTaiwaneseThaiTlingit-HaidaTohono O'OdhamTonganTrinidadian and TobagonianTsimshianTurkishU.S. Virgin IslanderUgandanUkrainianUruguayanUteVenezuelanVietnameseWelshWest IndianYakamaYaquiYugoslavianYumanYup'ikZimbabwean
Immigration
NonimmigrantsImmigrantsAfghanistanAfricaAlbaniaArgentinaArmeniaAsiaAustraliaAustriaBahamasBangladeshBarbadosBelarusBelgiumBelizeBoliviaBosnia and HerzegovinaBrazilBulgariaBurma/MyanmarCabo VerdeCambodiaCameroonCanadaCaribbeanCentral AmericaChileChinaColombiaCongoCosta RicaCroatiaCubaCzechoslovakiaDenmarkDominicaDominican RepublicEastern AfricaEastern AsiaEastern EuropeEcuadorEgyptEl SalvadorEnglandEritreaEthiopiaEuropeFijiFranceGermanyGhanaGreeceGrenadaGuatemalaGuyanaHaitiHondurasHong KongHungaryIndiaIndonesiaIranIraqIrelandIsraelItalyJamaicaJapanJordanKazakhstanKenyaKoreaKuwaitLaosLatin AmericaLatviaLebanonLiberiaLithuaniaMalaysiaMexicoMicronesiaMiddle AfricaMoldovaMoroccoNepalNetherlandsNicaraguaNigeriaNorth AmericaNorth MacedoniaNorthern AfricaNorthern EuropeNorwayOceaniaPakistanPanamaPeruPhilippinesPolandPortugalRomaniaRussiaSaudi ArabiaScotlandSenegalSerbiaSierra LeoneSingaporeSomaliaSouth AfricaSouth AmericaSouth Central AsiaSouth Eastern AsiaSouthern EuropeSpainSri LankaSt. Vincent and the GrenadinesSudanSwedenSwitzerlandSyriaTaiwanThailandTrinidad and TobagoTurkeyUgandaUkraineUruguayUzbekistanVenezuelaVietnamWest IndiesWestern AfricaWestern AsiaWestern EuropeYemenZaireZimbabweAzores
Select to Compare
Race
Ancestry
AfghanAfricanAlaska NativeAlaskan AthabascanAlbanianAleutAlsatianAmericanApacheArabArapahoArgentineanArmenianAssyrian/Chaldean/SyriacAustralianAustrianBahamianBarbadianBasqueBelgianBelizeanBermudanBhutaneseBlackfeetBolivianBrazilianBritishBritish West IndianBulgarianBurmeseCajunCambodianCanadianCape VerdeanCarpatho RusynCelticCentral AmericanCentral American IndianCherokeeCheyenneChickasawChileanChineseChippewaChoctawColombianColvilleComancheCosta RicanCreeCreekCroatianCrowCubanCypriotCzechCzechoslovakianDanishDelawareDominicanDutchDutch West IndianEastern EuropeanEcuadorianEgyptianEnglishEstonianEthiopianEuropeanFijianFilipinoFinnishFrenchFrench American IndianFrench CanadianGermanGerman RussianGhanaianGreekGuamanian/ChamorroGuatemalanGuyaneseHaitianHmongHonduranHopiHoumaHungarianIcelanderIndian (Asian)IndonesianInupiatIranianIraqiIrishIroquoisIsraeliItalianJamaicanJapaneseJordanianKenyanKiowaKoreanLaotianLatvianLebaneseLiberianLithuanianLumbeeLuxembourgerMacedonianMalaysianMalteseMarshalleseMenomineeMexicanMexican American IndianMongolianMoroccanNative HawaiianNavajoNepaleseNew ZealanderNicaraguanNigerianNorthern EuropeanNorwegianOkinawanOsageOttawaPaiutePakistaniPalestinianPanamanianParaguayanPennsylvania GermanPeruvianPimaPolishPortuguesePotawatomiPuebloPuerto RicanPuget Sound SalishRomanianRussianSalvadoranSamoanScandinavianScotch-IrishScottishSeminoleSenegaleseSerbianShoshoneSierra LeoneanSiouxSlavicSlovakSloveneSomaliSouth AfricanSouth AmericanSouth American IndianSoviet UnionSpaniardSpanishSpanish AmericanSpanish American IndianSri LankanSubsaharan AfricanSudaneseSwedishSwissSyrianTaiwaneseThaiTlingit-HaidaTohono O'OdhamTonganTrinidadian and TobagonianTsimshianTurkishU.S. Virgin IslanderUgandanUkrainianUruguayanUteVenezuelanVietnameseWelshWest IndianYakamaYaquiYugoslavianYumanYup'ikZimbabwean
Immigration
NonimmigrantsImmigrantsAfghanistanAfricaAlbaniaArgentinaArmeniaAsiaAustraliaAustriaBahamasBangladeshBarbadosBelarusBelgiumBelizeBoliviaBosnia and HerzegovinaBrazilBulgariaBurma/MyanmarCabo VerdeCambodiaCameroonCanadaCaribbeanCentral AmericaChileChinaColombiaCongoCosta RicaCroatiaCubaCzechoslovakiaDenmarkDominicaDominican RepublicEastern AfricaEastern AsiaEastern EuropeEcuadorEgyptEl SalvadorEnglandEritreaEthiopiaEuropeFijiFranceGermanyGhanaGreeceGrenadaGuatemalaGuyanaHaitiHondurasHong KongHungaryIndiaIndonesiaIranIraqIrelandIsraelItalyJamaicaJapanJordanKazakhstanKenyaKoreaKuwaitLaosLatin AmericaLatviaLebanonLiberiaLithuaniaMalaysiaMexicoMicronesiaMiddle AfricaMoldovaMoroccoNepalNetherlandsNicaraguaNigeriaNorth AmericaNorth MacedoniaNorthern AfricaNorthern EuropeNorwayOceaniaPakistanPanamaPeruPhilippinesPolandPortugalRomaniaRussiaSaudi ArabiaScotlandSenegalSerbiaSierra LeoneSingaporeSomaliaSouth AfricaSouth AmericaSouth Central AsiaSouth Eastern AsiaSouthern EuropeSpainSri LankaSt. Vincent and the GrenadinesSudanSwedenSwitzerlandSyriaTaiwanThailandTrinidad and TobagoTurkeyUgandaUkraineUruguayUzbekistanVenezuelaVietnamWest IndiesWestern AfricaWestern AsiaWestern EuropeYemenZaireZimbabweAzores
Married-Couple Family Poverty
Income
Poverty
Unemployment
Labor Participation
Family Structure
Vehicle Availability
Education Level
Disability

Bangladeshi Married-Couple Family Poverty
Tragic

6.0%
POVERTY | MARRIED-COUPLE FAMILIES
0.5/ 100
METRIC RATING
256th/ 347
METRIC RANK

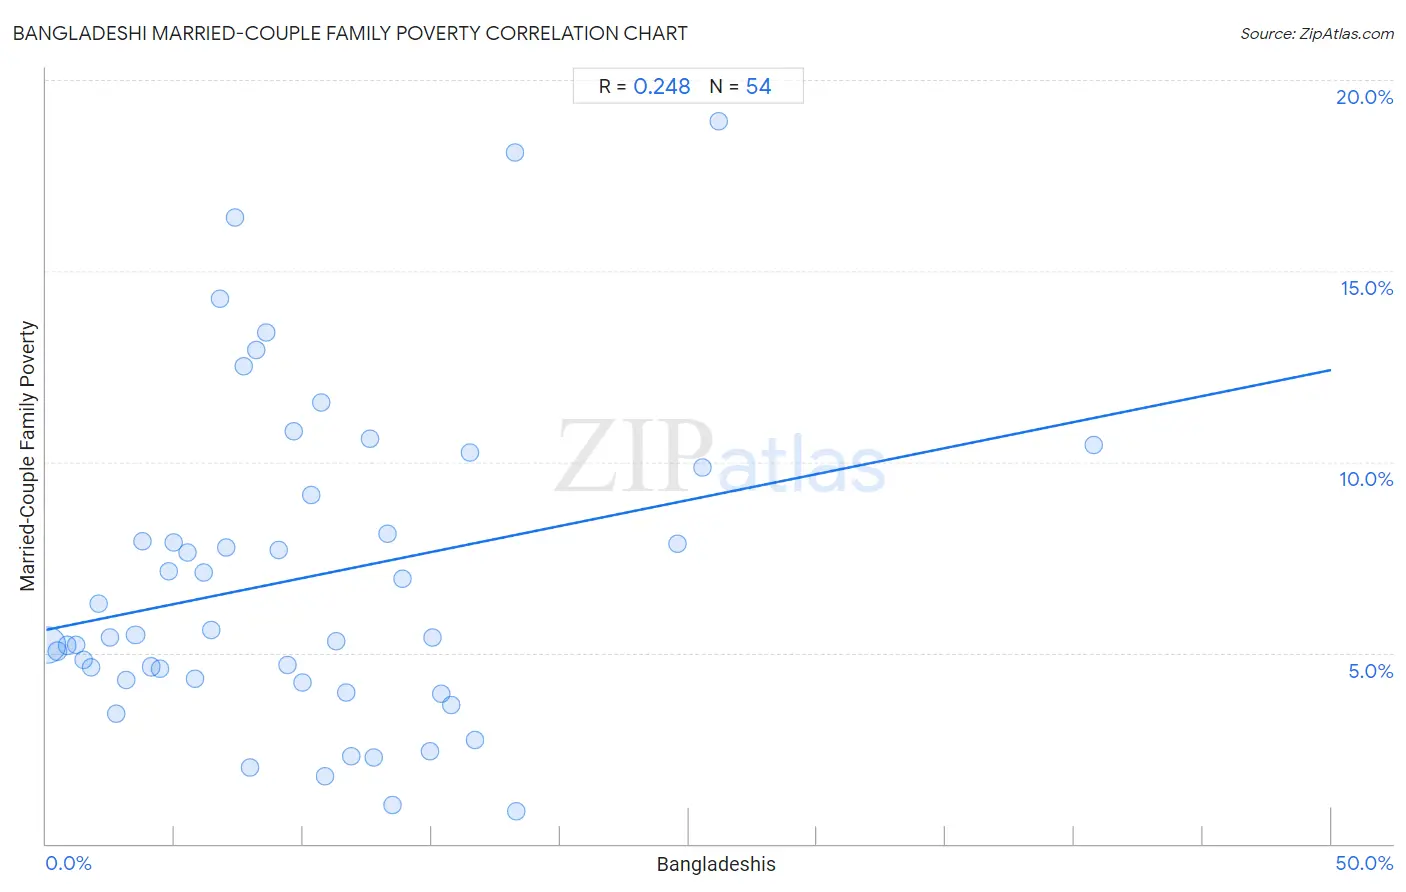
Bangladeshi Married-Couple Family Poverty Correlation Chart

The statistical analysis conducted on geographies consisting of 140,885,862 people shows a weak positive correlation between the proportion of Bangladeshis and poverty level among married-couple families in the United States with a correlation coefficient (R) of 0.248 and weighted average of 6.0%. On average, for every 1% (one percent) increase in Bangladeshis within a typical geography, there is an increase of 0.14% in poverty level among married-couple families.
Bangladeshi Married-Couple Family Poverty
It is essential to understand that the correlation between the percentage of Bangladeshis and poverty level among married-couple families does not imply a direct cause-and-effect relationship. It remains uncertain whether the presence of Bangladeshis influences an upward or downward trend in the level of poverty level among married-couple families within an area, or if Bangladeshis simply ended up residing in those areas with higher or lower levels of poverty level among married-couple families due to other factors.

Demographics Similar to Bangladeshis by Married-Couple Family Poverty

In terms of married-couple family poverty, the demographic groups most similar to Bangladeshis are Immigrants from Burma/Myanmar (6.0%, a difference of 0.24%), Immigrants (6.0%, a difference of 0.37%), Comanche (6.0%, a difference of 0.50%), Immigrants from Somalia (6.0%, a difference of 0.65%), and African (6.0%, a difference of 0.71%).
DemographicsRating | RankMarried-Couple Family Poverty
Tsimshian
1.1
/100
|
#249
Tragic
5.9%
Immigrants from Eritrea
1.1
/100
|
#250
Tragic
5.9%
Immigrants from Ghana
1.0
/100
|
#251
Tragic
5.9%
Immigrants from Western Asia
0.7
/100
|
#252
Tragic
6.0%
Africans
0.7
/100
|
#253
Tragic
6.0%
Immigrants from Somalia
0.7
/100
|
#254
Tragic
6.0%
Comanche
0.7
/100
|
#255
Tragic
6.0%
Bangladeshis
0.5
/100
|
#256
Tragic
6.0%
Immigrants from Burma/Myanmar
0.5
/100
|
#257
Tragic
6.0%
Immigrants
0.5
/100
|
#258
Tragic
6.0%
Alaskan Athabascans
0.4
/100
|
#259
Tragic
6.1%
Jamaicans
0.3
/100
|
#260
Tragic
6.1%
Senegalese
0.3
/100
|
#261
Tragic
6.1%
Shoshone
0.3
/100
|
#262
Tragic
6.1%
Immigrants from Senegal
0.3
/100
|
#263
Tragic
6.1%

Bangladeshi Married-Couple Family Poverty Correlation Summary

MeasurementBangladeshi DataMarried-Couple Family Poverty Data
Minimum0.061%0.85%
Maximum40.7%18.9%
Range40.7%18.1%
Mean9.9%7.0%
Median8.8%5.4%
Interquartile 25% (IQ1)4.4%4.3%
Interquartile 75% (IQ3)13.5%9.1%
Interquartile Range (IQR)9.1%4.9%
Standard Deviation (Sample)7.6%4.2%
Standard Deviation (Population)7.6%4.2%

Correlation Details

Bangladeshi PercentileSample SizeMarried-Couple Family Poverty
[
0.0%
-
0.5%
]
0.061%
114,712,7425.2%
[
0.0%
-
0.5%
]
0.45%
8,676,8315.1%
[
0.5%
-
1.0%
]
0.81%
3,493,1865.2%
[
1.0%
-
1.5%
]
1.16%
1,796,3205.2%
[
1.0%
-
1.5%
]
1.45%
1,933,1904.8%
[
1.5%
-
2.0%
]
1.75%
2,102,6074.6%
[
2.0%
-
2.5%
]
2.04%
1,188,7446.3%
[
2.0%
-
2.5%
]
2.47%
704,2535.4%
[
2.5%
-
3.0%
]
2.73%
623,4983.4%
[
3.0%
-
3.5%
]
3.13%
467,9324.3%
[
3.0%
-
3.5%
]
3.47%
924,6745.5%
[
3.5%
-
4.0%
]
3.74%
309,9177.9%
[
4.0%
-
4.5%
]
4.10%
519,7774.6%
[
4.0%
-
4.5%
]
4.42%
287,2474.6%
[
4.5%
-
5.0%
]
4.76%
30,7017.1%
[
4.5%
-
5.0%
]
4.98%
761,3487.9%
[
5.0%
-
5.5%
]
5.48%
167,1167.6%
[
5.5%
-
6.0%
]
5.77%
107,7304.3%
[
6.0%
-
6.5%
]
6.12%
174,0017.1%
[
6.0%
-
6.5%
]
6.44%
58,4145.6%
[
6.5%
-
7.0%
]
6.76%
170,69614.3%
[
6.5%
-
7.0%
]
6.99%
50,4847.8%
[
7.0%
-
7.5%
]
7.32%
10,55716.4%
[
7.5%
-
8.0%
]
7.66%
37,98812.5%
[
7.5%
-
8.0%
]
7.92%
42,7352.0%
[
8.0%
-
8.5%
]
8.18%
52,88612.9%
[
8.5%
-
9.0%
]
8.54%
11,26213.4%
[
9.0%
-
9.5%
]
9.03%
148,3697.7%
[
9.0%
-
9.5%
]
9.40%
51,0354.7%
[
9.5%
-
10.0%
]
9.63%
136,08510.8%
[
9.5%
-
10.0%
]
9.96%
134,2054.2%
[
10.0%
-
10.5%
]
10.33%
64,5319.1%
[
10.5%
-
11.0%
]
10.72%
70,82711.6%
[
10.5%
-
11.0%
]
10.85%
31,2921.8%
[
11.0%
-
11.5%
]
11.27%
308,8065.3%
[
11.5%
-
12.0%
]
11.69%
1,1723.9%
[
11.5%
-
12.0%
]
11.89%
32,9122.3%
[
12.5%
-
13.0%
]
12.59%
2,20810.6%
[
12.5%
-
13.0%
]
12.76%
84,9512.2%
[
13.0%
-
13.5%
]
13.26%
2,0068.1%
[
13.0%
-
13.5%
]
13.48%
13,4591.0%
[
13.5%
-
14.0%
]
13.86%
95,3106.9%
[
14.5%
-
15.0%
]
14.91%
9322.4%
[
15.0%
-
15.5%
]
15.04%
13,1165.4%
[
15.0%
-
15.5%
]
15.39%
132,0603.9%
[
15.5%
-
16.0%
]
15.74%
2163.6%
[
16.0%
-
16.5%
]
16.48%
6,79010.2%
[
16.5%
-
17.0%
]
16.66%
34,2202.7%
[
18.0%
-
18.5%
]
18.23%
7,58118.1%
[
18.0%
-
18.5%
]
18.31%
17,7160.85%
[
24.5%
-
25.0%
]
24.55%
1,2187.9%
[
25.5%
-
26.0%
]
25.55%
57,6629.9%
[
26.0%
-
26.5%
]
26.16%
19,61318.9%
[
40.5%
-
41.0%
]
40.74%
73410.4%