Jefferson, WV Map & Demographics
Jefferson Map
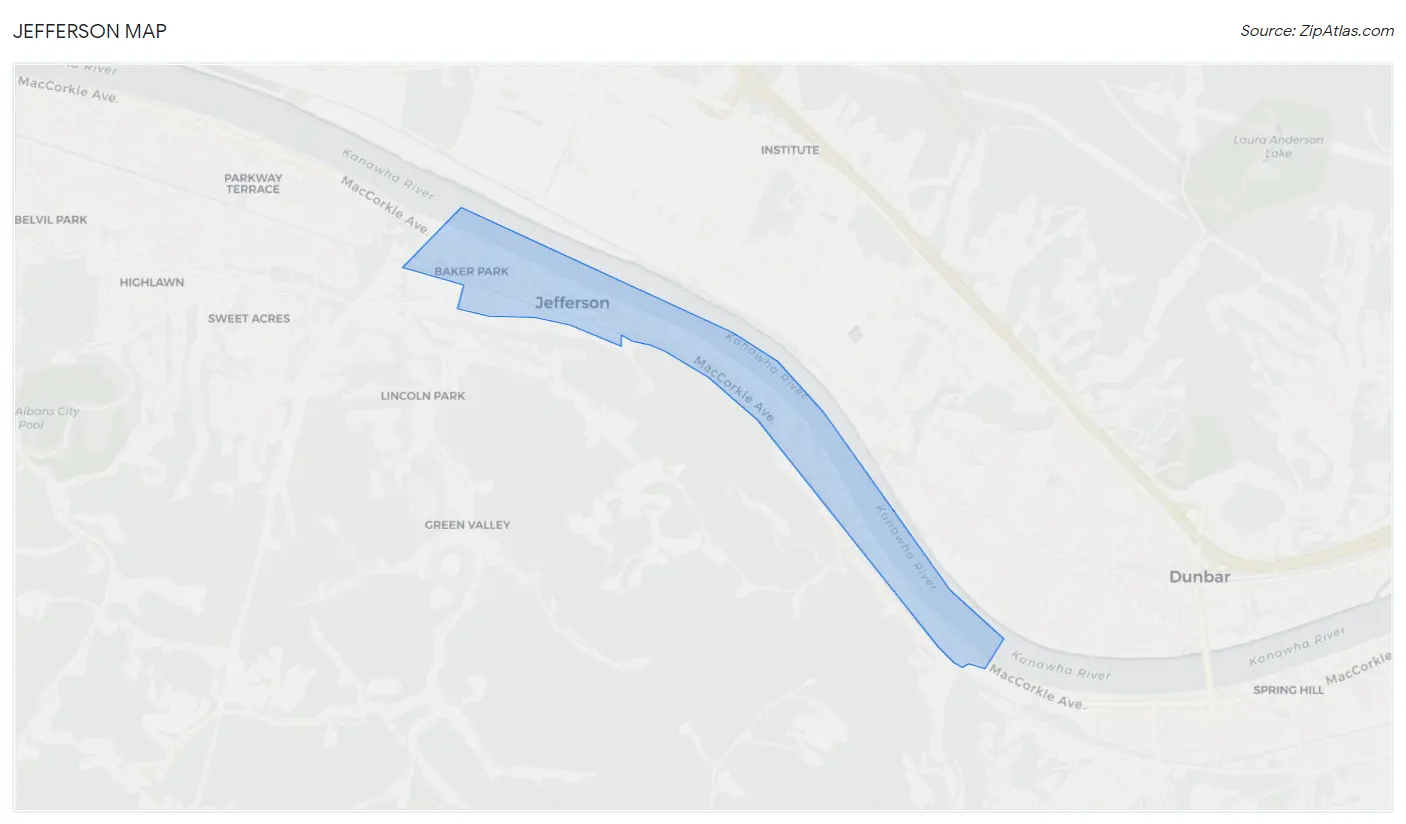
Jefferson Overview
$17,506
PER CAPITA INCOME
$38,533
AVG HOUSEHOLD INCOME
24.0%
WAGE / INCOME GAP [ % ]
76.0¢/ $1
WAGE / INCOME GAP [ $ ]
0.40
INEQUALITY / GINI INDEX
635
TOTAL POPULATION
373
MALE POPULATION
262
FEMALE POPULATION
142.37
MALES / 100 FEMALES
70.24
FEMALES / 100 MALES
40.8
MEDIAN AGE
3.3
AVG FAMILY SIZE
2.3
AVG HOUSEHOLD SIZE
177
LABOR FORCE [ PEOPLE ]
32.1%
PERCENT IN LABOR FORCE
Jefferson Area Codes
Income in Jefferson
Income Overview in Jefferson
| Characteristic | Number | Measure |
| Per Capita Income | 635 | $17,506 |
| Median Family Income | 102 | $0 |
| Mean Family Income | 102 | $49,827 |
| Median Household Income | 219 | $38,533 |
| Mean Household Income | 219 | $42,703 |
| Income Deficit | 102 | $0 |
| Wage / Income Gap (%) | 635 | 23.98% |
| Wage / Income Gap ($) | 635 | 76.02¢ per $1 |
| Gini / Inequality Index | 635 | 0.40 |
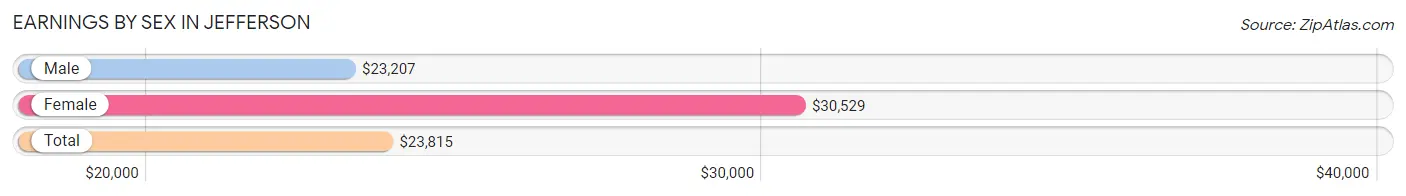
Earnings by Sex in Jefferson
Average Earnings in Jefferson are $23,815, $23,207 for men and $30,529 for women, a difference of 24.0%.
| Sex | Number | Average Earnings |
| Male | 166 (80.2%) | $23,207 |
| Female | 41 (19.8%) | $30,529 |
| Total | 207 (100.0%) | $23,815 |
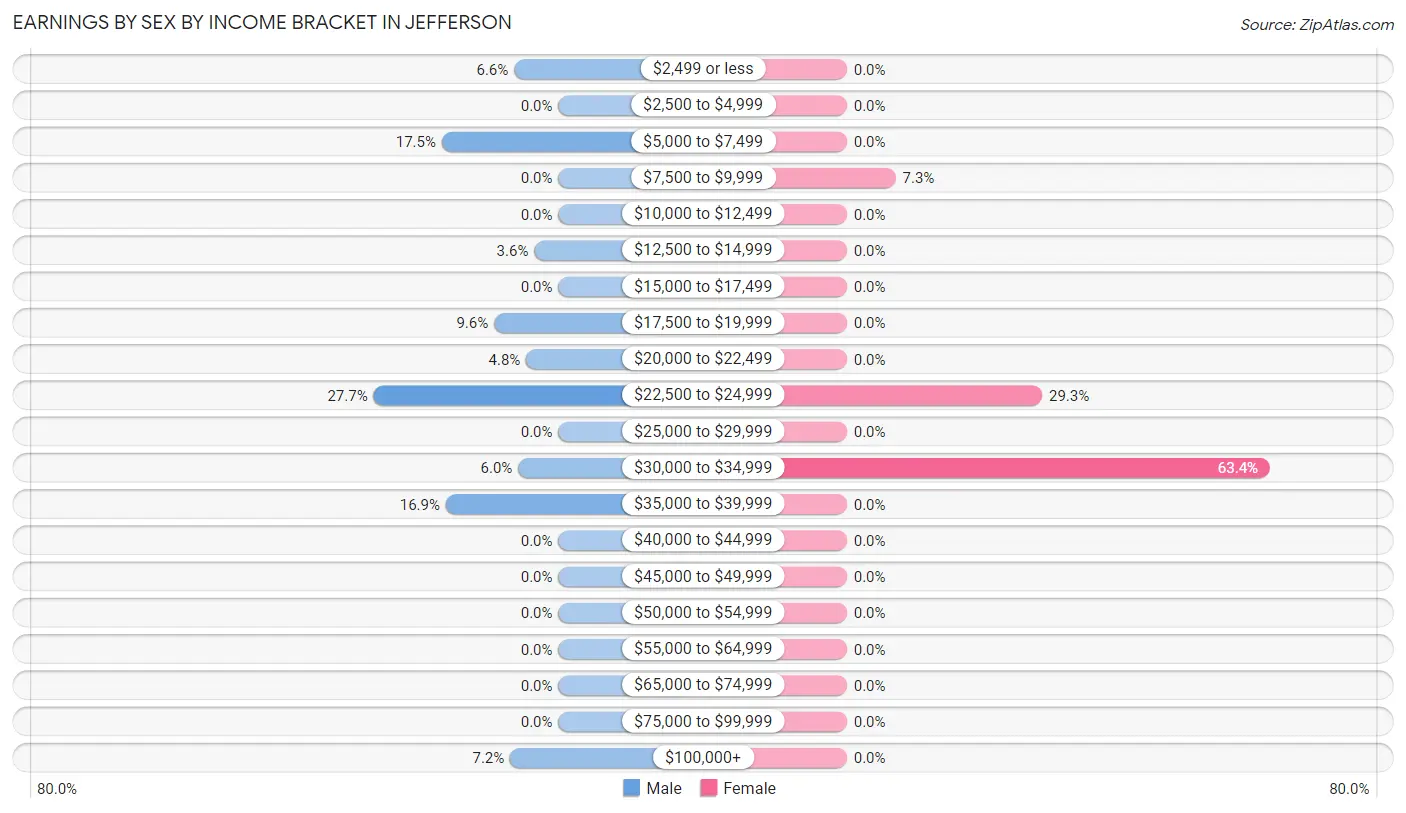
Earnings by Sex by Income Bracket in Jefferson
The most common earnings brackets in Jefferson are $22,500 to $24,999 for men (46 | 27.7%) and $30,000 to $34,999 for women (26 | 63.4%).
| Income | Male | Female |
| $2,499 or less | 11 (6.6%) | 0 (0.0%) |
| $2,500 to $4,999 | 0 (0.0%) | 0 (0.0%) |
| $5,000 to $7,499 | 29 (17.5%) | 0 (0.0%) |
| $7,500 to $9,999 | 0 (0.0%) | 3 (7.3%) |
| $10,000 to $12,499 | 0 (0.0%) | 0 (0.0%) |
| $12,500 to $14,999 | 6 (3.6%) | 0 (0.0%) |
| $15,000 to $17,499 | 0 (0.0%) | 0 (0.0%) |
| $17,500 to $19,999 | 16 (9.6%) | 0 (0.0%) |
| $20,000 to $22,499 | 8 (4.8%) | 0 (0.0%) |
| $22,500 to $24,999 | 46 (27.7%) | 12 (29.3%) |
| $25,000 to $29,999 | 0 (0.0%) | 0 (0.0%) |
| $30,000 to $34,999 | 10 (6.0%) | 26 (63.4%) |
| $35,000 to $39,999 | 28 (16.9%) | 0 (0.0%) |
| $40,000 to $44,999 | 0 (0.0%) | 0 (0.0%) |
| $45,000 to $49,999 | 0 (0.0%) | 0 (0.0%) |
| $50,000 to $54,999 | 0 (0.0%) | 0 (0.0%) |
| $55,000 to $64,999 | 0 (0.0%) | 0 (0.0%) |
| $65,000 to $74,999 | 0 (0.0%) | 0 (0.0%) |
| $75,000 to $99,999 | 0 (0.0%) | 0 (0.0%) |
| $100,000+ | 12 (7.2%) | 0 (0.0%) |
| Total | 166 (100.0%) | 41 (100.0%) |
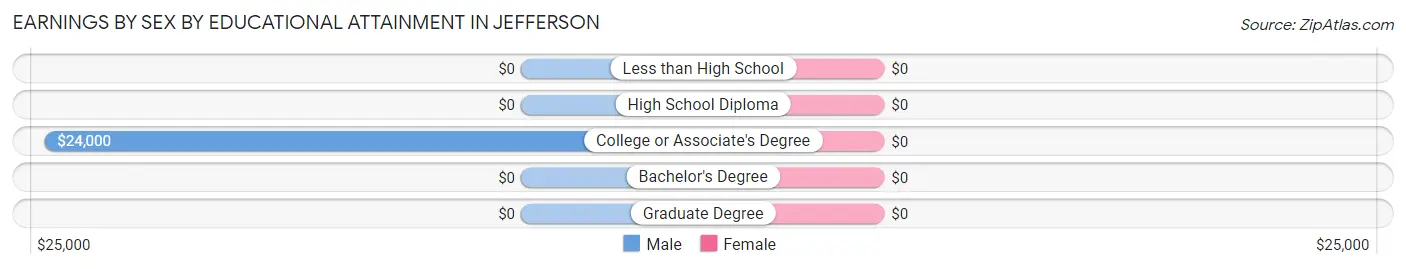
Earnings by Sex by Educational Attainment in Jefferson
| Educational Attainment | Male Income | Female Income |
| Less than High School | - | - |
| High School Diploma | - | - |
| College or Associate's Degree | $24,000 | $0 |
| Bachelor's Degree | - | - |
| Graduate Degree | - | - |
| Total | $24,313 | $24,792 |
Family Income in Jefferson
Family Income Brackets in Jefferson
According to the Jefferson family income data, there are 33 families falling into the $15,000 to $24,999 income range, which is the most common income bracket and makes up 32.4% of all families.
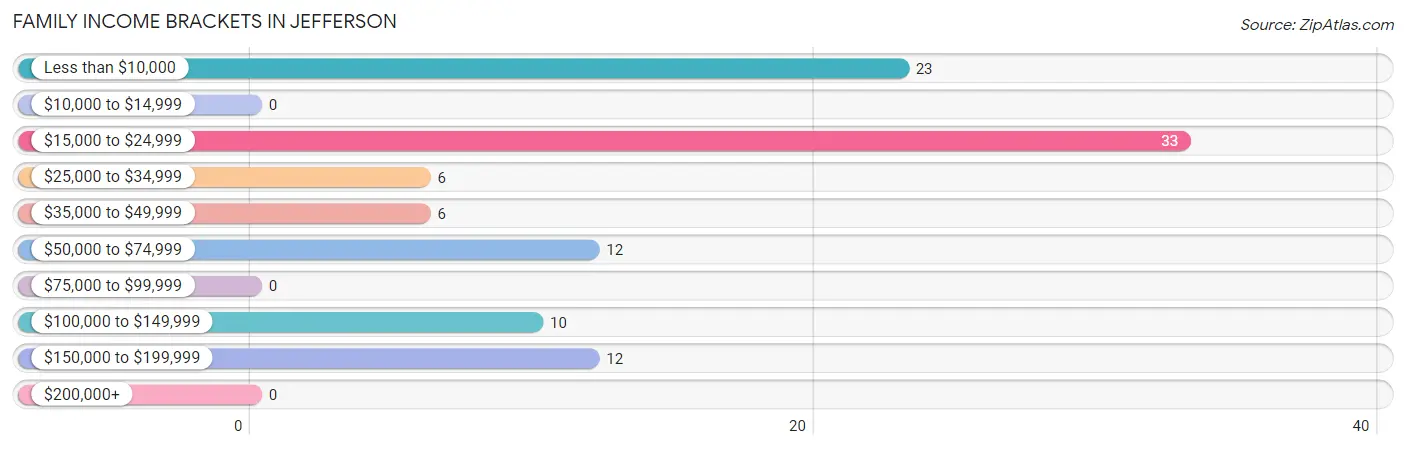
| Income Bracket | # Families | % Families |
| Less than $10,000 | 23 | 22.5% |
| $10,000 to $14,999 | 0 | 0.0% |
| $15,000 to $24,999 | 33 | 32.4% |
| $25,000 to $34,999 | 6 | 5.9% |
| $35,000 to $49,999 | 6 | 5.9% |
| $50,000 to $74,999 | 12 | 11.8% |
| $75,000 to $99,999 | 0 | 0.0% |
| $100,000 to $149,999 | 10 | 9.8% |
| $150,000 to $199,999 | 12 | 11.8% |
| $200,000+ | 0 | 0.0% |
Family Income by Famaliy Size in Jefferson
| Income Bracket | # Families | Median Income |
| 2-Person Families | 30 (29.4%) | $0 |
| 3-Person Families | 50 (49.0%) | $0 |
| 4-Person Families | 16 (15.7%) | $0 |
| 5-Person Families | 0 (0.0%) | $0 |
| 6-Person Families | 0 (0.0%) | $0 |
| 7+ Person Families | 6 (5.9%) | $0 |
| Total | 102 (100.0%) | $0 |
Family Income by Number of Earners in Jefferson
| Number of Earners | # Families | Median Income |
| No Earners | 33 (32.4%) | $0 |
| 1 Earner | 45 (44.1%) | $0 |
| 2 Earners | 24 (23.5%) | $0 |
| 3+ Earners | 0 (0.0%) | $0 |
| Total | 102 (100.0%) | $0 |
Household Income in Jefferson
Household Income Brackets in Jefferson
With 65 households falling in the category, the $35,000 to $49,999 income range is the most frequent in Jefferson, accounting for 29.7% of all households.
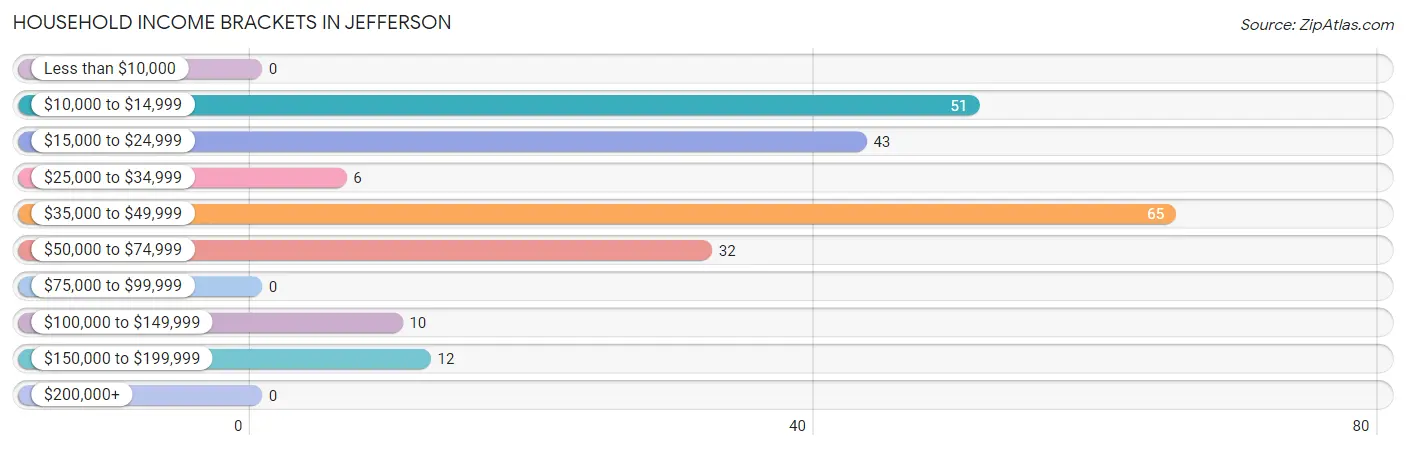
| Income Bracket | # Households | % Households |
| Less than $10,000 | 0 | 0.0% |
| $10,000 to $14,999 | 51 | 23.3% |
| $15,000 to $24,999 | 43 | 19.6% |
| $25,000 to $34,999 | 6 | 2.7% |
| $35,000 to $49,999 | 65 | 29.7% |
| $50,000 to $74,999 | 32 | 14.6% |
| $75,000 to $99,999 | 0 | 0.0% |
| $100,000 to $149,999 | 10 | 4.6% |
| $150,000 to $199,999 | 12 | 5.5% |
| $200,000+ | 0 | 0.0% |
Household Income by Householder Age in Jefferson
| Income Bracket | # Households | Median Income |
| 15 to 24 Years | 49 (22.4%) | $0 |
| 25 to 44 Years | 28 (12.8%) | $0 |
| 45 to 64 Years | 89 (40.6%) | $0 |
| 65+ Years | 53 (24.2%) | $0 |
| Total | 219 (100.0%) | $38,533 |
Poverty in Jefferson
Income Below Poverty by Sex and Age in Jefferson
With 53.6% poverty level for males and 63.4% for females among the residents of Jefferson, under 5 year old males and under 5 year old females are the most vulnerable to poverty, with 26 males (100.0%) and 31 females (100.0%) in their respective age groups living below the poverty level.
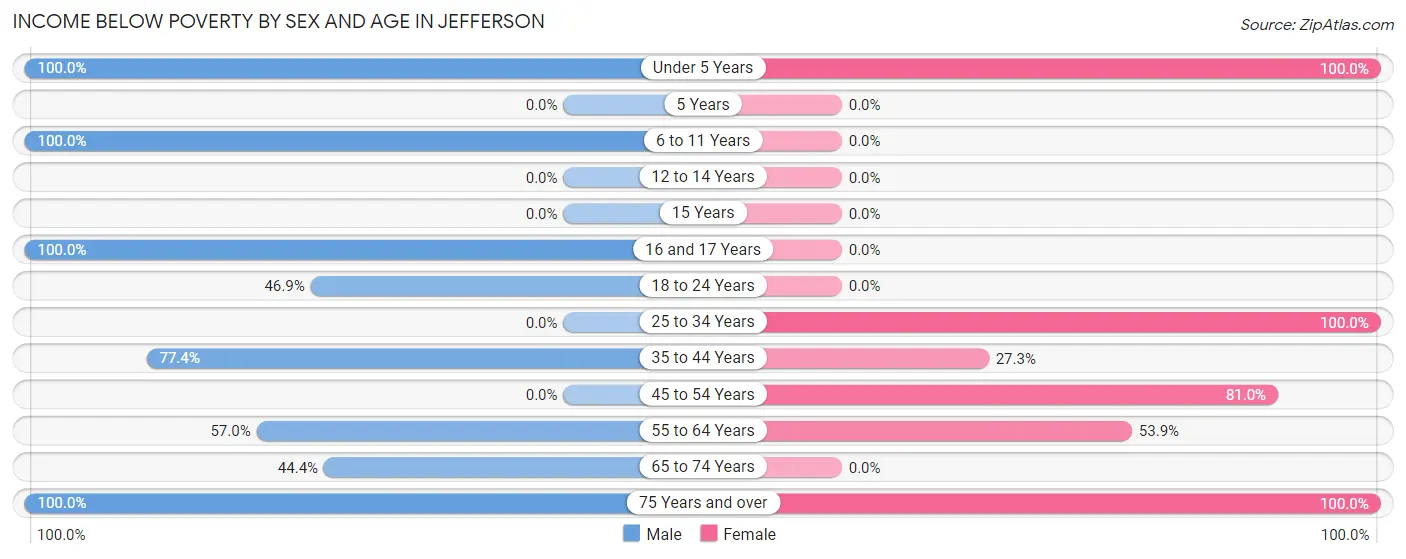
| Age Bracket | Male | Female |
| Under 5 Years | 26 (100.0%) | 31 (100.0%) |
| 5 Years | 0 (0.0%) | 0 (0.0%) |
| 6 to 11 Years | 7 (100.0%) | 0 (0.0%) |
| 12 to 14 Years | 0 (0.0%) | 0 (0.0%) |
| 15 Years | 0 (0.0%) | 0 (0.0%) |
| 16 and 17 Years | 8 (100.0%) | 0 (0.0%) |
| 18 to 24 Years | 23 (46.9%) | 0 (0.0%) |
| 25 to 34 Years | 0 (0.0%) | 10 (100.0%) |
| 35 to 44 Years | 41 (77.4%) | 6 (27.3%) |
| 45 to 54 Years | 0 (0.0%) | 51 (80.9%) |
| 55 to 64 Years | 45 (57.0%) | 7 (53.8%) |
| 65 to 74 Years | 8 (44.4%) | 0 (0.0%) |
| 75 Years and over | 6 (100.0%) | 32 (100.0%) |
| Total | 164 (53.6%) | 137 (63.4%) |
Income Above Poverty by Sex and Age in Jefferson
According to the poverty statistics in Jefferson, males aged 12 to 14 years and females aged 18 to 24 years are the age groups that are most secure financially, with 100.0% of males and 100.0% of females in these age groups living above the poverty line.
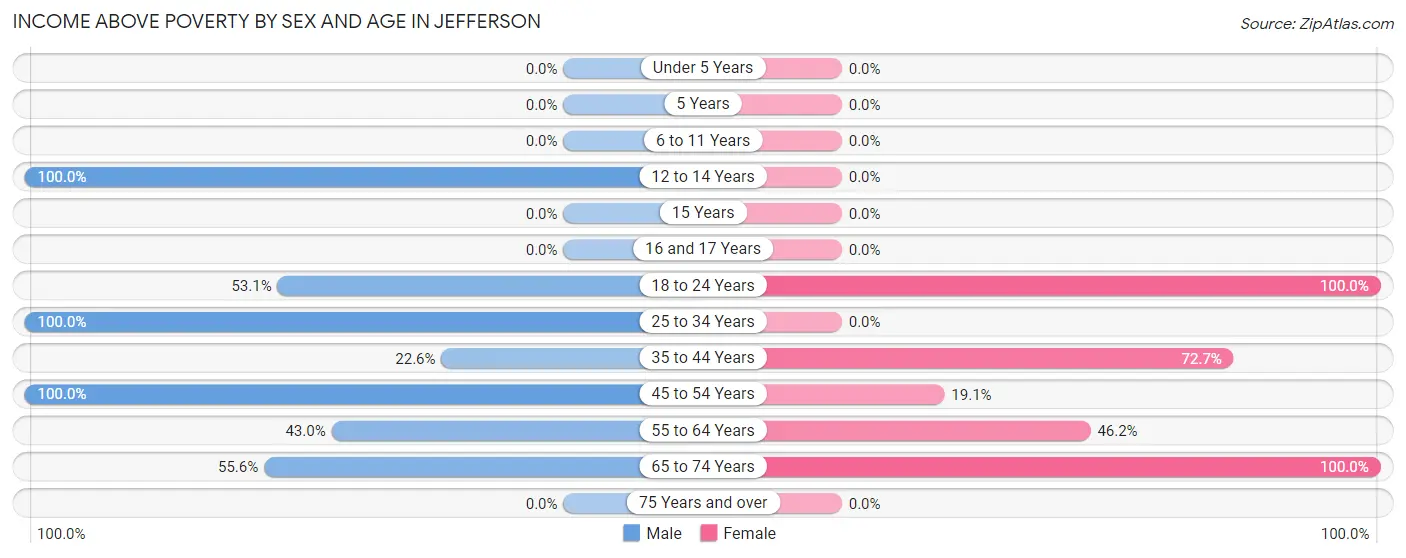
| Age Bracket | Male | Female |
| Under 5 Years | 0 (0.0%) | 0 (0.0%) |
| 5 Years | 0 (0.0%) | 0 (0.0%) |
| 6 to 11 Years | 0 (0.0%) | 0 (0.0%) |
| 12 to 14 Years | 12 (100.0%) | 0 (0.0%) |
| 15 Years | 0 (0.0%) | 0 (0.0%) |
| 16 and 17 Years | 0 (0.0%) | 0 (0.0%) |
| 18 to 24 Years | 26 (53.1%) | 35 (100.0%) |
| 25 to 34 Years | 38 (100.0%) | 0 (0.0%) |
| 35 to 44 Years | 12 (22.6%) | 16 (72.7%) |
| 45 to 54 Years | 10 (100.0%) | 12 (19.1%) |
| 55 to 64 Years | 34 (43.0%) | 6 (46.2%) |
| 65 to 74 Years | 10 (55.6%) | 10 (100.0%) |
| 75 Years and over | 0 (0.0%) | 0 (0.0%) |
| Total | 142 (46.4%) | 79 (36.6%) |
Income Below Poverty Among Married-Couple Families in Jefferson
The poverty statistics for married-couple families in Jefferson show that 13.0% or 6 of the total 46 families live below the poverty line. Families with 1 or 2 children have the highest poverty rate of 37.5%, comprising of 6 families. On the other hand, families with no children have the lowest poverty rate of 0.0%, which includes 0 families.
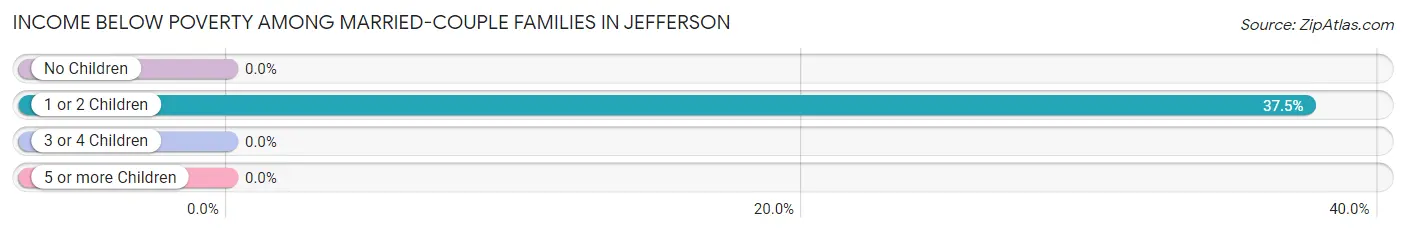
| Children | Above Poverty | Below Poverty |
| No Children | 30 (100.0%) | 0 (0.0%) |
| 1 or 2 Children | 10 (62.5%) | 6 (37.5%) |
| 3 or 4 Children | 0 (0.0%) | 0 (0.0%) |
| 5 or more Children | 0 (0.0%) | 0 (0.0%) |
| Total | 40 (87.0%) | 6 (13.0%) |
Income Below Poverty Among Single-Parent Households in Jefferson
According to the poverty data in Jefferson, 100.0% or 29 single-father households and 100.0% or 27 single-mother households are living below the poverty line. Among single-father households, those with 1 or 2 children have the highest poverty rate, with 23 households (100.0%) experiencing poverty. Likewise, among single-mother households, those with no children have the highest poverty rate, with 27 households (100.0%) falling below the poverty line.
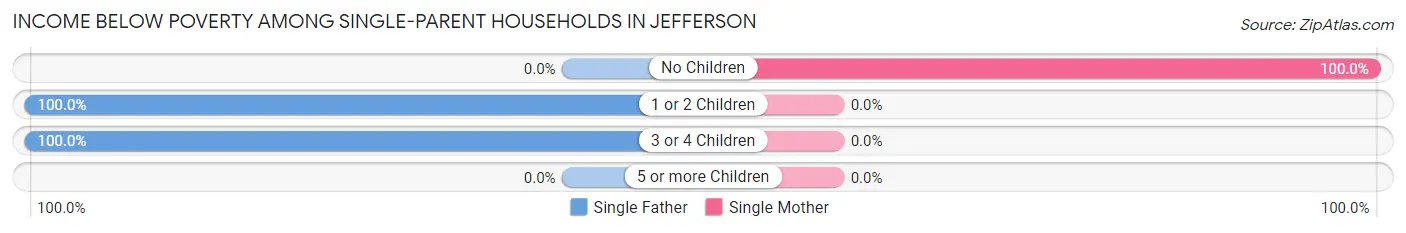
| Children | Single Father | Single Mother |
| No Children | 0 (0.0%) | 27 (100.0%) |
| 1 or 2 Children | 23 (100.0%) | 0 (0.0%) |
| 3 or 4 Children | 6 (100.0%) | 0 (0.0%) |
| 5 or more Children | 0 (0.0%) | 0 (0.0%) |
| Total | 29 (100.0%) | 27 (100.0%) |
Income Below Poverty Among Married-Couple vs Single-Parent Households in Jefferson
The poverty data for Jefferson shows that 6 of the married-couple family households (13.0%) and 56 of the single-parent households (100.0%) are living below the poverty level. Within the married-couple family households, those with 1 or 2 children have the highest poverty rate, with 6 households (37.5%) falling below the poverty line. Among the single-parent households, those with no children have the highest poverty rate, with 27 household (100.0%) living below poverty.
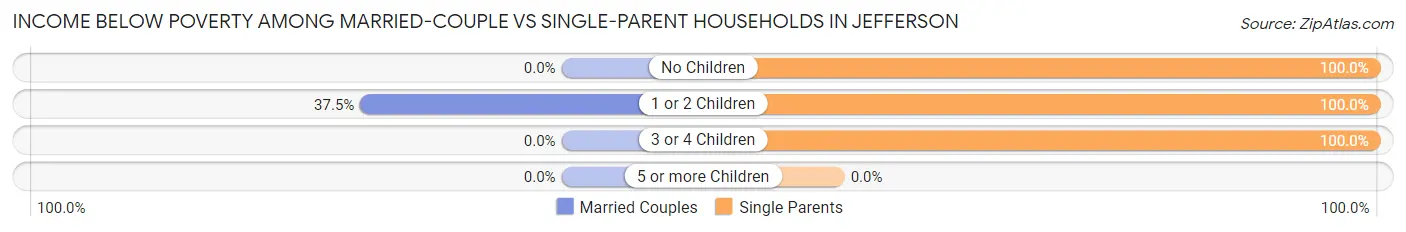
| Children | Married-Couple Families | Single-Parent Households |
| No Children | 0 (0.0%) | 27 (100.0%) |
| 1 or 2 Children | 6 (37.5%) | 23 (100.0%) |
| 3 or 4 Children | 0 (0.0%) | 6 (100.0%) |
| 5 or more Children | 0 (0.0%) | 0 (0.0%) |
| Total | 6 (13.0%) | 56 (100.0%) |
Race in Jefferson
The most populous races in Jefferson are White / Caucasian (464 | 73.1%), Black / African American (129 | 20.3%), and Two or more Races (42 | 6.6%).
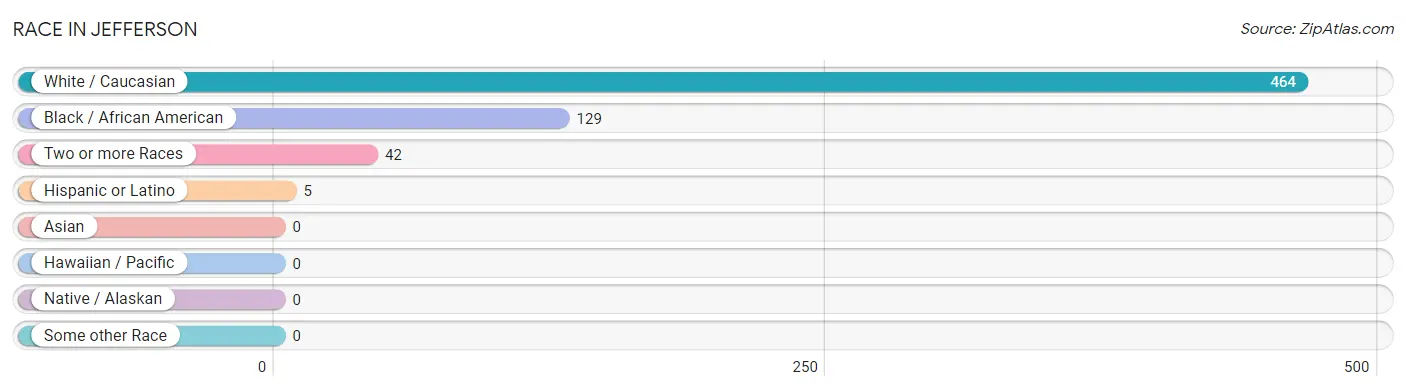
| Race | # Population | % Population |
| Asian | 0 | 0.0% |
| Black / African American | 129 | 20.3% |
| Hawaiian / Pacific | 0 | 0.0% |
| Hispanic or Latino | 5 | 0.8% |
| Native / Alaskan | 0 | 0.0% |
| White / Caucasian | 464 | 73.1% |
| Two or more Races | 42 | 6.6% |
| Some other Race | 0 | 0.0% |
| Total | 635 | 100.0% |
Ancestry in Jefferson
The most populous ancestries reported in Jefferson are American (71 | 11.2%), Irish (53 | 8.4%), German (48 | 7.6%), Scotch-Irish (16 | 2.5%), and African (13 | 2.1%), together accounting for 31.7% of all Jefferson residents.
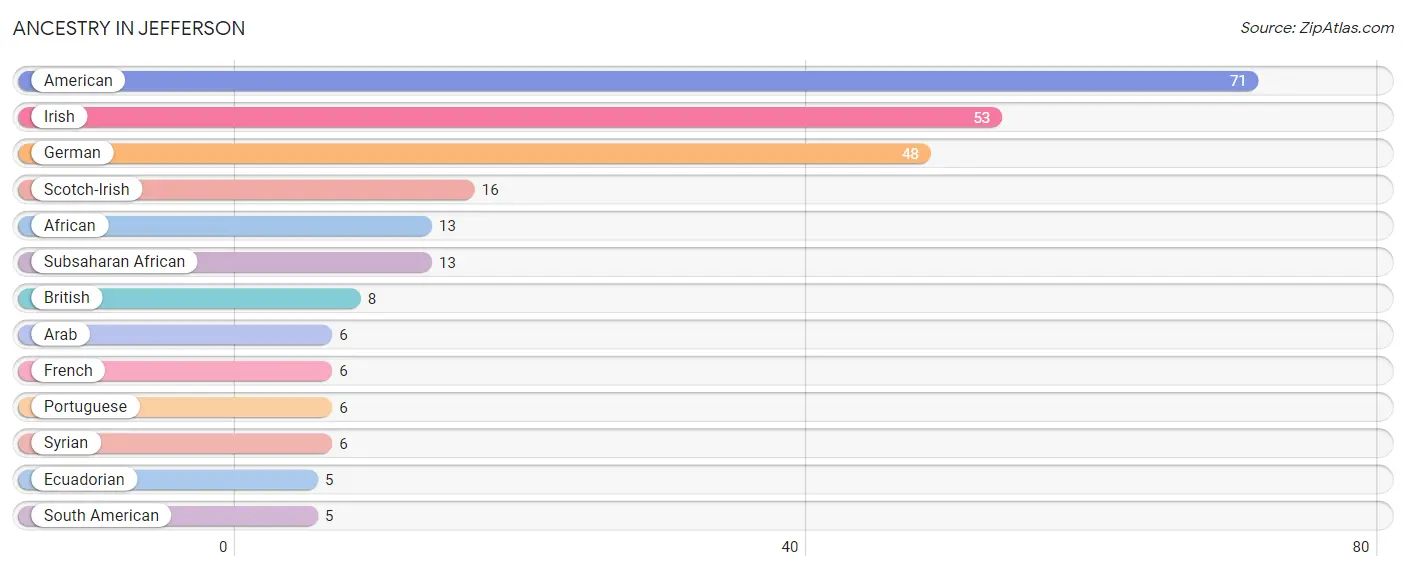
| Ancestry | # Population | % Population |
| African | 13 | 2.1% |
| American | 71 | 11.2% |
| Arab | 6 | 0.9% |
| British | 8 | 1.3% |
| Ecuadorian | 5 | 0.8% |
| French | 6 | 0.9% |
| German | 48 | 7.6% |
| Irish | 53 | 8.4% |
| Portuguese | 6 | 0.9% |
| Scotch-Irish | 16 | 2.5% |
| South American | 5 | 0.8% |
| Subsaharan African | 13 | 2.1% |
| Syrian | 6 | 0.9% | View All 13 Rows |
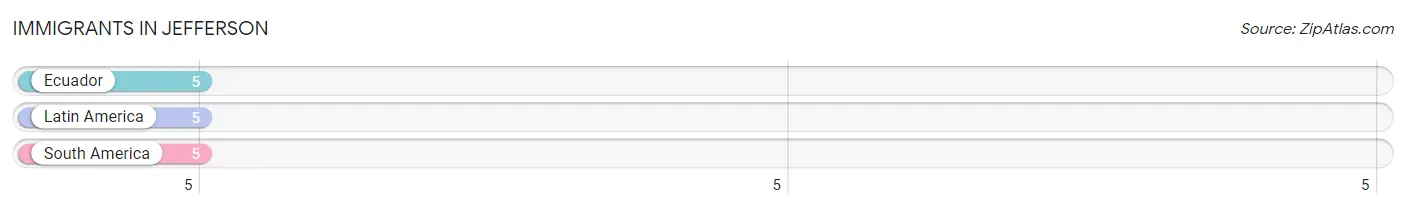
Immigrants in Jefferson
The most numerous immigrant groups reported in Jefferson came from Ecuador (5 | 0.8%), Latin America (5 | 0.8%), and South America (5 | 0.8%), together accounting for 2.4% of all Jefferson residents.
| Immigration Origin | # Population | % Population |
| Ecuador | 5 | 0.8% |
| Latin America | 5 | 0.8% |
| South America | 5 | 0.8% | View All 3 Rows |
Sex and Age in Jefferson
Sex and Age in Jefferson
The most populous age groups in Jefferson are 60 to 64 Years (60 | 16.1%) for men and 50 to 54 Years (63 | 24.0%) for women.

| Age Bracket | Male | Female |
| Under 5 Years | 33 (8.8%) | 31 (11.8%) |
| 5 to 9 Years | 0 (0.0%) | 0 (0.0%) |
| 10 to 14 Years | 19 (5.1%) | 0 (0.0%) |
| 15 to 19 Years | 8 (2.1%) | 13 (5.0%) |
| 20 to 24 Years | 55 (14.7%) | 30 (11.5%) |
| 25 to 29 Years | 39 (10.5%) | 7 (2.7%) |
| 30 to 34 Years | 10 (2.7%) | 3 (1.1%) |
| 35 to 39 Years | 18 (4.8%) | 22 (8.4%) |
| 40 to 44 Years | 35 (9.4%) | 0 (0.0%) |
| 45 to 49 Years | 0 (0.0%) | 0 (0.0%) |
| 50 to 54 Years | 10 (2.7%) | 63 (24.0%) |
| 55 to 59 Years | 27 (7.2%) | 0 (0.0%) |
| 60 to 64 Years | 60 (16.1%) | 13 (5.0%) |
| 65 to 69 Years | 21 (5.6%) | 6 (2.3%) |
| 70 to 74 Years | 13 (3.5%) | 14 (5.3%) |
| 75 to 79 Years | 0 (0.0%) | 0 (0.0%) |
| 80 to 84 Years | 5 (1.3%) | 33 (12.6%) |
| 85 Years and over | 20 (5.4%) | 27 (10.3%) |
| Total | 373 (100.0%) | 262 (100.0%) |
Families and Households in Jefferson
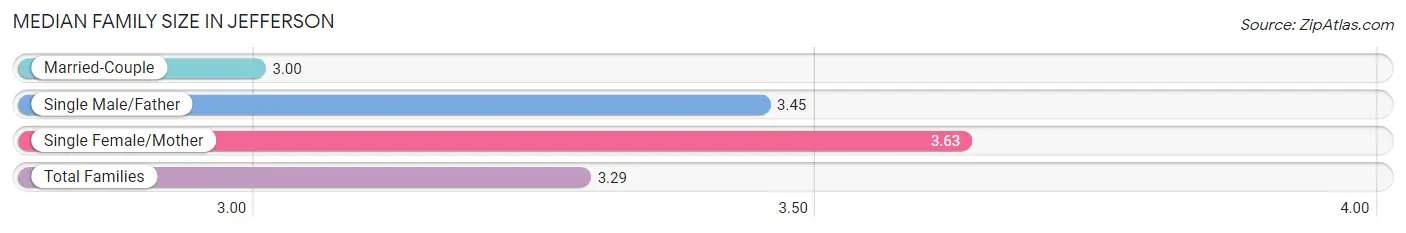
Median Family Size in Jefferson
The median family size in Jefferson is 3.29 persons per family, with single female/mother families (27 | 26.5%) accounting for the largest median family size of 3.63 persons per family. On the other hand, married-couple families (46 | 45.1%) represent the smallest median family size with 3.00 persons per family.
| Family Type | # Families | Family Size |
| Married-Couple | 46 (45.1%) | 3.00 |
| Single Male/Father | 29 (28.4%) | 3.45 |
| Single Female/Mother | 27 (26.5%) | 3.63 |
| Total Families | 102 (100.0%) | 3.29 |
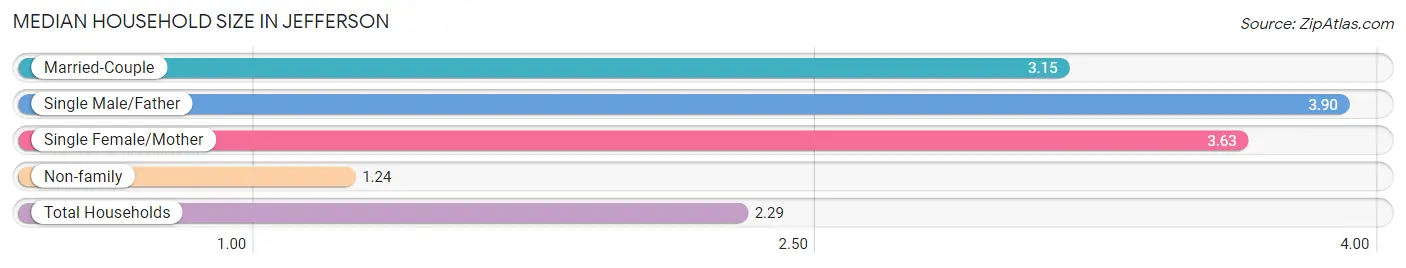
Median Household Size in Jefferson
The median household size in Jefferson is 2.29 persons per household, with single male/father households (29 | 13.2%) accounting for the largest median household size of 3.9 persons per household. non-family households (117 | 53.4%) represent the smallest median household size with 1.24 persons per household.
| Household Type | # Households | Household Size |
| Married-Couple | 46 (21.0%) | 3.15 |
| Single Male/Father | 29 (13.2%) | 3.90 |
| Single Female/Mother | 27 (12.3%) | 3.63 |
| Non-family | 117 (53.4%) | 1.24 |
| Total Households | 219 (100.0%) | 2.29 |
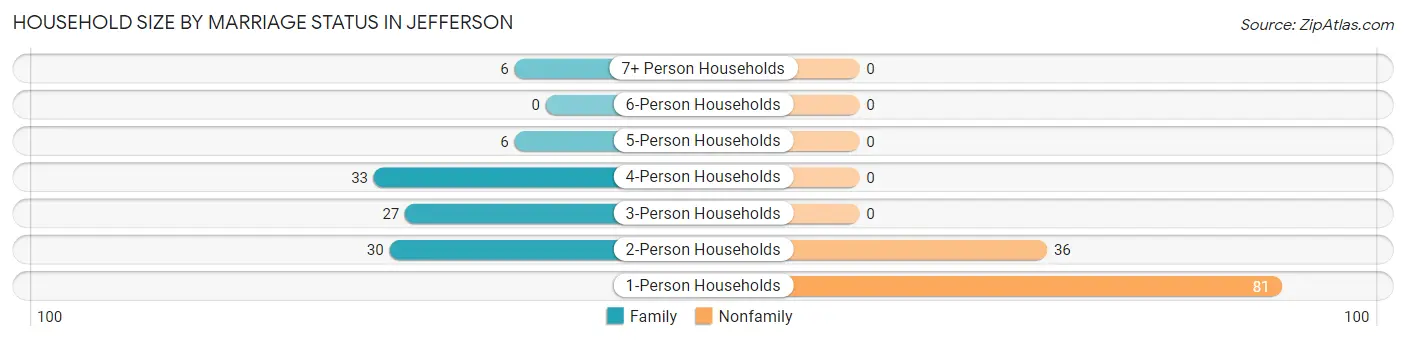
Household Size by Marriage Status in Jefferson
Out of a total of 219 households in Jefferson, 102 (46.6%) are family households, while 117 (53.4%) are nonfamily households. The most numerous type of family households are 4-person households, comprising 33, and the most common type of nonfamily households are 1-person households, comprising 81.
| Household Size | Family Households | Nonfamily Households |
| 1-Person Households | - | 81 (37.0%) |
| 2-Person Households | 30 (13.7%) | 36 (16.4%) |
| 3-Person Households | 27 (12.3%) | 0 (0.0%) |
| 4-Person Households | 33 (15.1%) | 0 (0.0%) |
| 5-Person Households | 6 (2.7%) | 0 (0.0%) |
| 6-Person Households | 0 (0.0%) | 0 (0.0%) |
| 7+ Person Households | 6 (2.7%) | 0 (0.0%) |
| Total | 102 (46.6%) | 117 (53.4%) |
Female Fertility in Jefferson
Fertility by Age in Jefferson
Average fertility rate in Jefferson is 280.0 births per 1,000 women. Women in the age bracket of 15 to 19 years have the highest fertility rate with 1,000.0 births per 1,000 women. Women in the age bracket of 15 to 19 years acount for 61.9% of all women with births.
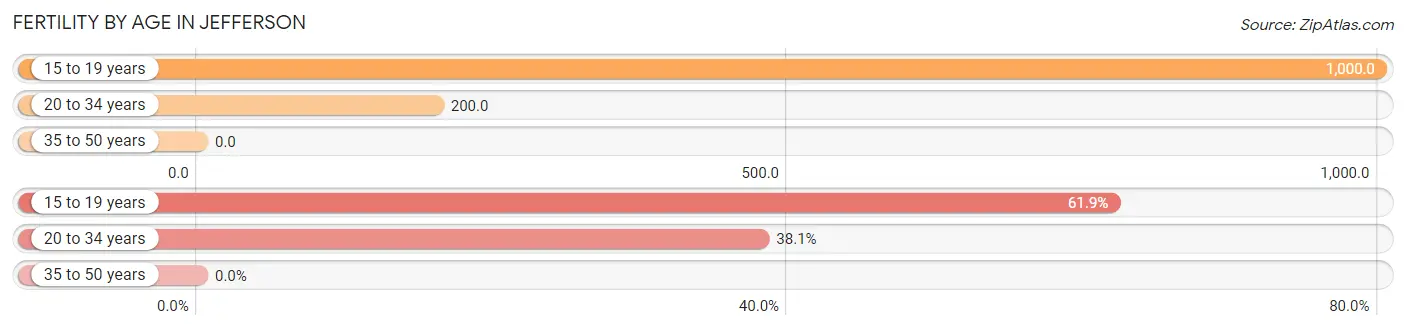
| Age Bracket | Women with Births | Births / 1,000 Women |
| 15 to 19 years | 13 (61.9%) | 1,000.0 |
| 20 to 34 years | 8 (38.1%) | 200.0 |
| 35 to 50 years | 0 (0.0%) | 0.0 |
| Total | 21 (100.0%) | 280.0 |
Fertility by Age by Marriage Status in Jefferson
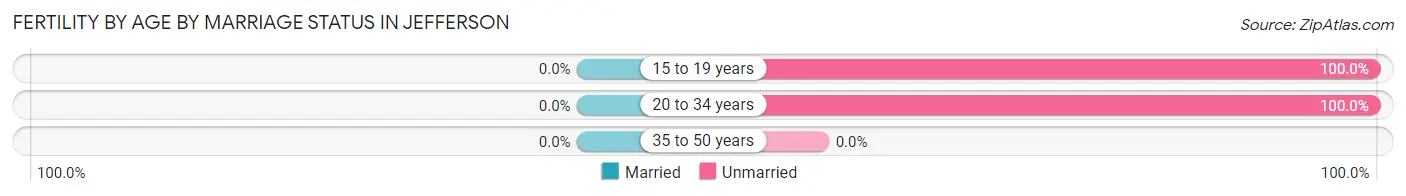
| Age Bracket | Married | Unmarried |
| 15 to 19 years | 0 (0.0%) | 13 (100.0%) |
| 20 to 34 years | 0 (0.0%) | 8 (100.0%) |
| 35 to 50 years | 0 (0.0%) | 0 (0.0%) |
| Total | 0 (0.0%) | 21 (100.0%) |
Fertility by Education in Jefferson
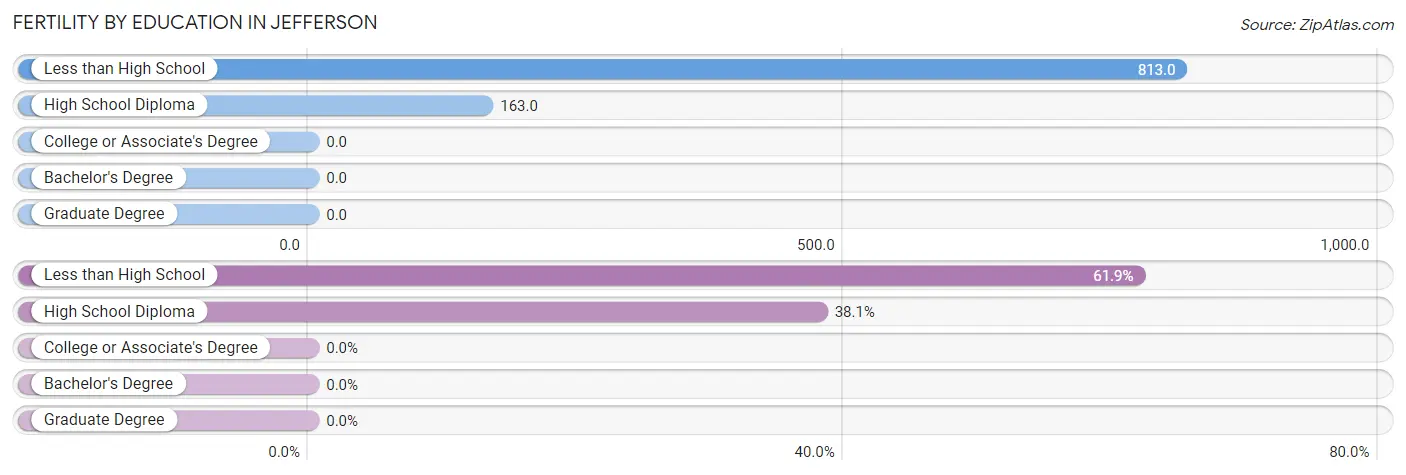
| Educational Attainment | Women with Births | Births / 1,000 Women |
| Less than High School | 13 (61.9%) | 813.0 |
| High School Diploma | 8 (38.1%) | 163.0 |
| College or Associate's Degree | 0 (0.0%) | 0.0 |
| Bachelor's Degree | 0 (0.0%) | 0.0 |
| Graduate Degree | 0 (0.0%) | 0.0 |
| Total | 21 (100.0%) | 280.0 |
Fertility by Education by Marriage Status in Jefferson
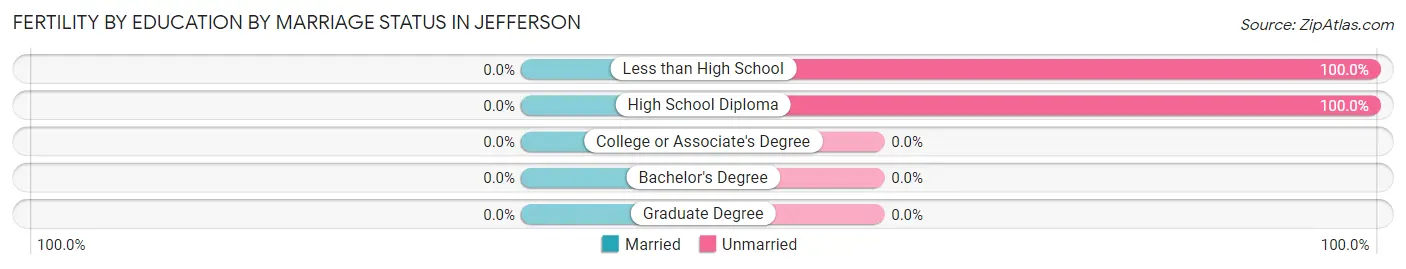
| Educational Attainment | Married | Unmarried |
| Less than High School | 0 (0.0%) | 13 (100.0%) |
| High School Diploma | 0 (0.0%) | 8 (100.0%) |
| College or Associate's Degree | 0 (0.0%) | 0 (0.0%) |
| Bachelor's Degree | 0 (0.0%) | 0 (0.0%) |
| Graduate Degree | 0 (0.0%) | 0 (0.0%) |
| Total | 0 (0.0%) | 21 (100.0%) |
Employment Characteristics in Jefferson
Employment by Class of Employer in Jefferson
Among the 177 employed individuals in Jefferson, private company employees (71 | 40.1%), not-for-profit organizations (59 | 33.3%), and state government employees (22 | 12.4%) make up the most common classes of employment.
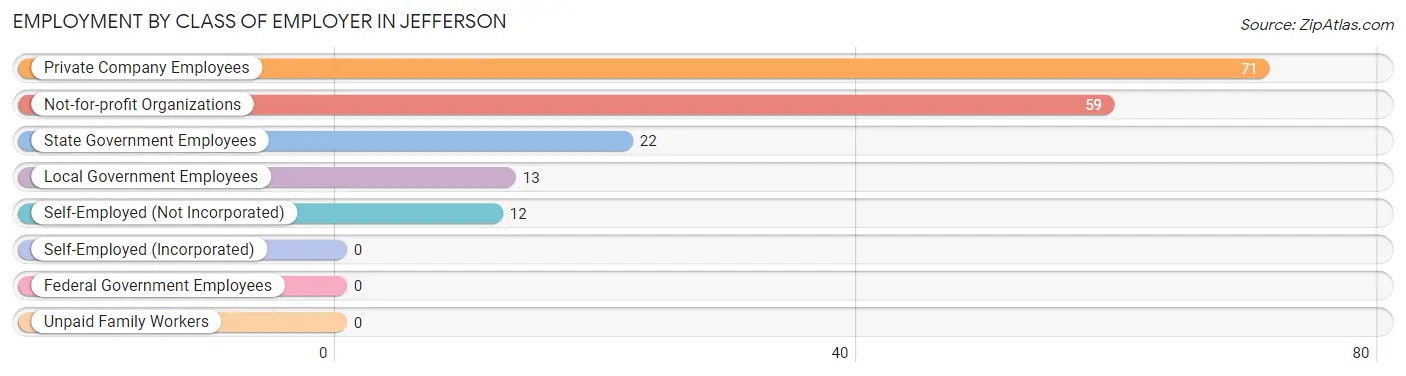
| Employer Class | # Employees | % Employees |
| Private Company Employees | 71 | 40.1% |
| Self-Employed (Incorporated) | 0 | 0.0% |
| Self-Employed (Not Incorporated) | 12 | 6.8% |
| Not-for-profit Organizations | 59 | 33.3% |
| Local Government Employees | 13 | 7.3% |
| State Government Employees | 22 | 12.4% |
| Federal Government Employees | 0 | 0.0% |
| Unpaid Family Workers | 0 | 0.0% |
| Total | 177 | 100.0% |
Employment Status by Age in Jefferson
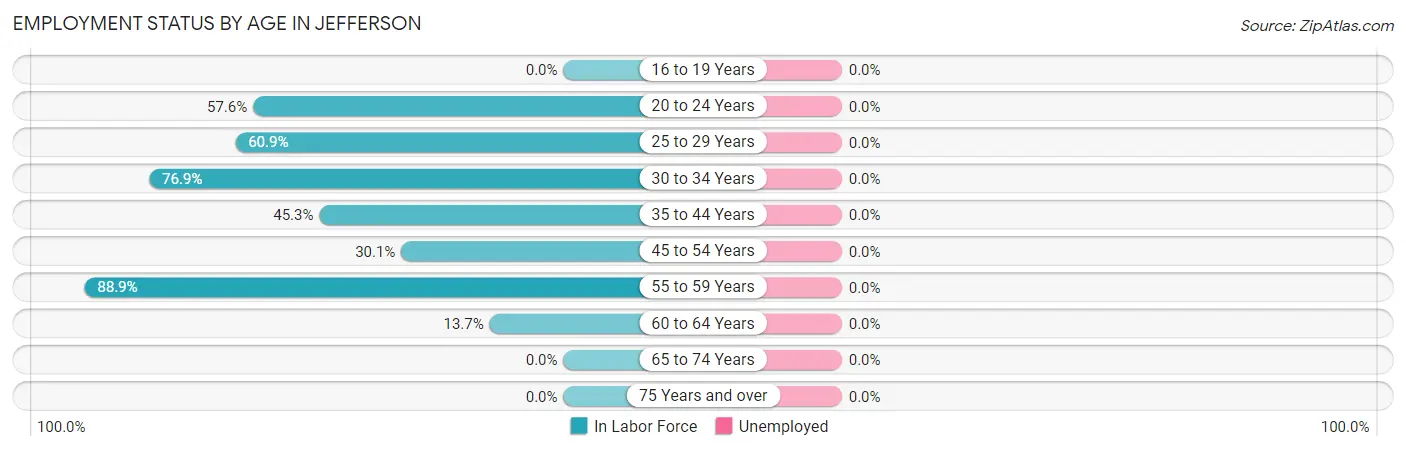
| Age Bracket | In Labor Force | Unemployed |
| 16 to 19 Years | 0 (0.0%) | 0 (0.0%) |
| 20 to 24 Years | 49 (57.6%) | 0 (0.0%) |
| 25 to 29 Years | 28 (60.9%) | 0 (0.0%) |
| 30 to 34 Years | 10 (76.9%) | 0 (0.0%) |
| 35 to 44 Years | 34 (45.3%) | 0 (0.0%) |
| 45 to 54 Years | 22 (30.1%) | 0 (0.0%) |
| 55 to 59 Years | 24 (88.9%) | 0 (0.0%) |
| 60 to 64 Years | 10 (13.7%) | 0 (0.0%) |
| 65 to 74 Years | 0 (0.0%) | 0 (0.0%) |
| 75 Years and over | 0 (0.0%) | 0 (0.0%) |
| Total | 177 (32.1%) | 0 (0.0%) |
Employment Status by Educational Attainment in Jefferson
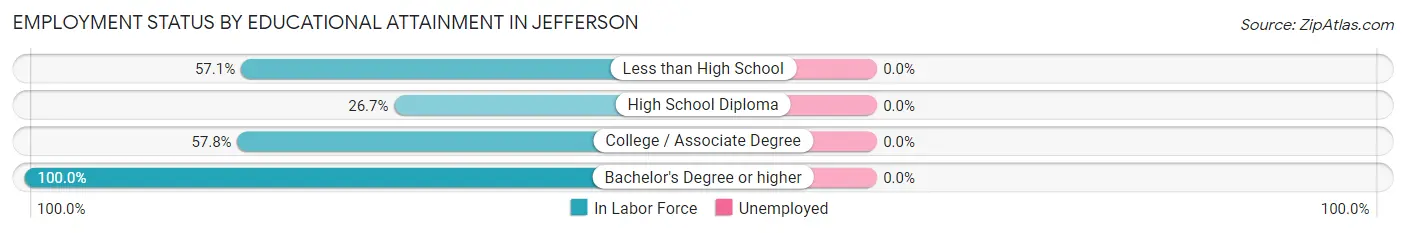
| Educational Attainment | In Labor Force | Unemployed |
| Less than High School | 24 (57.1%) | 0 (0.0%) |
| High School Diploma | 46 (26.7%) | 0 (0.0%) |
| College / Associate Degree | 48 (57.8%) | 0 (0.0%) |
| Bachelor's Degree or higher | 10 (100.0%) | 0 (0.0%) |
| Total | 128 (41.7%) | 0 (0.0%) |
Employment Occupations by Sex in Jefferson
Management, Business, Science and Arts Occupations
The most common Management, Business, Science and Arts occupations in Jefferson are Community & Social Service (38 | 21.5%), Arts, Media & Entertainment (28 | 15.8%), Management (12 | 6.8%), and Education, Arts & Media (10 | 5.7%).
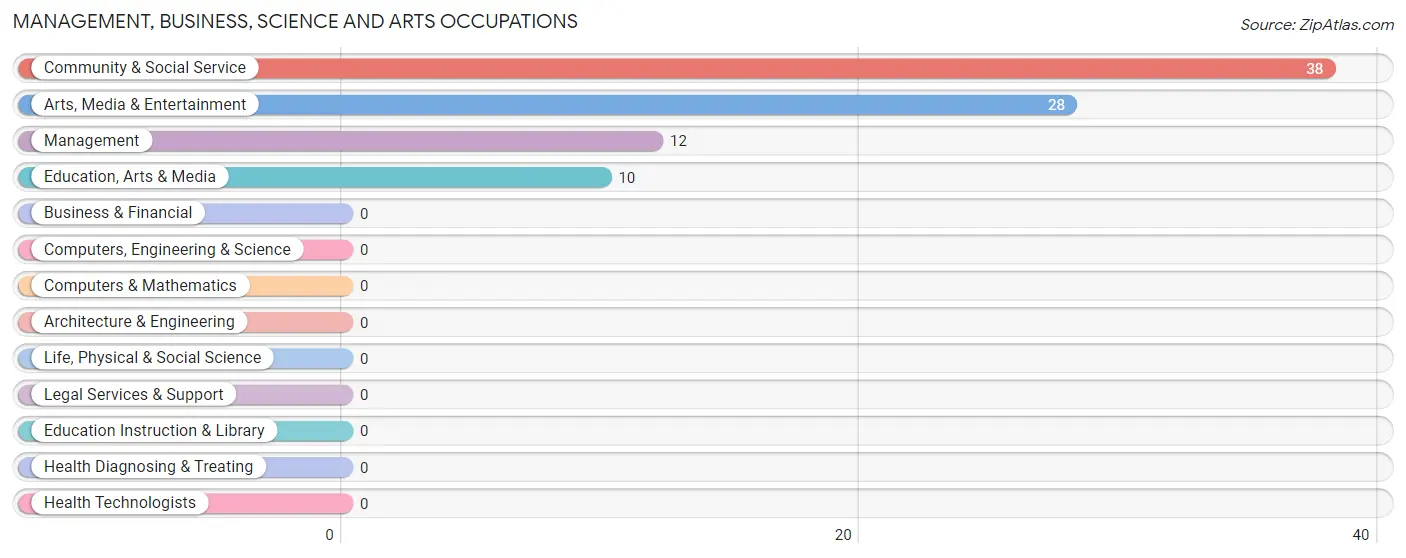
Management, Business, Science and Arts Occupations by Sex
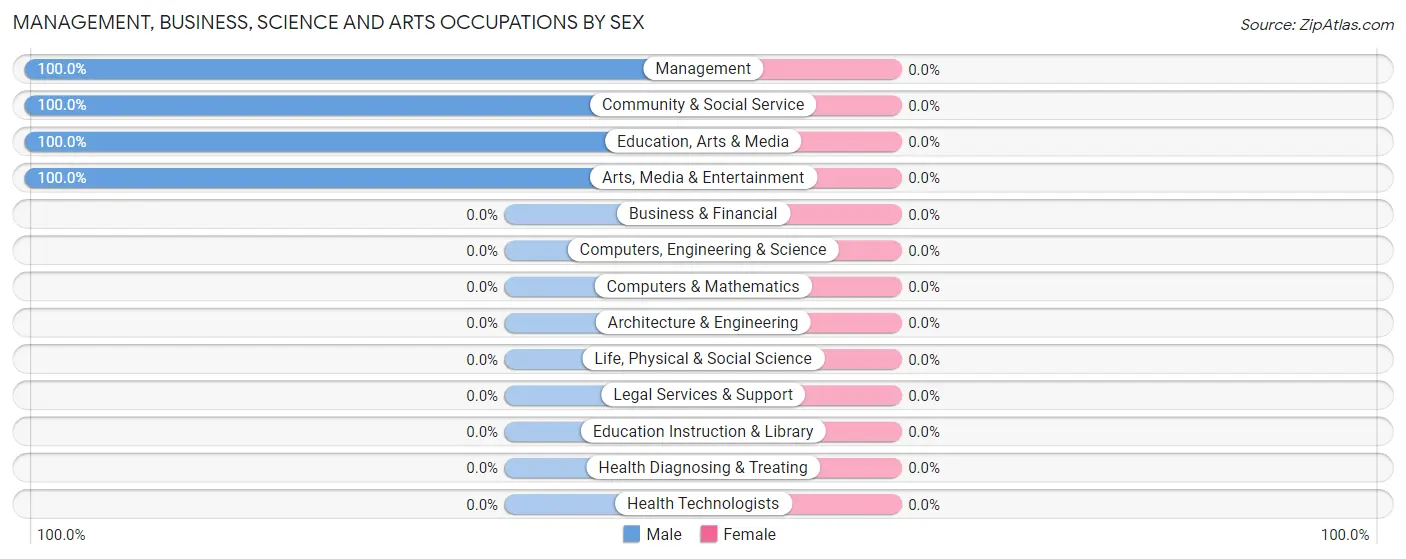
| Occupation | Male | Female |
| Management | 12 (100.0%) | 0 (0.0%) |
| Business & Financial | 0 (0.0%) | 0 (0.0%) |
| Computers, Engineering & Science | 0 (0.0%) | 0 (0.0%) |
| Computers & Mathematics | 0 (0.0%) | 0 (0.0%) |
| Architecture & Engineering | 0 (0.0%) | 0 (0.0%) |
| Life, Physical & Social Science | 0 (0.0%) | 0 (0.0%) |
| Community & Social Service | 38 (100.0%) | 0 (0.0%) |
| Education, Arts & Media | 10 (100.0%) | 0 (0.0%) |
| Legal Services & Support | 0 (0.0%) | 0 (0.0%) |
| Education Instruction & Library | 0 (0.0%) | 0 (0.0%) |
| Arts, Media & Entertainment | 28 (100.0%) | 0 (0.0%) |
| Health Diagnosing & Treating | 0 (0.0%) | 0 (0.0%) |
| Health Technologists | 0 (0.0%) | 0 (0.0%) |
| Total (Category) | 50 (100.0%) | 0 (0.0%) |
| Total (Overall) | 149 (84.2%) | 28 (15.8%) |
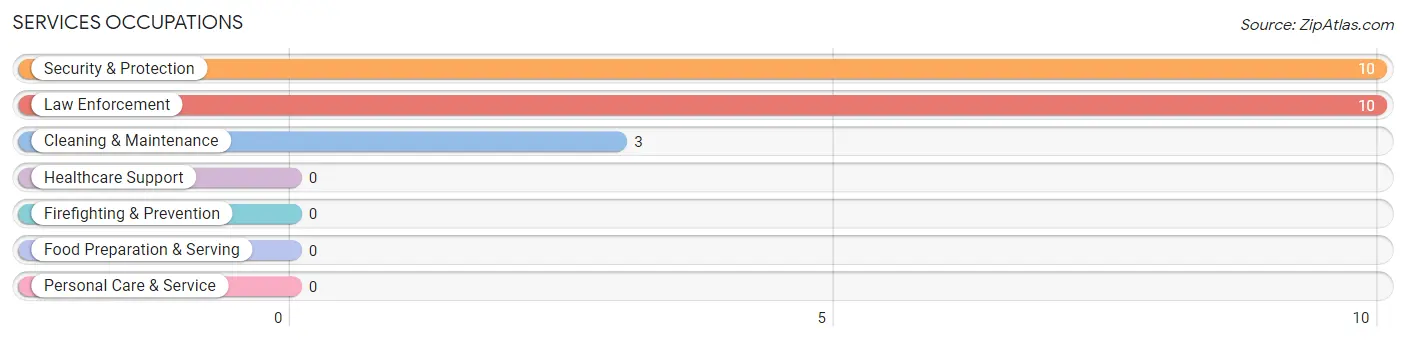
Services Occupations
The most common Services occupations in Jefferson are Security & Protection (10 | 5.7%), Law Enforcement (10 | 5.7%), and Cleaning & Maintenance (3 | 1.7%).
Services Occupations by Sex
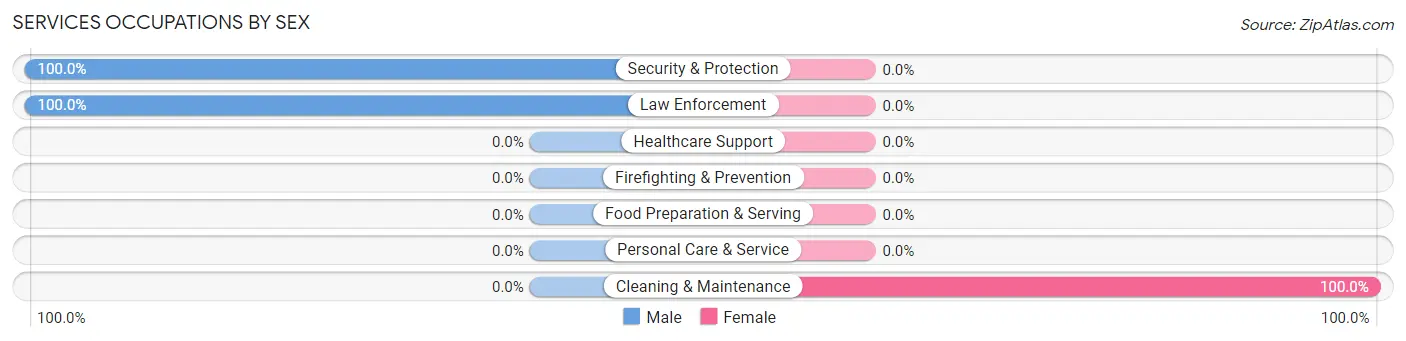
| Occupation | Male | Female |
| Healthcare Support | 0 (0.0%) | 0 (0.0%) |
| Security & Protection | 10 (100.0%) | 0 (0.0%) |
| Firefighting & Prevention | 0 (0.0%) | 0 (0.0%) |
| Law Enforcement | 10 (100.0%) | 0 (0.0%) |
| Food Preparation & Serving | 0 (0.0%) | 0 (0.0%) |
| Cleaning & Maintenance | 0 (0.0%) | 3 (100.0%) |
| Personal Care & Service | 0 (0.0%) | 0 (0.0%) |
| Total (Category) | 10 (76.9%) | 3 (23.1%) |
| Total (Overall) | 149 (84.2%) | 28 (15.8%) |
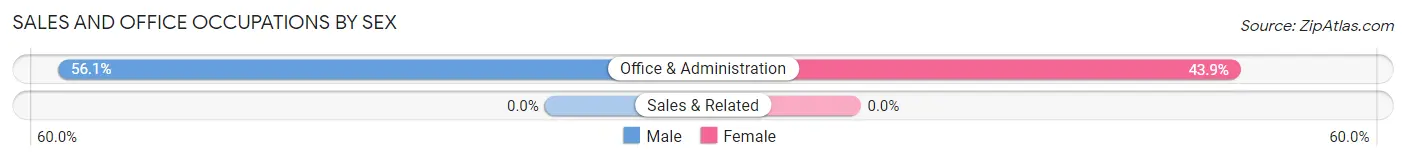
Sales and Office Occupations
The most common Sales and Office occupations in Jefferson are , and Office & Administration (57 | 32.2%).
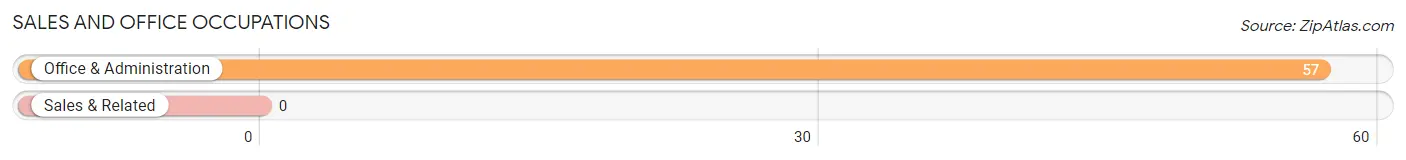
Sales and Office Occupations by Sex
| Occupation | Male | Female |
| Sales & Related | 0 (0.0%) | 0 (0.0%) |
| Office & Administration | 32 (56.1%) | 25 (43.9%) |
| Total (Category) | 32 (56.1%) | 25 (43.9%) |
| Total (Overall) | 149 (84.2%) | 28 (15.8%) |
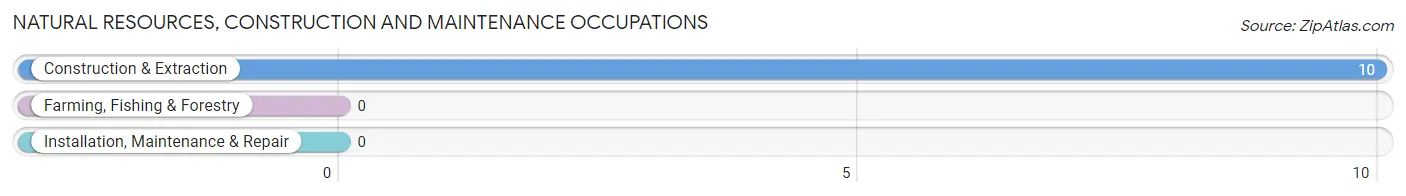
Natural Resources, Construction and Maintenance Occupations
The most common Natural Resources, Construction and Maintenance occupations in Jefferson are , and Construction & Extraction (10 | 5.7%).
Natural Resources, Construction and Maintenance Occupations by Sex
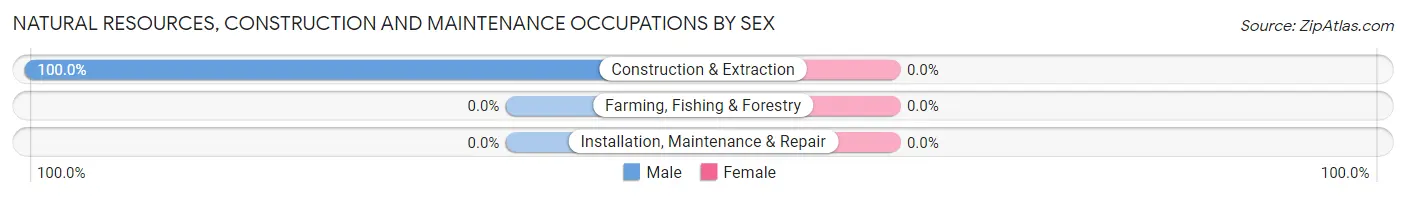
| Occupation | Male | Female |
| Farming, Fishing & Forestry | 0 (0.0%) | 0 (0.0%) |
| Construction & Extraction | 10 (100.0%) | 0 (0.0%) |
| Installation, Maintenance & Repair | 0 (0.0%) | 0 (0.0%) |
| Total (Category) | 10 (100.0%) | 0 (0.0%) |
| Total (Overall) | 149 (84.2%) | 28 (15.8%) |
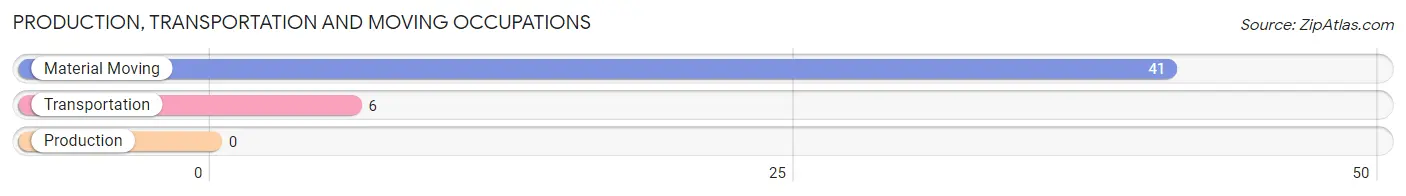
Production, Transportation and Moving Occupations
The most common Production, Transportation and Moving occupations in Jefferson are Material Moving (41 | 23.2%), and Transportation (6 | 3.4%).
Production, Transportation and Moving Occupations by Sex
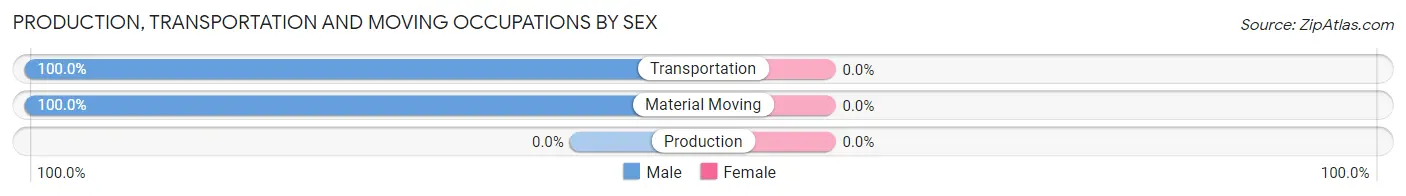
| Occupation | Male | Female |
| Production | 0 (0.0%) | 0 (0.0%) |
| Transportation | 6 (100.0%) | 0 (0.0%) |
| Material Moving | 41 (100.0%) | 0 (0.0%) |
| Total (Category) | 47 (100.0%) | 0 (0.0%) |
| Total (Overall) | 149 (84.2%) | 28 (15.8%) |
Employment Industries by Sex in Jefferson
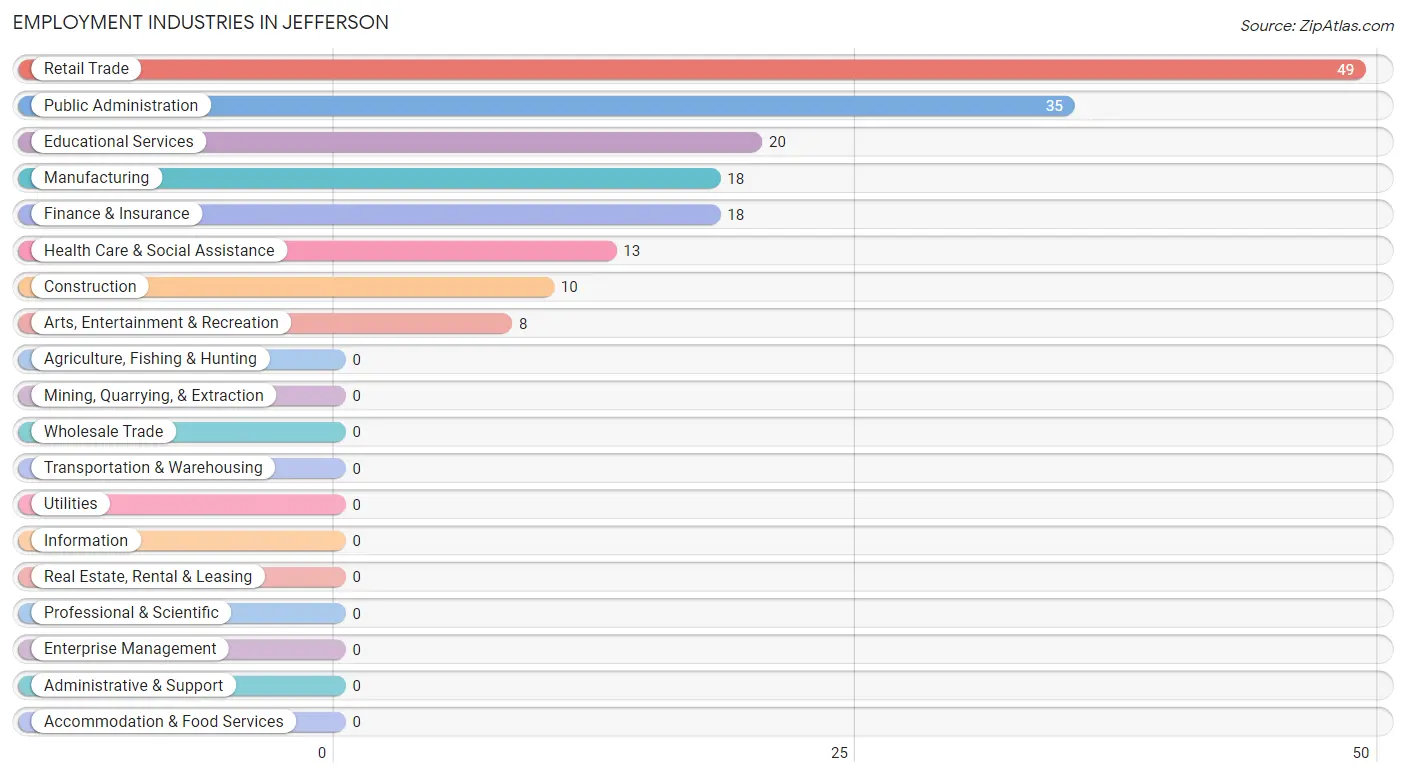
Employment Industries in Jefferson
The major employment industries in Jefferson include Retail Trade (49 | 27.7%), Public Administration (35 | 19.8%), Educational Services (20 | 11.3%), Manufacturing (18 | 10.2%), and Finance & Insurance (18 | 10.2%).
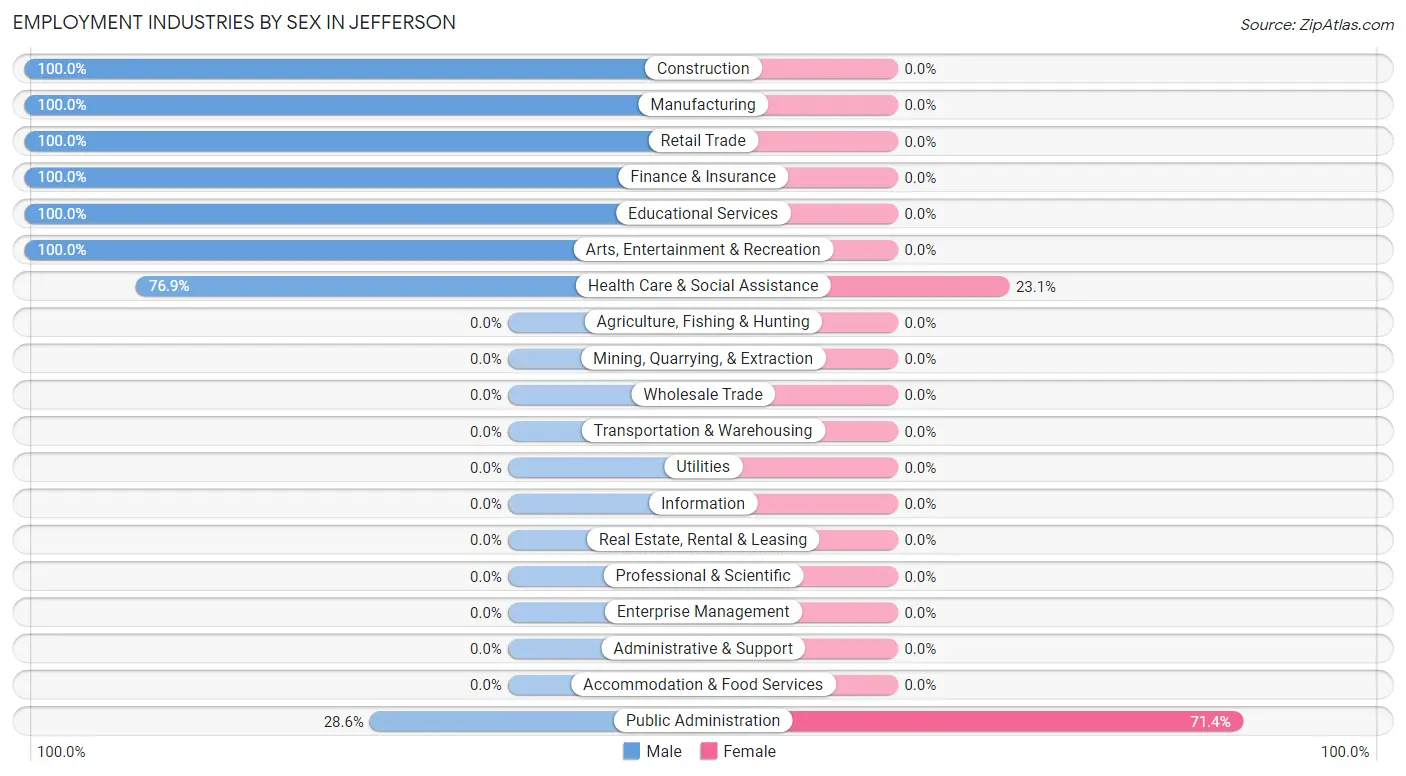
Employment Industries by Sex in Jefferson
The Jefferson industries that see more men than women are Construction (100.0%), Manufacturing (100.0%), and Retail Trade (100.0%), whereas the industries that tend to have a higher number of women are Public Administration (71.4%), and Health Care & Social Assistance (23.1%).
| Industry | Male | Female |
| Agriculture, Fishing & Hunting | 0 (0.0%) | 0 (0.0%) |
| Mining, Quarrying, & Extraction | 0 (0.0%) | 0 (0.0%) |
| Construction | 10 (100.0%) | 0 (0.0%) |
| Manufacturing | 18 (100.0%) | 0 (0.0%) |
| Wholesale Trade | 0 (0.0%) | 0 (0.0%) |
| Retail Trade | 49 (100.0%) | 0 (0.0%) |
| Transportation & Warehousing | 0 (0.0%) | 0 (0.0%) |
| Utilities | 0 (0.0%) | 0 (0.0%) |
| Information | 0 (0.0%) | 0 (0.0%) |
| Finance & Insurance | 18 (100.0%) | 0 (0.0%) |
| Real Estate, Rental & Leasing | 0 (0.0%) | 0 (0.0%) |
| Professional & Scientific | 0 (0.0%) | 0 (0.0%) |
| Enterprise Management | 0 (0.0%) | 0 (0.0%) |
| Administrative & Support | 0 (0.0%) | 0 (0.0%) |
| Educational Services | 20 (100.0%) | 0 (0.0%) |
| Health Care & Social Assistance | 10 (76.9%) | 3 (23.1%) |
| Arts, Entertainment & Recreation | 8 (100.0%) | 0 (0.0%) |
| Accommodation & Food Services | 0 (0.0%) | 0 (0.0%) |
| Public Administration | 10 (28.6%) | 25 (71.4%) |
| Total | 149 (84.2%) | 28 (15.8%) |
Education in Jefferson
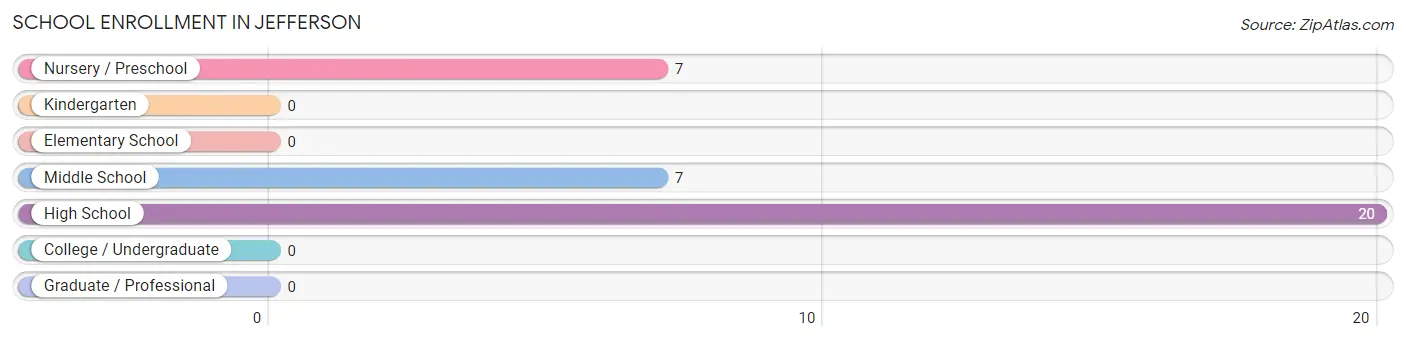
School Enrollment in Jefferson
The most common levels of schooling among the 34 students in Jefferson are high school (20 | 58.8%), nursery / preschool (7 | 20.6%), and middle school (7 | 20.6%).
| School Level | # Students | % Students |
| Nursery / Preschool | 7 | 20.6% |
| Kindergarten | 0 | 0.0% |
| Elementary School | 0 | 0.0% |
| Middle School | 7 | 20.6% |
| High School | 20 | 58.8% |
| College / Undergraduate | 0 | 0.0% |
| Graduate / Professional | 0 | 0.0% |
| Total | 34 | 100.0% |
School Enrollment by Age by Funding Source in Jefferson
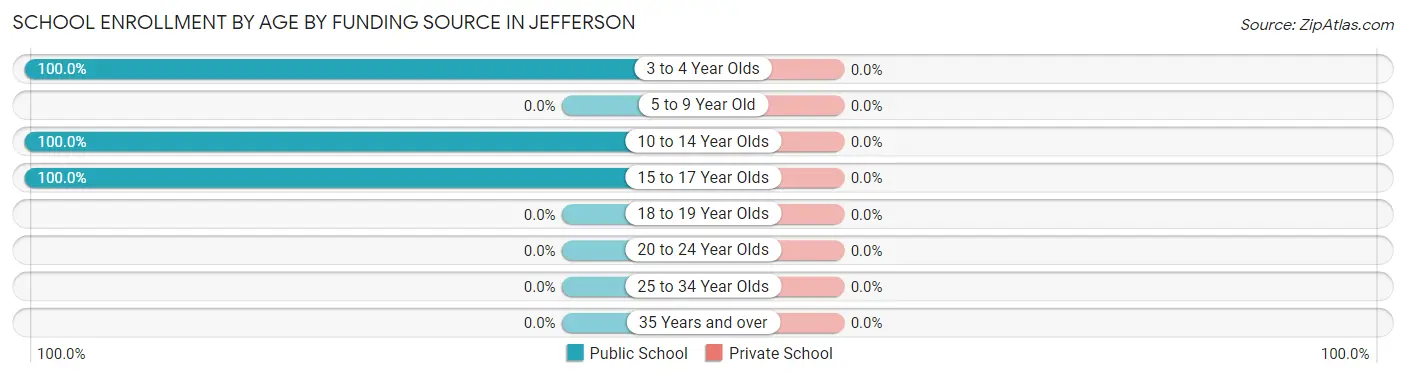
| Age Bracket | Public School | Private School |
| 3 to 4 Year Olds | 7 (100.0%) | 0 (0.0%) |
| 5 to 9 Year Old | 0 (0.0%) | 0 (0.0%) |
| 10 to 14 Year Olds | 19 (100.0%) | 0 (0.0%) |
| 15 to 17 Year Olds | 8 (100.0%) | 0 (0.0%) |
| 18 to 19 Year Olds | 0 (0.0%) | 0 (0.0%) |
| 20 to 24 Year Olds | 0 (0.0%) | 0 (0.0%) |
| 25 to 34 Year Olds | 0 (0.0%) | 0 (0.0%) |
| 35 Years and over | 0 (0.0%) | 0 (0.0%) |
| Total | 34 (100.0%) | 0 (0.0%) |
Educational Attainment by Field of Study in Jefferson
Psychology (10 | 47.6%), arts & humanities (6 | 28.6%), and liberal arts & history (5 | 23.8%) are the most common fields of study among 21 individuals in Jefferson who have obtained a bachelor's degree or higher.
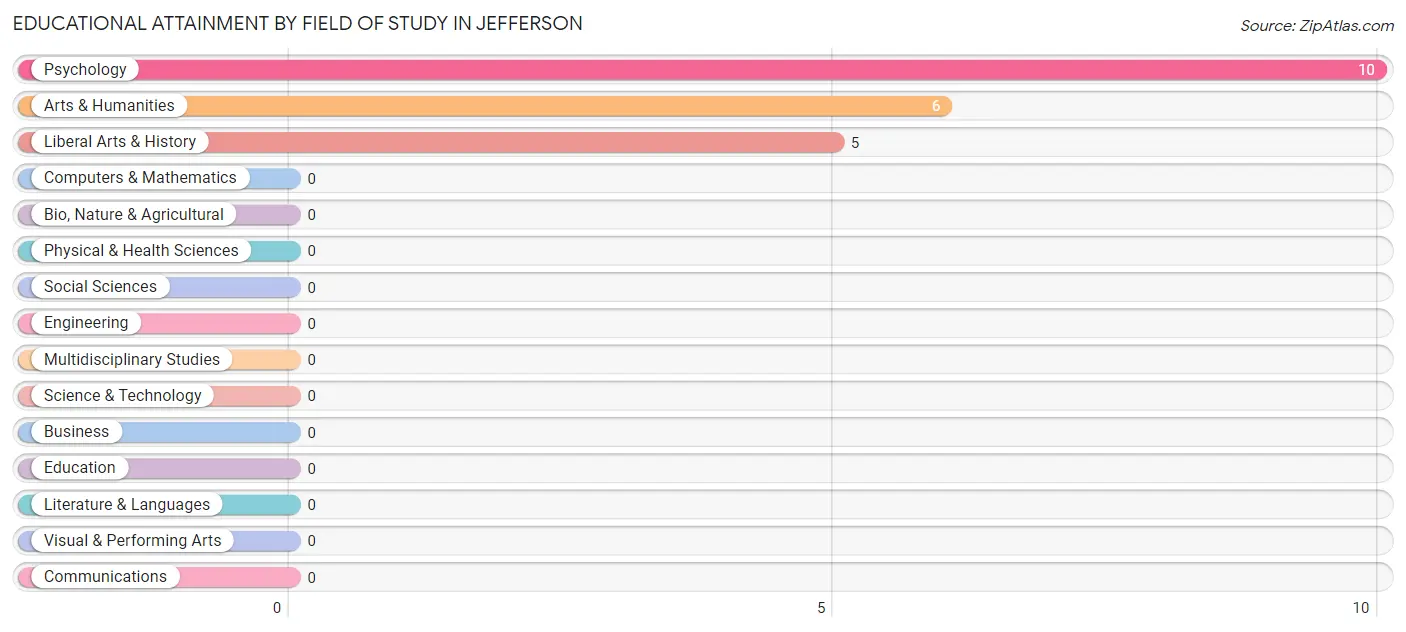
| Field of Study | # Graduates | % Graduates |
| Computers & Mathematics | 0 | 0.0% |
| Bio, Nature & Agricultural | 0 | 0.0% |
| Physical & Health Sciences | 0 | 0.0% |
| Psychology | 10 | 47.6% |
| Social Sciences | 0 | 0.0% |
| Engineering | 0 | 0.0% |
| Multidisciplinary Studies | 0 | 0.0% |
| Science & Technology | 0 | 0.0% |
| Business | 0 | 0.0% |
| Education | 0 | 0.0% |
| Literature & Languages | 0 | 0.0% |
| Liberal Arts & History | 5 | 23.8% |
| Visual & Performing Arts | 0 | 0.0% |
| Communications | 0 | 0.0% |
| Arts & Humanities | 6 | 28.6% |
| Total | 21 | 100.0% |
Transportation & Commute in Jefferson
Vehicle Availability by Sex in Jefferson
The most prevalent vehicle ownership categories in Jefferson are males with 2 vehicles (76, accounting for 51.0%) and females with 2 vehicles (25, making up 304.0%).
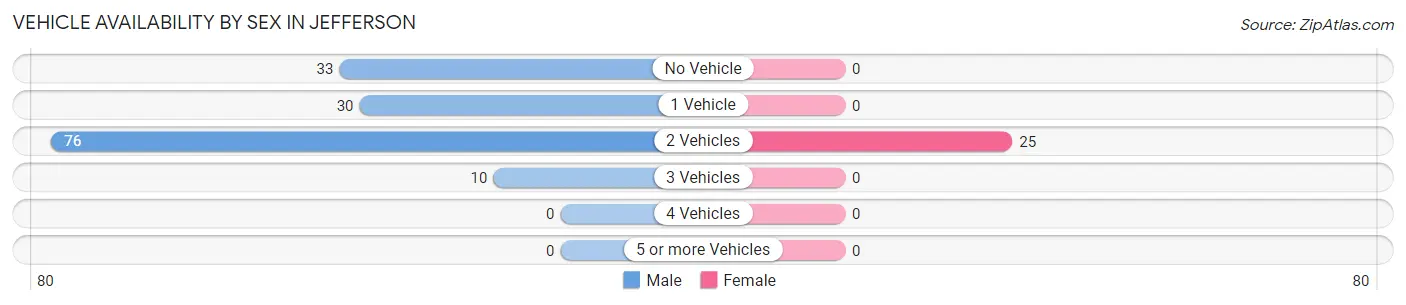
| Vehicles Available | Male | Female |
| No Vehicle | 33 (22.2%) | 0 (0.0%) |
| 1 Vehicle | 30 (20.1%) | 0 (0.0%) |
| 2 Vehicles | 76 (51.0%) | 25 (100.0%) |
| 3 Vehicles | 10 (6.7%) | 0 (0.0%) |
| 4 Vehicles | 0 (0.0%) | 0 (0.0%) |
| 5 or more Vehicles | 0 (0.0%) | 0 (0.0%) |
| Total | 149 (100.0%) | 25 (100.0%) |
Commute Time in Jefferson
The most frequently occuring commute durations in Jefferson are 15 to 19 minutes (50 commuters, 29.2%), 20 to 24 minutes (28 commuters, 16.4%), and 45 to 59 minutes (26 commuters, 15.2%).
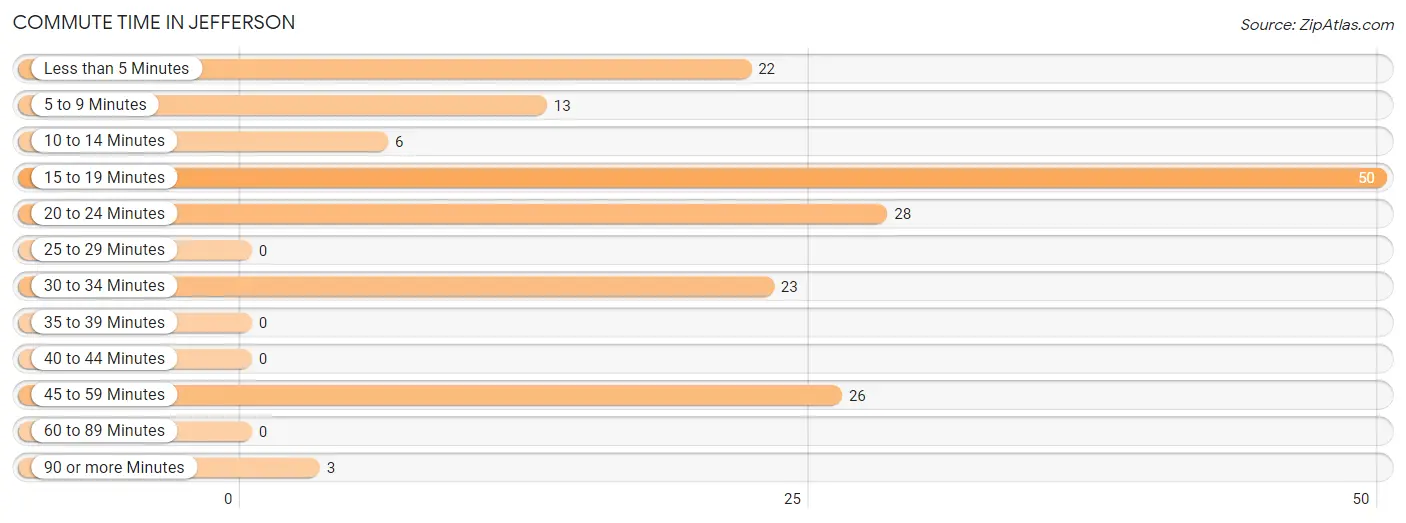
| Commute Time | # Commuters | % Commuters |
| Less than 5 Minutes | 22 | 12.9% |
| 5 to 9 Minutes | 13 | 7.6% |
| 10 to 14 Minutes | 6 | 3.5% |
| 15 to 19 Minutes | 50 | 29.2% |
| 20 to 24 Minutes | 28 | 16.4% |
| 25 to 29 Minutes | 0 | 0.0% |
| 30 to 34 Minutes | 23 | 13.5% |
| 35 to 39 Minutes | 0 | 0.0% |
| 40 to 44 Minutes | 0 | 0.0% |
| 45 to 59 Minutes | 26 | 15.2% |
| 60 to 89 Minutes | 0 | 0.0% |
| 90 or more Minutes | 3 | 1.8% |
Commute Time by Sex in Jefferson
The most common commute times in Jefferson are 15 to 19 minutes (38 commuters, 26.6%) for males and 5 to 9 minutes (13 commuters, 46.4%) for females.
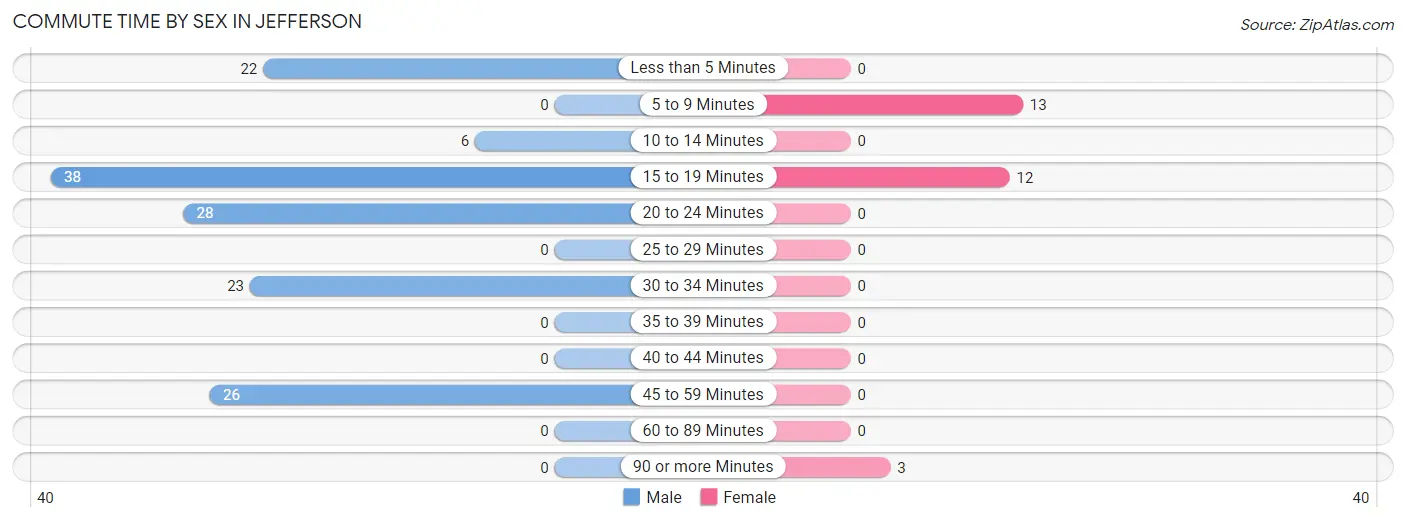
| Commute Time | Male | Female |
| Less than 5 Minutes | 22 (15.4%) | 0 (0.0%) |
| 5 to 9 Minutes | 0 (0.0%) | 13 (46.4%) |
| 10 to 14 Minutes | 6 (4.2%) | 0 (0.0%) |
| 15 to 19 Minutes | 38 (26.6%) | 12 (42.9%) |
| 20 to 24 Minutes | 28 (19.6%) | 0 (0.0%) |
| 25 to 29 Minutes | 0 (0.0%) | 0 (0.0%) |
| 30 to 34 Minutes | 23 (16.1%) | 0 (0.0%) |
| 35 to 39 Minutes | 0 (0.0%) | 0 (0.0%) |
| 40 to 44 Minutes | 0 (0.0%) | 0 (0.0%) |
| 45 to 59 Minutes | 26 (18.2%) | 0 (0.0%) |
| 60 to 89 Minutes | 0 (0.0%) | 0 (0.0%) |
| 90 or more Minutes | 0 (0.0%) | 3 (10.7%) |
Time of Departure to Work by Sex in Jefferson
The most frequent times of departure to work in Jefferson are 7:00 AM to 7:29 AM (36, 25.2%) for males and 7:00 AM to 7:29 AM (15, 53.6%) for females.
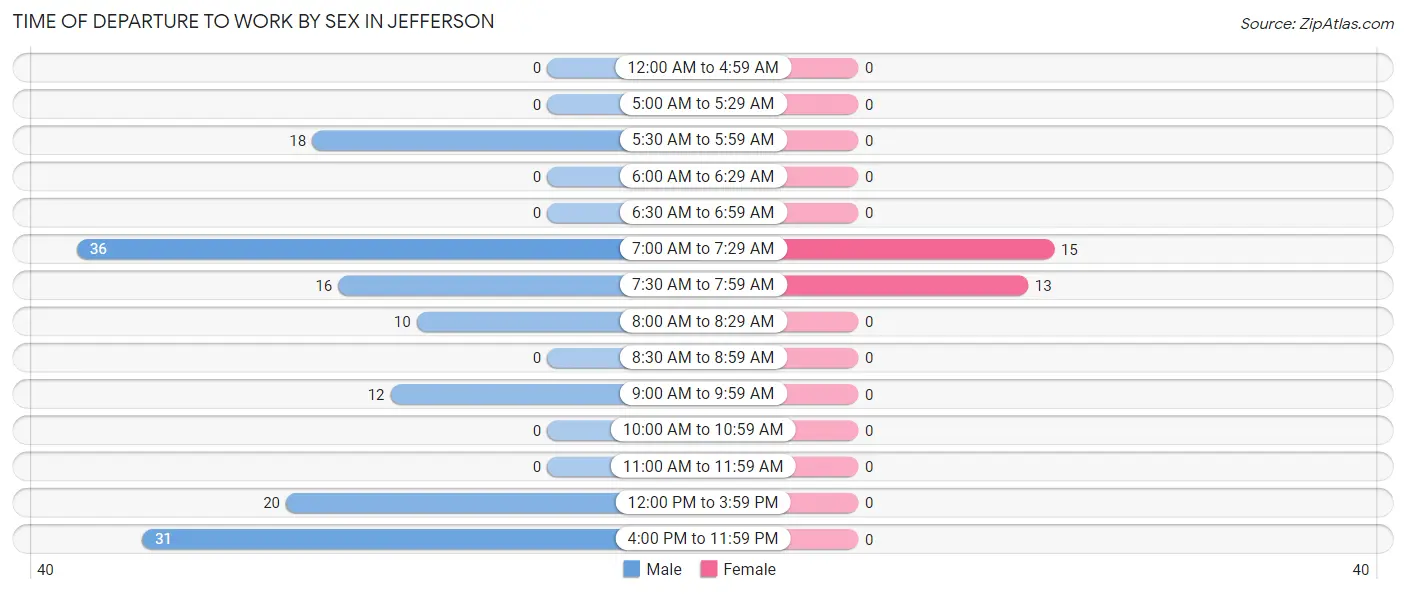
| Time of Departure | Male | Female |
| 12:00 AM to 4:59 AM | 0 (0.0%) | 0 (0.0%) |
| 5:00 AM to 5:29 AM | 0 (0.0%) | 0 (0.0%) |
| 5:30 AM to 5:59 AM | 18 (12.6%) | 0 (0.0%) |
| 6:00 AM to 6:29 AM | 0 (0.0%) | 0 (0.0%) |
| 6:30 AM to 6:59 AM | 0 (0.0%) | 0 (0.0%) |
| 7:00 AM to 7:29 AM | 36 (25.2%) | 15 (53.6%) |
| 7:30 AM to 7:59 AM | 16 (11.2%) | 13 (46.4%) |
| 8:00 AM to 8:29 AM | 10 (7.0%) | 0 (0.0%) |
| 8:30 AM to 8:59 AM | 0 (0.0%) | 0 (0.0%) |
| 9:00 AM to 9:59 AM | 12 (8.4%) | 0 (0.0%) |
| 10:00 AM to 10:59 AM | 0 (0.0%) | 0 (0.0%) |
| 11:00 AM to 11:59 AM | 0 (0.0%) | 0 (0.0%) |
| 12:00 PM to 3:59 PM | 20 (14.0%) | 0 (0.0%) |
| 4:00 PM to 11:59 PM | 31 (21.7%) | 0 (0.0%) |
| Total | 143 (100.0%) | 28 (100.0%) |
Housing Occupancy in Jefferson
Occupancy by Ownership in Jefferson
Of the total 219 dwellings in Jefferson, owner-occupied units account for 85 (38.8%), while renter-occupied units make up 134 (61.2%).
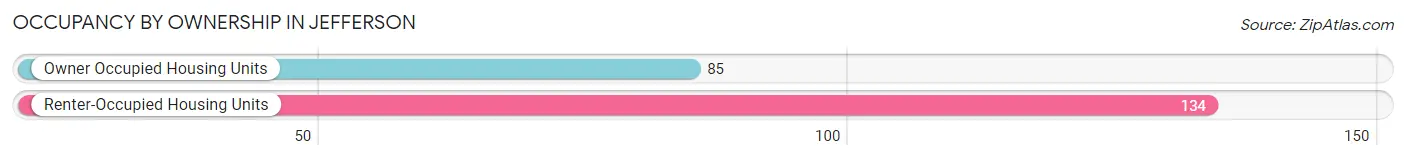
| Occupancy | # Housing Units | % Housing Units |
| Owner Occupied Housing Units | 85 | 38.8% |
| Renter-Occupied Housing Units | 134 | 61.2% |
| Total Occupied Housing Units | 219 | 100.0% |
Occupancy by Household Size in Jefferson
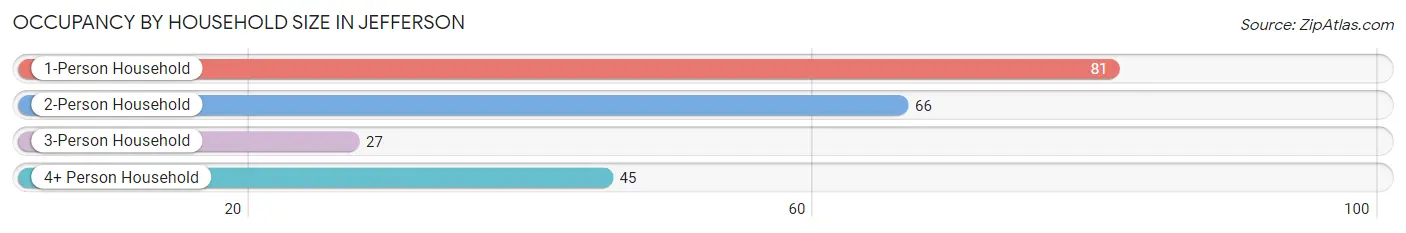
| Household Size | # Housing Units | % Housing Units |
| 1-Person Household | 81 | 37.0% |
| 2-Person Household | 66 | 30.1% |
| 3-Person Household | 27 | 12.3% |
| 4+ Person Household | 45 | 20.5% |
| Total Housing Units | 219 | 100.0% |
Occupancy by Ownership by Household Size in Jefferson
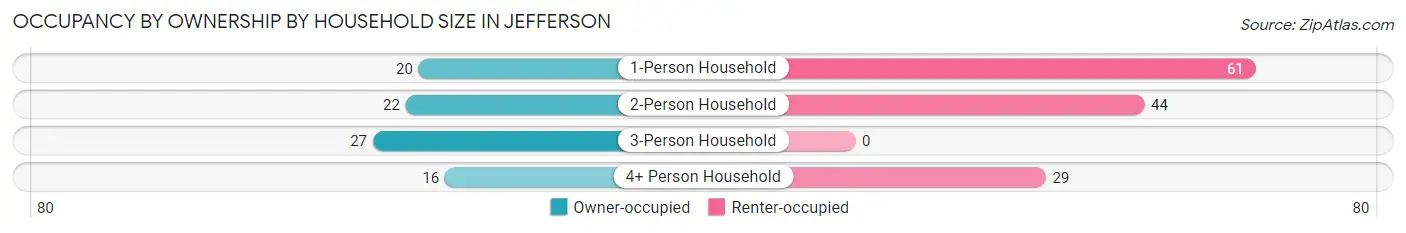
| Household Size | Owner-occupied | Renter-occupied |
| 1-Person Household | 20 (24.7%) | 61 (75.3%) |
| 2-Person Household | 22 (33.3%) | 44 (66.7%) |
| 3-Person Household | 27 (100.0%) | 0 (0.0%) |
| 4+ Person Household | 16 (35.6%) | 29 (64.4%) |
| Total Housing Units | 85 (38.8%) | 134 (61.2%) |
Occupancy by Educational Attainment in Jefferson
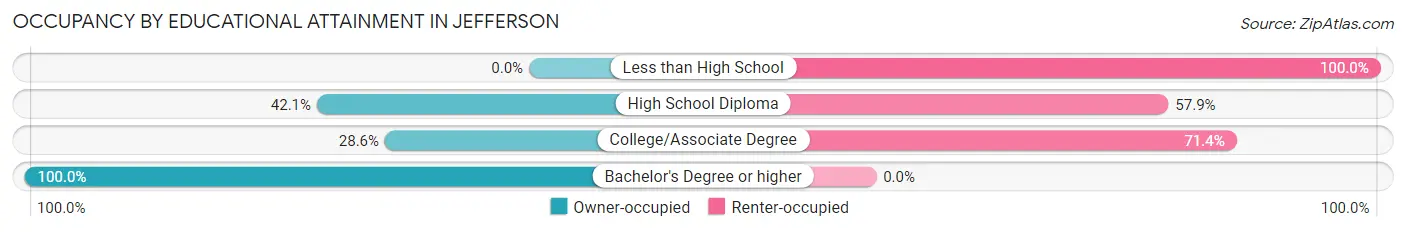
| Household Size | Owner-occupied | Renter-occupied |
| Less than High School | 0 (0.0%) | 6 (100.0%) |
| High School Diploma | 53 (42.1%) | 73 (57.9%) |
| College/Associate Degree | 22 (28.6%) | 55 (71.4%) |
| Bachelor's Degree or higher | 10 (100.0%) | 0 (0.0%) |
Occupancy by Age of Householder in Jefferson
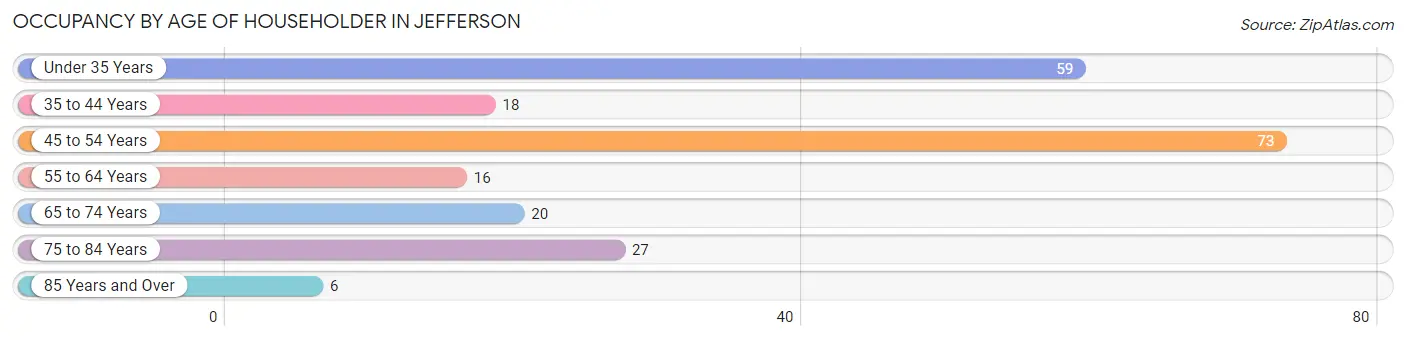
| Age Bracket | # Households | % Households |
| Under 35 Years | 59 | 26.9% |
| 35 to 44 Years | 18 | 8.2% |
| 45 to 54 Years | 73 | 33.3% |
| 55 to 64 Years | 16 | 7.3% |
| 65 to 74 Years | 20 | 9.1% |
| 75 to 84 Years | 27 | 12.3% |
| 85 Years and Over | 6 | 2.7% |
| Total | 219 | 100.0% |
Housing Finances in Jefferson
Median Income by Occupancy in Jefferson
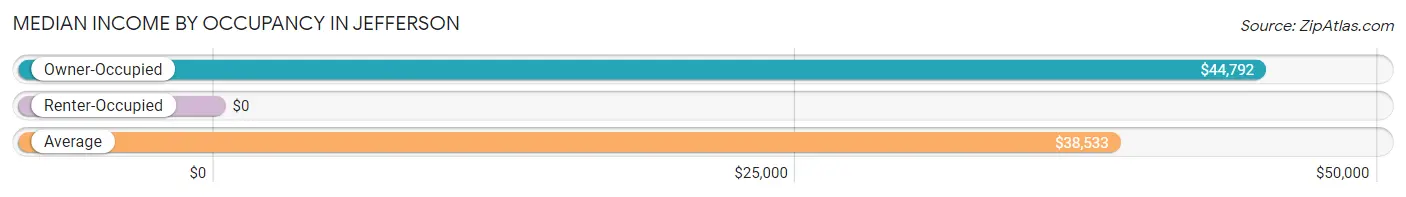
| Occupancy Type | # Households | Median Income |
| Owner-Occupied | 85 (38.8%) | $44,792 |
| Renter-Occupied | 134 (61.2%) | $0 |
| Average | 219 (100.0%) | $38,533 |
Occupancy by Householder Income Bracket in Jefferson
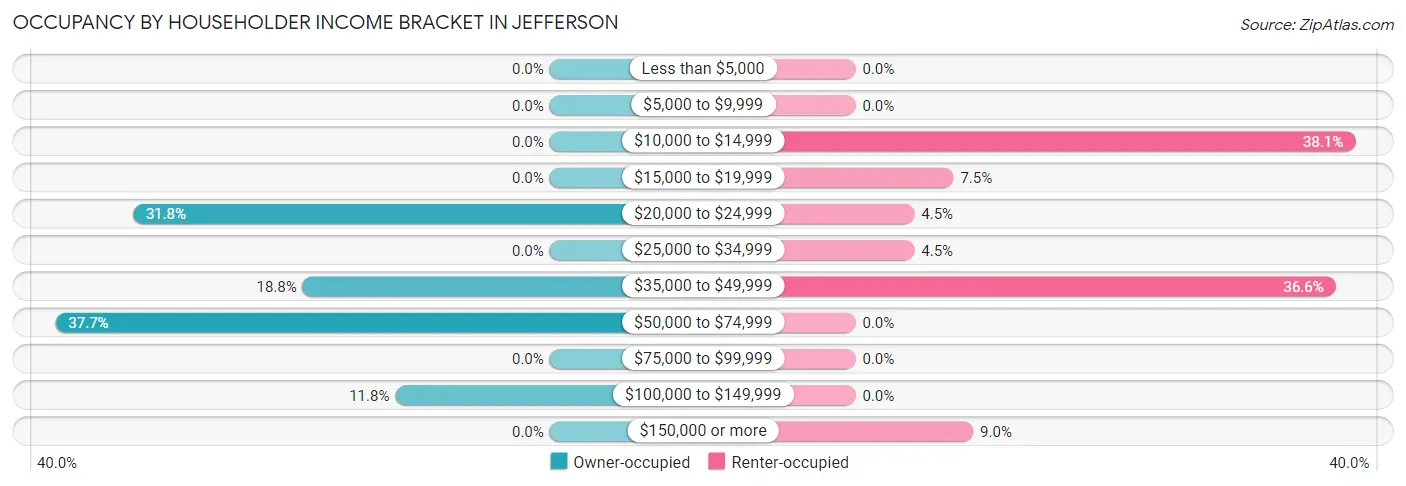
| Income Bracket | Owner-occupied | Renter-occupied |
| Less than $5,000 | 0 (0.0%) | 0 (0.0%) |
| $5,000 to $9,999 | 0 (0.0%) | 0 (0.0%) |
| $10,000 to $14,999 | 0 (0.0%) | 51 (38.1%) |
| $15,000 to $19,999 | 0 (0.0%) | 10 (7.5%) |
| $20,000 to $24,999 | 27 (31.8%) | 6 (4.5%) |
| $25,000 to $34,999 | 0 (0.0%) | 6 (4.5%) |
| $35,000 to $49,999 | 16 (18.8%) | 49 (36.6%) |
| $50,000 to $74,999 | 32 (37.7%) | 0 (0.0%) |
| $75,000 to $99,999 | 0 (0.0%) | 0 (0.0%) |
| $100,000 to $149,999 | 10 (11.8%) | 0 (0.0%) |
| $150,000 or more | 0 (0.0%) | 12 (9.0%) |
| Total | 85 (100.0%) | 134 (100.0%) |
Monthly Housing Cost Tiers in Jefferson
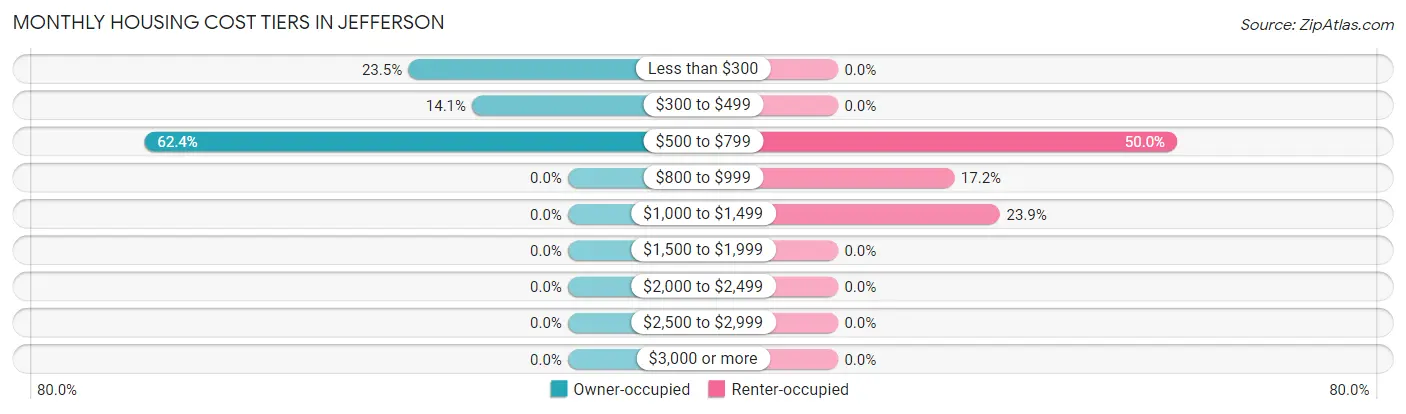
| Monthly Cost | Owner-occupied | Renter-occupied |
| Less than $300 | 20 (23.5%) | 0 (0.0%) |
| $300 to $499 | 12 (14.1%) | 0 (0.0%) |
| $500 to $799 | 53 (62.4%) | 67 (50.0%) |
| $800 to $999 | 0 (0.0%) | 23 (17.2%) |
| $1,000 to $1,499 | 0 (0.0%) | 32 (23.9%) |
| $1,500 to $1,999 | 0 (0.0%) | 0 (0.0%) |
| $2,000 to $2,499 | 0 (0.0%) | 0 (0.0%) |
| $2,500 to $2,999 | 0 (0.0%) | 0 (0.0%) |
| $3,000 or more | 0 (0.0%) | 0 (0.0%) |
| Total | 85 (100.0%) | 134 (100.0%) |
Physical Housing Characteristics in Jefferson
Housing Structures in Jefferson
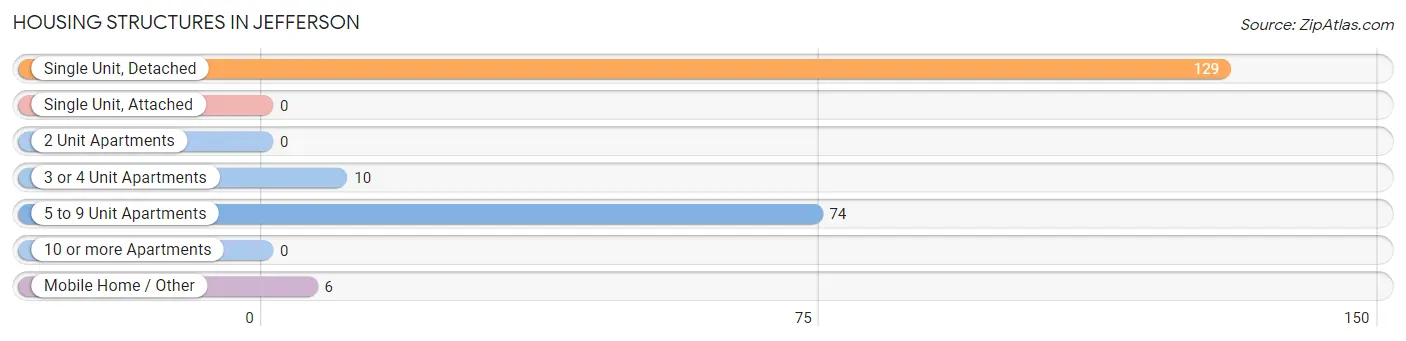
| Structure Type | # Housing Units | % Housing Units |
| Single Unit, Detached | 129 | 58.9% |
| Single Unit, Attached | 0 | 0.0% |
| 2 Unit Apartments | 0 | 0.0% |
| 3 or 4 Unit Apartments | 10 | 4.6% |
| 5 to 9 Unit Apartments | 74 | 33.8% |
| 10 or more Apartments | 0 | 0.0% |
| Mobile Home / Other | 6 | 2.7% |
| Total | 219 | 100.0% |
Housing Structures by Occupancy in Jefferson
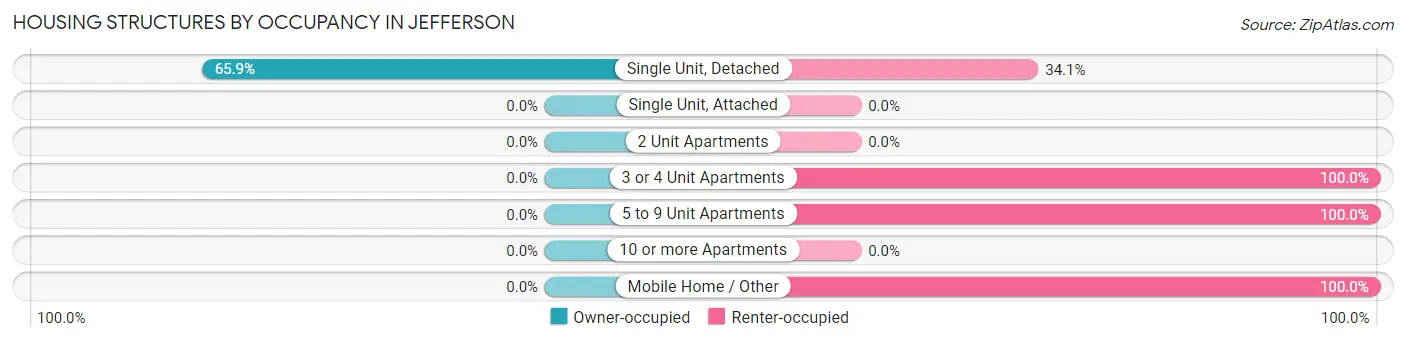
| Structure Type | Owner-occupied | Renter-occupied |
| Single Unit, Detached | 85 (65.9%) | 44 (34.1%) |
| Single Unit, Attached | 0 (0.0%) | 0 (0.0%) |
| 2 Unit Apartments | 0 (0.0%) | 0 (0.0%) |
| 3 or 4 Unit Apartments | 0 (0.0%) | 10 (100.0%) |
| 5 to 9 Unit Apartments | 0 (0.0%) | 74 (100.0%) |
| 10 or more Apartments | 0 (0.0%) | 0 (0.0%) |
| Mobile Home / Other | 0 (0.0%) | 6 (100.0%) |
| Total | 85 (38.8%) | 134 (61.2%) |
Housing Structures by Number of Rooms in Jefferson
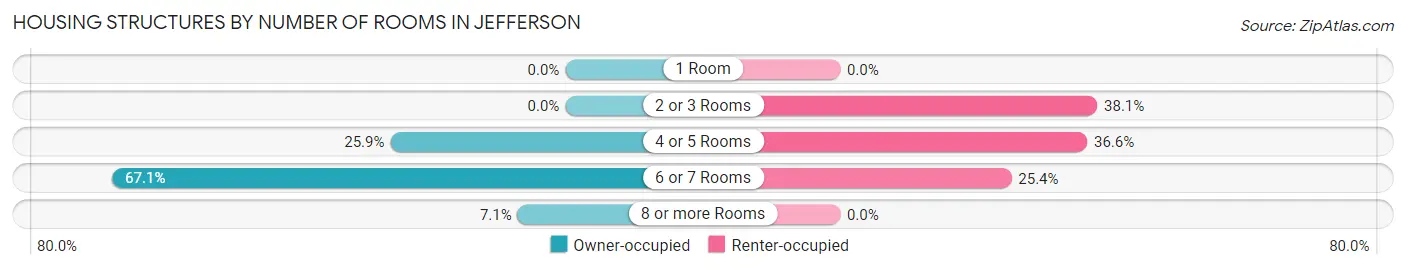
| Number of Rooms | Owner-occupied | Renter-occupied |
| 1 Room | 0 (0.0%) | 0 (0.0%) |
| 2 or 3 Rooms | 0 (0.0%) | 51 (38.1%) |
| 4 or 5 Rooms | 22 (25.9%) | 49 (36.6%) |
| 6 or 7 Rooms | 57 (67.1%) | 34 (25.4%) |
| 8 or more Rooms | 6 (7.1%) | 0 (0.0%) |
| Total | 85 (100.0%) | 134 (100.0%) |
Housing Structure by Heating Type in Jefferson
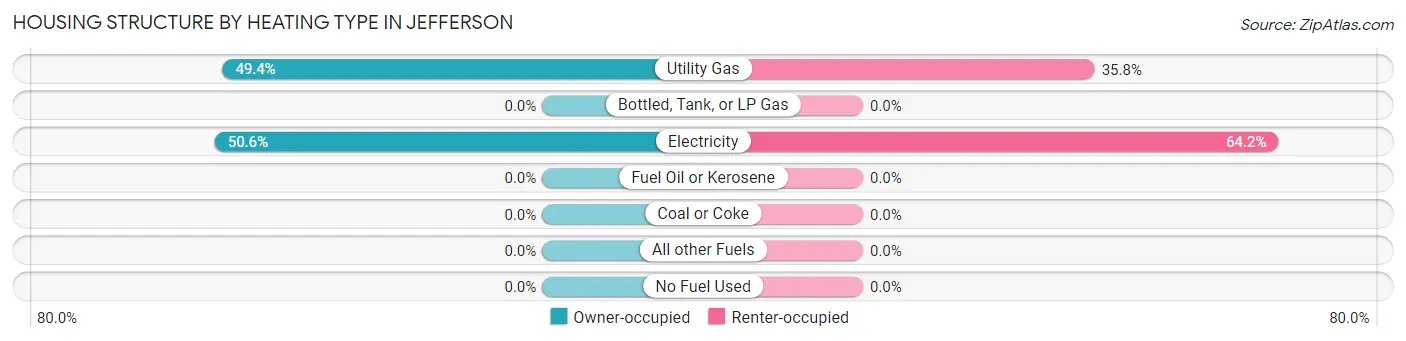
| Heating Type | Owner-occupied | Renter-occupied |
| Utility Gas | 42 (49.4%) | 48 (35.8%) |
| Bottled, Tank, or LP Gas | 0 (0.0%) | 0 (0.0%) |
| Electricity | 43 (50.6%) | 86 (64.2%) |
| Fuel Oil or Kerosene | 0 (0.0%) | 0 (0.0%) |
| Coal or Coke | 0 (0.0%) | 0 (0.0%) |
| All other Fuels | 0 (0.0%) | 0 (0.0%) |
| No Fuel Used | 0 (0.0%) | 0 (0.0%) |
| Total | 85 (100.0%) | 134 (100.0%) |
Household Vehicle Usage in Jefferson
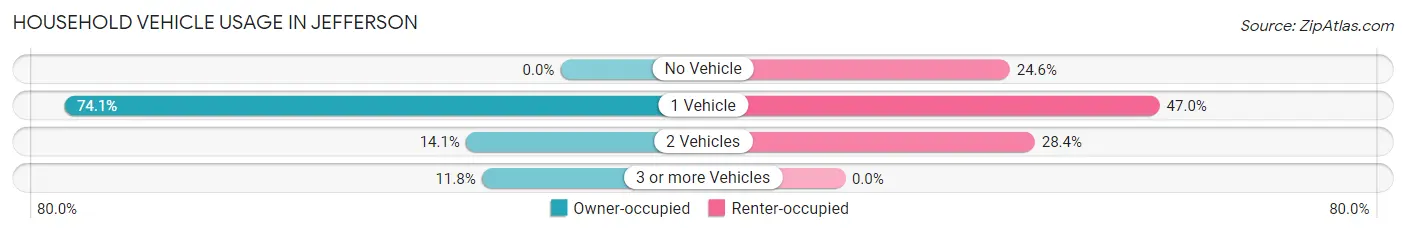
| Vehicles per Household | Owner-occupied | Renter-occupied |
| No Vehicle | 0 (0.0%) | 33 (24.6%) |
| 1 Vehicle | 63 (74.1%) | 63 (47.0%) |
| 2 Vehicles | 12 (14.1%) | 38 (28.4%) |
| 3 or more Vehicles | 10 (11.8%) | 0 (0.0%) |
| Total | 85 (100.0%) | 134 (100.0%) |
Real Estate & Mortgages in Jefferson
Real Estate and Mortgage Overview in Jefferson
| Characteristic | Without Mortgage | With Mortgage |
| Housing Units | 69 | 16 |
| Median Property Value | $92,500 | $0 |
| Median Household Income | $56,875 | $0 |
| Monthly Housing Costs | $525 | $0 |
| Real Estate Taxes | $614 | $0 |
Property Value by Mortgage Status in Jefferson
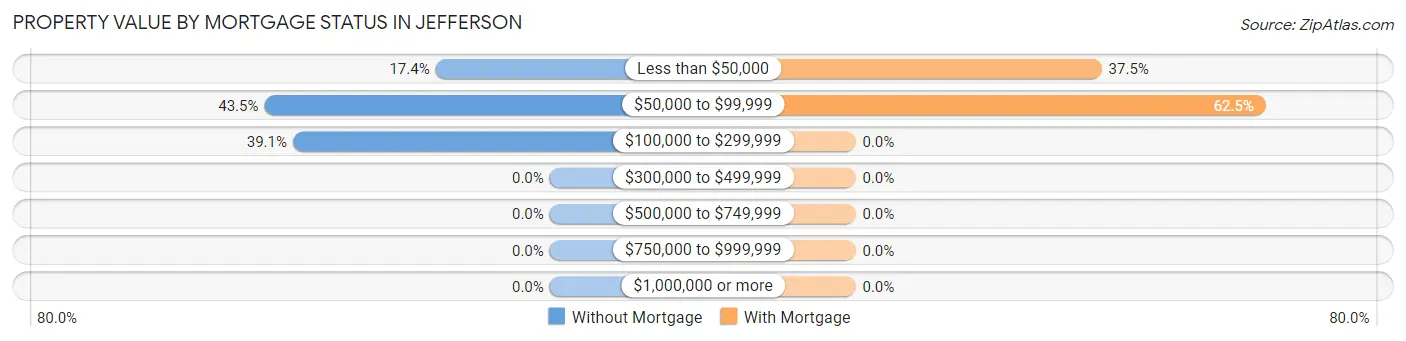
| Property Value | Without Mortgage | With Mortgage |
| Less than $50,000 | 12 (17.4%) | 6 (37.5%) |
| $50,000 to $99,999 | 30 (43.5%) | 10 (62.5%) |
| $100,000 to $299,999 | 27 (39.1%) | 0 (0.0%) |
| $300,000 to $499,999 | 0 (0.0%) | 0 (0.0%) |
| $500,000 to $749,999 | 0 (0.0%) | 0 (0.0%) |
| $750,000 to $999,999 | 0 (0.0%) | 0 (0.0%) |
| $1,000,000 or more | 0 (0.0%) | 0 (0.0%) |
| Total | 69 (100.0%) | 16 (100.0%) |
Household Income by Mortgage Status in Jefferson
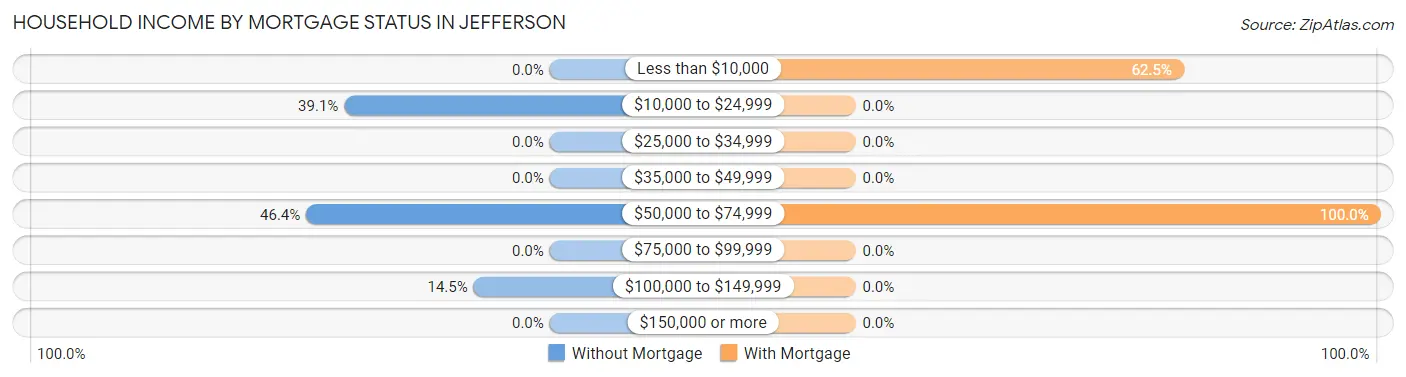
| Household Income | Without Mortgage | With Mortgage |
| Less than $10,000 | 0 (0.0%) | 10 (62.5%) |
| $10,000 to $24,999 | 27 (39.1%) | 0 (0.0%) |
| $25,000 to $34,999 | 0 (0.0%) | 0 (0.0%) |
| $35,000 to $49,999 | 0 (0.0%) | 0 (0.0%) |
| $50,000 to $74,999 | 32 (46.4%) | 16 (100.0%) |
| $75,000 to $99,999 | 0 (0.0%) | 0 (0.0%) |
| $100,000 to $149,999 | 10 (14.5%) | 0 (0.0%) |
| $150,000 or more | 0 (0.0%) | 0 (0.0%) |
| Total | 69 (100.0%) | 16 (100.0%) |
Property Value to Household Income Ratio in Jefferson
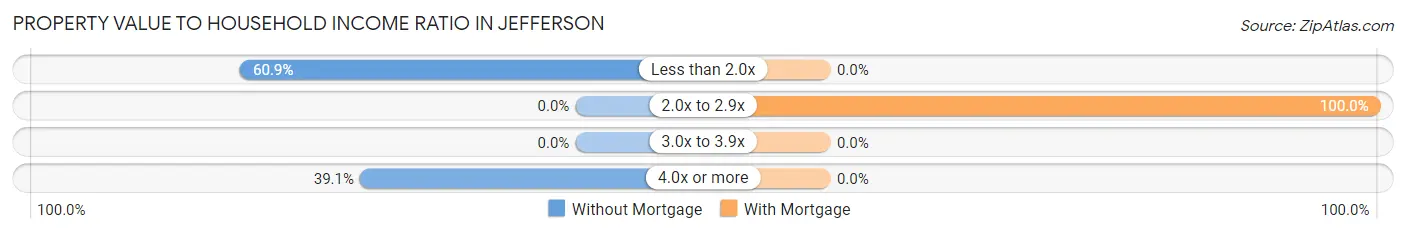
| Value-to-Income Ratio | Without Mortgage | With Mortgage |
| Less than 2.0x | 42 (60.9%) | 0 (0.0%) |
| 2.0x to 2.9x | 0 (0.0%) | 16 (100.0%) |
| 3.0x to 3.9x | 0 (0.0%) | 0 (0.0%) |
| 4.0x or more | 27 (39.1%) | 0 (0.0%) |
| Total | 69 (100.0%) | 16 (100.0%) |
Real Estate Taxes by Mortgage Status in Jefferson
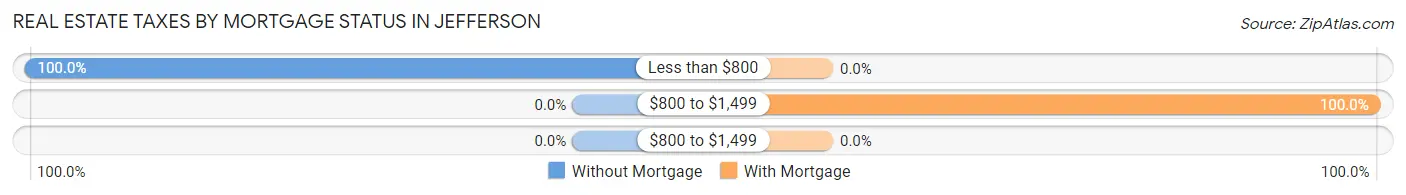
| Property Taxes | Without Mortgage | With Mortgage |
| Less than $800 | 69 (100.0%) | 0 (0.0%) |
| $800 to $1,499 | 0 (0.0%) | 16 (100.0%) |
| $800 to $1,499 | 0 (0.0%) | 0 (0.0%) |
| Total | 69 (100.0%) | 16 (100.0%) |
Health & Disability in Jefferson
Health Insurance Coverage by Age in Jefferson
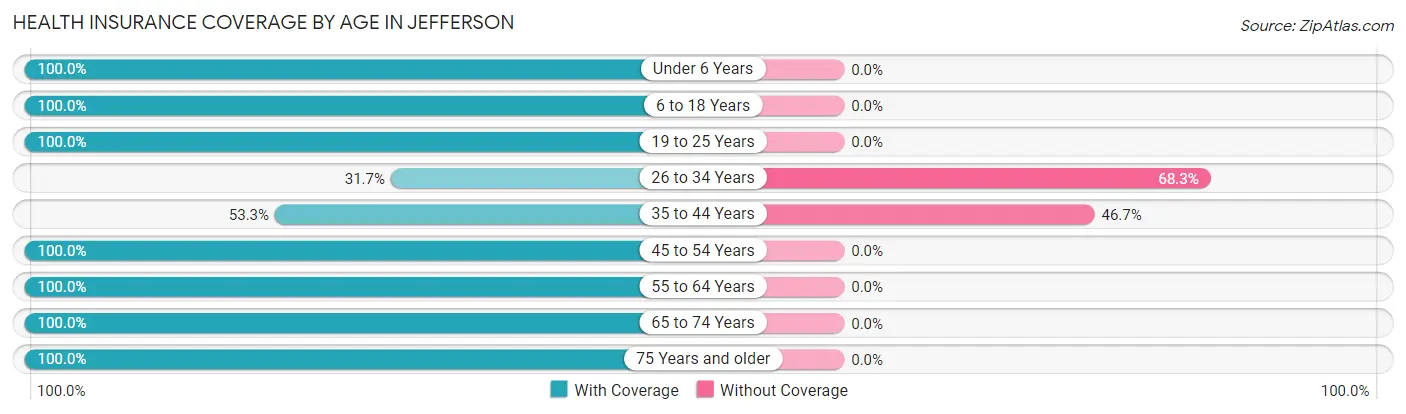
| Age Bracket | With Coverage | Without Coverage |
| Under 6 Years | 64 (100.0%) | 0 (0.0%) |
| 6 to 18 Years | 40 (100.0%) | 0 (0.0%) |
| 19 to 25 Years | 78 (100.0%) | 0 (0.0%) |
| 26 to 34 Years | 13 (31.7%) | 28 (68.3%) |
| 35 to 44 Years | 40 (53.3%) | 35 (46.7%) |
| 45 to 54 Years | 73 (100.0%) | 0 (0.0%) |
| 55 to 64 Years | 92 (100.0%) | 0 (0.0%) |
| 65 to 74 Years | 28 (100.0%) | 0 (0.0%) |
| 75 Years and older | 38 (100.0%) | 0 (0.0%) |
| Total | 466 (88.1%) | 63 (11.9%) |
Health Insurance Coverage by Citizenship Status in Jefferson
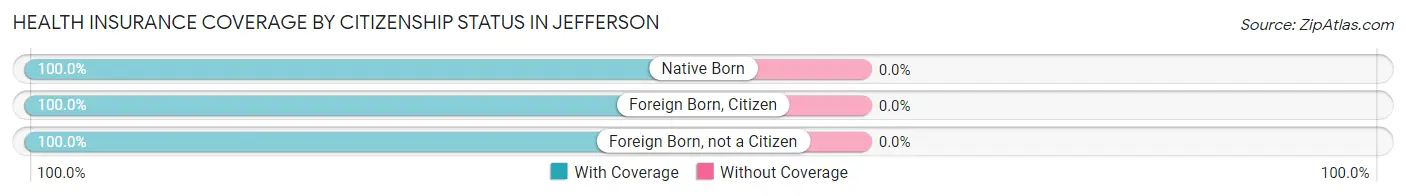
| Citizenship Status | With Coverage | Without Coverage |
| Native Born | 64 (100.0%) | 0 (0.0%) |
| Foreign Born, Citizen | 40 (100.0%) | 0 (0.0%) |
| Foreign Born, not a Citizen | 78 (100.0%) | 0 (0.0%) |
Health Insurance Coverage by Household Income in Jefferson
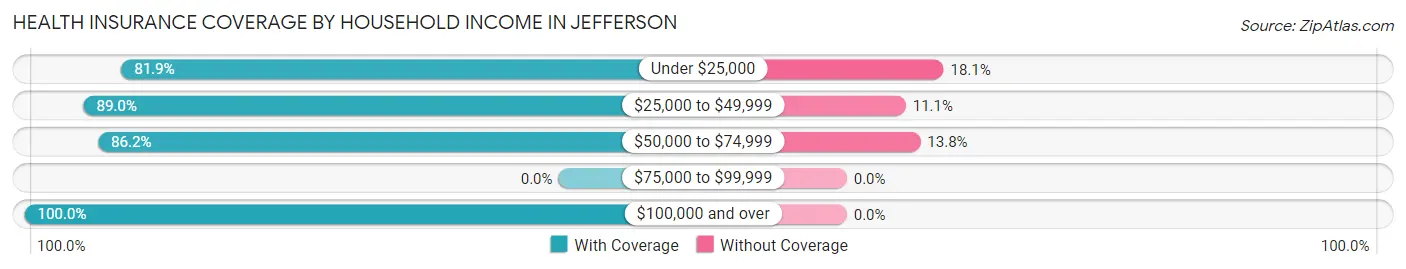
| Household Income | With Coverage | Without Coverage |
| Under $25,000 | 158 (81.9%) | 35 (18.1%) |
| $25,000 to $49,999 | 161 (88.9%) | 20 (11.1%) |
| $50,000 to $74,999 | 50 (86.2%) | 8 (13.8%) |
| $75,000 to $99,999 | 0 (0.0%) | 0 (0.0%) |
| $100,000 and over | 69 (100.0%) | 0 (0.0%) |
Public vs Private Health Insurance Coverage by Age in Jefferson
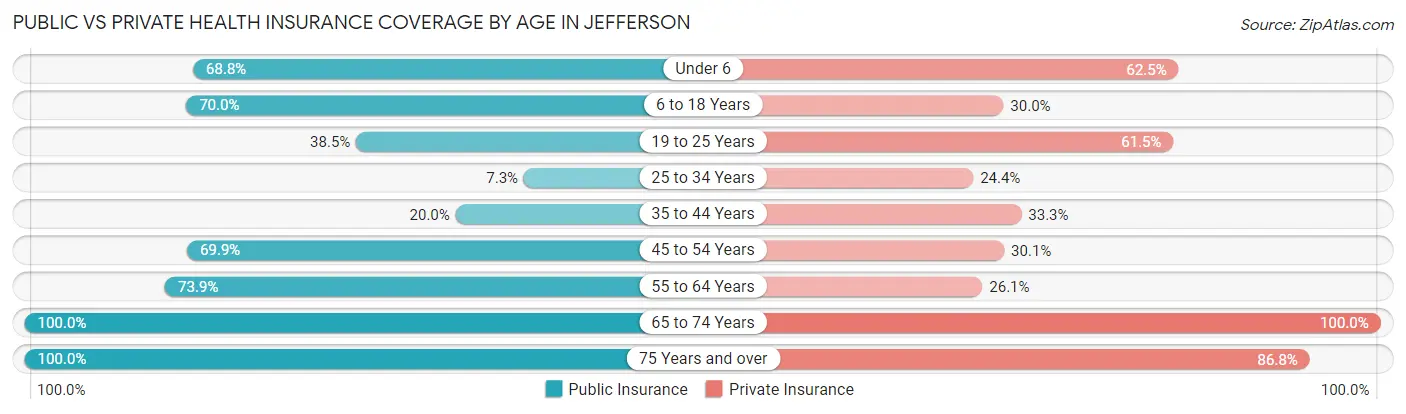
| Age Bracket | Public Insurance | Private Insurance |
| Under 6 | 44 (68.8%) | 40 (62.5%) |
| 6 to 18 Years | 28 (70.0%) | 12 (30.0%) |
| 19 to 25 Years | 30 (38.5%) | 48 (61.5%) |
| 25 to 34 Years | 3 (7.3%) | 10 (24.4%) |
| 35 to 44 Years | 15 (20.0%) | 25 (33.3%) |
| 45 to 54 Years | 51 (69.9%) | 22 (30.1%) |
| 55 to 64 Years | 68 (73.9%) | 24 (26.1%) |
| 65 to 74 Years | 28 (100.0%) | 28 (100.0%) |
| 75 Years and over | 38 (100.0%) | 33 (86.8%) |
| Total | 305 (57.7%) | 242 (45.8%) |
Disability Status by Sex by Age in Jefferson
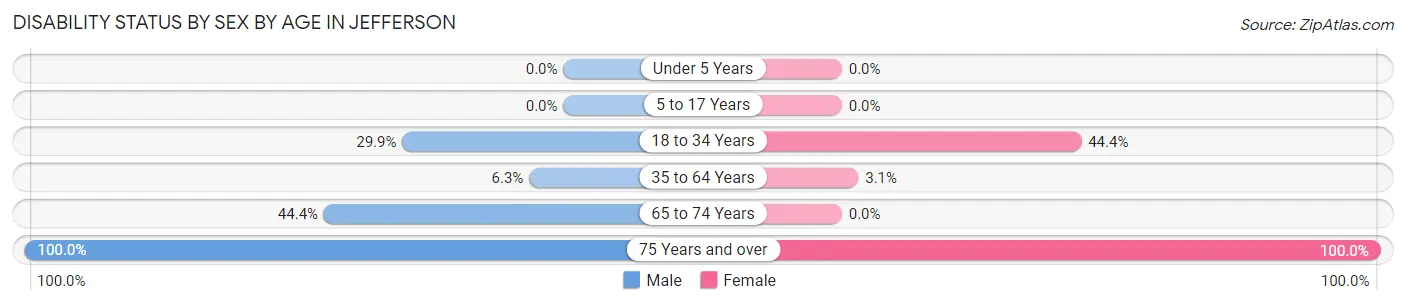
| Age Bracket | Male | Female |
| Under 5 Years | 0 (0.0%) | 0 (0.0%) |
| 5 to 17 Years | 0 (0.0%) | 0 (0.0%) |
| 18 to 34 Years | 26 (29.9%) | 20 (44.4%) |
| 35 to 64 Years | 9 (6.3%) | 3 (3.1%) |
| 65 to 74 Years | 8 (44.4%) | 0 (0.0%) |
| 75 Years and over | 6 (100.0%) | 32 (100.0%) |
Disability Class by Sex by Age in Jefferson
Disability Class: Hearing Difficulty
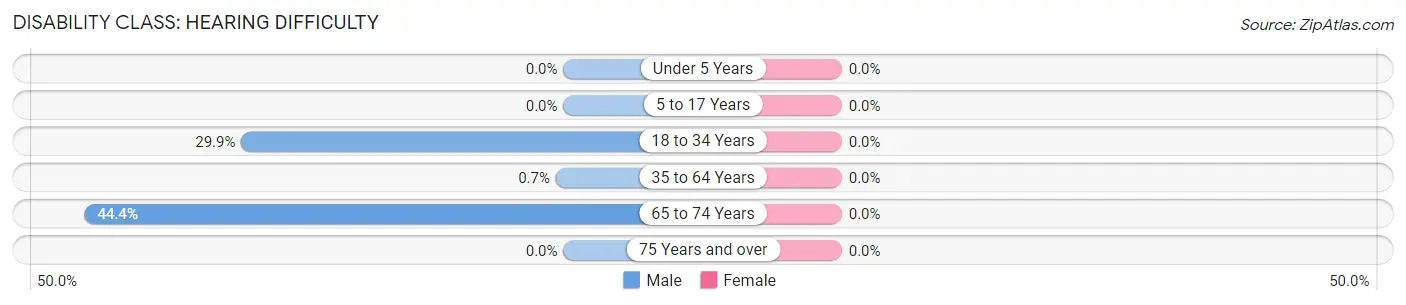
| Age Bracket | Male | Female |
| Under 5 Years | 0 (0.0%) | 0 (0.0%) |
| 5 to 17 Years | 0 (0.0%) | 0 (0.0%) |
| 18 to 34 Years | 26 (29.9%) | 0 (0.0%) |
| 35 to 64 Years | 1 (0.7%) | 0 (0.0%) |
| 65 to 74 Years | 8 (44.4%) | 0 (0.0%) |
| 75 Years and over | 0 (0.0%) | 0 (0.0%) |
Disability Class: Vision Difficulty
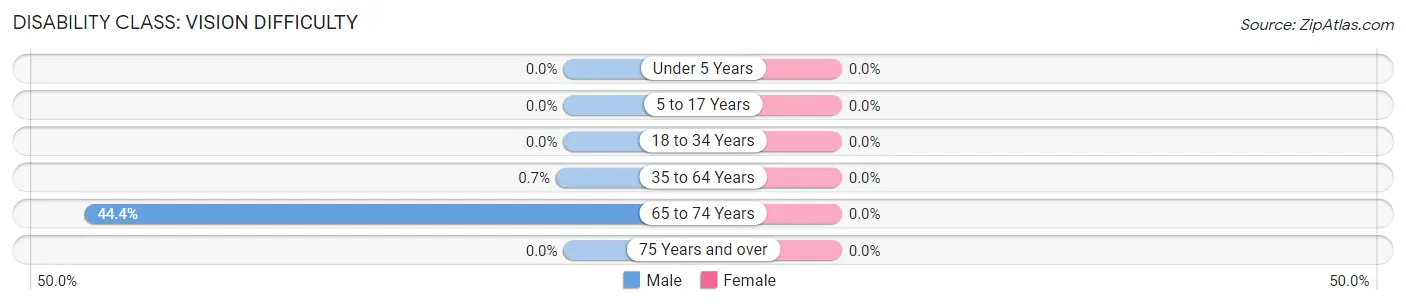
| Age Bracket | Male | Female |
| Under 5 Years | 0 (0.0%) | 0 (0.0%) |
| 5 to 17 Years | 0 (0.0%) | 0 (0.0%) |
| 18 to 34 Years | 0 (0.0%) | 0 (0.0%) |
| 35 to 64 Years | 1 (0.7%) | 0 (0.0%) |
| 65 to 74 Years | 8 (44.4%) | 0 (0.0%) |
| 75 Years and over | 0 (0.0%) | 0 (0.0%) |
Disability Class: Cognitive Difficulty
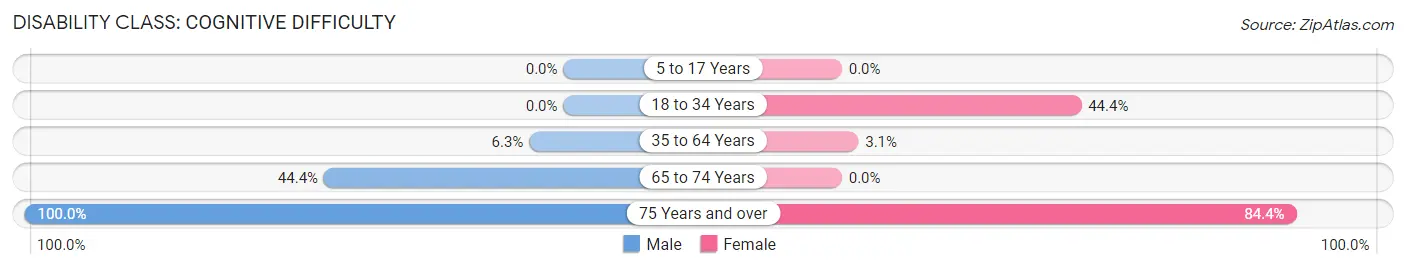
| Age Bracket | Male | Female |
| 5 to 17 Years | 0 (0.0%) | 0 (0.0%) |
| 18 to 34 Years | 0 (0.0%) | 20 (44.4%) |
| 35 to 64 Years | 9 (6.3%) | 3 (3.1%) |
| 65 to 74 Years | 8 (44.4%) | 0 (0.0%) |
| 75 Years and over | 6 (100.0%) | 27 (84.4%) |
Disability Class: Ambulatory Difficulty
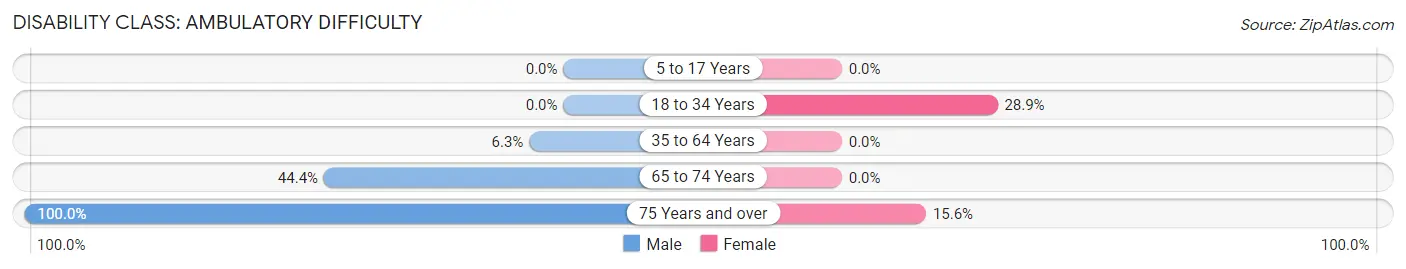
| Age Bracket | Male | Female |
| 5 to 17 Years | 0 (0.0%) | 0 (0.0%) |
| 18 to 34 Years | 0 (0.0%) | 13 (28.9%) |
| 35 to 64 Years | 9 (6.3%) | 0 (0.0%) |
| 65 to 74 Years | 8 (44.4%) | 0 (0.0%) |
| 75 Years and over | 6 (100.0%) | 5 (15.6%) |
Disability Class: Self-Care Difficulty
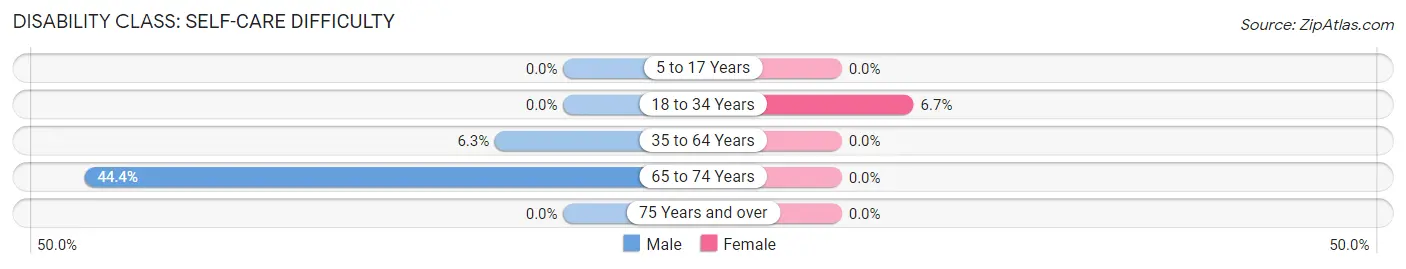
| Age Bracket | Male | Female |
| 5 to 17 Years | 0 (0.0%) | 0 (0.0%) |
| 18 to 34 Years | 0 (0.0%) | 3 (6.7%) |
| 35 to 64 Years | 9 (6.3%) | 0 (0.0%) |
| 65 to 74 Years | 8 (44.4%) | 0 (0.0%) |
| 75 Years and over | 0 (0.0%) | 0 (0.0%) |
Technology Access in Jefferson
Computing Device Access in Jefferson
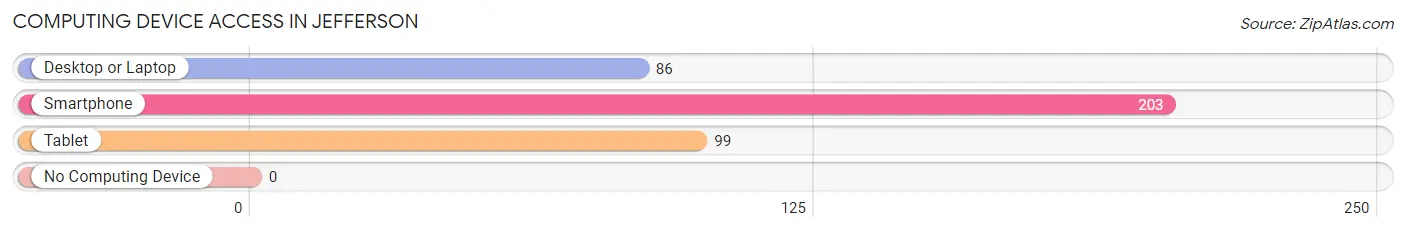
| Device Type | # Households | % Households |
| Desktop or Laptop | 86 | 39.3% |
| Smartphone | 203 | 92.7% |
| Tablet | 99 | 45.2% |
| No Computing Device | 0 | 0.0% |
| Total | 219 | 100.0% |
Internet Access in Jefferson
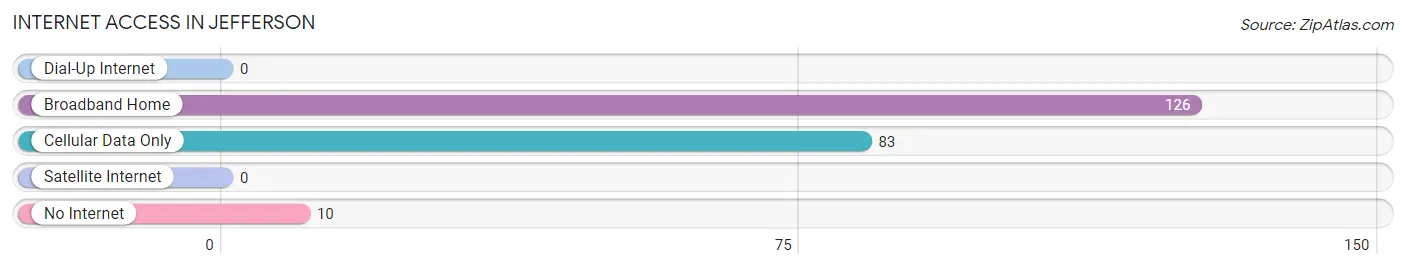
| Internet Type | # Households | % Households |
| Dial-Up Internet | 0 | 0.0% |
| Broadband Home | 126 | 57.5% |
| Cellular Data Only | 83 | 37.9% |
| Satellite Internet | 0 | 0.0% |
| No Internet | 10 | 4.6% |
| Total | 219 | 100.0% |
Jefferson Summary
Jefferson, West Virginia is a small town located in the eastern panhandle of the state. It is situated in the Appalachian Mountains and is part of the Potomac Highlands region. The town is located in the county of Jefferson and is the county seat. The population of Jefferson was 1,890 at the 2010 census.
History
Jefferson was founded in 1786 by Thomas Jefferson, who was the third president of the United States. The town was named after him and was the first town in the state to be named after a president. The town was originally a farming community and was known for its apple orchards. In the late 19th century, the town began to grow and develop as a commercial center. The town was incorporated in 1891 and the first mayor was elected in 1892.
Geography
Jefferson is located in the eastern panhandle of West Virginia, in the Appalachian Mountains. The town is situated in the county of Jefferson and is the county seat. The town is located at an elevation of 1,890 feet and is surrounded by the Shenandoah Valley to the east and the Potomac River to the west. The town is located near the intersection of US Route 340 and US Route 11.
Economy
The economy of Jefferson is largely based on agriculture and tourism. The town is home to several apple orchards and is known for its apple cider. The town is also home to several wineries and vineyards. Tourism is also an important part of the local economy, with many visitors coming to the area to enjoy the scenic beauty of the Appalachian Mountains.
Demographics
As of the 2010 census, the population of Jefferson was 1,890. The racial makeup of the town was 95.3% White, 1.2% African American, 0.3% Native American, 0.7% Asian, 0.1% Pacific Islander, 0.7% from other races, and 1.9% from two or more races. Hispanic or Latino of any race were 1.9% of the population. The median income for a household in the town was $41,250 and the median income for a family was $50,000.
Jefferson is a small town with a rich history and a vibrant economy. The town is home to many apple orchards and wineries, and is a popular tourist destination. The town is also home to a diverse population, with a variety of racial and ethnic backgrounds. Jefferson is a great place to live and work, and is a great example of the beauty and culture of West Virginia.
Common Questions
What is Per Capita Income in Jefferson?
Per Capita income in Jefferson is $17,506.
What is the Median Household income in Jefferson?
Median Household Income in Jefferson is $38,533.
What is Income or Wage Gap in Jefferson?
Income or Wage Gap in Jefferson is 24.0%.
Women in Jefferson earn 76.0 cents for every dollar earned by a man.
What is Inequality or Gini Index in Jefferson?
Inequality or Gini Index in Jefferson is 0.40.
What is the Total Population of Jefferson?
Total Population of Jefferson is 635.
What is the Total Male Population of Jefferson?
Total Male Population of Jefferson is 373.
What is the Total Female Population of Jefferson?
Total Female Population of Jefferson is 262.
What is the Ratio of Males per 100 Females in Jefferson?
There are 142.37 Males per 100 Females in Jefferson.
What is the Ratio of Females per 100 Males in Jefferson?
There are 70.24 Females per 100 Males in Jefferson.
What is the Median Population Age in Jefferson?
Median Population Age in Jefferson is 40.8 Years.
What is the Average Family Size in Jefferson
Average Family Size in Jefferson is 3.3 People.
What is the Average Household Size in Jefferson
Average Household Size in Jefferson is 2.3 People.
How Large is the Labor Force in Jefferson?
There are 177 People in the Labor Forcein in Jefferson.
What is the Percentage of People in the Labor Force in Jefferson?
32.1% of People are in the Labor Force in Jefferson.