St George, WV Map & Demographics
St George Map
St George Overview
$21,810
PER CAPITA INCOME
0.30
INEQUALITY / GINI INDEX
83
TOTAL POPULATION
30
MALE POPULATION
53
FEMALE POPULATION
56.60
MALES / 100 FEMALES
176.67
FEMALES / 100 MALES
38.6
MEDIAN AGE
1.8
AVG FAMILY SIZE
2.6
AVG HOUSEHOLD SIZE
51
LABOR FORCE [ PEOPLE ]
83.6%
PERCENT IN LABOR FORCE
Income in St George
Income Overview in St George
| Characteristic | Number | Measure |
| Per Capita Income | 83 | $21,810 |
| Median Family Income | 28 | $0 |
| Mean Family Income | 28 | $56,346 |
| Median Household Income | 32 | $0 |
| Mean Household Income | 32 | $52,413 |
| Income Deficit | 28 | $0 |
| Wage / Income Gap (%) | 83 | 0.00% |
| Wage / Income Gap ($) | 83 | 100.00¢ per $1 |
| Gini / Inequality Index | 83 | 0.30 |
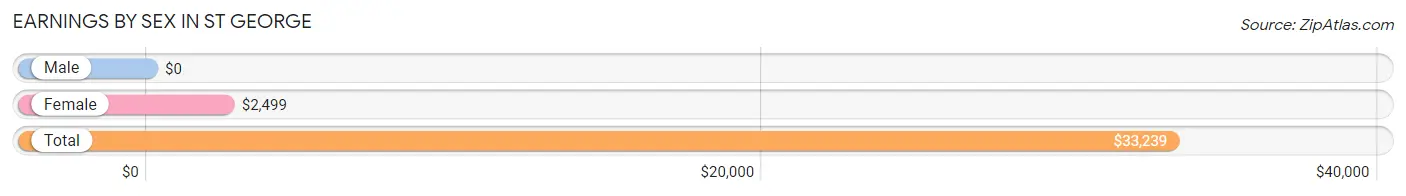
Earnings by Sex in St George
| Sex | Number | Average Earnings |
| Male | 27 (52.9%) | $0 |
| Female | 24 (47.1%) | $2,499 |
| Total | 51 (100.0%) | $33,239 |
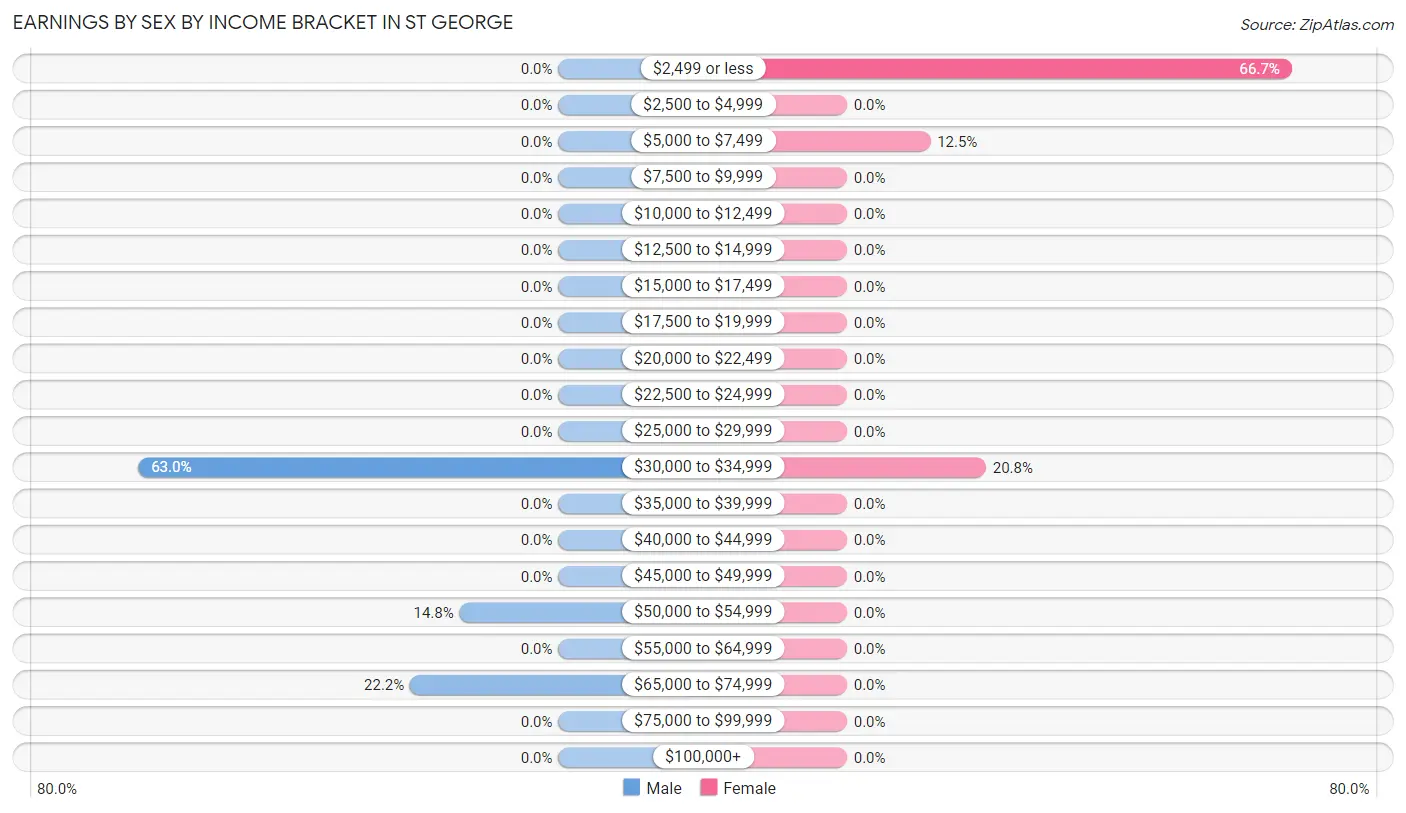
Earnings by Sex by Income Bracket in St George
The most common earnings brackets in St George are $30,000 to $34,999 for men (17 | 63.0%) and $2,499 or less for women (16 | 66.7%).
| Income | Male | Female |
| $2,499 or less | 0 (0.0%) | 16 (66.7%) |
| $2,500 to $4,999 | 0 (0.0%) | 0 (0.0%) |
| $5,000 to $7,499 | 0 (0.0%) | 3 (12.5%) |
| $7,500 to $9,999 | 0 (0.0%) | 0 (0.0%) |
| $10,000 to $12,499 | 0 (0.0%) | 0 (0.0%) |
| $12,500 to $14,999 | 0 (0.0%) | 0 (0.0%) |
| $15,000 to $17,499 | 0 (0.0%) | 0 (0.0%) |
| $17,500 to $19,999 | 0 (0.0%) | 0 (0.0%) |
| $20,000 to $22,499 | 0 (0.0%) | 0 (0.0%) |
| $22,500 to $24,999 | 0 (0.0%) | 0 (0.0%) |
| $25,000 to $29,999 | 0 (0.0%) | 0 (0.0%) |
| $30,000 to $34,999 | 17 (63.0%) | 5 (20.8%) |
| $35,000 to $39,999 | 0 (0.0%) | 0 (0.0%) |
| $40,000 to $44,999 | 0 (0.0%) | 0 (0.0%) |
| $45,000 to $49,999 | 0 (0.0%) | 0 (0.0%) |
| $50,000 to $54,999 | 4 (14.8%) | 0 (0.0%) |
| $55,000 to $64,999 | 0 (0.0%) | 0 (0.0%) |
| $65,000 to $74,999 | 6 (22.2%) | 0 (0.0%) |
| $75,000 to $99,999 | 0 (0.0%) | 0 (0.0%) |
| $100,000+ | 0 (0.0%) | 0 (0.0%) |
| Total | 27 (100.0%) | 24 (100.0%) |
Earnings by Sex by Educational Attainment in St George
| Educational Attainment | Male Income | Female Income |
| Less than High School | - | - |
| High School Diploma | - | - |
| College or Associate's Degree | - | - |
| Bachelor's Degree | - | - |
| Graduate Degree | - | - |
| Total | - | - |
Family Income in St George
Family Income Brackets in St George
According to the St George family income data, there are 17 families falling into the $25,000 to $34,999 income range, which is the most common income bracket and makes up 60.7% of all families.
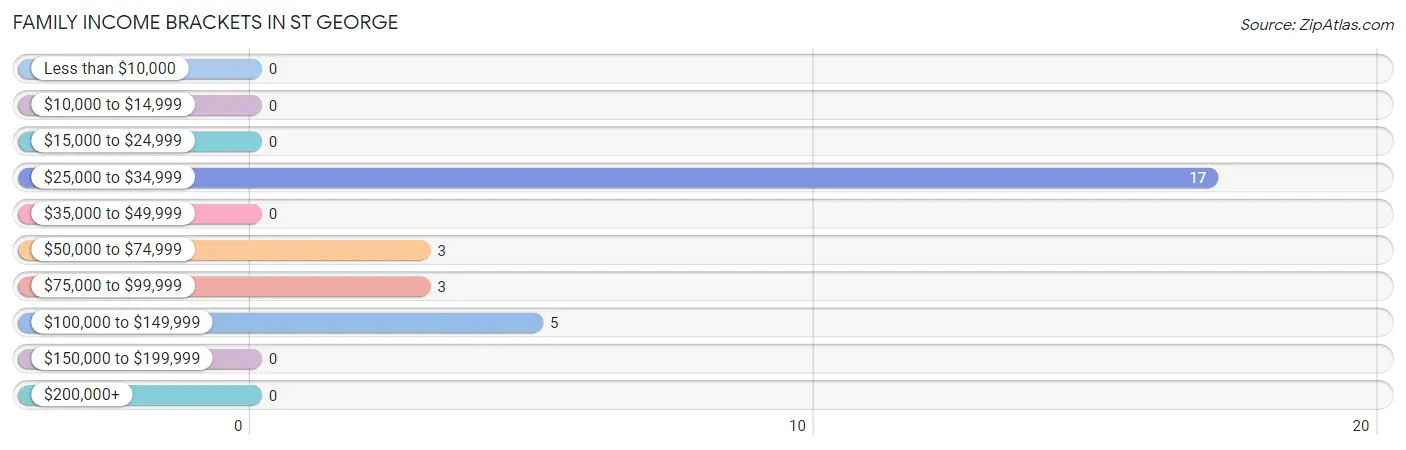
| Income Bracket | # Families | % Families |
| Less than $10,000 | 0 | 0.0% |
| $10,000 to $14,999 | 0 | 0.0% |
| $15,000 to $24,999 | 0 | 0.0% |
| $25,000 to $34,999 | 17 | 60.7% |
| $35,000 to $49,999 | 0 | 0.0% |
| $50,000 to $74,999 | 3 | 10.7% |
| $75,000 to $99,999 | 3 | 10.7% |
| $100,000 to $149,999 | 5 | 17.9% |
| $150,000 to $199,999 | 0 | 0.0% |
| $200,000+ | 0 | 0.0% |
Family Income by Famaliy Size in St George
| Income Bracket | # Families | Median Income |
| 2-Person Families | 28 (100.0%) | $0 |
| 3-Person Families | 0 (0.0%) | $0 |
| 4-Person Families | 0 (0.0%) | $0 |
| 5-Person Families | 0 (0.0%) | $0 |
| 6-Person Families | 0 (0.0%) | $0 |
| 7+ Person Families | 0 (0.0%) | $0 |
| Total | 28 (100.0%) | $0 |
Family Income by Number of Earners in St George
| Number of Earners | # Families | Median Income |
| No Earners | 3 (10.7%) | $0 |
| 1 Earner | 17 (60.7%) | $0 |
| 2 Earners | 8 (28.6%) | $0 |
| 3+ Earners | 0 (0.0%) | $0 |
| Total | 28 (100.0%) | $0 |
Household Income in St George
Household Income Brackets in St George
With 17 households falling in the category, the $35,000 to $49,999 income range is the most frequent in St George, accounting for 53.1% of all households.
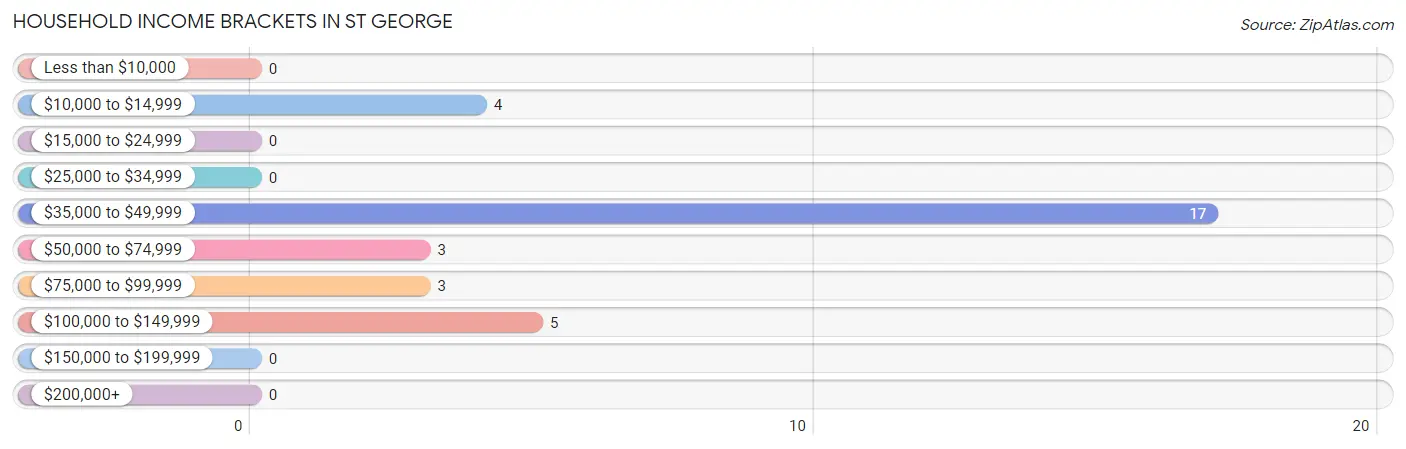
| Income Bracket | # Households | % Households |
| Less than $10,000 | 0 | 0.0% |
| $10,000 to $14,999 | 4 | 12.5% |
| $15,000 to $24,999 | 0 | 0.0% |
| $25,000 to $34,999 | 0 | 0.0% |
| $35,000 to $49,999 | 17 | 53.1% |
| $50,000 to $74,999 | 3 | 9.4% |
| $75,000 to $99,999 | 3 | 9.4% |
| $100,000 to $149,999 | 5 | 15.6% |
| $150,000 to $199,999 | 0 | 0.0% |
| $200,000+ | 0 | 0.0% |
Household Income by Householder Age in St George
| Income Bracket | # Households | Median Income |
| 15 to 24 Years | 0 (0.0%) | $0 |
| 25 to 44 Years | 17 (53.1%) | $0 |
| 45 to 64 Years | 8 (25.0%) | $0 |
| 65+ Years | 7 (21.9%) | $0 |
| Total | 32 (100.0%) | $0 |
Poverty in St George
Income Below Poverty by Sex and Age in St George
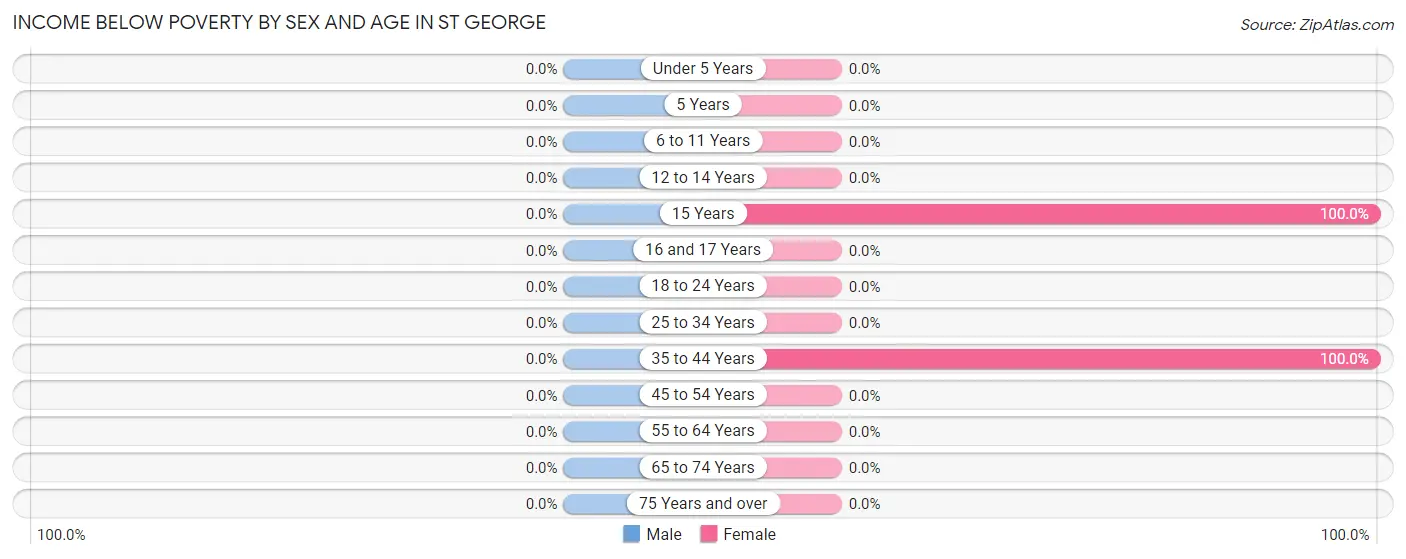
| Age Bracket | Male | Female |
| Under 5 Years | 0 (0.0%) | 0 (0.0%) |
| 5 Years | 0 (0.0%) | 0 (0.0%) |
| 6 to 11 Years | 0 (0.0%) | 0 (0.0%) |
| 12 to 14 Years | 0 (0.0%) | 0 (0.0%) |
| 15 Years | 0 (0.0%) | 12 (100.0%) |
| 16 and 17 Years | 0 (0.0%) | 0 (0.0%) |
| 18 to 24 Years | 0 (0.0%) | 0 (0.0%) |
| 25 to 34 Years | 0 (0.0%) | 0 (0.0%) |
| 35 to 44 Years | 0 (0.0%) | 16 (100.0%) |
| 45 to 54 Years | 0 (0.0%) | 0 (0.0%) |
| 55 to 64 Years | 0 (0.0%) | 0 (0.0%) |
| 65 to 74 Years | 0 (0.0%) | 0 (0.0%) |
| 75 Years and over | 0 (0.0%) | 0 (0.0%) |
| Total | 0 (0.0%) | 28 (52.8%) |
Income Above Poverty by Sex and Age in St George
According to the poverty statistics in St George, males aged 35 to 44 years and females aged 5 years are the age groups that are most secure financially, with 100.0% of males and 100.0% of females in these age groups living above the poverty line.
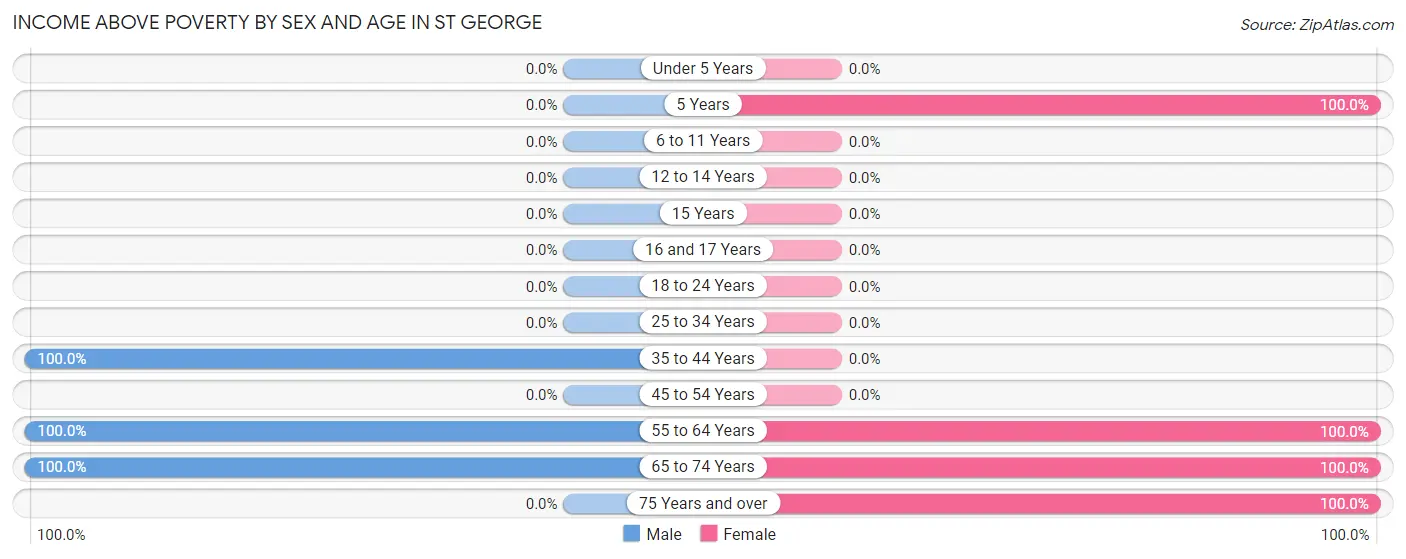
| Age Bracket | Male | Female |
| Under 5 Years | 0 (0.0%) | 0 (0.0%) |
| 5 Years | 0 (0.0%) | 10 (100.0%) |
| 6 to 11 Years | 0 (0.0%) | 0 (0.0%) |
| 12 to 14 Years | 0 (0.0%) | 0 (0.0%) |
| 15 Years | 0 (0.0%) | 0 (0.0%) |
| 16 and 17 Years | 0 (0.0%) | 0 (0.0%) |
| 18 to 24 Years | 0 (0.0%) | 0 (0.0%) |
| 25 to 34 Years | 0 (0.0%) | 0 (0.0%) |
| 35 to 44 Years | 17 (100.0%) | 0 (0.0%) |
| 45 to 54 Years | 0 (0.0%) | 0 (0.0%) |
| 55 to 64 Years | 10 (100.0%) | 8 (100.0%) |
| 65 to 74 Years | 3 (100.0%) | 3 (100.0%) |
| 75 Years and over | 0 (0.0%) | 4 (100.0%) |
| Total | 30 (100.0%) | 25 (47.2%) |
Income Below Poverty Among Married-Couple Families in St George
| Children | Above Poverty | Below Poverty |
| No Children | 11 (100.0%) | 0 (0.0%) |
| 1 or 2 Children | 0 (0.0%) | 0 (0.0%) |
| 3 or 4 Children | 0 (0.0%) | 0 (0.0%) |
| 5 or more Children | 0 (0.0%) | 0 (0.0%) |
| Total | 11 (100.0%) | 0 (0.0%) |
Income Below Poverty Among Single-Parent Households in St George
| Children | Single Father | Single Mother |
| No Children | 0 (0.0%) | 0 (0.0%) |
| 1 or 2 Children | 0 (0.0%) | 0 (0.0%) |
| 3 or 4 Children | 0 (0.0%) | 0 (0.0%) |
| 5 or more Children | 0 (0.0%) | 0 (0.0%) |
| Total | 0 (0.0%) | 0 (0.0%) |
Income Below Poverty Among Married-Couple vs Single-Parent Households in St George
| Children | Married-Couple Families | Single-Parent Households |
| No Children | 0 (0.0%) | 0 (0.0%) |
| 1 or 2 Children | 0 (0.0%) | 0 (0.0%) |
| 3 or 4 Children | 0 (0.0%) | 0 (0.0%) |
| 5 or more Children | 0 (0.0%) | 0 (0.0%) |
| Total | 0 (0.0%) | 0 (0.0%) |
Race in St George
The most populous races in St George are , and White / Caucasian (83 | 100.0%).
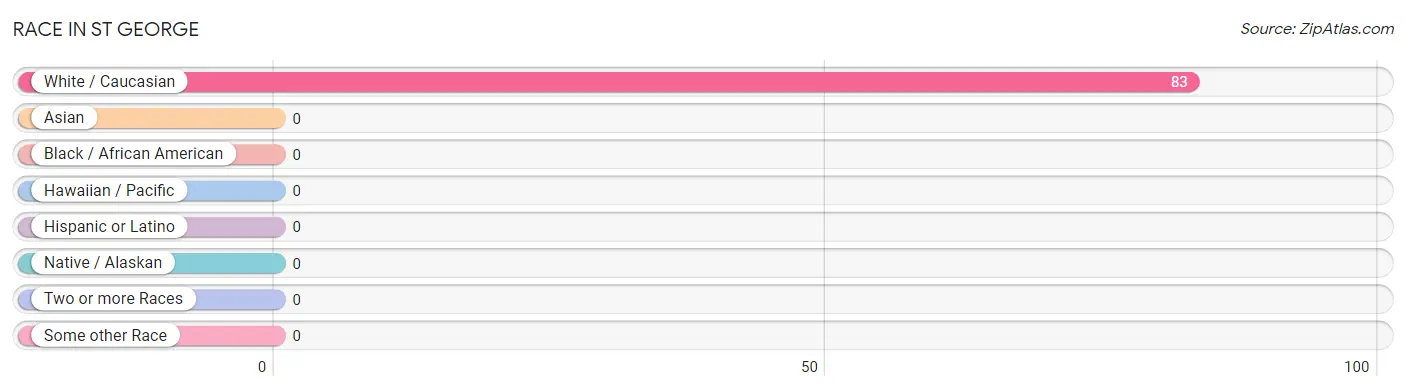
| Race | # Population | % Population |
| Asian | 0 | 0.0% |
| Black / African American | 0 | 0.0% |
| Hawaiian / Pacific | 0 | 0.0% |
| Hispanic or Latino | 0 | 0.0% |
| Native / Alaskan | 0 | 0.0% |
| White / Caucasian | 83 | 100.0% |
| Two or more Races | 0 | 0.0% |
| Some other Race | 0 | 0.0% |
| Total | 83 | 100.0% |
Ancestry in St George
The most populous ancestries reported in St George are American (55 | 66.3%), European (16 | 19.3%), English (10 | 12.0%), German (3 | 3.6%), and Irish (3 | 3.6%), together accounting for 104.8% of all St George residents.
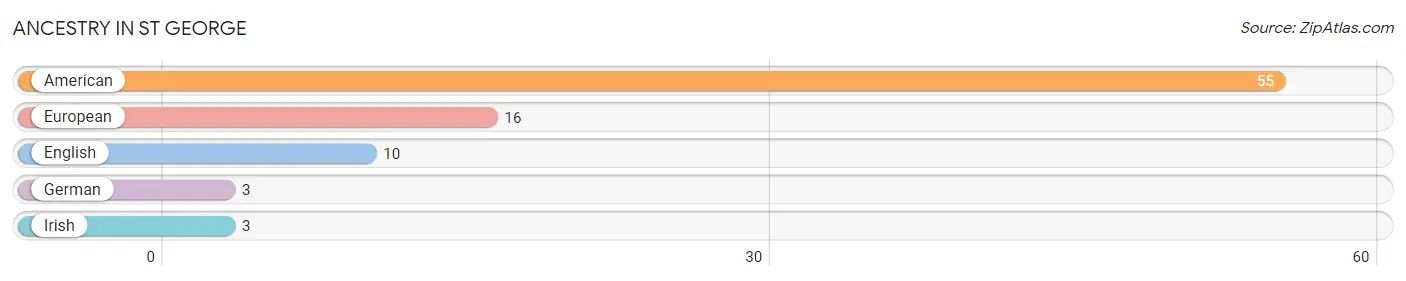
| Ancestry | # Population | % Population |
| American | 55 | 66.3% |
| English | 10 | 12.0% |
| European | 16 | 19.3% |
| German | 3 | 3.6% |
| Irish | 3 | 3.6% | View All 5 Rows |
Immigrants in St George

| Immigration Origin | # Population | % Population | View All 0 Rows |
Sex and Age in St George
Sex and Age in St George
The most populous age groups in St George are 35 to 39 Years (17 | 56.7%) for men and 35 to 39 Years (16 | 30.2%) for women.
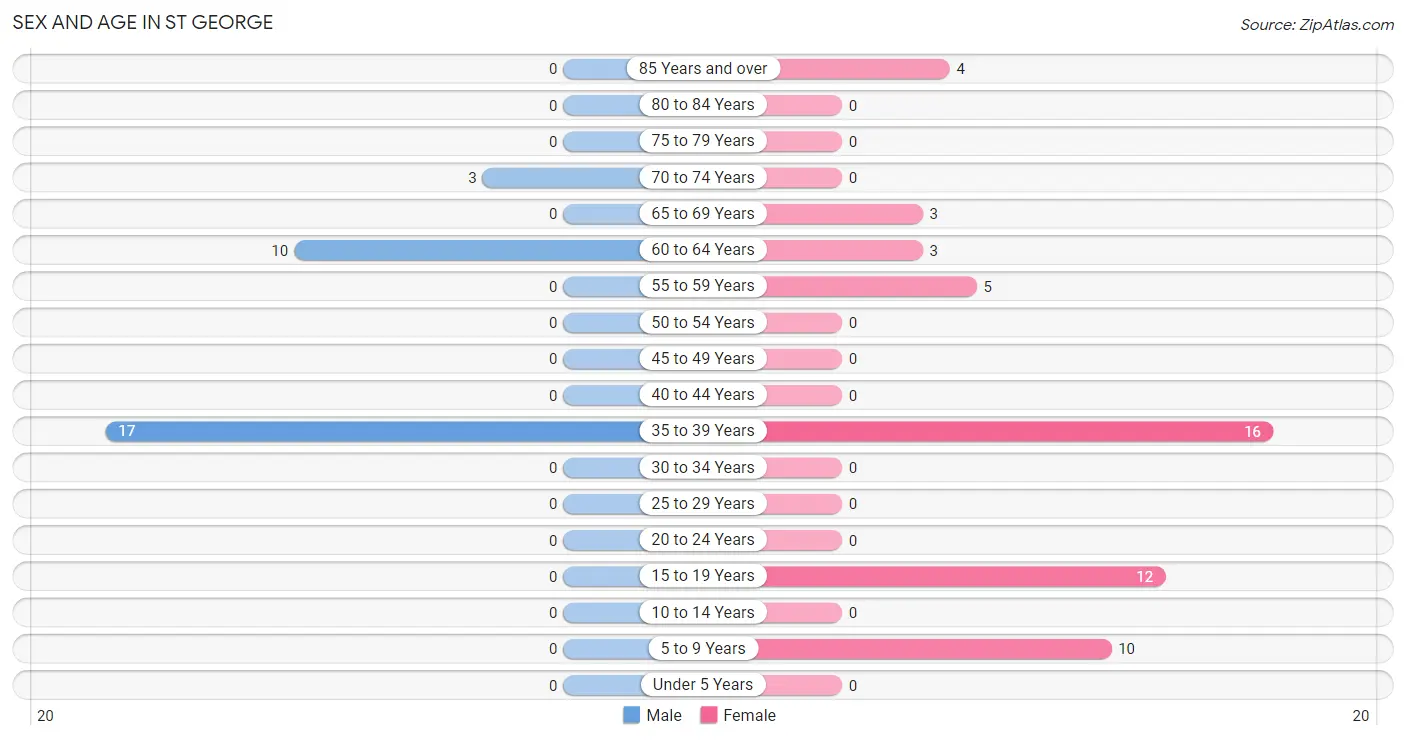
| Age Bracket | Male | Female |
| Under 5 Years | 0 (0.0%) | 0 (0.0%) |
| 5 to 9 Years | 0 (0.0%) | 10 (18.9%) |
| 10 to 14 Years | 0 (0.0%) | 0 (0.0%) |
| 15 to 19 Years | 0 (0.0%) | 12 (22.6%) |
| 20 to 24 Years | 0 (0.0%) | 0 (0.0%) |
| 25 to 29 Years | 0 (0.0%) | 0 (0.0%) |
| 30 to 34 Years | 0 (0.0%) | 0 (0.0%) |
| 35 to 39 Years | 17 (56.7%) | 16 (30.2%) |
| 40 to 44 Years | 0 (0.0%) | 0 (0.0%) |
| 45 to 49 Years | 0 (0.0%) | 0 (0.0%) |
| 50 to 54 Years | 0 (0.0%) | 0 (0.0%) |
| 55 to 59 Years | 0 (0.0%) | 5 (9.4%) |
| 60 to 64 Years | 10 (33.3%) | 3 (5.7%) |
| 65 to 69 Years | 0 (0.0%) | 3 (5.7%) |
| 70 to 74 Years | 3 (10.0%) | 0 (0.0%) |
| 75 to 79 Years | 0 (0.0%) | 0 (0.0%) |
| 80 to 84 Years | 0 (0.0%) | 0 (0.0%) |
| 85 Years and over | 0 (0.0%) | 4 (7.5%) |
| Total | 30 (100.0%) | 53 (100.0%) |
Families and Households in St George
Median Family Size in St George
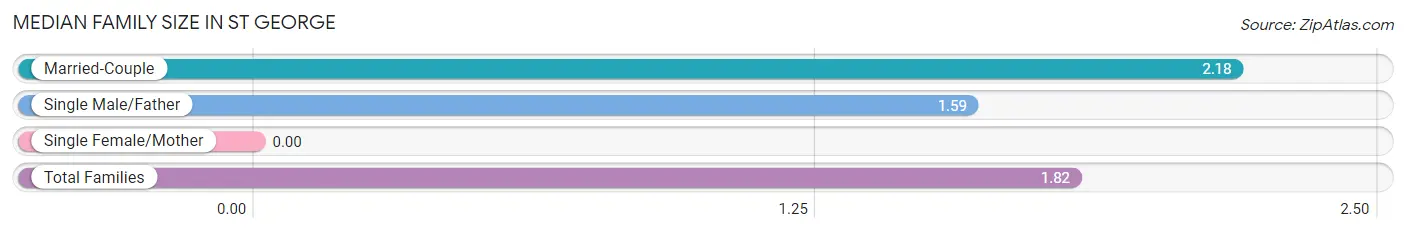
| Family Type | # Families | Family Size |
| Married-Couple | 11 (39.3%) | 2.18 |
| Single Male/Father | 17 (60.7%) | 1.59 |
| Single Female/Mother | 0 (0.0%) | - |
| Total Families | 28 (100.0%) | 1.82 |
Median Household Size in St George
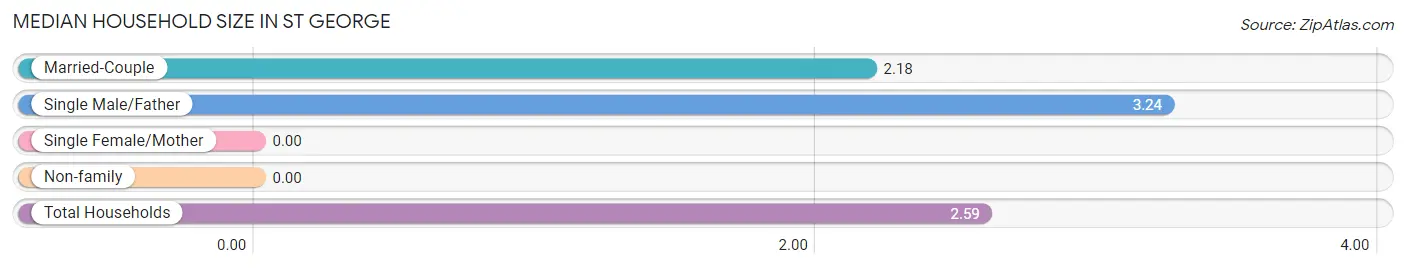
| Household Type | # Households | Household Size |
| Married-Couple | 11 (34.4%) | 2.18 |
| Single Male/Father | 17 (53.1%) | 3.24 |
| Single Female/Mother | 0 (0.0%) | - |
| Non-family | 4 (12.5%) | - |
| Total Households | 32 (100.0%) | 2.59 |
Household Size by Marriage Status in St George
Out of a total of 32 households in St George, 28 (87.5%) are family households, while 4 (12.5%) are nonfamily households. The most numerous type of family households are 4-person households, comprising 17, and the most common type of nonfamily households are 1-person households, comprising 4.
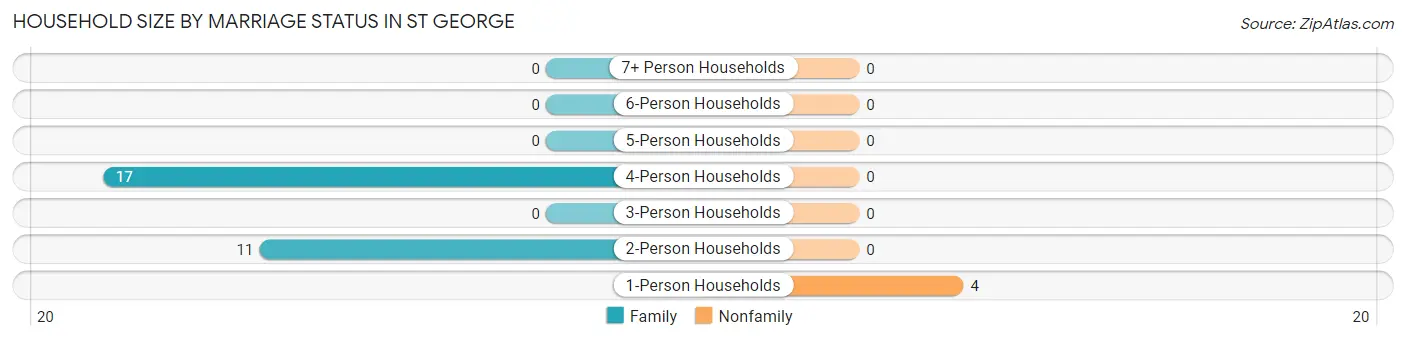
| Household Size | Family Households | Nonfamily Households |
| 1-Person Households | - | 4 (12.5%) |
| 2-Person Households | 11 (34.4%) | 0 (0.0%) |
| 3-Person Households | 0 (0.0%) | 0 (0.0%) |
| 4-Person Households | 17 (53.1%) | 0 (0.0%) |
| 5-Person Households | 0 (0.0%) | 0 (0.0%) |
| 6-Person Households | 0 (0.0%) | 0 (0.0%) |
| 7+ Person Households | 0 (0.0%) | 0 (0.0%) |
| Total | 28 (87.5%) | 4 (12.5%) |
Female Fertility in St George
Fertility by Age in St George
| Age Bracket | Women with Births | Births / 1,000 Women |
| 15 to 19 years | 0 (0.0%) | 0.0 |
| 20 to 34 years | 0 (0.0%) | 0.0 |
| 35 to 50 years | 0 (0.0%) | 0.0 |
| Total | 0 (0.0%) | 0.0 |
Fertility by Age by Marriage Status in St George
| Age Bracket | Married | Unmarried |
| 15 to 19 years | 0 (0.0%) | 0 (0.0%) |
| 20 to 34 years | 0 (0.0%) | 0 (0.0%) |
| 35 to 50 years | 0 (0.0%) | 0 (0.0%) |
| Total | 0 (0.0%) | 0 (0.0%) |
Fertility by Education in St George
| Educational Attainment | Women with Births | Births / 1,000 Women |
| Less than High School | 0 (0.0%) | 0.0 |
| High School Diploma | 0 (0.0%) | 0.0 |
| College or Associate's Degree | 0 (0.0%) | 0.0 |
| Bachelor's Degree | 0 (0.0%) | 0.0 |
| Graduate Degree | 0 (0.0%) | 0.0 |
| Total | 0 (0.0%) | 0.0 |
Fertility by Education by Marriage Status in St George
| Educational Attainment | Married | Unmarried |
| Less than High School | 0 (0.0%) | 0 (0.0%) |
| High School Diploma | 0 (0.0%) | 0 (0.0%) |
| College or Associate's Degree | 0 (0.0%) | 0 (0.0%) |
| Bachelor's Degree | 0 (0.0%) | 0 (0.0%) |
| Graduate Degree | 0 (0.0%) | 0 (0.0%) |
| Total | 0 (0.0%) | 0 (0.0%) |
Employment Characteristics in St George
Employment by Class of Employer in St George
Among the 51 employed individuals in St George, private company employees (27 | 52.9%), state government employees (19 | 37.2%), and not-for-profit organizations (5 | 9.8%) make up the most common classes of employment.
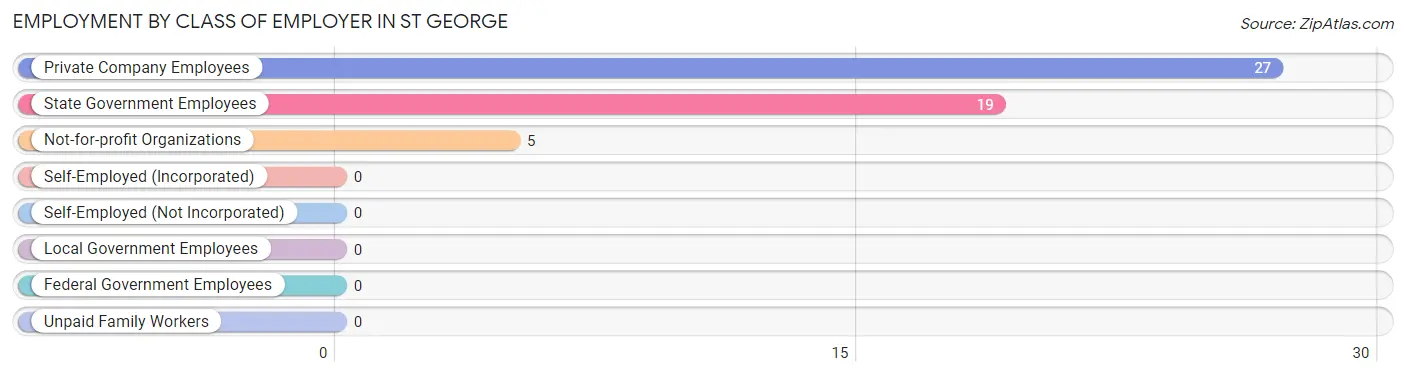
| Employer Class | # Employees | % Employees |
| Private Company Employees | 27 | 52.9% |
| Self-Employed (Incorporated) | 0 | 0.0% |
| Self-Employed (Not Incorporated) | 0 | 0.0% |
| Not-for-profit Organizations | 5 | 9.8% |
| Local Government Employees | 0 | 0.0% |
| State Government Employees | 19 | 37.2% |
| Federal Government Employees | 0 | 0.0% |
| Unpaid Family Workers | 0 | 0.0% |
| Total | 51 | 100.0% |
Employment Status by Age in St George
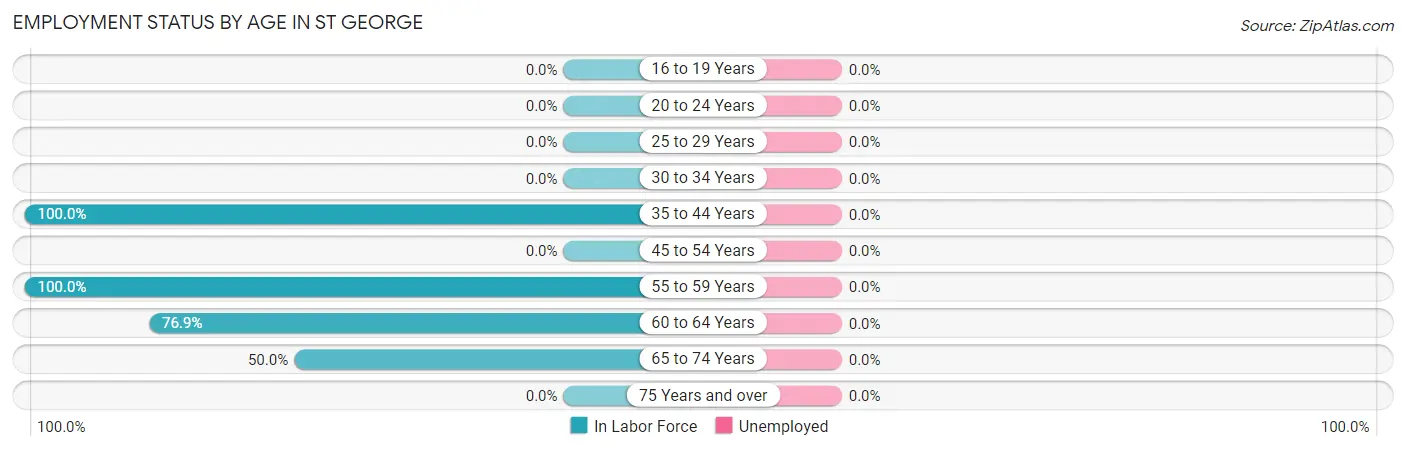
| Age Bracket | In Labor Force | Unemployed |
| 16 to 19 Years | 0 (0.0%) | 0 (0.0%) |
| 20 to 24 Years | 0 (0.0%) | 0 (0.0%) |
| 25 to 29 Years | 0 (0.0%) | 0 (0.0%) |
| 30 to 34 Years | 0 (0.0%) | 0 (0.0%) |
| 35 to 44 Years | 33 (100.0%) | 0 (0.0%) |
| 45 to 54 Years | 0 (0.0%) | 0 (0.0%) |
| 55 to 59 Years | 5 (100.0%) | 0 (0.0%) |
| 60 to 64 Years | 10 (76.9%) | 0 (0.0%) |
| 65 to 74 Years | 3 (50.0%) | 0 (0.0%) |
| 75 Years and over | 0 (0.0%) | 0 (0.0%) |
| Total | 51 (83.6%) | 0 (0.0%) |
Employment Status by Educational Attainment in St George
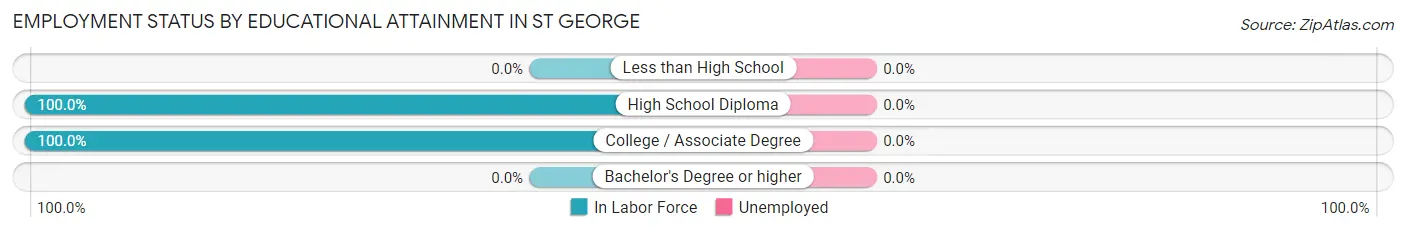
| Educational Attainment | In Labor Force | Unemployed |
| Less than High School | 0 (0.0%) | 0 (0.0%) |
| High School Diploma | 43 (100.0%) | 0 (0.0%) |
| College / Associate Degree | 5 (100.0%) | 0 (0.0%) |
| Bachelor's Degree or higher | 0 (0.0%) | 0 (0.0%) |
| Total | 48 (94.1%) | 0 (0.0%) |
Employment Occupations by Sex in St George
Management, Business, Science and Arts Occupations
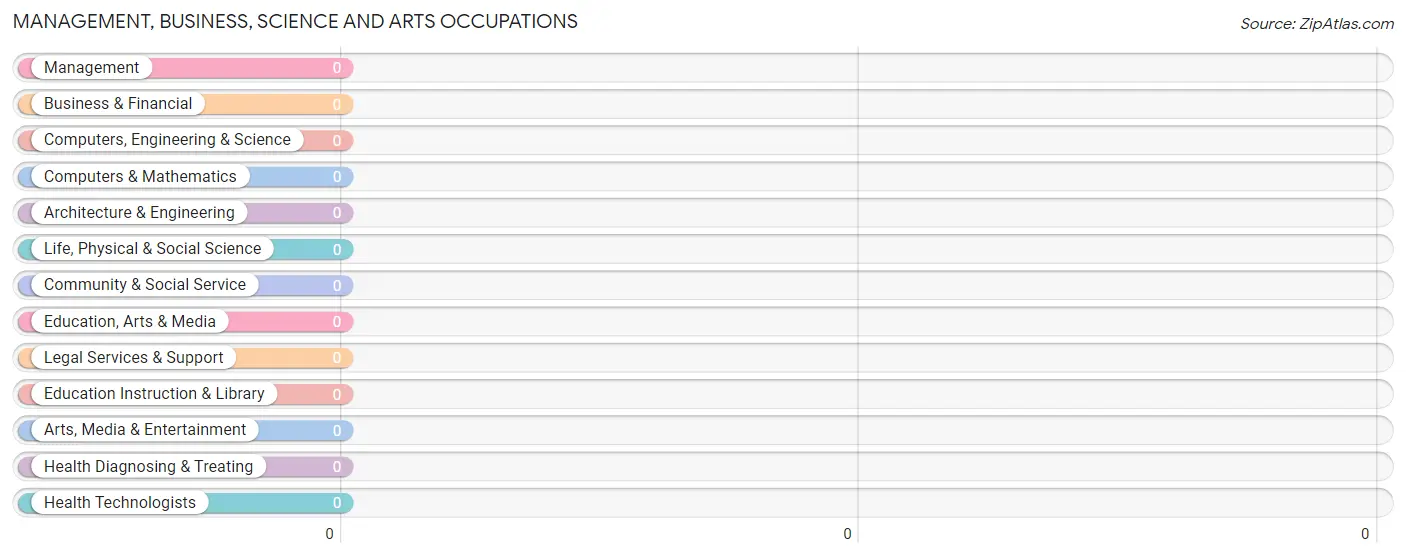
Management, Business, Science and Arts Occupations by Sex
| Occupation | Male | Female |
| Management | 0 (0.0%) | 0 (0.0%) |
| Business & Financial | 0 (0.0%) | 0 (0.0%) |
| Computers, Engineering & Science | 0 (0.0%) | 0 (0.0%) |
| Computers & Mathematics | 0 (0.0%) | 0 (0.0%) |
| Architecture & Engineering | 0 (0.0%) | 0 (0.0%) |
| Life, Physical & Social Science | 0 (0.0%) | 0 (0.0%) |
| Community & Social Service | 0 (0.0%) | 0 (0.0%) |
| Education, Arts & Media | 0 (0.0%) | 0 (0.0%) |
| Legal Services & Support | 0 (0.0%) | 0 (0.0%) |
| Education Instruction & Library | 0 (0.0%) | 0 (0.0%) |
| Arts, Media & Entertainment | 0 (0.0%) | 0 (0.0%) |
| Health Diagnosing & Treating | 0 (0.0%) | 0 (0.0%) |
| Health Technologists | 0 (0.0%) | 0 (0.0%) |
| Total (Category) | 0 (0.0%) | 0 (0.0%) |
| Total (Overall) | 27 (52.9%) | 24 (47.1%) |
Services Occupations
The most common Services occupations in St George are Security & Protection (16 | 31.4%), Firefighting & Prevention (16 | 31.4%), and Healthcare Support (3 | 5.9%).
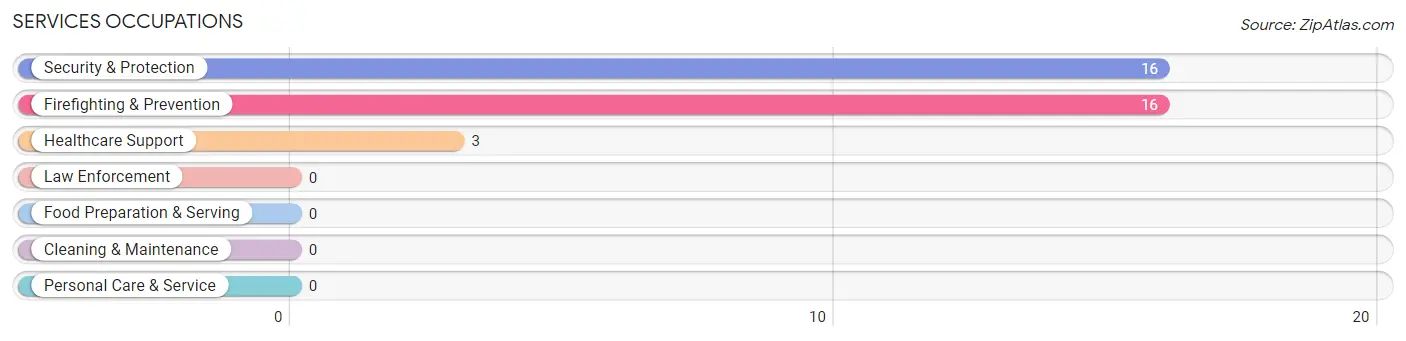
Services Occupations by Sex
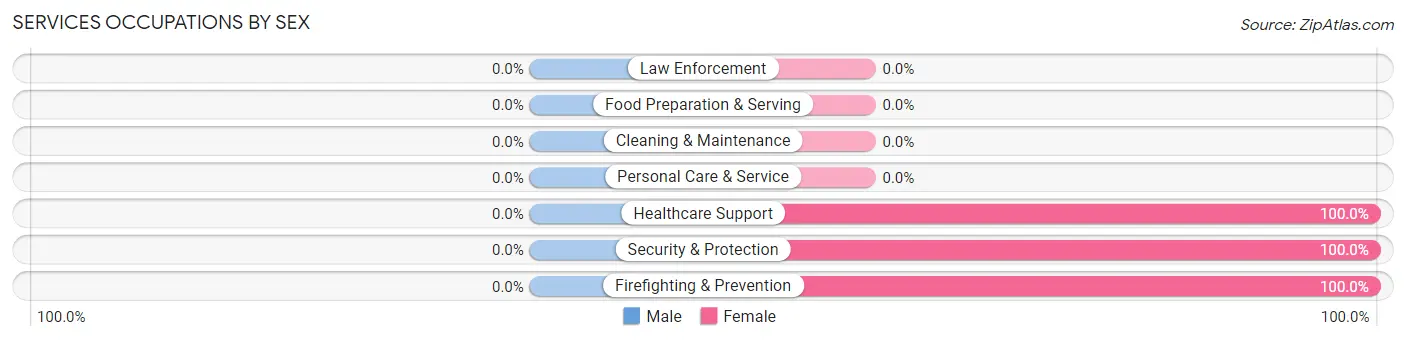
| Occupation | Male | Female |
| Healthcare Support | 0 (0.0%) | 3 (100.0%) |
| Security & Protection | 0 (0.0%) | 16 (100.0%) |
| Firefighting & Prevention | 0 (0.0%) | 16 (100.0%) |
| Law Enforcement | 0 (0.0%) | 0 (0.0%) |
| Food Preparation & Serving | 0 (0.0%) | 0 (0.0%) |
| Cleaning & Maintenance | 0 (0.0%) | 0 (0.0%) |
| Personal Care & Service | 0 (0.0%) | 0 (0.0%) |
| Total (Category) | 0 (0.0%) | 19 (100.0%) |
| Total (Overall) | 27 (52.9%) | 24 (47.1%) |
Sales and Office Occupations

Sales and Office Occupations by Sex

| Occupation | Male | Female |
| Sales & Related | 0 (0.0%) | 0 (0.0%) |
| Office & Administration | 0 (0.0%) | 0 (0.0%) |
| Total (Category) | 0 (0.0%) | 0 (0.0%) |
| Total (Overall) | 27 (52.9%) | 24 (47.1%) |
Natural Resources, Construction and Maintenance Occupations

Natural Resources, Construction and Maintenance Occupations by Sex
| Occupation | Male | Female |
| Farming, Fishing & Forestry | 0 (0.0%) | 0 (0.0%) |
| Construction & Extraction | 0 (0.0%) | 0 (0.0%) |
| Installation, Maintenance & Repair | 0 (0.0%) | 0 (0.0%) |
| Total (Category) | 0 (0.0%) | 0 (0.0%) |
| Total (Overall) | 27 (52.9%) | 24 (47.1%) |
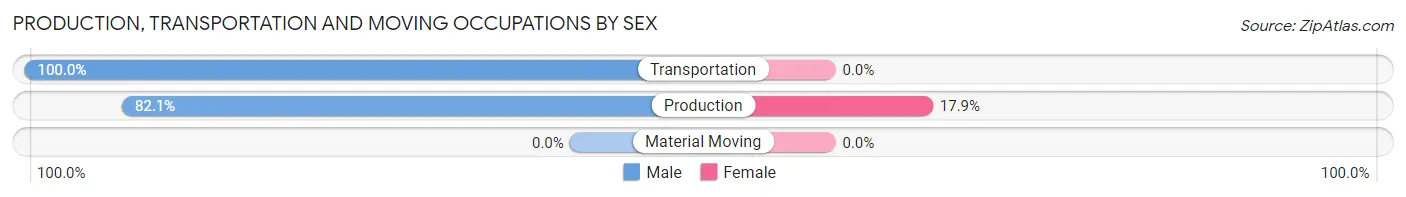
Production, Transportation and Moving Occupations
The most common Production, Transportation and Moving occupations in St George are Production (28 | 54.9%), and Transportation (4 | 7.8%).

Production, Transportation and Moving Occupations by Sex
| Occupation | Male | Female |
| Production | 23 (82.1%) | 5 (17.9%) |
| Transportation | 4 (100.0%) | 0 (0.0%) |
| Material Moving | 0 (0.0%) | 0 (0.0%) |
| Total (Category) | 27 (84.4%) | 5 (15.6%) |
| Total (Overall) | 27 (52.9%) | 24 (47.1%) |
Employment Industries by Sex in St George
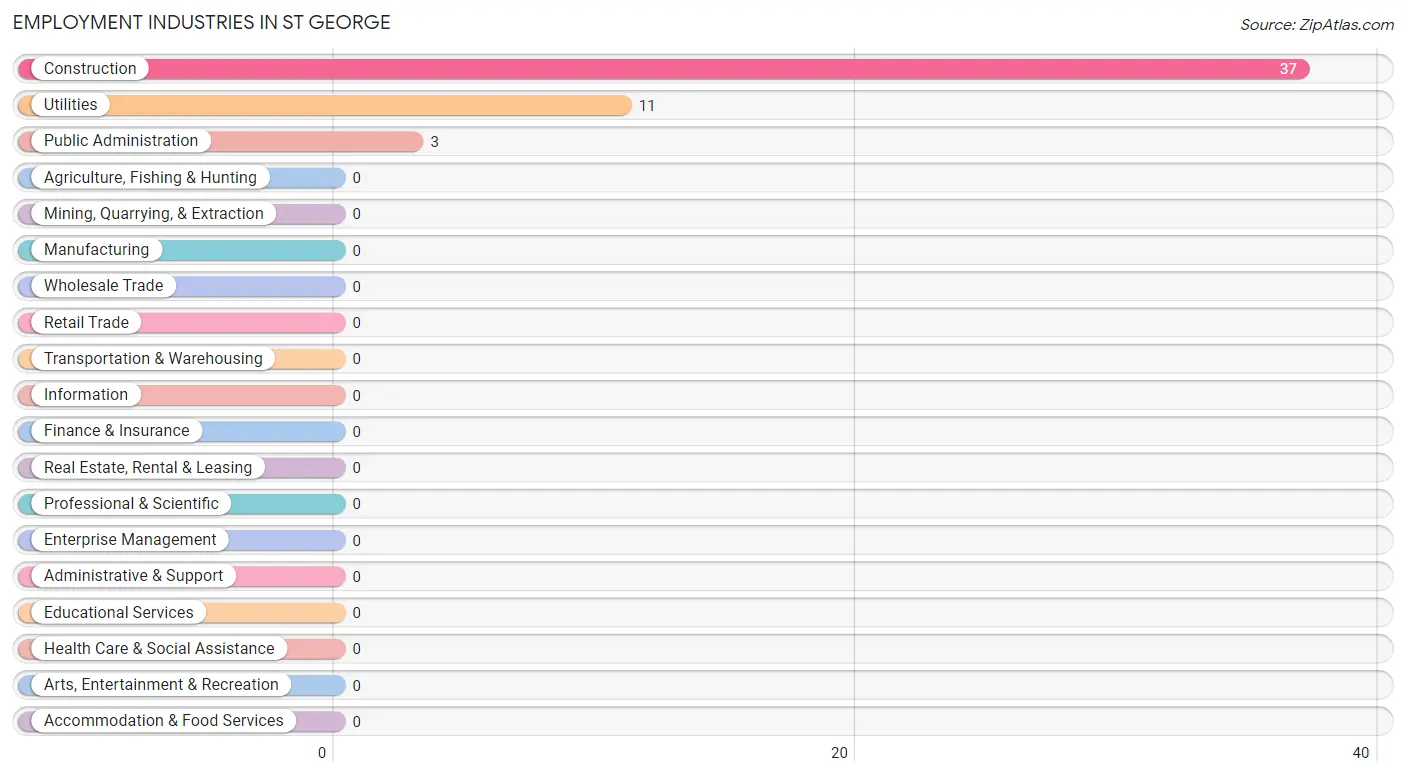
Employment Industries in St George
The major employment industries in St George include Construction (37 | 72.6%), Utilities (11 | 21.6%), and Public Administration (3 | 5.9%).
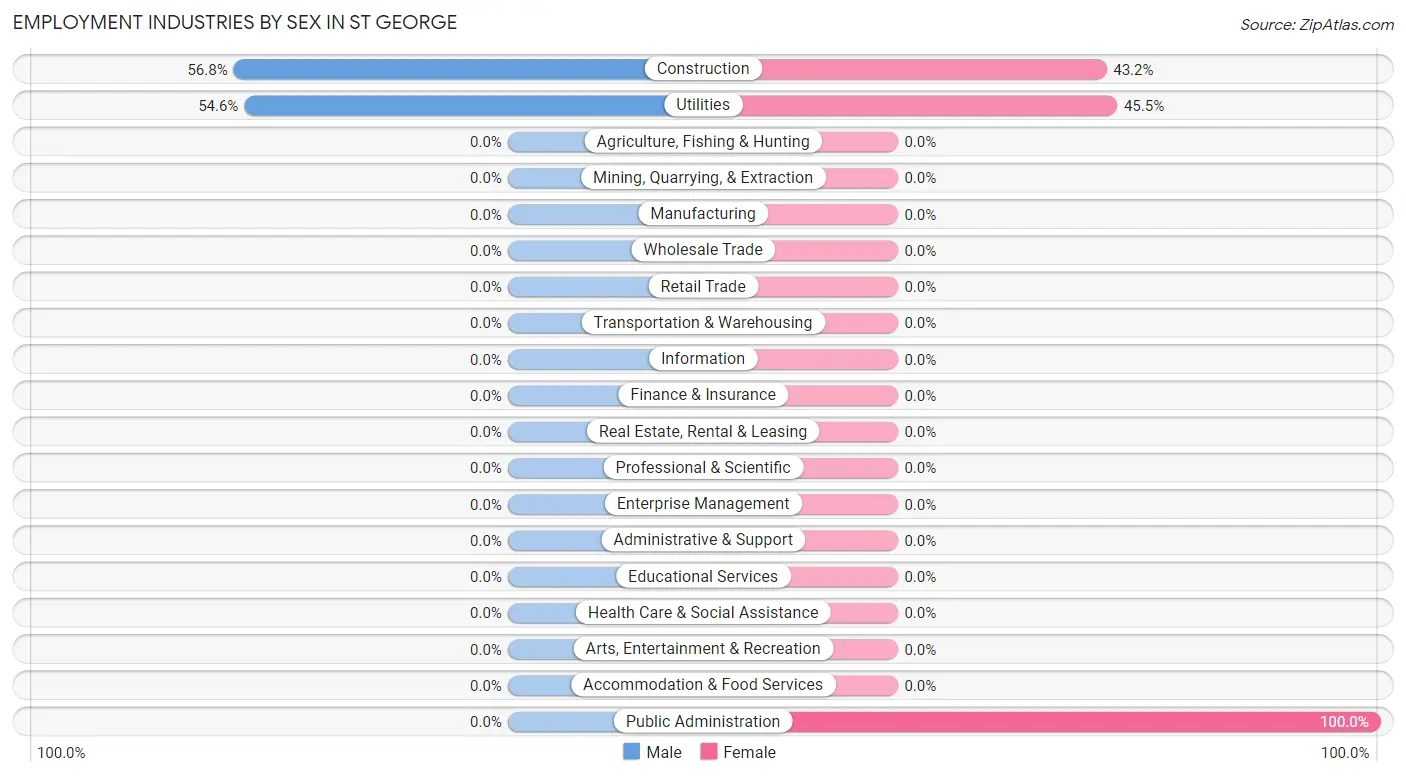
Employment Industries by Sex in St George
The St George industries that see more men than women are Construction (56.8%), and Utilities (54.5%), whereas the industries that tend to have a higher number of women are Public Administration (100.0%), Utilities (45.5%), and Construction (43.2%).
| Industry | Male | Female |
| Agriculture, Fishing & Hunting | 0 (0.0%) | 0 (0.0%) |
| Mining, Quarrying, & Extraction | 0 (0.0%) | 0 (0.0%) |
| Construction | 21 (56.8%) | 16 (43.2%) |
| Manufacturing | 0 (0.0%) | 0 (0.0%) |
| Wholesale Trade | 0 (0.0%) | 0 (0.0%) |
| Retail Trade | 0 (0.0%) | 0 (0.0%) |
| Transportation & Warehousing | 0 (0.0%) | 0 (0.0%) |
| Utilities | 6 (54.5%) | 5 (45.5%) |
| Information | 0 (0.0%) | 0 (0.0%) |
| Finance & Insurance | 0 (0.0%) | 0 (0.0%) |
| Real Estate, Rental & Leasing | 0 (0.0%) | 0 (0.0%) |
| Professional & Scientific | 0 (0.0%) | 0 (0.0%) |
| Enterprise Management | 0 (0.0%) | 0 (0.0%) |
| Administrative & Support | 0 (0.0%) | 0 (0.0%) |
| Educational Services | 0 (0.0%) | 0 (0.0%) |
| Health Care & Social Assistance | 0 (0.0%) | 0 (0.0%) |
| Arts, Entertainment & Recreation | 0 (0.0%) | 0 (0.0%) |
| Accommodation & Food Services | 0 (0.0%) | 0 (0.0%) |
| Public Administration | 0 (0.0%) | 3 (100.0%) |
| Total | 27 (52.9%) | 24 (47.1%) |
Education in St George
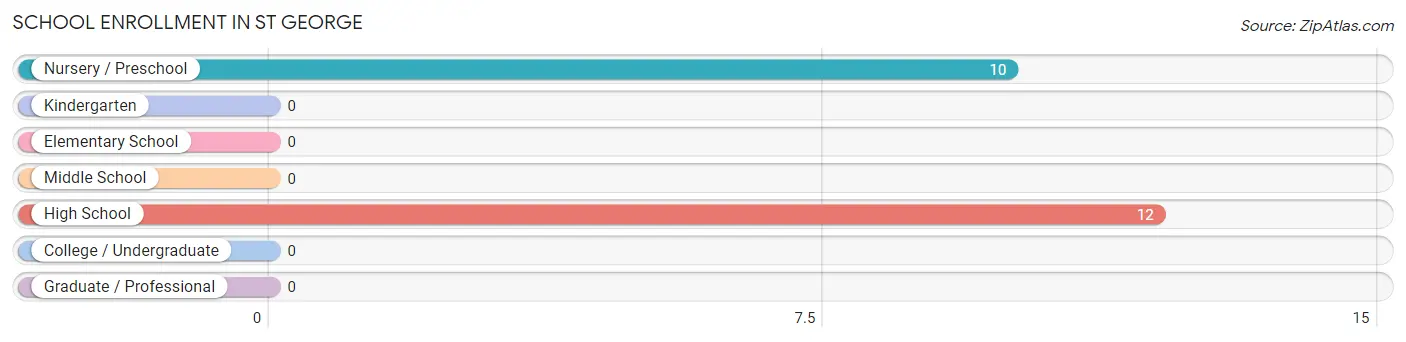
School Enrollment in St George
The most common levels of schooling among the 22 students in St George are high school (12 | 54.5%), and nursery / preschool (10 | 45.5%).
| School Level | # Students | % Students |
| Nursery / Preschool | 10 | 45.5% |
| Kindergarten | 0 | 0.0% |
| Elementary School | 0 | 0.0% |
| Middle School | 0 | 0.0% |
| High School | 12 | 54.5% |
| College / Undergraduate | 0 | 0.0% |
| Graduate / Professional | 0 | 0.0% |
| Total | 22 | 100.0% |
School Enrollment by Age by Funding Source in St George
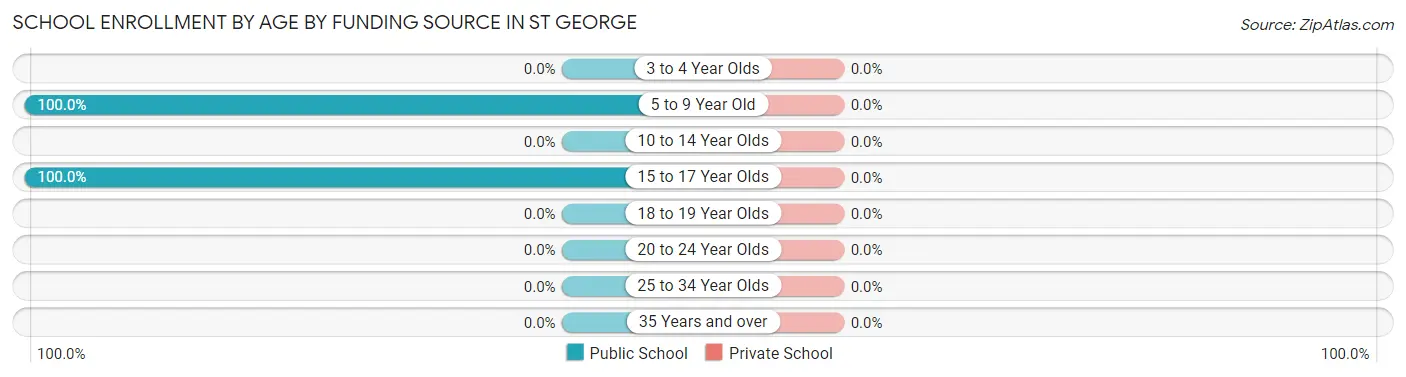
| Age Bracket | Public School | Private School |
| 3 to 4 Year Olds | 0 (0.0%) | 0 (0.0%) |
| 5 to 9 Year Old | 10 (100.0%) | 0 (0.0%) |
| 10 to 14 Year Olds | 0 (0.0%) | 0 (0.0%) |
| 15 to 17 Year Olds | 12 (100.0%) | 0 (0.0%) |
| 18 to 19 Year Olds | 0 (0.0%) | 0 (0.0%) |
| 20 to 24 Year Olds | 0 (0.0%) | 0 (0.0%) |
| 25 to 34 Year Olds | 0 (0.0%) | 0 (0.0%) |
| 35 Years and over | 0 (0.0%) | 0 (0.0%) |
| Total | 22 (100.0%) | 0 (0.0%) |
Educational Attainment by Field of Study in St George
, and education (3 | 100.0%) are the most common fields of study among 3 individuals in St George who have obtained a bachelor's degree or higher.
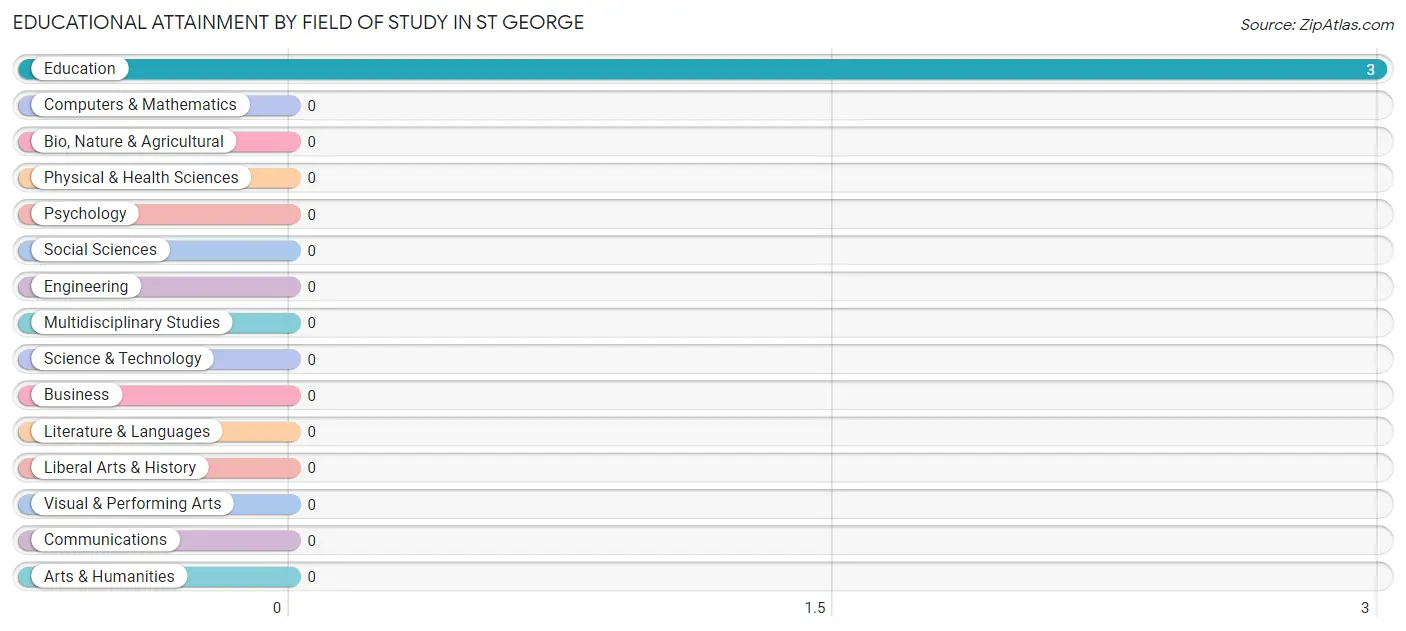
| Field of Study | # Graduates | % Graduates |
| Computers & Mathematics | 0 | 0.0% |
| Bio, Nature & Agricultural | 0 | 0.0% |
| Physical & Health Sciences | 0 | 0.0% |
| Psychology | 0 | 0.0% |
| Social Sciences | 0 | 0.0% |
| Engineering | 0 | 0.0% |
| Multidisciplinary Studies | 0 | 0.0% |
| Science & Technology | 0 | 0.0% |
| Business | 0 | 0.0% |
| Education | 3 | 100.0% |
| Literature & Languages | 0 | 0.0% |
| Liberal Arts & History | 0 | 0.0% |
| Visual & Performing Arts | 0 | 0.0% |
| Communications | 0 | 0.0% |
| Arts & Humanities | 0 | 0.0% |
| Total | 3 | 100.0% |
Transportation & Commute in St George
Vehicle Availability by Sex in St George
The most prevalent vehicle ownership categories in St George are males with 3 vehicles (17, accounting for 63.0%) and females with 3 vehicles (16, making up 70.8%).
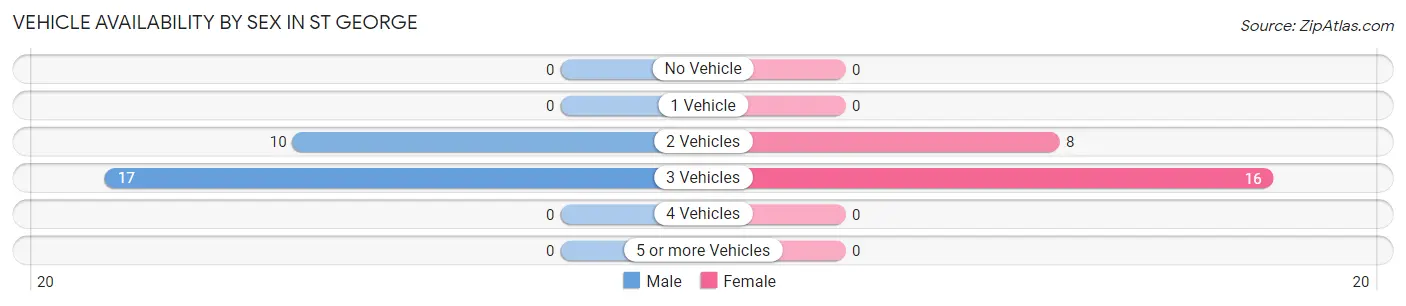
| Vehicles Available | Male | Female |
| No Vehicle | 0 (0.0%) | 0 (0.0%) |
| 1 Vehicle | 0 (0.0%) | 0 (0.0%) |
| 2 Vehicles | 10 (37.0%) | 8 (33.3%) |
| 3 Vehicles | 17 (63.0%) | 16 (66.7%) |
| 4 Vehicles | 0 (0.0%) | 0 (0.0%) |
| 5 or more Vehicles | 0 (0.0%) | 0 (0.0%) |
| Total | 27 (100.0%) | 24 (100.0%) |
Commute Time in St George
The most frequently occuring commute durations in St George are 15 to 19 minutes (20 commuters, 39.2%), 90 or more minutes (17 commuters, 33.3%), and 45 to 59 minutes (6 commuters, 11.8%).
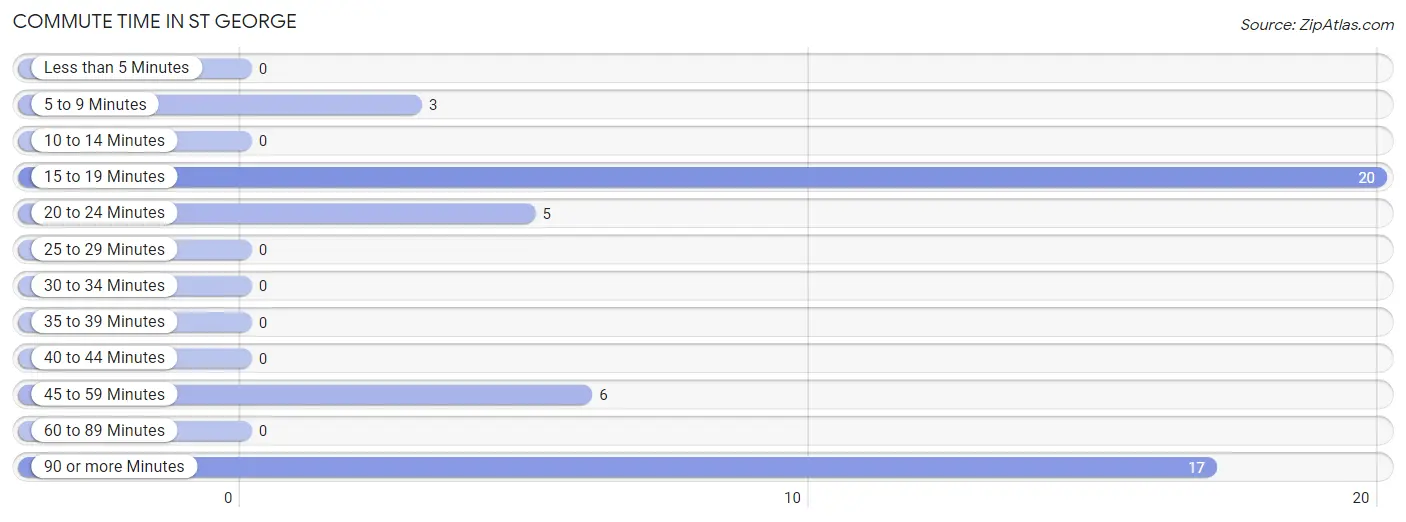
| Commute Time | # Commuters | % Commuters |
| Less than 5 Minutes | 0 | 0.0% |
| 5 to 9 Minutes | 3 | 5.9% |
| 10 to 14 Minutes | 0 | 0.0% |
| 15 to 19 Minutes | 20 | 39.2% |
| 20 to 24 Minutes | 5 | 9.8% |
| 25 to 29 Minutes | 0 | 0.0% |
| 30 to 34 Minutes | 0 | 0.0% |
| 35 to 39 Minutes | 0 | 0.0% |
| 40 to 44 Minutes | 0 | 0.0% |
| 45 to 59 Minutes | 6 | 11.8% |
| 60 to 89 Minutes | 0 | 0.0% |
| 90 or more Minutes | 17 | 33.3% |
Commute Time by Sex in St George
The most common commute times in St George are 90 or more minutes (17 commuters, 63.0%) for males and 15 to 19 minutes (16 commuters, 66.7%) for females.
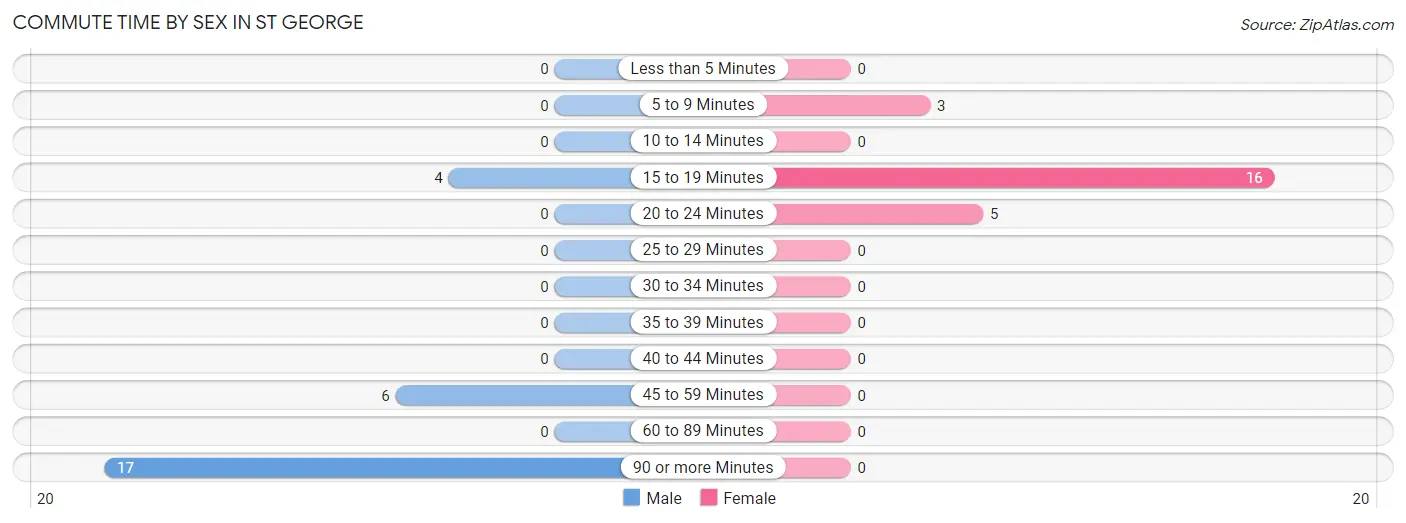
| Commute Time | Male | Female |
| Less than 5 Minutes | 0 (0.0%) | 0 (0.0%) |
| 5 to 9 Minutes | 0 (0.0%) | 3 (12.5%) |
| 10 to 14 Minutes | 0 (0.0%) | 0 (0.0%) |
| 15 to 19 Minutes | 4 (14.8%) | 16 (66.7%) |
| 20 to 24 Minutes | 0 (0.0%) | 5 (20.8%) |
| 25 to 29 Minutes | 0 (0.0%) | 0 (0.0%) |
| 30 to 34 Minutes | 0 (0.0%) | 0 (0.0%) |
| 35 to 39 Minutes | 0 (0.0%) | 0 (0.0%) |
| 40 to 44 Minutes | 0 (0.0%) | 0 (0.0%) |
| 45 to 59 Minutes | 6 (22.2%) | 0 (0.0%) |
| 60 to 89 Minutes | 0 (0.0%) | 0 (0.0%) |
| 90 or more Minutes | 17 (63.0%) | 0 (0.0%) |
Time of Departure to Work by Sex in St George
The most frequent times of departure to work in St George are 4:00 PM to 11:59 PM (17, 63.0%) for males and 7:00 AM to 7:29 AM (16, 66.7%) for females.
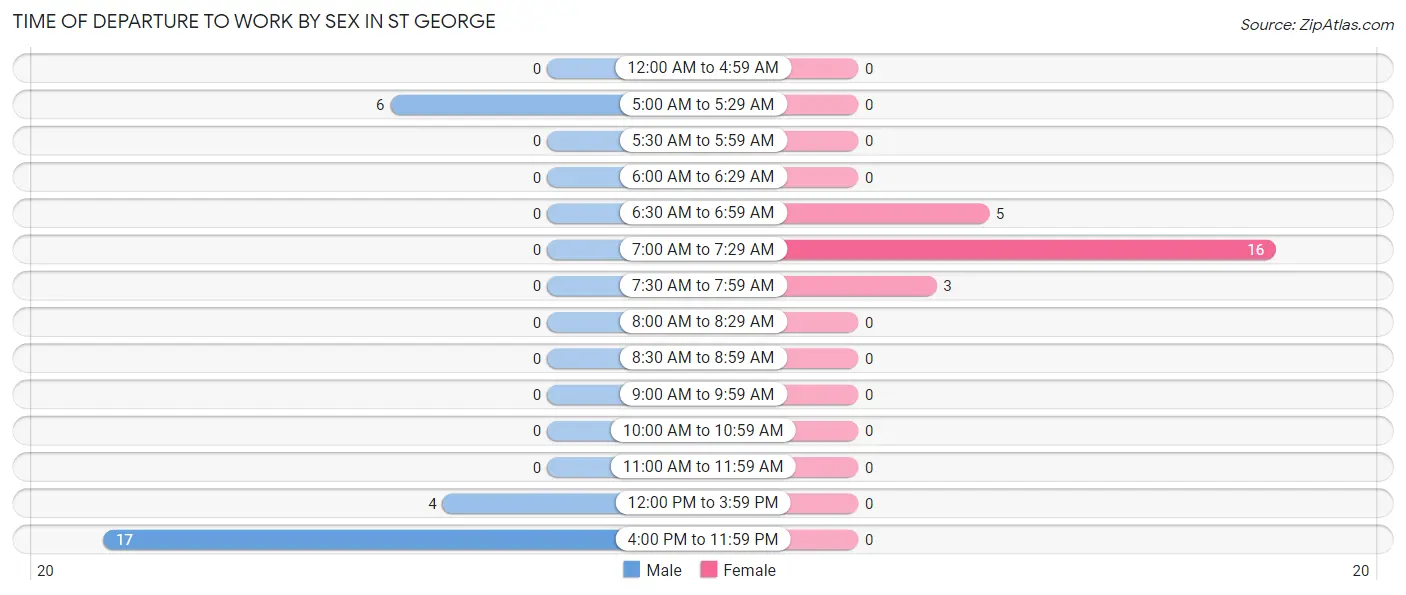
| Time of Departure | Male | Female |
| 12:00 AM to 4:59 AM | 0 (0.0%) | 0 (0.0%) |
| 5:00 AM to 5:29 AM | 6 (22.2%) | 0 (0.0%) |
| 5:30 AM to 5:59 AM | 0 (0.0%) | 0 (0.0%) |
| 6:00 AM to 6:29 AM | 0 (0.0%) | 0 (0.0%) |
| 6:30 AM to 6:59 AM | 0 (0.0%) | 5 (20.8%) |
| 7:00 AM to 7:29 AM | 0 (0.0%) | 16 (66.7%) |
| 7:30 AM to 7:59 AM | 0 (0.0%) | 3 (12.5%) |
| 8:00 AM to 8:29 AM | 0 (0.0%) | 0 (0.0%) |
| 8:30 AM to 8:59 AM | 0 (0.0%) | 0 (0.0%) |
| 9:00 AM to 9:59 AM | 0 (0.0%) | 0 (0.0%) |
| 10:00 AM to 10:59 AM | 0 (0.0%) | 0 (0.0%) |
| 11:00 AM to 11:59 AM | 0 (0.0%) | 0 (0.0%) |
| 12:00 PM to 3:59 PM | 4 (14.8%) | 0 (0.0%) |
| 4:00 PM to 11:59 PM | 17 (63.0%) | 0 (0.0%) |
| Total | 27 (100.0%) | 24 (100.0%) |
Housing Occupancy in St George
Occupancy by Ownership in St George
Of the total 32 dwellings in St George, owner-occupied units account for 11 (34.4%), while renter-occupied units make up 21 (65.6%).
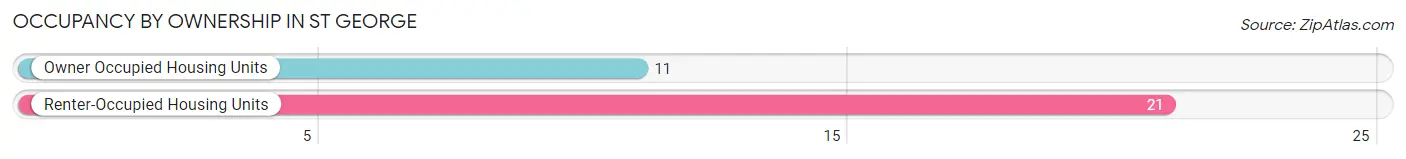
| Occupancy | # Housing Units | % Housing Units |
| Owner Occupied Housing Units | 11 | 34.4% |
| Renter-Occupied Housing Units | 21 | 65.6% |
| Total Occupied Housing Units | 32 | 100.0% |
Occupancy by Household Size in St George
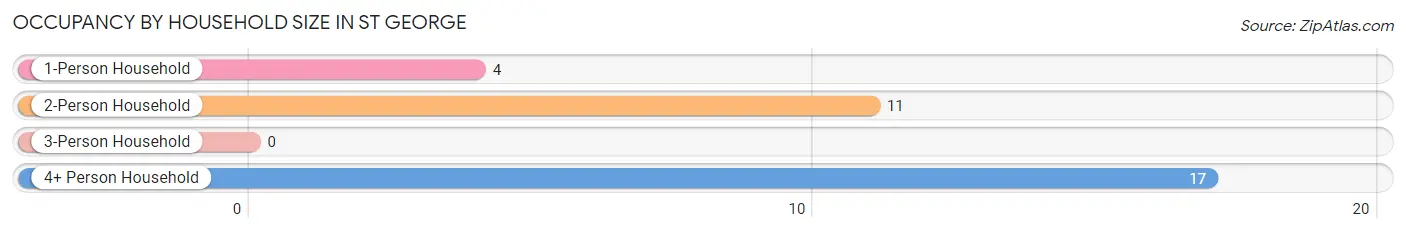
| Household Size | # Housing Units | % Housing Units |
| 1-Person Household | 4 | 12.5% |
| 2-Person Household | 11 | 34.4% |
| 3-Person Household | 0 | 0.0% |
| 4+ Person Household | 17 | 53.1% |
| Total Housing Units | 32 | 100.0% |
Occupancy by Ownership by Household Size in St George
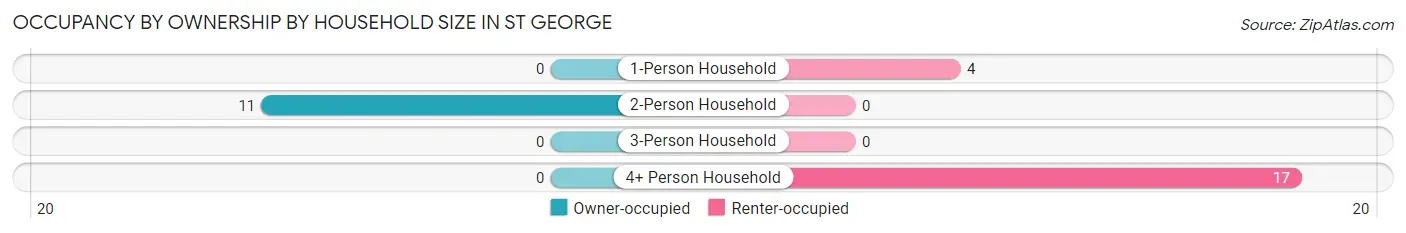
| Household Size | Owner-occupied | Renter-occupied |
| 1-Person Household | 0 (0.0%) | 4 (100.0%) |
| 2-Person Household | 11 (100.0%) | 0 (0.0%) |
| 3-Person Household | 0 (0.0%) | 0 (0.0%) |
| 4+ Person Household | 0 (0.0%) | 17 (100.0%) |
| Total Housing Units | 11 (34.4%) | 21 (65.6%) |
Occupancy by Educational Attainment in St George
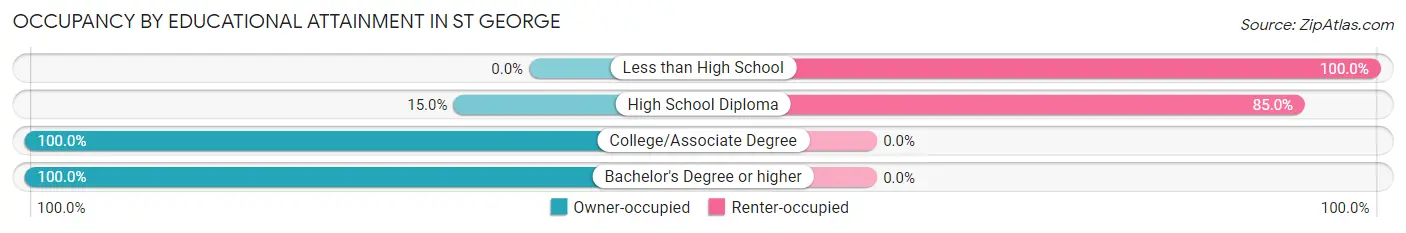
| Household Size | Owner-occupied | Renter-occupied |
| Less than High School | 0 (0.0%) | 4 (100.0%) |
| High School Diploma | 3 (15.0%) | 17 (85.0%) |
| College/Associate Degree | 5 (100.0%) | 0 (0.0%) |
| Bachelor's Degree or higher | 3 (100.0%) | 0 (0.0%) |
Occupancy by Age of Householder in St George
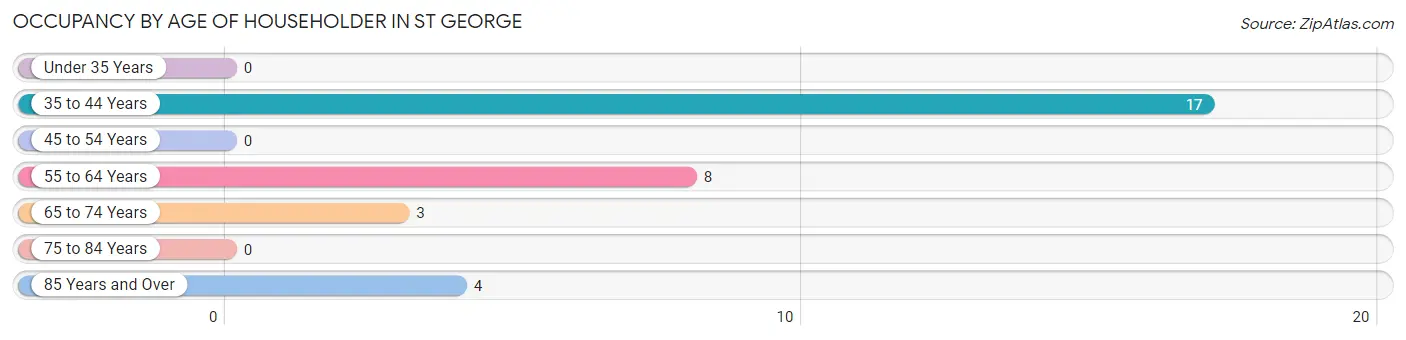
| Age Bracket | # Households | % Households |
| Under 35 Years | 0 | 0.0% |
| 35 to 44 Years | 17 | 53.1% |
| 45 to 54 Years | 0 | 0.0% |
| 55 to 64 Years | 8 | 25.0% |
| 65 to 74 Years | 3 | 9.4% |
| 75 to 84 Years | 0 | 0.0% |
| 85 Years and Over | 4 | 12.5% |
| Total | 32 | 100.0% |
Housing Finances in St George
Median Income by Occupancy in St George
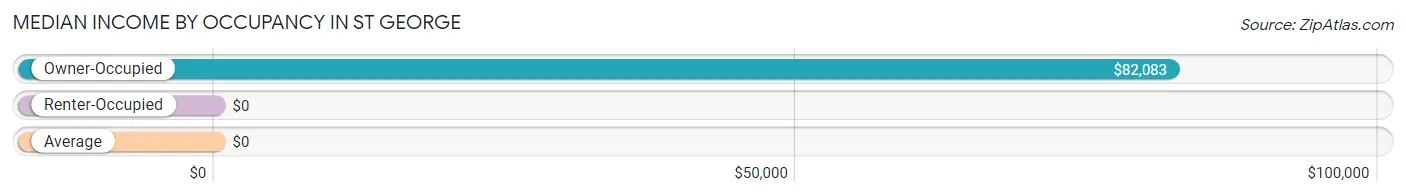
| Occupancy Type | # Households | Median Income |
| Owner-Occupied | 11 (34.4%) | $82,083 |
| Renter-Occupied | 21 (65.6%) | $0 |
| Average | 32 (100.0%) | $0 |
Occupancy by Householder Income Bracket in St George
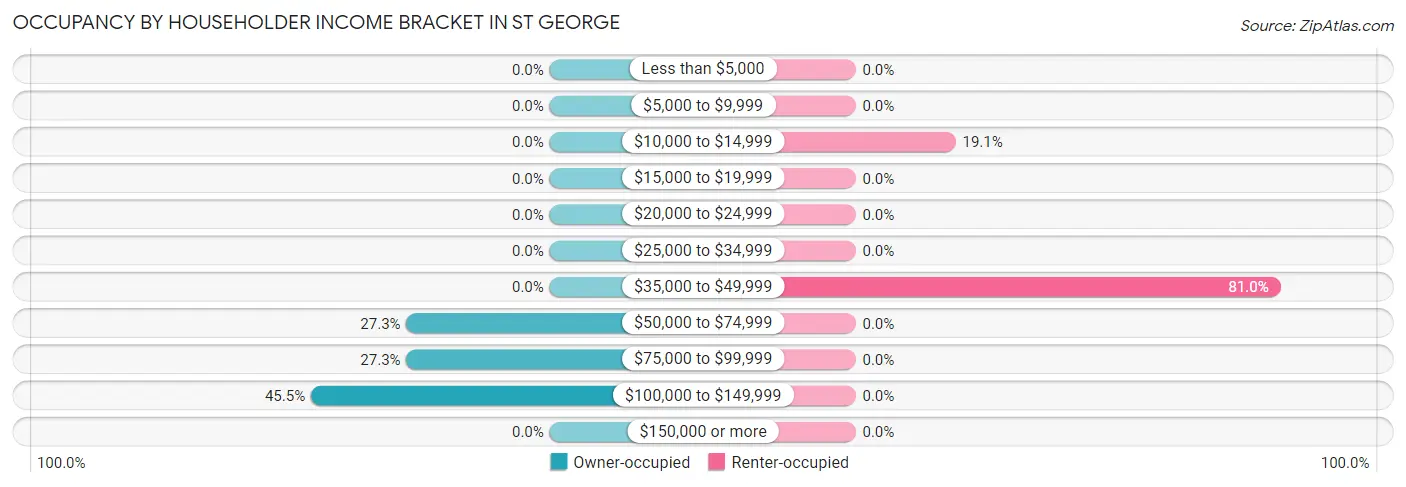
| Income Bracket | Owner-occupied | Renter-occupied |
| Less than $5,000 | 0 (0.0%) | 0 (0.0%) |
| $5,000 to $9,999 | 0 (0.0%) | 0 (0.0%) |
| $10,000 to $14,999 | 0 (0.0%) | 4 (19.1%) |
| $15,000 to $19,999 | 0 (0.0%) | 0 (0.0%) |
| $20,000 to $24,999 | 0 (0.0%) | 0 (0.0%) |
| $25,000 to $34,999 | 0 (0.0%) | 0 (0.0%) |
| $35,000 to $49,999 | 0 (0.0%) | 17 (80.9%) |
| $50,000 to $74,999 | 3 (27.3%) | 0 (0.0%) |
| $75,000 to $99,999 | 3 (27.3%) | 0 (0.0%) |
| $100,000 to $149,999 | 5 (45.5%) | 0 (0.0%) |
| $150,000 or more | 0 (0.0%) | 0 (0.0%) |
| Total | 11 (100.0%) | 21 (100.0%) |
Monthly Housing Cost Tiers in St George
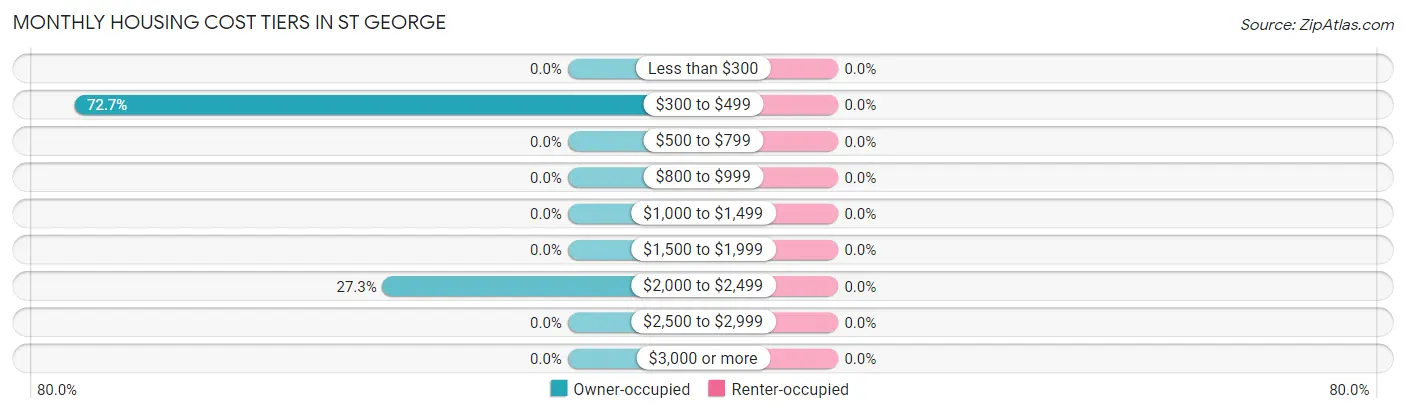
| Monthly Cost | Owner-occupied | Renter-occupied |
| Less than $300 | 0 (0.0%) | 0 (0.0%) |
| $300 to $499 | 8 (72.7%) | 0 (0.0%) |
| $500 to $799 | 0 (0.0%) | 0 (0.0%) |
| $800 to $999 | 0 (0.0%) | 0 (0.0%) |
| $1,000 to $1,499 | 0 (0.0%) | 0 (0.0%) |
| $1,500 to $1,999 | 0 (0.0%) | 0 (0.0%) |
| $2,000 to $2,499 | 3 (27.3%) | 0 (0.0%) |
| $2,500 to $2,999 | 0 (0.0%) | 0 (0.0%) |
| $3,000 or more | 0 (0.0%) | 0 (0.0%) |
| Total | 11 (100.0%) | 21 (100.0%) |
Physical Housing Characteristics in St George
Housing Structures in St George
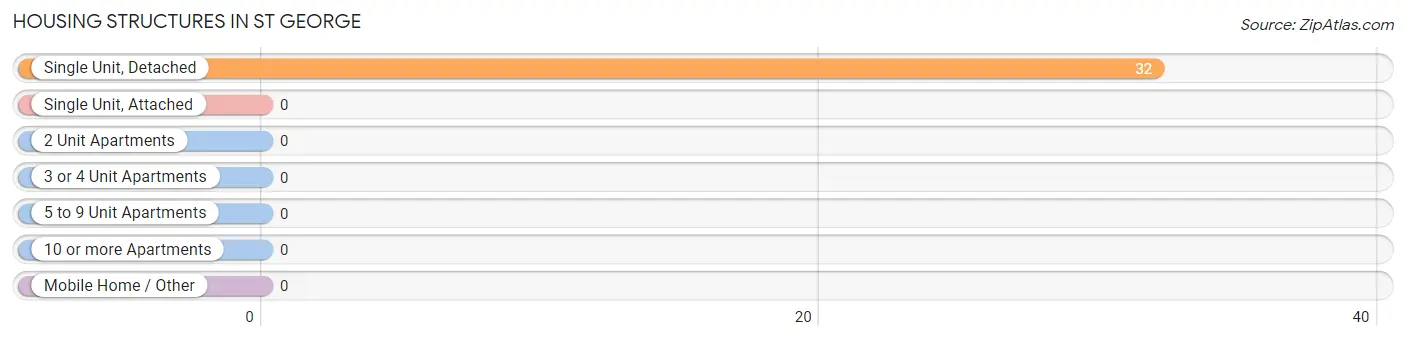
| Structure Type | # Housing Units | % Housing Units |
| Single Unit, Detached | 32 | 100.0% |
| Single Unit, Attached | 0 | 0.0% |
| 2 Unit Apartments | 0 | 0.0% |
| 3 or 4 Unit Apartments | 0 | 0.0% |
| 5 to 9 Unit Apartments | 0 | 0.0% |
| 10 or more Apartments | 0 | 0.0% |
| Mobile Home / Other | 0 | 0.0% |
| Total | 32 | 100.0% |
Housing Structures by Occupancy in St George
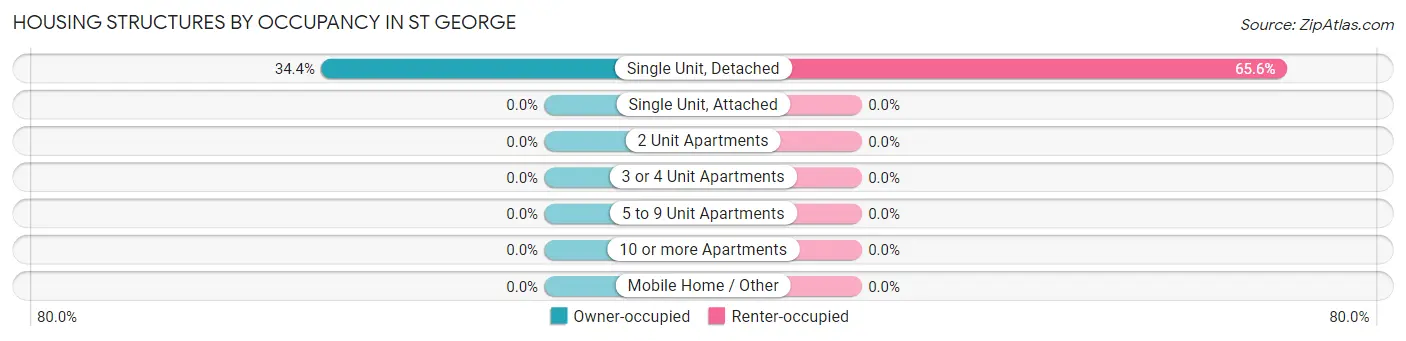
| Structure Type | Owner-occupied | Renter-occupied |
| Single Unit, Detached | 11 (34.4%) | 21 (65.6%) |
| Single Unit, Attached | 0 (0.0%) | 0 (0.0%) |
| 2 Unit Apartments | 0 (0.0%) | 0 (0.0%) |
| 3 or 4 Unit Apartments | 0 (0.0%) | 0 (0.0%) |
| 5 to 9 Unit Apartments | 0 (0.0%) | 0 (0.0%) |
| 10 or more Apartments | 0 (0.0%) | 0 (0.0%) |
| Mobile Home / Other | 0 (0.0%) | 0 (0.0%) |
| Total | 11 (34.4%) | 21 (65.6%) |
Housing Structures by Number of Rooms in St George
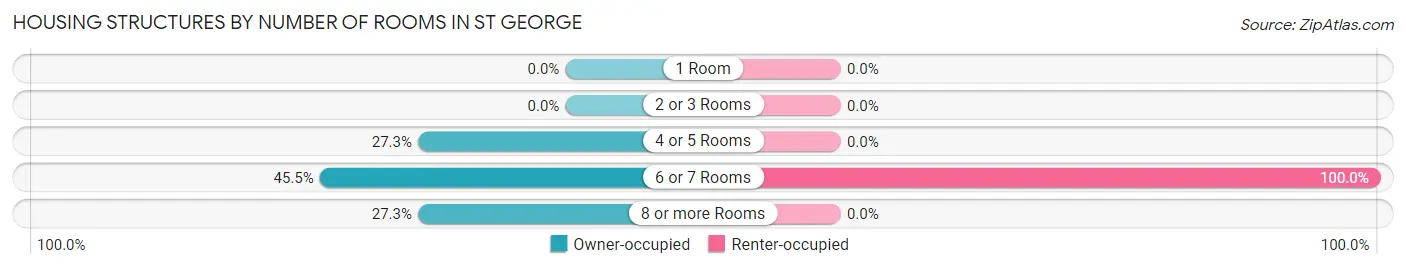
| Number of Rooms | Owner-occupied | Renter-occupied |
| 1 Room | 0 (0.0%) | 0 (0.0%) |
| 2 or 3 Rooms | 0 (0.0%) | 0 (0.0%) |
| 4 or 5 Rooms | 3 (27.3%) | 0 (0.0%) |
| 6 or 7 Rooms | 5 (45.5%) | 21 (100.0%) |
| 8 or more Rooms | 3 (27.3%) | 0 (0.0%) |
| Total | 11 (100.0%) | 21 (100.0%) |
Housing Structure by Heating Type in St George
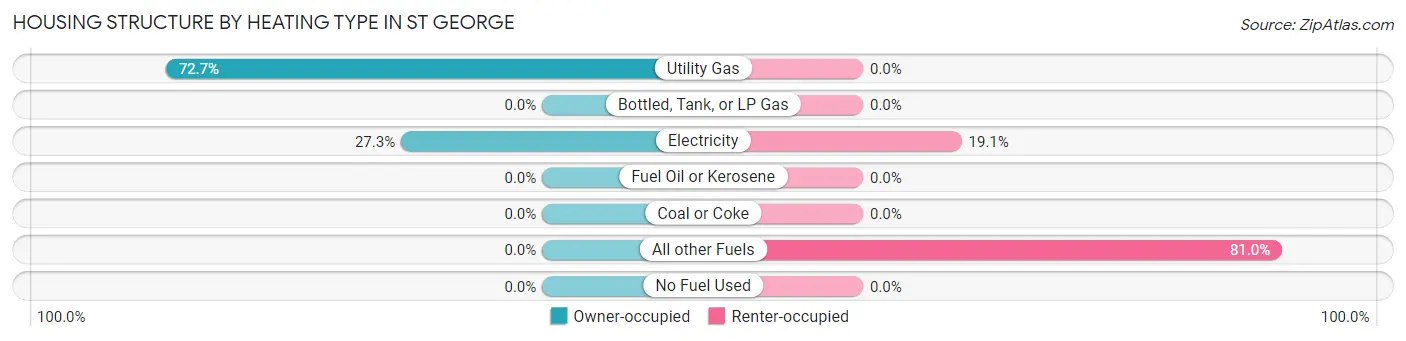
| Heating Type | Owner-occupied | Renter-occupied |
| Utility Gas | 8 (72.7%) | 0 (0.0%) |
| Bottled, Tank, or LP Gas | 0 (0.0%) | 0 (0.0%) |
| Electricity | 3 (27.3%) | 4 (19.1%) |
| Fuel Oil or Kerosene | 0 (0.0%) | 0 (0.0%) |
| Coal or Coke | 0 (0.0%) | 0 (0.0%) |
| All other Fuels | 0 (0.0%) | 17 (80.9%) |
| No Fuel Used | 0 (0.0%) | 0 (0.0%) |
| Total | 11 (100.0%) | 21 (100.0%) |
Household Vehicle Usage in St George
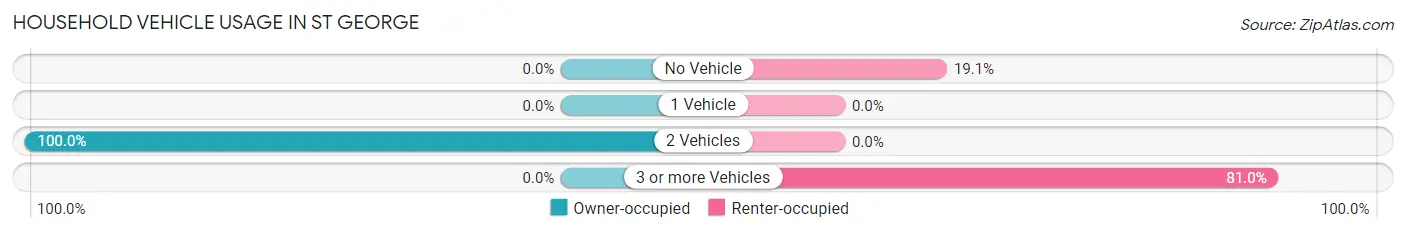
| Vehicles per Household | Owner-occupied | Renter-occupied |
| No Vehicle | 0 (0.0%) | 4 (19.1%) |
| 1 Vehicle | 0 (0.0%) | 0 (0.0%) |
| 2 Vehicles | 11 (100.0%) | 0 (0.0%) |
| 3 or more Vehicles | 0 (0.0%) | 17 (80.9%) |
| Total | 11 (100.0%) | 21 (100.0%) |
Real Estate & Mortgages in St George
Real Estate and Mortgage Overview in St George
| Characteristic | Without Mortgage | With Mortgage |
| Housing Units | 8 | 3 |
| Median Property Value | - | - |
| Median Household Income | - | - |
| Monthly Housing Costs | - | - |
| Real Estate Taxes | - | - |
Property Value by Mortgage Status in St George
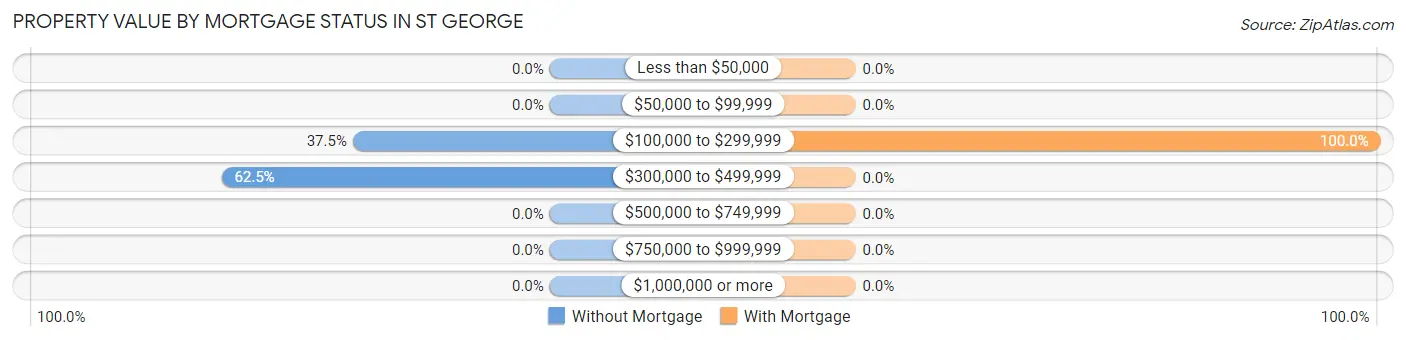
| Property Value | Without Mortgage | With Mortgage |
| Less than $50,000 | 0 (0.0%) | 0 (0.0%) |
| $50,000 to $99,999 | 0 (0.0%) | 0 (0.0%) |
| $100,000 to $299,999 | 3 (37.5%) | 3 (100.0%) |
| $300,000 to $499,999 | 5 (62.5%) | 0 (0.0%) |
| $500,000 to $749,999 | 0 (0.0%) | 0 (0.0%) |
| $750,000 to $999,999 | 0 (0.0%) | 0 (0.0%) |
| $1,000,000 or more | 0 (0.0%) | 0 (0.0%) |
| Total | 8 (100.0%) | 3 (100.0%) |
Household Income by Mortgage Status in St George
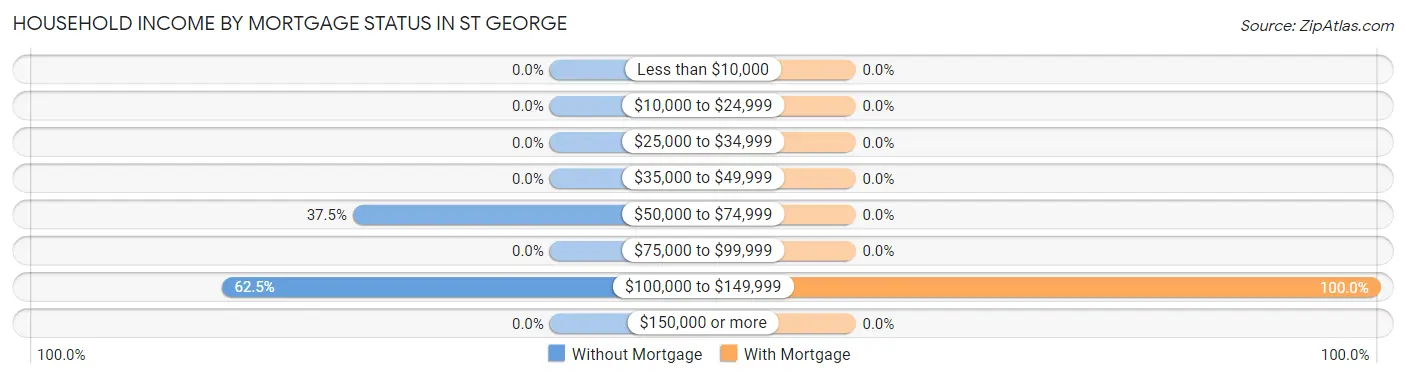
| Household Income | Without Mortgage | With Mortgage |
| Less than $10,000 | 0 (0.0%) | 0 (0.0%) |
| $10,000 to $24,999 | 0 (0.0%) | 0 (0.0%) |
| $25,000 to $34,999 | 0 (0.0%) | 0 (0.0%) |
| $35,000 to $49,999 | 0 (0.0%) | 0 (0.0%) |
| $50,000 to $74,999 | 3 (37.5%) | 0 (0.0%) |
| $75,000 to $99,999 | 0 (0.0%) | 0 (0.0%) |
| $100,000 to $149,999 | 5 (62.5%) | 3 (100.0%) |
| $150,000 or more | 0 (0.0%) | 0 (0.0%) |
| Total | 8 (100.0%) | 3 (100.0%) |
Property Value to Household Income Ratio in St George
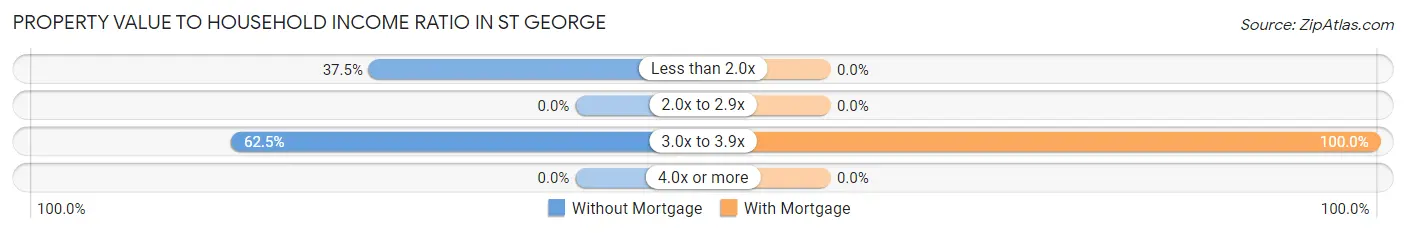
| Value-to-Income Ratio | Without Mortgage | With Mortgage |
| Less than 2.0x | 3 (37.5%) | 0 (0.0%) |
| 2.0x to 2.9x | 0 (0.0%) | 0 (0.0%) |
| 3.0x to 3.9x | 5 (62.5%) | 3 (100.0%) |
| 4.0x or more | 0 (0.0%) | 0 (0.0%) |
| Total | 8 (100.0%) | 3 (100.0%) |
Real Estate Taxes by Mortgage Status in St George

| Property Taxes | Without Mortgage | With Mortgage |
| Less than $800 | 8 (100.0%) | 0 (0.0%) |
| $800 to $1,499 | 0 (0.0%) | 3 (100.0%) |
| $800 to $1,499 | 0 (0.0%) | 0 (0.0%) |
| Total | 8 (100.0%) | 3 (100.0%) |
Health & Disability in St George
Health Insurance Coverage by Age in St George
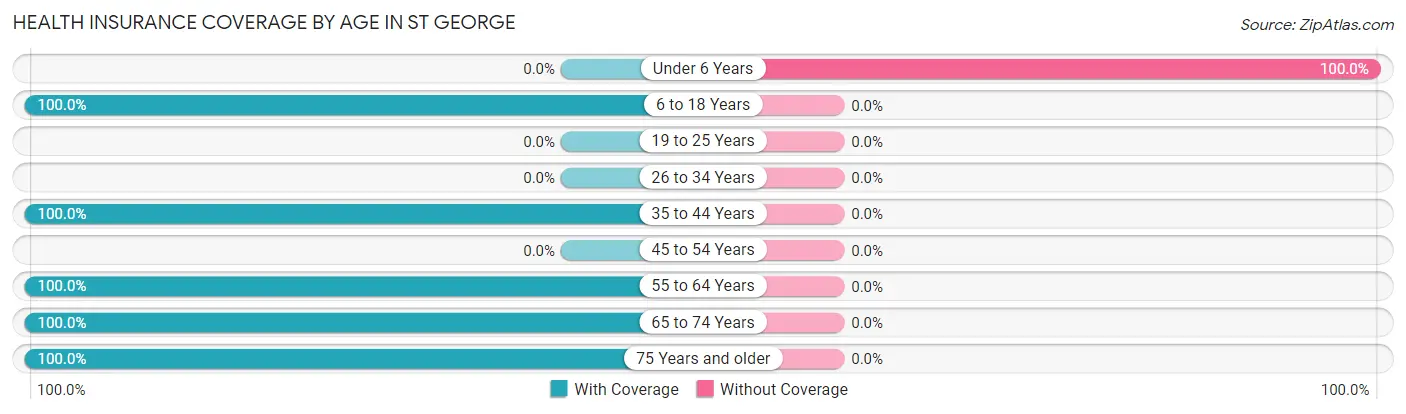
| Age Bracket | With Coverage | Without Coverage |
| Under 6 Years | 0 (0.0%) | 10 (100.0%) |
| 6 to 18 Years | 12 (100.0%) | 0 (0.0%) |
| 19 to 25 Years | 0 (0.0%) | 0 (0.0%) |
| 26 to 34 Years | 0 (0.0%) | 0 (0.0%) |
| 35 to 44 Years | 33 (100.0%) | 0 (0.0%) |
| 45 to 54 Years | 0 (0.0%) | 0 (0.0%) |
| 55 to 64 Years | 18 (100.0%) | 0 (0.0%) |
| 65 to 74 Years | 6 (100.0%) | 0 (0.0%) |
| 75 Years and older | 4 (100.0%) | 0 (0.0%) |
| Total | 73 (87.9%) | 10 (12.0%) |
Health Insurance Coverage by Citizenship Status in St George

| Citizenship Status | With Coverage | Without Coverage |
| Native Born | 0 (0.0%) | 10 (100.0%) |
| Foreign Born, Citizen | 12 (100.0%) | 0 (0.0%) |
| Foreign Born, not a Citizen | 0 (0.0%) | 0 (0.0%) |
Health Insurance Coverage by Household Income in St George
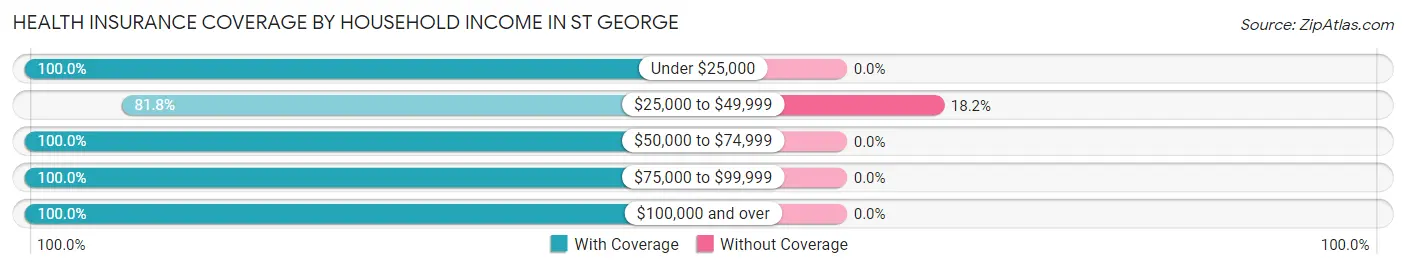
| Household Income | With Coverage | Without Coverage |
| Under $25,000 | 4 (100.0%) | 0 (0.0%) |
| $25,000 to $49,999 | 45 (81.8%) | 10 (18.2%) |
| $50,000 to $74,999 | 6 (100.0%) | 0 (0.0%) |
| $75,000 to $99,999 | 7 (100.0%) | 0 (0.0%) |
| $100,000 and over | 11 (100.0%) | 0 (0.0%) |
Public vs Private Health Insurance Coverage by Age in St George
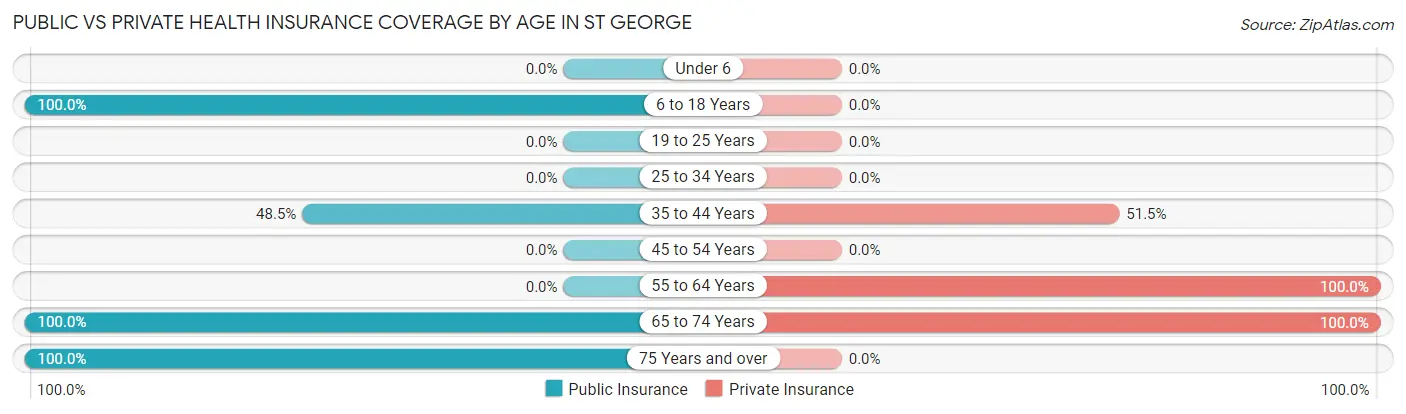
| Age Bracket | Public Insurance | Private Insurance |
| Under 6 | 0 (0.0%) | 0 (0.0%) |
| 6 to 18 Years | 12 (100.0%) | 0 (0.0%) |
| 19 to 25 Years | 0 (0.0%) | 0 (0.0%) |
| 25 to 34 Years | 0 (0.0%) | 0 (0.0%) |
| 35 to 44 Years | 16 (48.5%) | 17 (51.5%) |
| 45 to 54 Years | 0 (0.0%) | 0 (0.0%) |
| 55 to 64 Years | 0 (0.0%) | 18 (100.0%) |
| 65 to 74 Years | 6 (100.0%) | 6 (100.0%) |
| 75 Years and over | 4 (100.0%) | 0 (0.0%) |
| Total | 38 (45.8%) | 41 (49.4%) |
Disability Status by Sex by Age in St George
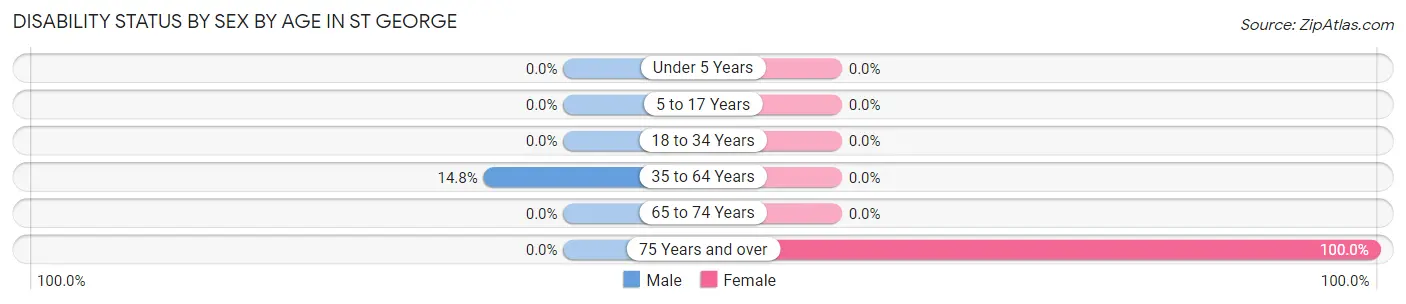
| Age Bracket | Male | Female |
| Under 5 Years | 0 (0.0%) | 0 (0.0%) |
| 5 to 17 Years | 0 (0.0%) | 0 (0.0%) |
| 18 to 34 Years | 0 (0.0%) | 0 (0.0%) |
| 35 to 64 Years | 4 (14.8%) | 0 (0.0%) |
| 65 to 74 Years | 0 (0.0%) | 0 (0.0%) |
| 75 Years and over | 0 (0.0%) | 4 (100.0%) |
Disability Class by Sex by Age in St George
Disability Class: Hearing Difficulty
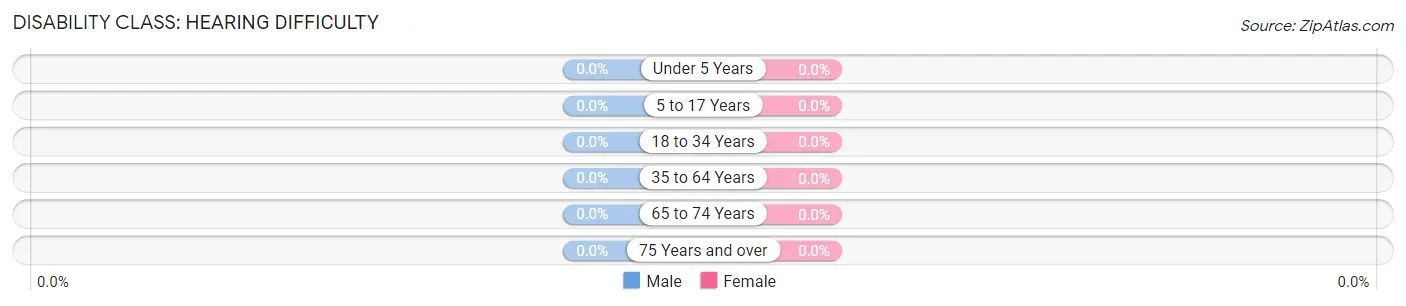
| Age Bracket | Male | Female |
| Under 5 Years | 0 (0.0%) | 0 (0.0%) |
| 5 to 17 Years | 0 (0.0%) | 0 (0.0%) |
| 18 to 34 Years | 0 (0.0%) | 0 (0.0%) |
| 35 to 64 Years | 0 (0.0%) | 0 (0.0%) |
| 65 to 74 Years | 0 (0.0%) | 0 (0.0%) |
| 75 Years and over | 0 (0.0%) | 0 (0.0%) |
Disability Class: Vision Difficulty
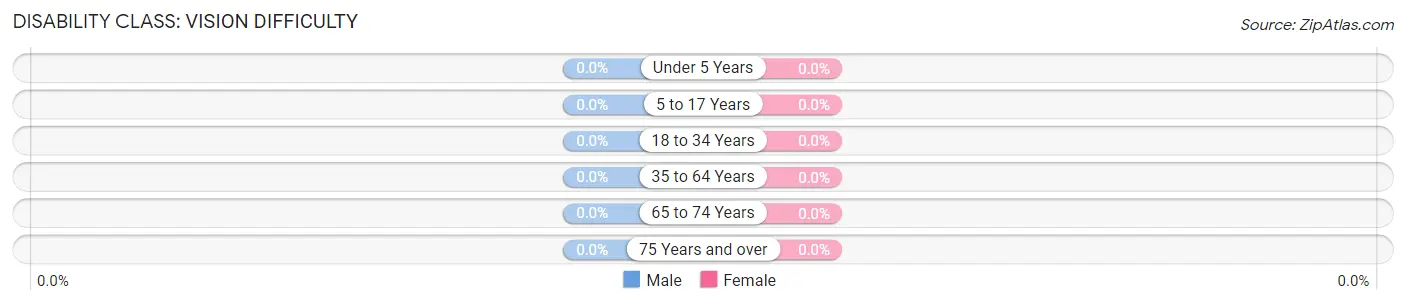
| Age Bracket | Male | Female |
| Under 5 Years | 0 (0.0%) | 0 (0.0%) |
| 5 to 17 Years | 0 (0.0%) | 0 (0.0%) |
| 18 to 34 Years | 0 (0.0%) | 0 (0.0%) |
| 35 to 64 Years | 0 (0.0%) | 0 (0.0%) |
| 65 to 74 Years | 0 (0.0%) | 0 (0.0%) |
| 75 Years and over | 0 (0.0%) | 0 (0.0%) |
Disability Class: Cognitive Difficulty
| Age Bracket | Male | Female |
| 5 to 17 Years | 0 (0.0%) | 0 (0.0%) |
| 18 to 34 Years | 0 (0.0%) | 0 (0.0%) |
| 35 to 64 Years | 0 (0.0%) | 0 (0.0%) |
| 65 to 74 Years | 0 (0.0%) | 0 (0.0%) |
| 75 Years and over | 0 (0.0%) | 0 (0.0%) |
Disability Class: Ambulatory Difficulty
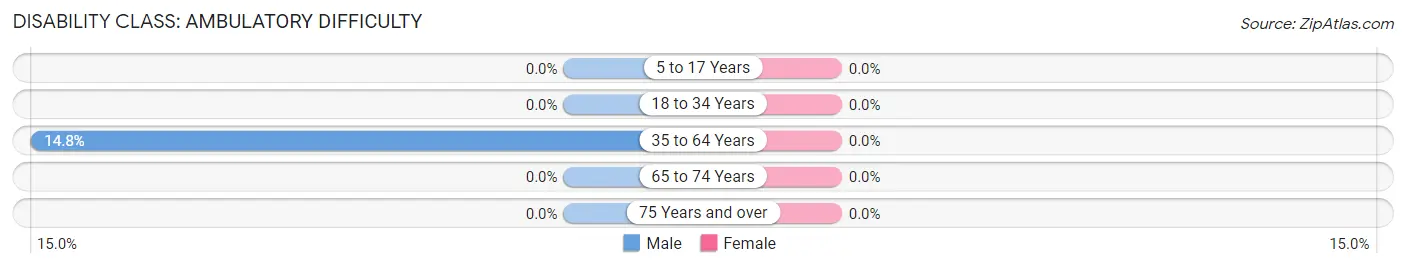
| Age Bracket | Male | Female |
| 5 to 17 Years | 0 (0.0%) | 0 (0.0%) |
| 18 to 34 Years | 0 (0.0%) | 0 (0.0%) |
| 35 to 64 Years | 4 (14.8%) | 0 (0.0%) |
| 65 to 74 Years | 0 (0.0%) | 0 (0.0%) |
| 75 Years and over | 0 (0.0%) | 0 (0.0%) |
Disability Class: Self-Care Difficulty
| Age Bracket | Male | Female |
| 5 to 17 Years | 0 (0.0%) | 0 (0.0%) |
| 18 to 34 Years | 0 (0.0%) | 0 (0.0%) |
| 35 to 64 Years | 0 (0.0%) | 0 (0.0%) |
| 65 to 74 Years | 0 (0.0%) | 0 (0.0%) |
| 75 Years and over | 0 (0.0%) | 0 (0.0%) |
Technology Access in St George
Computing Device Access in St George
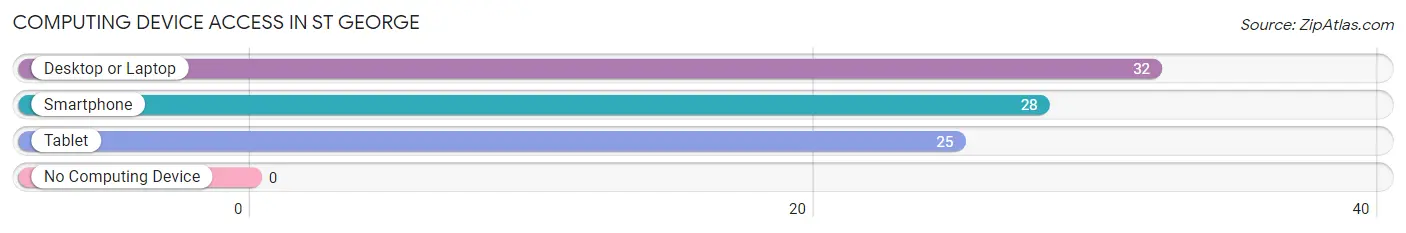
| Device Type | # Households | % Households |
| Desktop or Laptop | 32 | 100.0% |
| Smartphone | 28 | 87.5% |
| Tablet | 25 | 78.1% |
| No Computing Device | 0 | 0.0% |
| Total | 32 | 100.0% |
Internet Access in St George
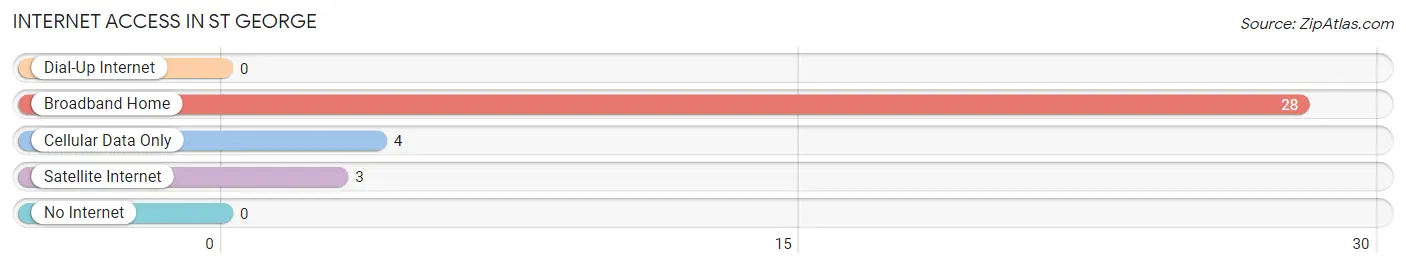
| Internet Type | # Households | % Households |
| Dial-Up Internet | 0 | 0.0% |
| Broadband Home | 28 | 87.5% |
| Cellular Data Only | 4 | 12.5% |
| Satellite Internet | 3 | 9.4% |
| No Internet | 0 | 0.0% |
| Total | 32 | 100.0% |
St George Summary
St. George is a small town located in the eastern part of West Virginia, in the United States. It is situated in the Appalachian Mountains, and is part of the larger area known as the Eastern Panhandle. The town has a population of just over 1,000 people, and is located in Grant County.
History
St. George was founded in 1820 by a group of settlers from Pennsylvania. The town was named after St. George, the patron saint of England. The settlers were mostly of German and English descent, and the town was originally a farming community. The town was incorporated in 1872, and the first post office was established in 1873.
In the late 19th century, St. George became a popular tourist destination, due to its proximity to the nearby mountains. The town was also known for its mineral springs, which were believed to have healing properties.
In the early 20th century, St. George experienced a period of growth and prosperity. The town was home to several businesses, including a hotel, a bank, and a general store. The town also had a railroad station, which connected it to the larger cities in the region.
Geography
St. George is located in the eastern part of West Virginia, in the Appalachian Mountains. The town is situated in Grant County, and is bordered by the Potomac River to the east and the North Fork of the South Branch of the Potomac River to the west. The town is located at an elevation of 1,890 feet above sea level.
The climate in St. George is classified as humid continental, with hot summers and cold winters. The average annual temperature is around 50 degrees Fahrenheit, and the average annual precipitation is around 40 inches.
Economy
The economy of St. George is largely based on tourism and agriculture. The town is home to several tourist attractions, including the St. George Mineral Springs, which are believed to have healing properties. The town is also home to several farms, which produce a variety of crops, including corn, soybeans, and hay.
The town is also home to several small businesses, including restaurants, shops, and a bank. The town is served by the Grant County Airport, which provides air service to the larger cities in the region.
Demographics
As of the 2010 census, the population of St. George was 1,039. The racial makeup of the town was 97.3% White, 0.7% African American, 0.3% Native American, 0.2% Asian, and 1.5% from other races. The median household income was $37,500, and the median family income was $45,000.
The town is served by the Grant County School District, which includes two elementary schools, one middle school, and one high school. The town is also home to a branch of the Potomac State College of West Virginia University.
St. George is a small town with a rich history and a vibrant economy. The town is home to several tourist attractions, and is a popular destination for outdoor enthusiasts. The town is also home to several small businesses, and is served by the Grant County Airport. The town has a population of just over 1,000 people, and is a great place to live and work.
Common Questions
What is Per Capita Income in St George?
Per Capita income in St George is $21,810.
What is Inequality or Gini Index in St George?
Inequality or Gini Index in St George is 0.30.
What is the Total Population of St George?
Total Population of St George is 83.
What is the Total Male Population of St George?
Total Male Population of St George is 30.
What is the Total Female Population of St George?
Total Female Population of St George is 53.
What is the Ratio of Males per 100 Females in St George?
There are 56.60 Males per 100 Females in St George.
What is the Ratio of Females per 100 Males in St George?
There are 176.67 Females per 100 Males in St George.
What is the Median Population Age in St George?
Median Population Age in St George is 38.6 Years.
What is the Average Family Size in St George
Average Family Size in St George is 1.8 People.
What is the Average Household Size in St George
Average Household Size in St George is 2.6 People.
How Large is the Labor Force in St George?
There are 51 People in the Labor Forcein in St George.
What is the Percentage of People in the Labor Force in St George?
83.6% of People are in the Labor Force in St George.