Zip Codes with the Highest Percentage of Population Employed in Security & Protection in West Virginia
RELATED REPORTS & OPTIONS
Security & Protection
West Virginia
Compare Zip Codes
Map of Zip Codes with the Highest Percentage of Population Employed in Security & Protection in West Virginia
0.0%
100.0%
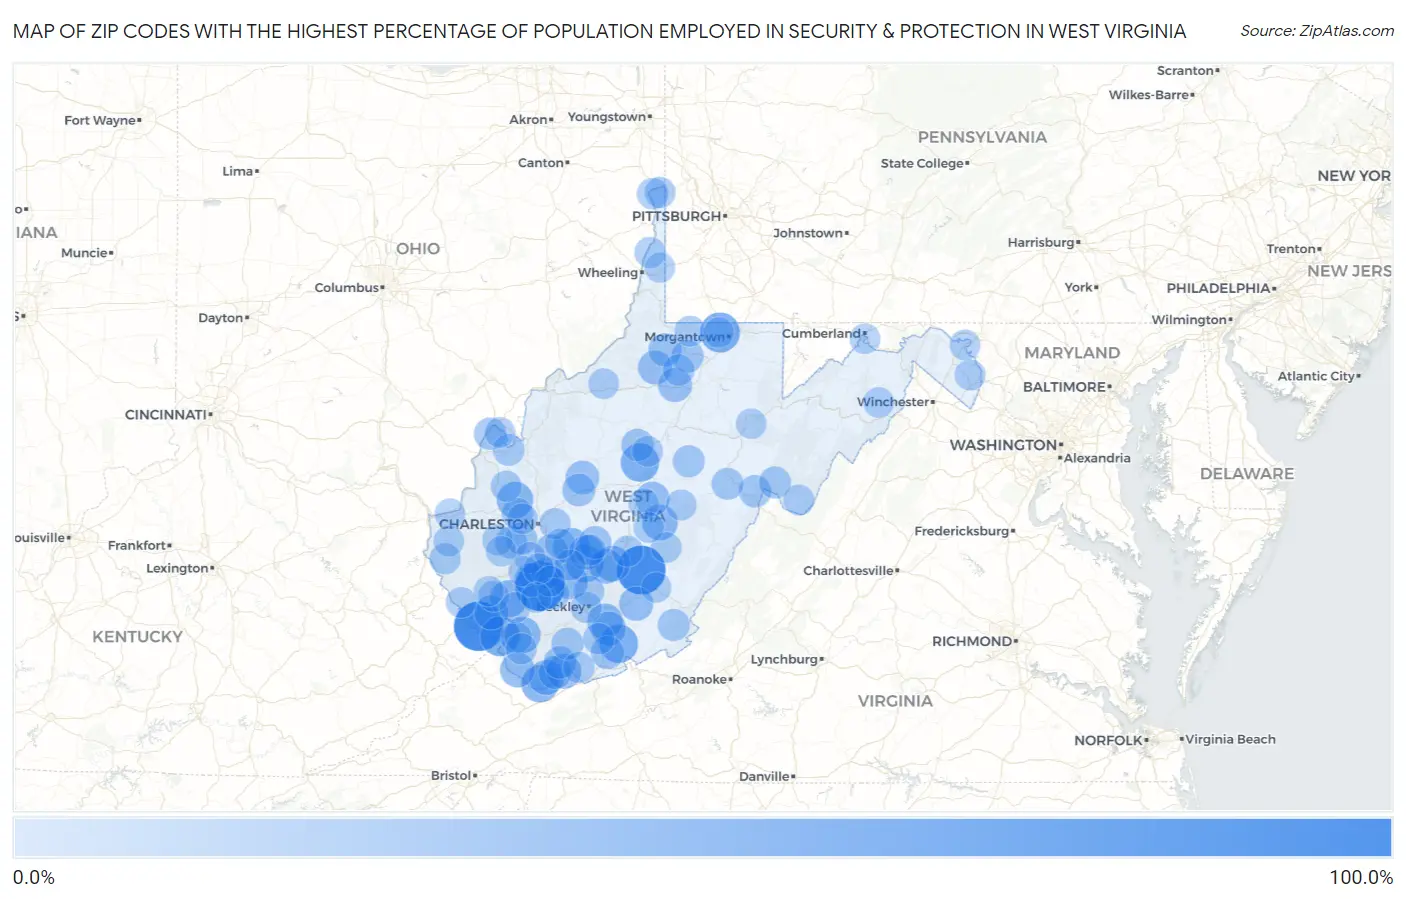
Zip Codes with the Highest Percentage of Population Employed in Security & Protection in West Virginia
| Zip Code | % Employed | vs State | vs National | |
| 1. | 25688 | 80.4% | 2.4%(+78.0)#1 | 2.1%(+78.3)#16 |
| 2. | 25204 | 80.0% | 2.4%(+77.6)#2 | 2.1%(+77.9)#17 |
| 3. | 25972 | 76.7% | 2.4%(+74.3)#3 | 2.1%(+74.6)#18 |
| 4. | 26546 | 41.8% | 2.4%(+39.3)#4 | 2.1%(+39.6)#52 |
| 5. | 25651 | 41.2% | 2.4%(+38.8)#5 | 2.1%(+39.1)#53 |
| 6. | 25979 | 36.8% | 2.4%(+34.4)#6 | 2.1%(+34.7)#61 |
| 7. | 26619 | 36.4% | 2.4%(+33.9)#7 | 2.1%(+34.2)#63 |
| 8. | 24815 | 32.4% | 2.4%(+30.0)#8 | 2.1%(+30.3)#83 |
| 9. | 25646 | 31.0% | 2.4%(+28.6)#9 | 2.1%(+28.9)#91 |
| 10. | 25173 | 30.8% | 2.4%(+28.3)#10 | 2.1%(+28.6)#93 |
| 11. | 25126 | 29.1% | 2.4%(+26.6)#11 | 2.1%(+26.9)#102 |
| 12. | 25011 | 28.9% | 2.4%(+26.4)#12 | 2.1%(+26.7)#103 |
| 13. | 24839 | 27.9% | 2.4%(+25.4)#13 | 2.1%(+25.7)#111 |
| 14. | 25008 | 26.3% | 2.4%(+23.9)#14 | 2.1%(+24.2)#120 |
| 15. | 25989 | 25.3% | 2.4%(+22.9)#15 | 2.1%(+23.2)#127 |
| 16. | 26208 | 25.3% | 2.4%(+22.9)#16 | 2.1%(+23.1)#128 |
| 17. | 25868 | 25.0% | 2.4%(+22.6)#17 | 2.1%(+22.9)#130 |
| 18. | 24884 | 22.7% | 2.4%(+20.3)#18 | 2.1%(+20.6)#153 |
| 19. | 24808 | 22.6% | 2.4%(+20.2)#19 | 2.1%(+20.5)#154 |
| 20. | 24817 | 22.2% | 2.4%(+19.8)#20 | 2.1%(+20.1)#161 |
| 21. | 25090 | 22.2% | 2.4%(+19.8)#21 | 2.1%(+20.1)#163 |
| 22. | 25837 | 21.6% | 2.4%(+19.2)#22 | 2.1%(+19.5)#175 |
| 23. | 25969 | 21.0% | 2.4%(+18.5)#23 | 2.1%(+18.8)#182 |
| 24. | 26203 | 20.0% | 2.4%(+17.6)#24 | 2.1%(+17.9)#190 |
| 25. | 25638 | 20.0% | 2.4%(+17.6)#25 | 2.1%(+17.9)#191 |
| 26. | 25966 | 20.0% | 2.4%(+17.6)#26 | 2.1%(+17.9)#197 |
| 27. | 26339 | 19.4% | 2.4%(+16.9)#27 | 2.1%(+17.2)#213 |
| 28. | 26422 | 19.2% | 2.4%(+16.8)#28 | 2.1%(+17.0)#219 |
| 29. | 25206 | 18.1% | 2.4%(+15.6)#29 | 2.1%(+15.9)#249 |
| 30. | 25035 | 18.0% | 2.4%(+15.5)#30 | 2.1%(+15.8)#255 |
| 31. | 25259 | 17.4% | 2.4%(+15.0)#31 | 2.1%(+15.3)#270 |
| 32. | 26437 | 16.5% | 2.4%(+14.1)#32 | 2.1%(+14.4)#295 |
| 33. | 24712 | 16.2% | 2.4%(+13.7)#33 | 2.1%(+14.0)#308 |
| 34. | 24871 | 15.4% | 2.4%(+13.0)#34 | 2.1%(+13.3)#342 |
| 35. | 26690 | 14.5% | 2.4%(+12.1)#35 | 2.1%(+12.4)#388 |
| 36. | 25005 | 14.2% | 2.4%(+11.7)#36 | 2.1%(+12.0)#407 |
| 37. | 24831 | 13.5% | 2.4%(+11.1)#37 | 2.1%(+11.4)#445 |
| 38. | 26572 | 13.3% | 2.4%(+10.9)#38 | 2.1%(+11.1)#462 |
| 39. | 26430 | 13.1% | 2.4%(+10.7)#39 | 2.1%(+11.0)#470 |
| 40. | 24920 | 12.7% | 2.4%(+10.3)#40 | 2.1%(+10.6)#494 |
| 41. | 24726 | 12.3% | 2.4%(+9.85)#41 | 2.1%(+10.1)#529 |
| 42. | 25193 | 12.0% | 2.4%(+9.53)#42 | 2.1%(+9.81)#553 |
| 43. | 25567 | 11.8% | 2.4%(+9.38)#43 | 2.1%(+9.66)#568 |
| 44. | 26234 | 11.6% | 2.4%(+9.14)#44 | 2.1%(+9.42)#590 |
| 45. | 24974 | 11.5% | 2.4%(+9.09)#45 | 2.1%(+9.37)#599 |
| 46. | 25287 | 11.5% | 2.4%(+9.08)#46 | 2.1%(+9.36)#602 |
| 47. | 26804 | 11.5% | 2.4%(+9.07)#47 | 2.1%(+9.35)#603 |
| 48. | 26273 | 10.8% | 2.4%(+8.41)#48 | 2.1%(+8.68)#663 |
| 49. | 25003 | 10.5% | 2.4%(+8.08)#49 | 2.1%(+8.36)#702 |
| 50. | 26386 | 10.0% | 2.4%(+7.61)#50 | 2.1%(+7.89)#759 |
| 51. | 25143 | 9.8% | 2.4%(+7.42)#51 | 2.1%(+7.69)#788 |
| 52. | 25264 | 9.5% | 2.4%(+7.06)#52 | 2.1%(+7.33)#842 |
| 53. | 25841 | 9.0% | 2.4%(+6.57)#53 | 2.1%(+6.85)#915 |
| 54. | 25517 | 8.6% | 2.4%(+6.13)#54 | 2.1%(+6.41)#997 |
| 55. | 26050 | 8.5% | 2.4%(+6.04)#55 | 2.1%(+6.31)#1,021 |
| 56. | 25201 | 8.4% | 2.4%(+6.01)#56 | 2.1%(+6.29)#1,029 |
| 57. | 25140 | 8.4% | 2.4%(+5.96)#57 | 2.1%(+6.23)#1,044 |
| 58. | 24737 | 8.3% | 2.4%(+5.89)#58 | 2.1%(+6.17)#1,071 |
| 59. | 25085 | 8.1% | 2.4%(+5.72)#59 | 2.1%(+6.00)#1,110 |
| 60. | 25637 | 7.9% | 2.4%(+5.47)#60 | 2.1%(+5.75)#1,201 |
| 61. | 26034 | 7.8% | 2.4%(+5.40)#61 | 2.1%(+5.67)#1,232 |
| 62. | 24869 | 7.8% | 2.4%(+5.35)#62 | 2.1%(+5.63)#1,249 |
| 63. | 25871 | 7.6% | 2.4%(+5.17)#63 | 2.1%(+5.45)#1,297 |
| 64. | 26075 | 7.6% | 2.4%(+5.13)#64 | 2.1%(+5.41)#1,308 |
| 65. | 26684 | 7.6% | 2.4%(+5.13)#65 | 2.1%(+5.41)#1,309 |
| 66. | 25033 | 7.3% | 2.4%(+4.92)#66 | 2.1%(+5.19)#1,384 |
| 67. | 25880 | 7.3% | 2.4%(+4.85)#67 | 2.1%(+5.13)#1,408 |
| 68. | 24844 | 7.2% | 2.4%(+4.81)#68 | 2.1%(+5.09)#1,425 |
| 69. | 25606 | 7.2% | 2.4%(+4.77)#69 | 2.1%(+5.05)#1,441 |
| 70. | 25154 | 7.1% | 2.4%(+4.67)#70 | 2.1%(+4.94)#1,494 |
| 71. | 26335 | 6.9% | 2.4%(+4.48)#71 | 2.1%(+4.76)#1,575 |
| 72. | 25083 | 6.8% | 2.4%(+4.35)#72 | 2.1%(+4.63)#1,639 |
| 73. | 25521 | 6.6% | 2.4%(+4.22)#73 | 2.1%(+4.50)#1,717 |
| 74. | 26815 | 6.6% | 2.4%(+4.15)#74 | 2.1%(+4.42)#1,754 |
| 75. | 26590 | 6.6% | 2.4%(+4.15)#75 | 2.1%(+4.42)#1,756 |
| 76. | 25442 | 6.5% | 2.4%(+4.10)#76 | 2.1%(+4.38)#1,777 |
| 77. | 25130 | 6.5% | 2.4%(+4.05)#77 | 2.1%(+4.33)#1,793 |
| 78. | 25685 | 6.4% | 2.4%(+3.97)#78 | 2.1%(+4.24)#1,832 |
| 79. | 25209 | 6.3% | 2.4%(+3.91)#79 | 2.1%(+4.19)#1,872 |
| 80. | 26288 | 6.3% | 2.4%(+3.90)#80 | 2.1%(+4.18)#1,878 |
| 81. | 25181 | 6.3% | 2.4%(+3.90)#81 | 2.1%(+4.18)#1,879 |
| 82. | 26261 | 6.2% | 2.4%(+3.74)#82 | 2.1%(+4.01)#1,973 |
| 83. | 25570 | 6.1% | 2.4%(+3.69)#83 | 2.1%(+3.97)#2,003 |
| 84. | 25419 | 6.1% | 2.4%(+3.66)#84 | 2.1%(+3.94)#2,023 |
| 85. | 25112 | 6.1% | 2.4%(+3.63)#85 | 2.1%(+3.91)#2,037 |
| 86. | 26346 | 6.0% | 2.4%(+3.54)#86 | 2.1%(+3.82)#2,101 |
| 87. | 26714 | 5.9% | 2.4%(+3.46)#87 | 2.1%(+3.73)#2,156 |
| 88. | 25265 | 5.8% | 2.4%(+3.37)#88 | 2.1%(+3.65)#2,205 |
| 89. | 26610 | 5.7% | 2.4%(+3.23)#89 | 2.1%(+3.51)#2,317 |
| 90. | 25501 | 5.6% | 2.4%(+3.17)#90 | 2.1%(+3.45)#2,371 |
| 91. | 26205 | 5.5% | 2.4%(+3.08)#91 | 2.1%(+3.36)#2,447 |
| 92. | 25703 | 5.5% | 2.4%(+3.05)#92 | 2.1%(+3.33)#2,469 |
| 93. | 24931 | 5.5% | 2.4%(+3.05)#93 | 2.1%(+3.33)#2,471 |
| 94. | 26767 | 5.4% | 2.4%(+2.93)#94 | 2.1%(+3.21)#2,576 |
| 95. | 26541 | 5.3% | 2.4%(+2.89)#95 | 2.1%(+3.17)#2,617 |
| 96. | 25067 | 5.2% | 2.4%(+2.77)#96 | 2.1%(+3.04)#2,717 |
| 97. | 25208 | 5.1% | 2.4%(+2.65)#97 | 2.1%(+2.92)#2,842 |
| 98. | 26060 | 5.0% | 2.4%(+2.59)#98 | 2.1%(+2.87)#2,907 |
| 99. | 26276 | 5.0% | 2.4%(+2.59)#99 | 2.1%(+2.86)#2,910 |
| 100. | 25649 | 4.9% | 2.4%(+2.52)#100 | 2.1%(+2.80)#2,989 |
Common Questions
What are the Top 10 Zip Codes with the Highest Percentage of Population Employed in Security & Protection in West Virginia?
Top 10 Zip Codes with the Highest Percentage of Population Employed in Security & Protection in West Virginia are:
What zip code has the Highest Percentage of Population Employed in Security & Protection in West Virginia?
25688 has the Highest Percentage of Population Employed in Security & Protection in West Virginia with 80.4%.
What is the Percentage of Population Employed in Security & Protection in the State of West Virginia?
Percentage of Population Employed in Security & Protection in West Virginia is 2.4%.
What is the Percentage of Population Employed in Security & Protection in the United States?
Percentage of Population Employed in Security & Protection in the United States is 2.1%.