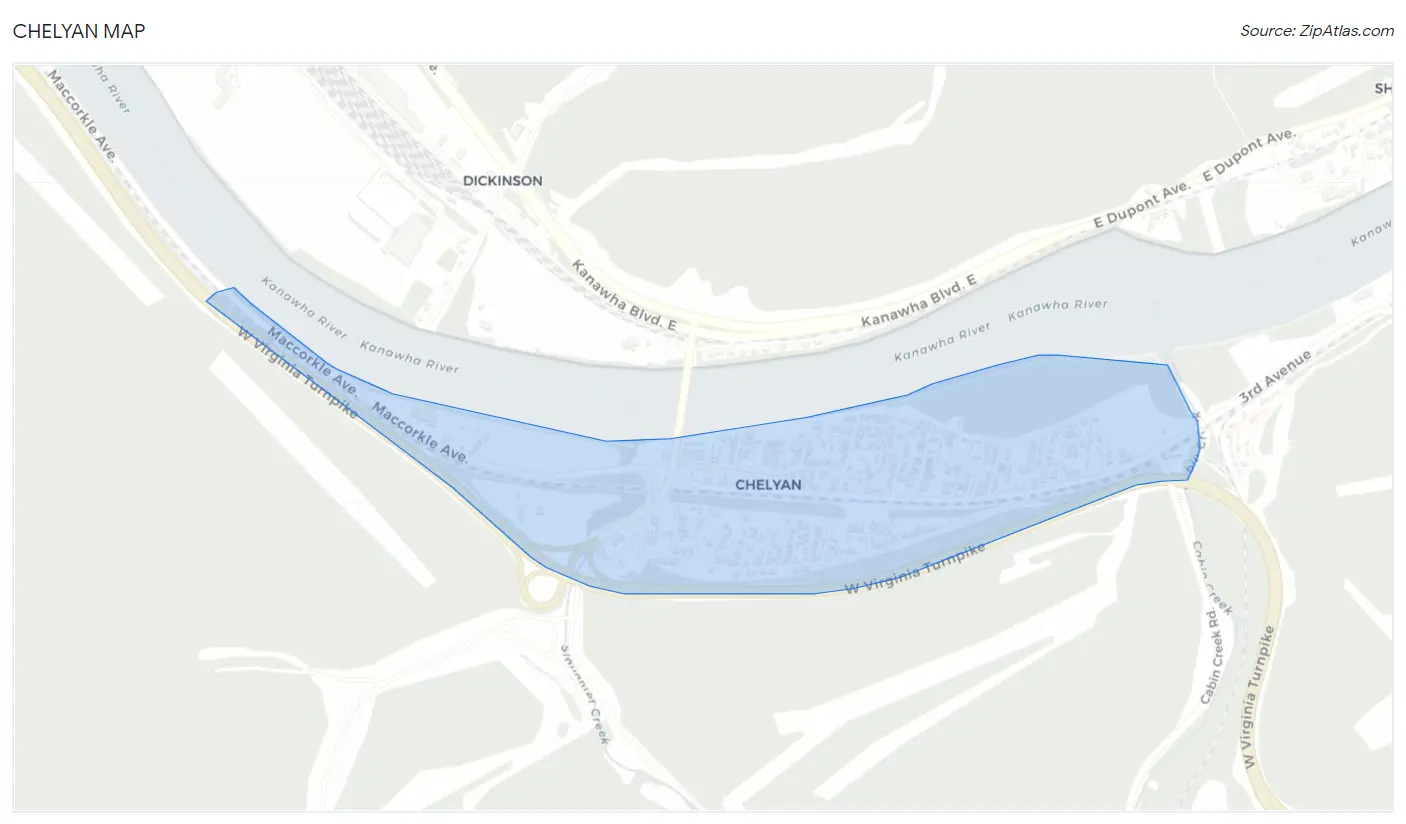
Chelyan, WV Map & Demographics
Chelyan Map
Chelyan Overview
$29,724
PER CAPITA INCOME
$72,304
AVG FAMILY INCOME
$72,059
AVG HOUSEHOLD INCOME
0.30
INEQUALITY / GINI INDEX
452
TOTAL POPULATION
162
MALE POPULATION
290
FEMALE POPULATION
55.86
MALES / 100 FEMALES
179.01
FEMALES / 100 MALES
24.3
MEDIAN AGE
3.8
AVG FAMILY SIZE
3.5
AVG HOUSEHOLD SIZE
155
LABOR FORCE [ PEOPLE ]
50.3%
PERCENT IN LABOR FORCE
Income in Chelyan
Income Overview in Chelyan
Per Capita Income in Chelyan is $29,724, while median incomes of families and households are $72,304 and $72,059 respectively.
| Characteristic | Number | Measure |
| Per Capita Income | 452 | $29,724 |
| Median Family Income | 118 | $72,304 |
| Mean Family Income | 118 | $106,448 |
| Median Household Income | 128 | $72,059 |
| Mean Household Income | 128 | $99,409 |
| Income Deficit | 118 | $0 |
| Wage / Income Gap (%) | 452 | 0.00% |
| Wage / Income Gap ($) | 452 | 100.00¢ per $1 |
| Gini / Inequality Index | 452 | 0.30 |
Earnings by Sex in Chelyan
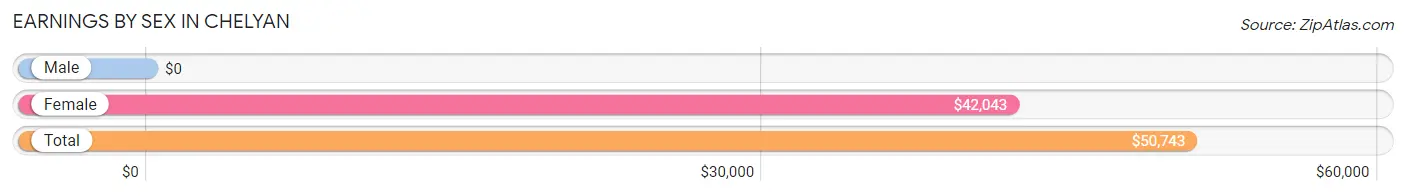
| Sex | Number | Average Earnings |
| Male | 37 (18.0%) | $0 |
| Female | 169 (82.0%) | $42,043 |
| Total | 206 (100.0%) | $50,743 |
Earnings by Sex by Income Bracket in Chelyan
The most common earnings brackets in Chelyan are $50,000 to $54,999 for men (37 | 100.0%) and $55,000 to $64,999 for women (59 | 34.9%).
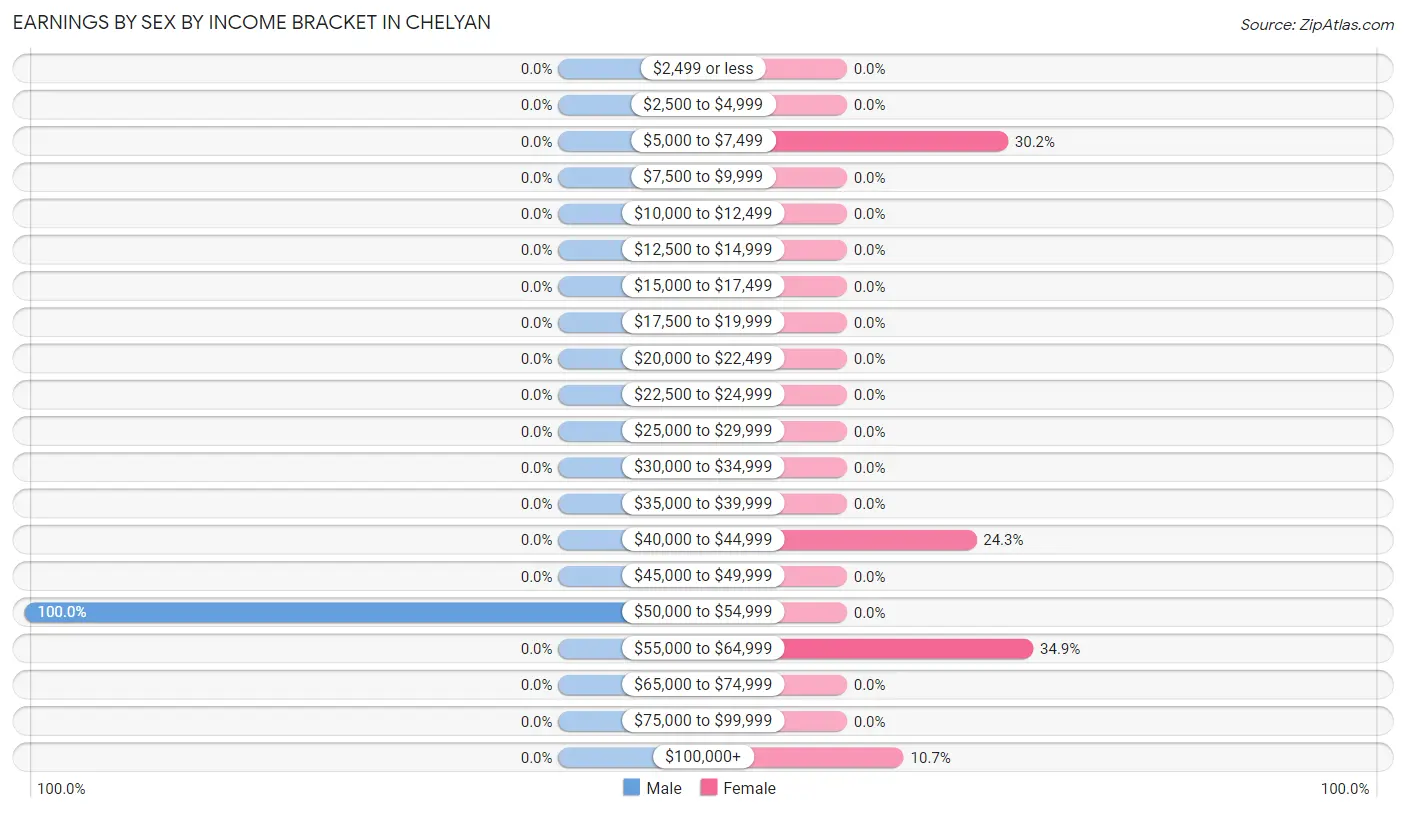
| Income | Male | Female |
| $2,499 or less | 0 (0.0%) | 0 (0.0%) |
| $2,500 to $4,999 | 0 (0.0%) | 0 (0.0%) |
| $5,000 to $7,499 | 0 (0.0%) | 51 (30.2%) |
| $7,500 to $9,999 | 0 (0.0%) | 0 (0.0%) |
| $10,000 to $12,499 | 0 (0.0%) | 0 (0.0%) |
| $12,500 to $14,999 | 0 (0.0%) | 0 (0.0%) |
| $15,000 to $17,499 | 0 (0.0%) | 0 (0.0%) |
| $17,500 to $19,999 | 0 (0.0%) | 0 (0.0%) |
| $20,000 to $22,499 | 0 (0.0%) | 0 (0.0%) |
| $22,500 to $24,999 | 0 (0.0%) | 0 (0.0%) |
| $25,000 to $29,999 | 0 (0.0%) | 0 (0.0%) |
| $30,000 to $34,999 | 0 (0.0%) | 0 (0.0%) |
| $35,000 to $39,999 | 0 (0.0%) | 0 (0.0%) |
| $40,000 to $44,999 | 0 (0.0%) | 41 (24.3%) |
| $45,000 to $49,999 | 0 (0.0%) | 0 (0.0%) |
| $50,000 to $54,999 | 37 (100.0%) | 0 (0.0%) |
| $55,000 to $64,999 | 0 (0.0%) | 59 (34.9%) |
| $65,000 to $74,999 | 0 (0.0%) | 0 (0.0%) |
| $75,000 to $99,999 | 0 (0.0%) | 0 (0.0%) |
| $100,000+ | 0 (0.0%) | 18 (10.6%) |
| Total | 37 (100.0%) | 169 (100.0%) |
Earnings by Sex by Educational Attainment in Chelyan
| Educational Attainment | Male Income | Female Income |
| Less than High School | - | - |
| High School Diploma | - | - |
| College or Associate's Degree | - | - |
| Bachelor's Degree | - | - |
| Graduate Degree | - | - |
| Total | - | - |
Family Income in Chelyan
Family Income Brackets in Chelyan
According to the Chelyan family income data, there are 63 families falling into the $50,000 to $74,999 income range, which is the most common income bracket and makes up 53.4% of all families.
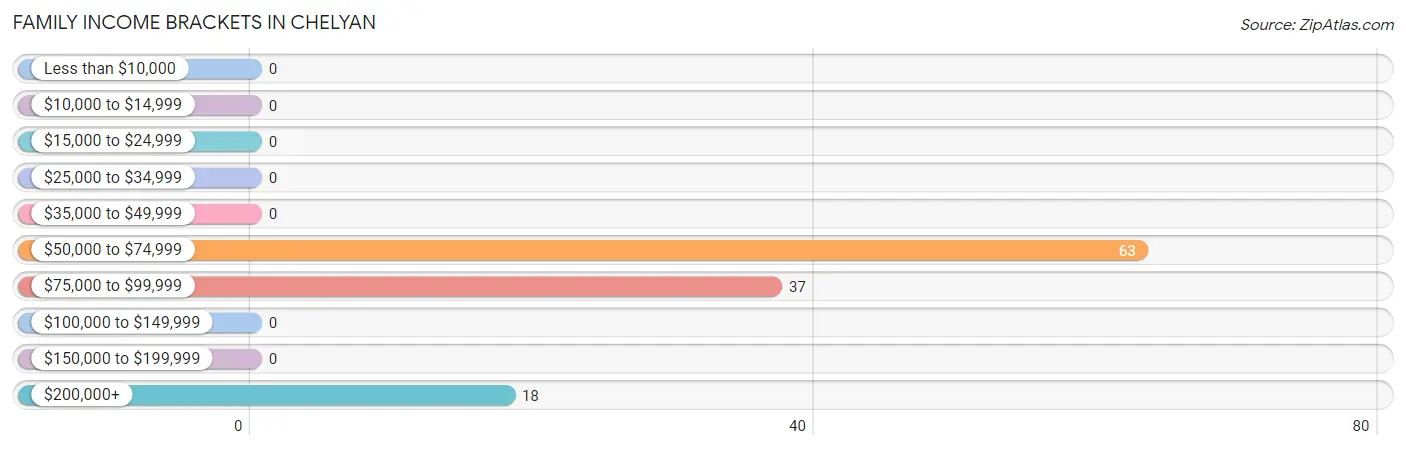
| Income Bracket | # Families | % Families |
| Less than $10,000 | 0 | 0.0% |
| $10,000 to $14,999 | 0 | 0.0% |
| $15,000 to $24,999 | 0 | 0.0% |
| $25,000 to $34,999 | 0 | 0.0% |
| $35,000 to $49,999 | 0 | 0.0% |
| $50,000 to $74,999 | 63 | 53.4% |
| $75,000 to $99,999 | 37 | 31.4% |
| $100,000 to $149,999 | 0 | 0.0% |
| $150,000 to $199,999 | 0 | 0.0% |
| $200,000+ | 18 | 15.3% |
Family Income by Famaliy Size in Chelyan
| Income Bracket | # Families | Median Income |
| 2-Person Families | 12 (10.2%) | $0 |
| 3-Person Families | 55 (46.6%) | $0 |
| 4-Person Families | 51 (43.2%) | $0 |
| 5-Person Families | 0 (0.0%) | $0 |
| 6-Person Families | 0 (0.0%) | $0 |
| 7+ Person Families | 0 (0.0%) | $0 |
| Total | 118 (100.0%) | $72,304 |
Family Income by Number of Earners in Chelyan
| Number of Earners | # Families | Median Income |
| No Earners | 12 (10.2%) | $0 |
| 1 Earner | 18 (15.2%) | $0 |
| 2 Earners | 88 (74.6%) | $0 |
| 3+ Earners | 0 (0.0%) | $0 |
| Total | 118 (100.0%) | $72,304 |
Household Income in Chelyan
Household Income Brackets in Chelyan
With 63 households falling in the category, the $50,000 to $74,999 income range is the most frequent in Chelyan, accounting for 49.2% of all households.
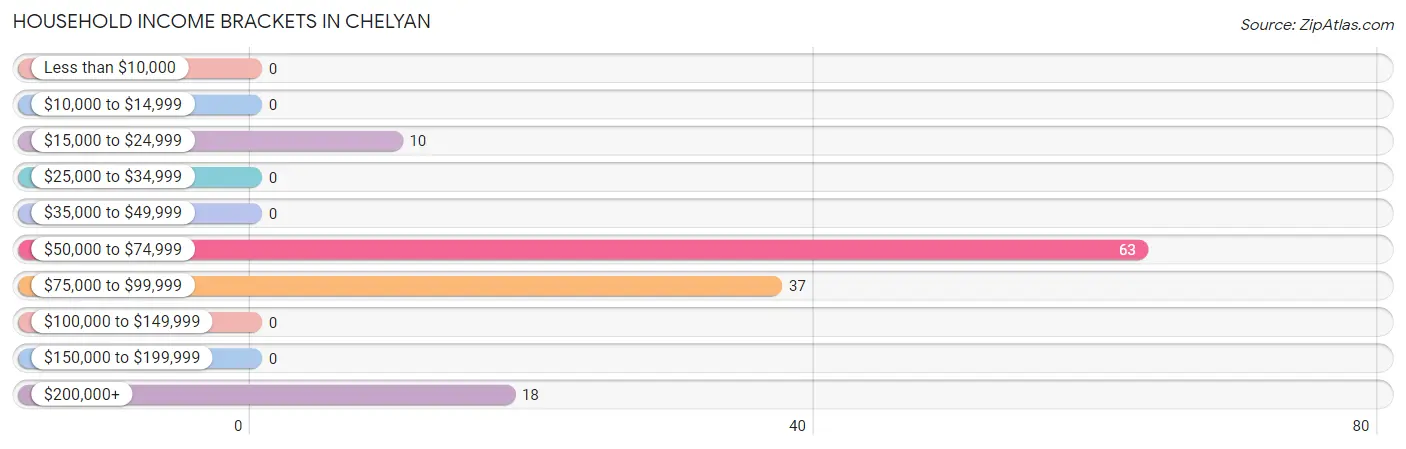
| Income Bracket | # Households | % Households |
| Less than $10,000 | 0 | 0.0% |
| $10,000 to $14,999 | 0 | 0.0% |
| $15,000 to $24,999 | 10 | 7.8% |
| $25,000 to $34,999 | 0 | 0.0% |
| $35,000 to $49,999 | 0 | 0.0% |
| $50,000 to $74,999 | 63 | 49.2% |
| $75,000 to $99,999 | 37 | 28.9% |
| $100,000 to $149,999 | 0 | 0.0% |
| $150,000 to $199,999 | 0 | 0.0% |
| $200,000+ | 18 | 14.1% |
Household Income by Householder Age in Chelyan
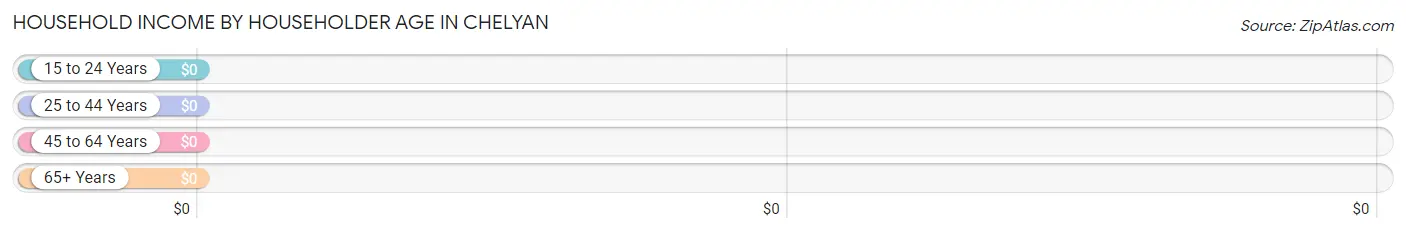
| Income Bracket | # Households | Median Income |
| 15 to 24 Years | 0 (0.0%) | $0 |
| 25 to 44 Years | 55 (43.0%) | $0 |
| 45 to 64 Years | 51 (39.8%) | $0 |
| 65+ Years | 22 (17.2%) | $0 |
| Total | 128 (100.0%) | $72,059 |
Poverty in Chelyan
Income Below Poverty by Sex and Age in Chelyan
| Age Bracket | Male | Female |
| Under 5 Years | 0 (0.0%) | 0 (0.0%) |
| 5 Years | 0 (0.0%) | 0 (0.0%) |
| 6 to 11 Years | 0 (0.0%) | 0 (0.0%) |
| 12 to 14 Years | 0 (0.0%) | 0 (0.0%) |
| 15 Years | 0 (0.0%) | 0 (0.0%) |
| 16 and 17 Years | 0 (0.0%) | 0 (0.0%) |
| 18 to 24 Years | 0 (0.0%) | 0 (0.0%) |
| 25 to 34 Years | 0 (0.0%) | 0 (0.0%) |
| 35 to 44 Years | 0 (0.0%) | 0 (0.0%) |
| 45 to 54 Years | 0 (0.0%) | 0 (0.0%) |
| 55 to 64 Years | 0 (0.0%) | 0 (0.0%) |
| 65 to 74 Years | 0 (0.0%) | 0 (0.0%) |
| 75 Years and over | 0 (0.0%) | 0 (0.0%) |
| Total | 0 (0.0%) | 0 (0.0%) |
Income Above Poverty by Sex and Age in Chelyan
According to the poverty statistics in Chelyan, males aged under 5 years and females aged under 5 years are the age groups that are most secure financially, with 100.0% of males and 100.0% of females in these age groups living above the poverty line.
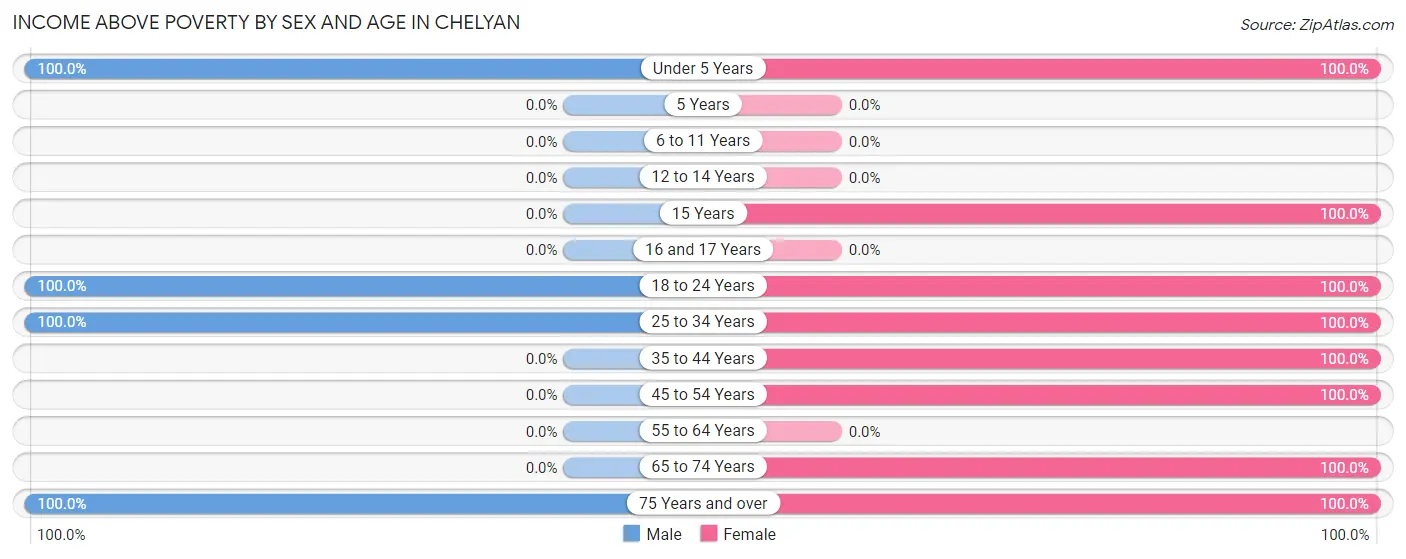
| Age Bracket | Male | Female |
| Under 5 Years | 43 (100.0%) | 41 (100.0%) |
| 5 Years | 0 (0.0%) | 0 (0.0%) |
| 6 to 11 Years | 0 (0.0%) | 0 (0.0%) |
| 12 to 14 Years | 0 (0.0%) | 0 (0.0%) |
| 15 Years | 0 (0.0%) | 60 (100.0%) |
| 16 and 17 Years | 0 (0.0%) | 0 (0.0%) |
| 18 to 24 Years | 70 (100.0%) | 41 (100.0%) |
| 25 to 34 Years | 37 (100.0%) | 18 (100.0%) |
| 35 to 44 Years | 0 (0.0%) | 59 (100.0%) |
| 45 to 54 Years | 0 (0.0%) | 51 (100.0%) |
| 55 to 64 Years | 0 (0.0%) | 0 (0.0%) |
| 65 to 74 Years | 0 (0.0%) | 10 (100.0%) |
| 75 Years and over | 12 (100.0%) | 10 (100.0%) |
| Total | 162 (100.0%) | 290 (100.0%) |
Income Below Poverty Among Married-Couple Families in Chelyan
| Children | Above Poverty | Below Poverty |
| No Children | 12 (100.0%) | 0 (0.0%) |
| 1 or 2 Children | 88 (100.0%) | 0 (0.0%) |
| 3 or 4 Children | 0 (0.0%) | 0 (0.0%) |
| 5 or more Children | 0 (0.0%) | 0 (0.0%) |
| Total | 100 (100.0%) | 0 (0.0%) |
Income Below Poverty Among Single-Parent Households in Chelyan
| Children | Single Father | Single Mother |
| No Children | 0 (0.0%) | 0 (0.0%) |
| 1 or 2 Children | 0 (0.0%) | 0 (0.0%) |
| 3 or 4 Children | 0 (0.0%) | 0 (0.0%) |
| 5 or more Children | 0 (0.0%) | 0 (0.0%) |
| Total | 0 (0.0%) | 0 (0.0%) |
Income Below Poverty Among Married-Couple vs Single-Parent Households in Chelyan
| Children | Married-Couple Families | Single-Parent Households |
| No Children | 0 (0.0%) | 0 (0.0%) |
| 1 or 2 Children | 0 (0.0%) | 0 (0.0%) |
| 3 or 4 Children | 0 (0.0%) | 0 (0.0%) |
| 5 or more Children | 0 (0.0%) | 0 (0.0%) |
| Total | 0 (0.0%) | 0 (0.0%) |
Race in Chelyan
The most populous races in Chelyan are , and White / Caucasian (452 | 100.0%).
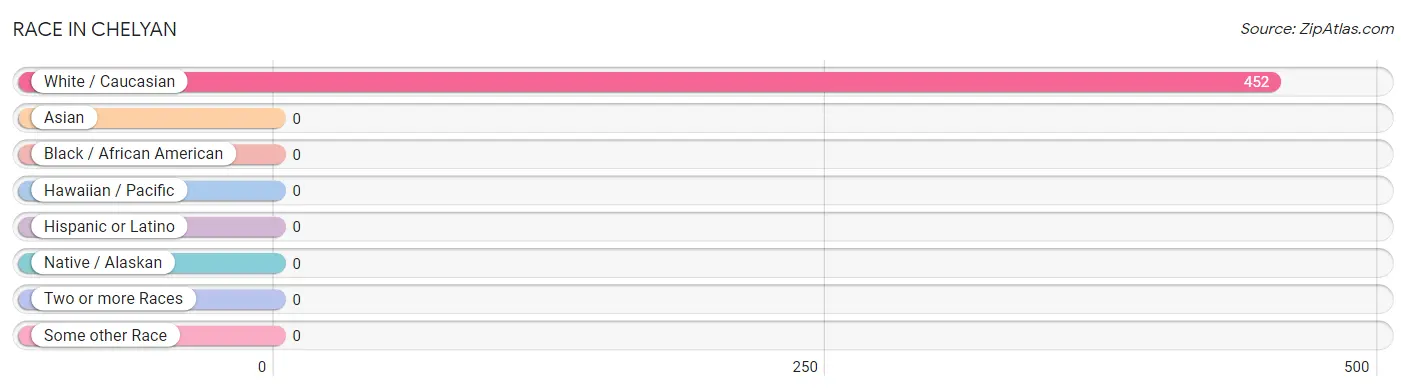
| Race | # Population | % Population |
| Asian | 0 | 0.0% |
| Black / African American | 0 | 0.0% |
| Hawaiian / Pacific | 0 | 0.0% |
| Hispanic or Latino | 0 | 0.0% |
| Native / Alaskan | 0 | 0.0% |
| White / Caucasian | 452 | 100.0% |
| Two or more Races | 0 | 0.0% |
| Some other Race | 0 | 0.0% |
| Total | 452 | 100.0% |
Ancestry in Chelyan
The most populous ancestries reported in Chelyan are English (129 | 28.5%), European (22 | 4.9%), French (18 | 4.0%), German (18 | 4.0%), and Scotch-Irish (10 | 2.2%), together accounting for 43.6% of all Chelyan residents.
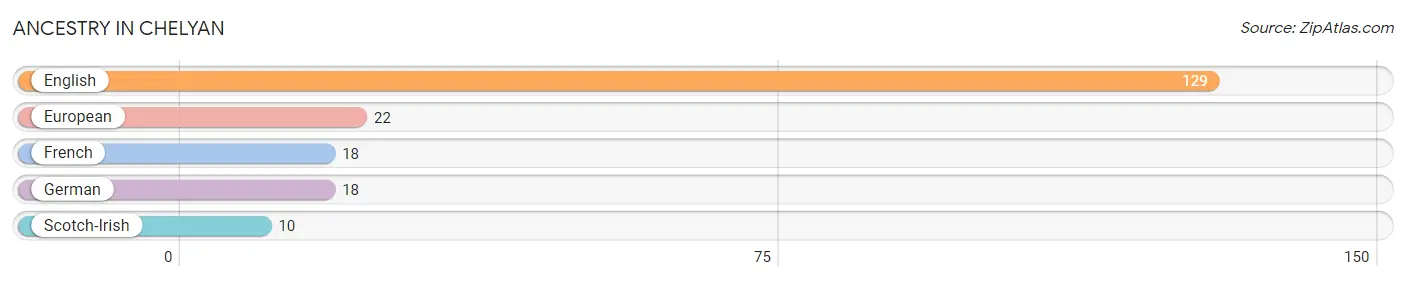
| Ancestry | # Population | % Population |
| English | 129 | 28.5% |
| European | 22 | 4.9% |
| French | 18 | 4.0% |
| German | 18 | 4.0% |
| Scotch-Irish | 10 | 2.2% | View All 5 Rows |
Immigrants in Chelyan

| Immigration Origin | # Population | % Population | View All 0 Rows |
Sex and Age in Chelyan
Sex and Age in Chelyan
The most populous age groups in Chelyan are 20 to 24 Years (70 | 43.2%) for men and 15 to 19 Years (60 | 20.7%) for women.
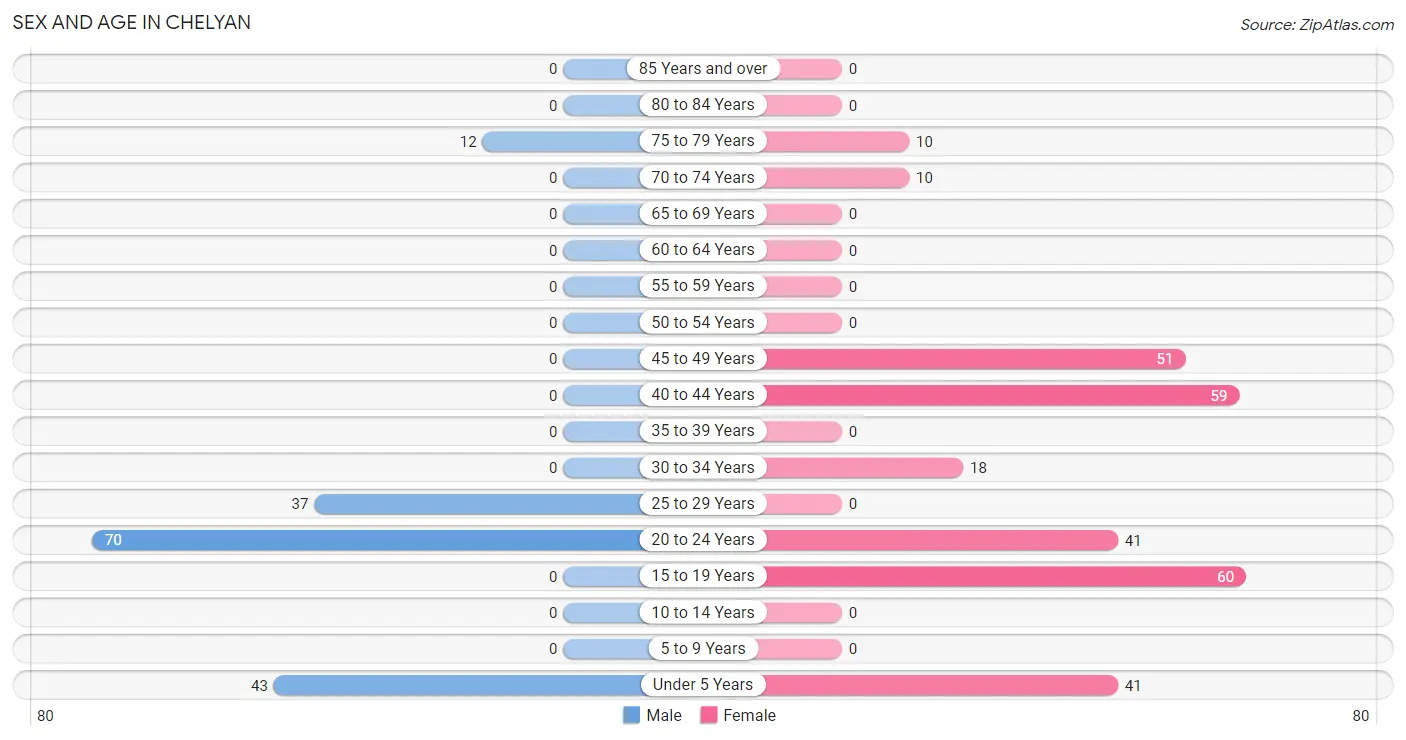
| Age Bracket | Male | Female |
| Under 5 Years | 43 (26.5%) | 41 (14.1%) |
| 5 to 9 Years | 0 (0.0%) | 0 (0.0%) |
| 10 to 14 Years | 0 (0.0%) | 0 (0.0%) |
| 15 to 19 Years | 0 (0.0%) | 60 (20.7%) |
| 20 to 24 Years | 70 (43.2%) | 41 (14.1%) |
| 25 to 29 Years | 37 (22.8%) | 0 (0.0%) |
| 30 to 34 Years | 0 (0.0%) | 18 (6.2%) |
| 35 to 39 Years | 0 (0.0%) | 0 (0.0%) |
| 40 to 44 Years | 0 (0.0%) | 59 (20.3%) |
| 45 to 49 Years | 0 (0.0%) | 51 (17.6%) |
| 50 to 54 Years | 0 (0.0%) | 0 (0.0%) |
| 55 to 59 Years | 0 (0.0%) | 0 (0.0%) |
| 60 to 64 Years | 0 (0.0%) | 0 (0.0%) |
| 65 to 69 Years | 0 (0.0%) | 0 (0.0%) |
| 70 to 74 Years | 0 (0.0%) | 10 (3.5%) |
| 75 to 79 Years | 12 (7.4%) | 10 (3.5%) |
| 80 to 84 Years | 0 (0.0%) | 0 (0.0%) |
| 85 Years and over | 0 (0.0%) | 0 (0.0%) |
| Total | 162 (100.0%) | 290 (100.0%) |
Families and Households in Chelyan
Median Family Size in Chelyan
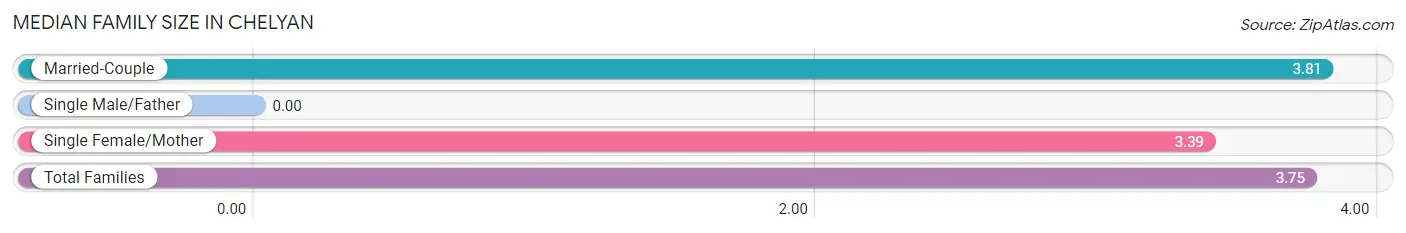
| Family Type | # Families | Family Size |
| Married-Couple | 100 (84.8%) | 3.81 |
| Single Male/Father | 0 (0.0%) | - |
| Single Female/Mother | 18 (15.2%) | 3.39 |
| Total Families | 118 (100.0%) | 3.75 |
Median Household Size in Chelyan
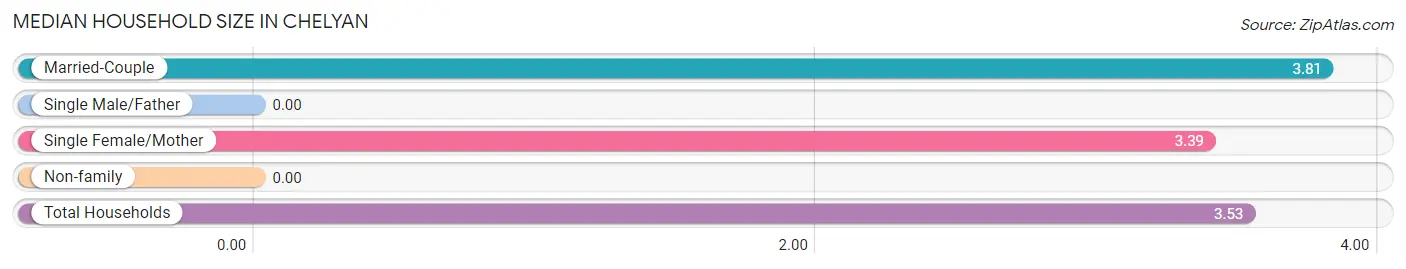
| Household Type | # Households | Household Size |
| Married-Couple | 100 (78.1%) | 3.81 |
| Single Male/Father | 0 (0.0%) | - |
| Single Female/Mother | 18 (14.1%) | 3.39 |
| Non-family | 10 (7.8%) | - |
| Total Households | 128 (100.0%) | 3.53 |
Household Size by Marriage Status in Chelyan
Out of a total of 128 households in Chelyan, 118 (92.2%) are family households, while 10 (7.8%) are nonfamily households. The most numerous type of family households are 3-person households, comprising 55, and the most common type of nonfamily households are 1-person households, comprising 10.
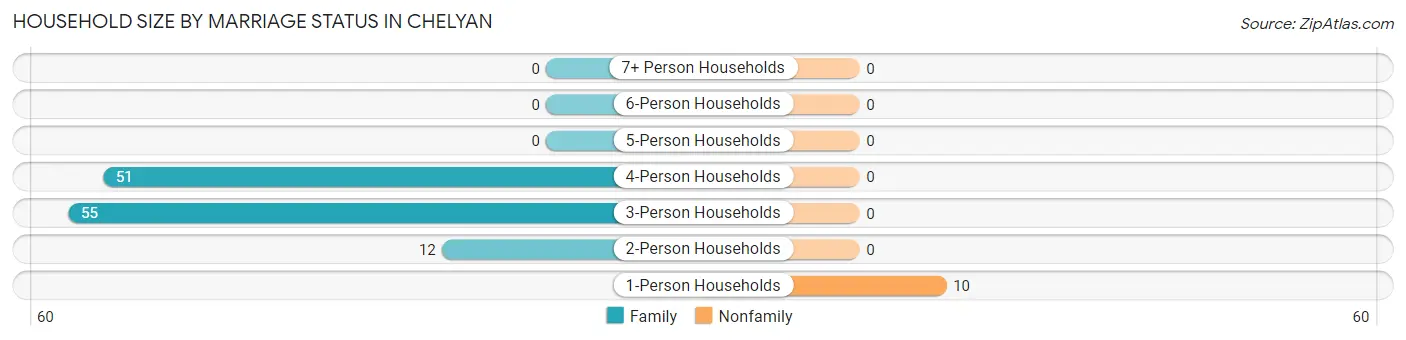
| Household Size | Family Households | Nonfamily Households |
| 1-Person Households | - | 10 (7.8%) |
| 2-Person Households | 12 (9.4%) | 0 (0.0%) |
| 3-Person Households | 55 (43.0%) | 0 (0.0%) |
| 4-Person Households | 51 (39.8%) | 0 (0.0%) |
| 5-Person Households | 0 (0.0%) | 0 (0.0%) |
| 6-Person Households | 0 (0.0%) | 0 (0.0%) |
| 7+ Person Households | 0 (0.0%) | 0 (0.0%) |
| Total | 118 (92.2%) | 10 (7.8%) |
Female Fertility in Chelyan
Fertility by Age in Chelyan
Average fertility rate in Chelyan is 179.0 births per 1,000 women. Women in the age bracket of 20 to 34 years have the highest fertility rate with 695.0 births per 1,000 women. Women in the age bracket of 20 to 34 years acount for 100.0% of all women with births.
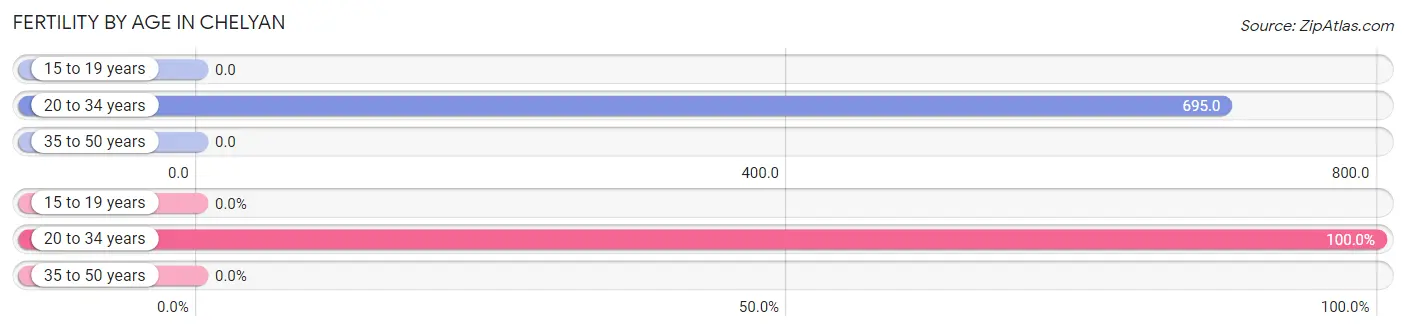
| Age Bracket | Women with Births | Births / 1,000 Women |
| 15 to 19 years | 0 (0.0%) | 0.0 |
| 20 to 34 years | 41 (100.0%) | 695.0 |
| 35 to 50 years | 0 (0.0%) | 0.0 |
| Total | 41 (100.0%) | 179.0 |
Fertility by Age by Marriage Status in Chelyan
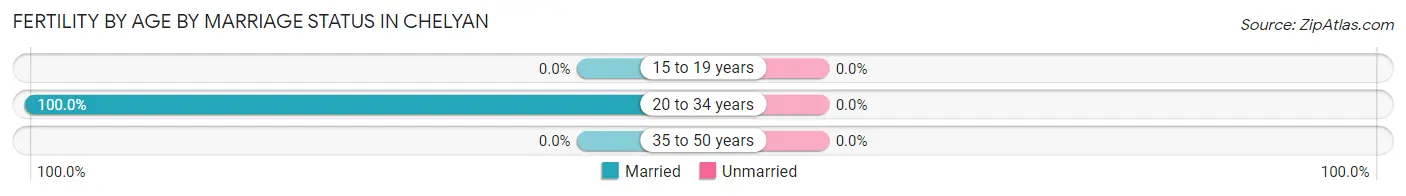
| Age Bracket | Married | Unmarried |
| 15 to 19 years | 0 (0.0%) | 0 (0.0%) |
| 20 to 34 years | 41 (100.0%) | 0 (0.0%) |
| 35 to 50 years | 0 (0.0%) | 0 (0.0%) |
| Total | 41 (100.0%) | 0 (0.0%) |
Fertility by Education in Chelyan
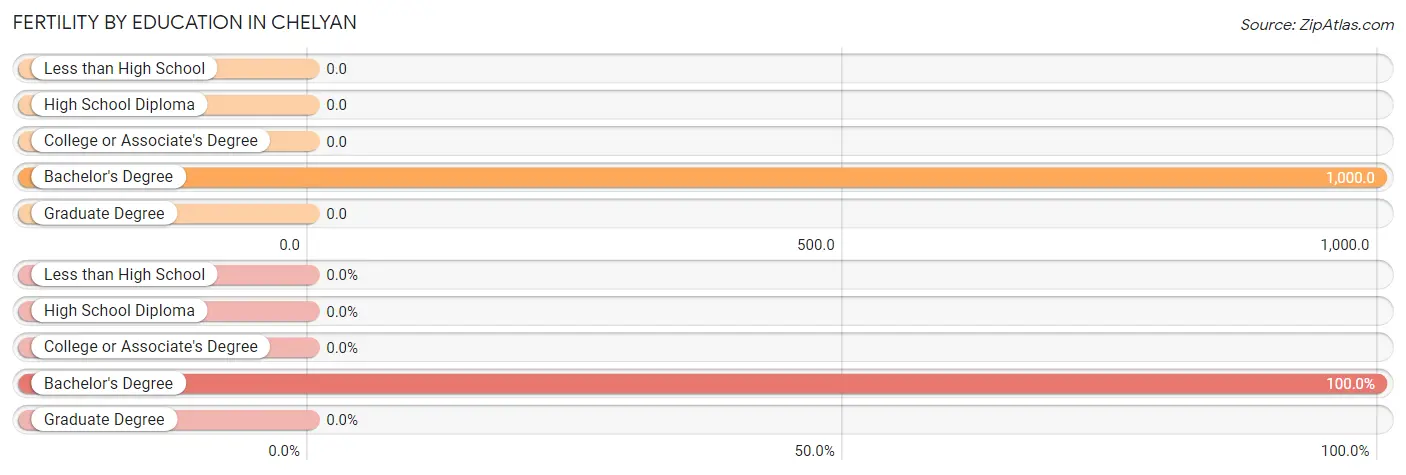
| Educational Attainment | Women with Births | Births / 1,000 Women |
| Less than High School | 0 (0.0%) | 0.0 |
| High School Diploma | 0 (0.0%) | 0.0 |
| College or Associate's Degree | 0 (0.0%) | 0.0 |
| Bachelor's Degree | 41 (100.0%) | 1,000.0 |
| Graduate Degree | 0 (0.0%) | 0.0 |
| Total | 41 (100.0%) | 179.0 |
Fertility by Education by Marriage Status in Chelyan
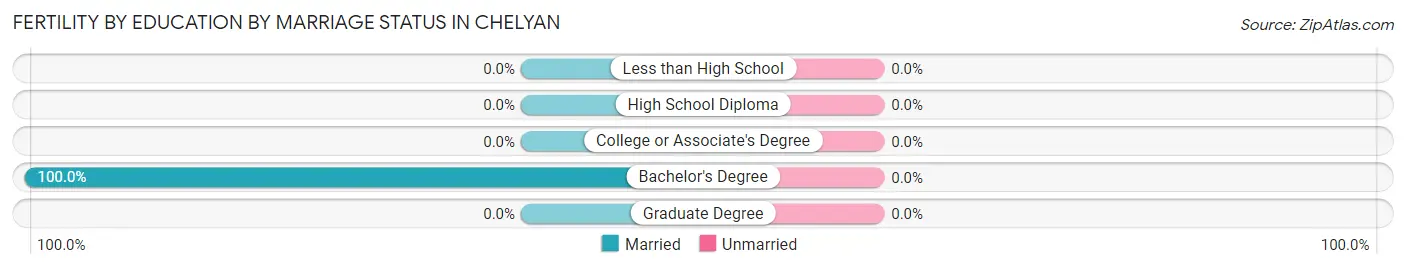
| Educational Attainment | Married | Unmarried |
| Less than High School | 0 (0.0%) | 0 (0.0%) |
| High School Diploma | 0 (0.0%) | 0 (0.0%) |
| College or Associate's Degree | 0 (0.0%) | 0 (0.0%) |
| Bachelor's Degree | 41 (100.0%) | 0 (0.0%) |
| Graduate Degree | 0 (0.0%) | 0 (0.0%) |
| Total | 41 (100.0%) | 0 (0.0%) |
Employment Characteristics in Chelyan
Employment by Class of Employer in Chelyan
Among the 155 employed individuals in Chelyan, local government employees (78 | 50.3%), private company employees (59 | 38.1%), and self-employed (not incorporated) (18 | 11.6%) make up the most common classes of employment.
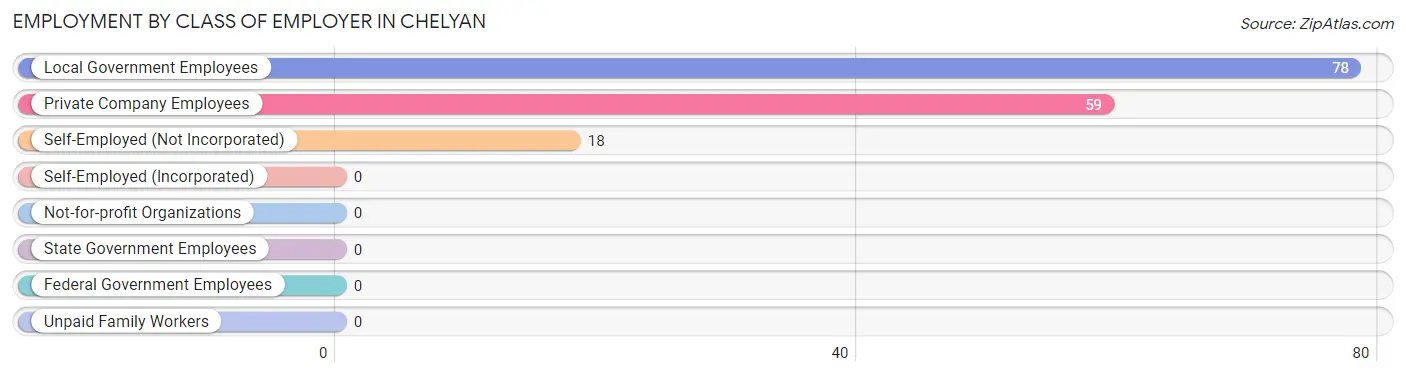
| Employer Class | # Employees | % Employees |
| Private Company Employees | 59 | 38.1% |
| Self-Employed (Incorporated) | 0 | 0.0% |
| Self-Employed (Not Incorporated) | 18 | 11.6% |
| Not-for-profit Organizations | 0 | 0.0% |
| Local Government Employees | 78 | 50.3% |
| State Government Employees | 0 | 0.0% |
| Federal Government Employees | 0 | 0.0% |
| Unpaid Family Workers | 0 | 0.0% |
| Total | 155 | 100.0% |
Employment Status by Age in Chelyan
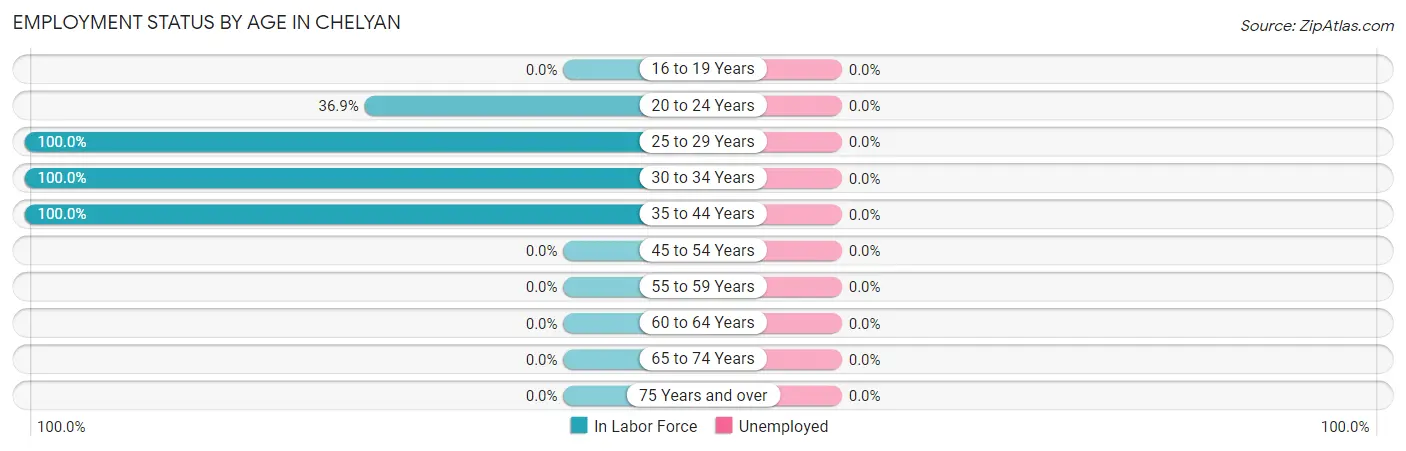
| Age Bracket | In Labor Force | Unemployed |
| 16 to 19 Years | 0 (0.0%) | 0 (0.0%) |
| 20 to 24 Years | 41 (36.9%) | 0 (0.0%) |
| 25 to 29 Years | 37 (100.0%) | 0 (0.0%) |
| 30 to 34 Years | 18 (100.0%) | 0 (0.0%) |
| 35 to 44 Years | 59 (100.0%) | 0 (0.0%) |
| 45 to 54 Years | 0 (0.0%) | 0 (0.0%) |
| 55 to 59 Years | 0 (0.0%) | 0 (0.0%) |
| 60 to 64 Years | 0 (0.0%) | 0 (0.0%) |
| 65 to 74 Years | 0 (0.0%) | 0 (0.0%) |
| 75 Years and over | 0 (0.0%) | 0 (0.0%) |
| Total | 155 (50.3%) | 0 (0.0%) |
Employment Status by Educational Attainment in Chelyan
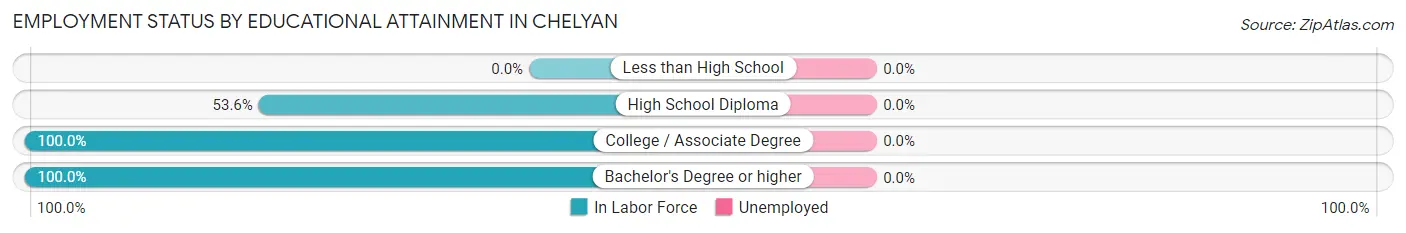
| Educational Attainment | In Labor Force | Unemployed |
| Less than High School | 0 (0.0%) | 0 (0.0%) |
| High School Diploma | 59 (53.6%) | 0 (0.0%) |
| College / Associate Degree | 37 (100.0%) | 0 (0.0%) |
| Bachelor's Degree or higher | 18 (100.0%) | 0 (0.0%) |
| Total | 114 (69.1%) | 0 (0.0%) |
Employment Occupations by Sex in Chelyan
Management, Business, Science and Arts Occupations
The most common Management, Business, Science and Arts occupations in Chelyan are Community & Social Service (41 | 26.5%), Education Instruction & Library (41 | 26.5%), Health Diagnosing & Treating (18 | 11.6%), and Health Technologists (18 | 11.6%).
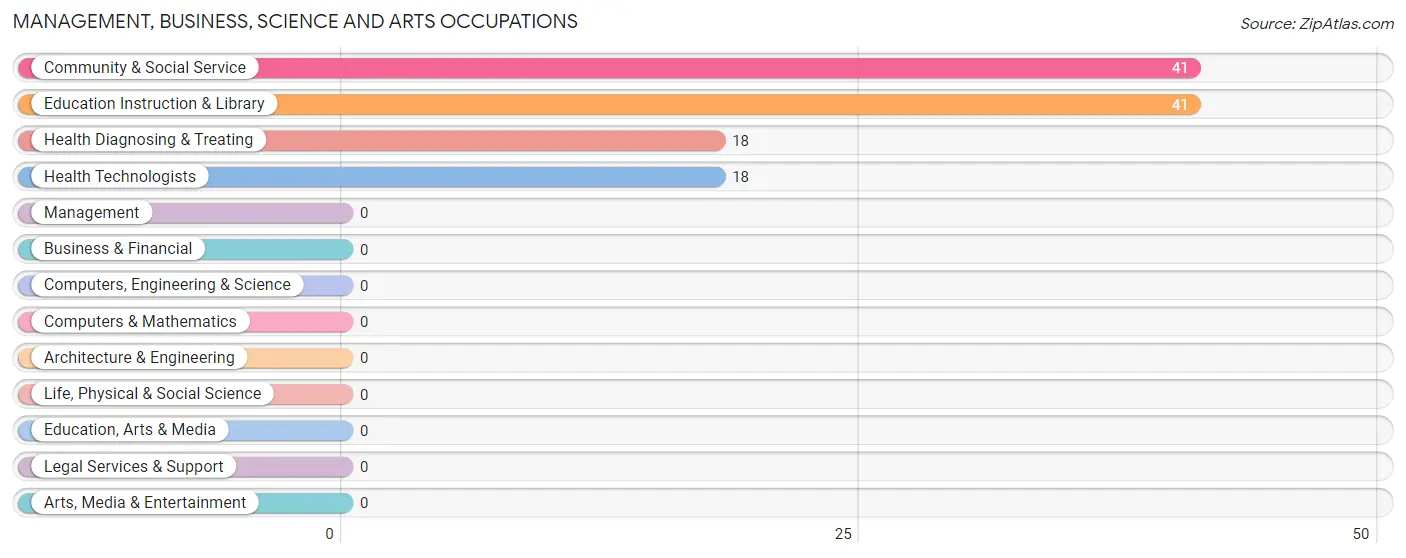
Management, Business, Science and Arts Occupations by Sex
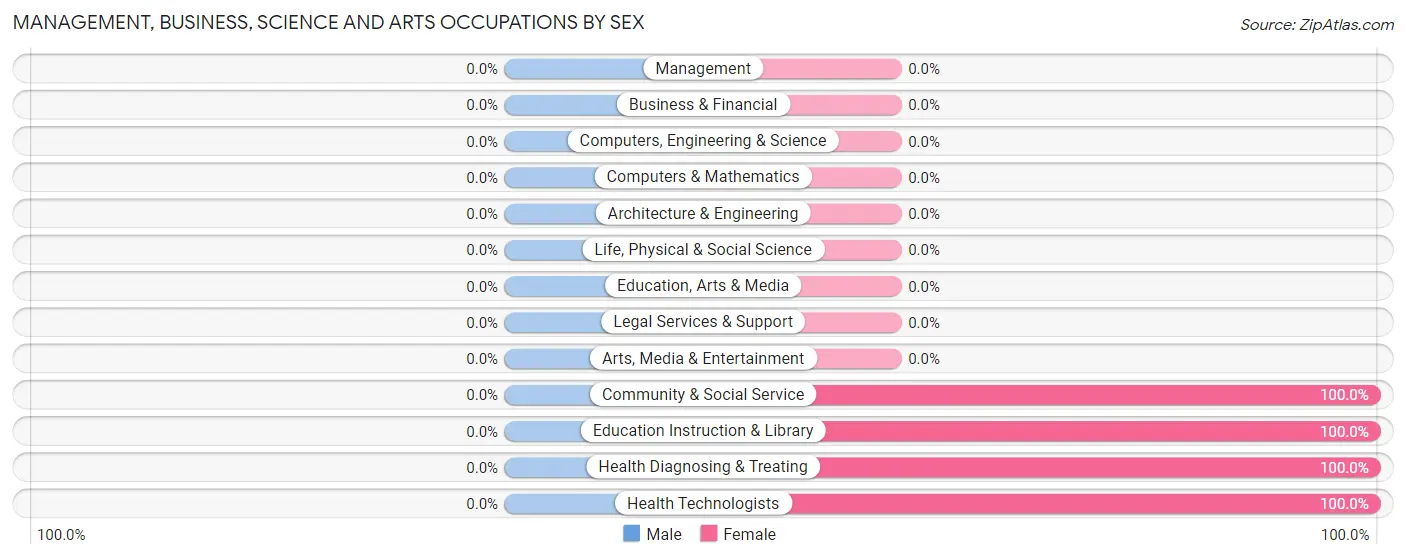
| Occupation | Male | Female |
| Management | 0 (0.0%) | 0 (0.0%) |
| Business & Financial | 0 (0.0%) | 0 (0.0%) |
| Computers, Engineering & Science | 0 (0.0%) | 0 (0.0%) |
| Computers & Mathematics | 0 (0.0%) | 0 (0.0%) |
| Architecture & Engineering | 0 (0.0%) | 0 (0.0%) |
| Life, Physical & Social Science | 0 (0.0%) | 0 (0.0%) |
| Community & Social Service | 0 (0.0%) | 41 (100.0%) |
| Education, Arts & Media | 0 (0.0%) | 0 (0.0%) |
| Legal Services & Support | 0 (0.0%) | 0 (0.0%) |
| Education Instruction & Library | 0 (0.0%) | 41 (100.0%) |
| Arts, Media & Entertainment | 0 (0.0%) | 0 (0.0%) |
| Health Diagnosing & Treating | 0 (0.0%) | 18 (100.0%) |
| Health Technologists | 0 (0.0%) | 18 (100.0%) |
| Total (Category) | 0 (0.0%) | 59 (100.0%) |
| Total (Overall) | 37 (23.9%) | 118 (76.1%) |
Services Occupations
The most common Services occupations in Chelyan are Healthcare Support (59 | 38.1%), Security & Protection (37 | 23.9%), and Firefighting & Prevention (37 | 23.9%).
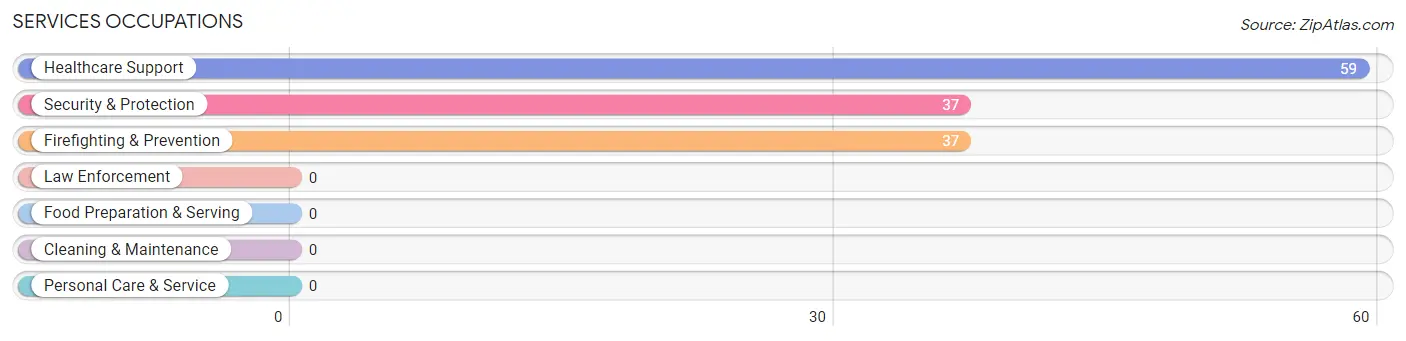
Services Occupations by Sex
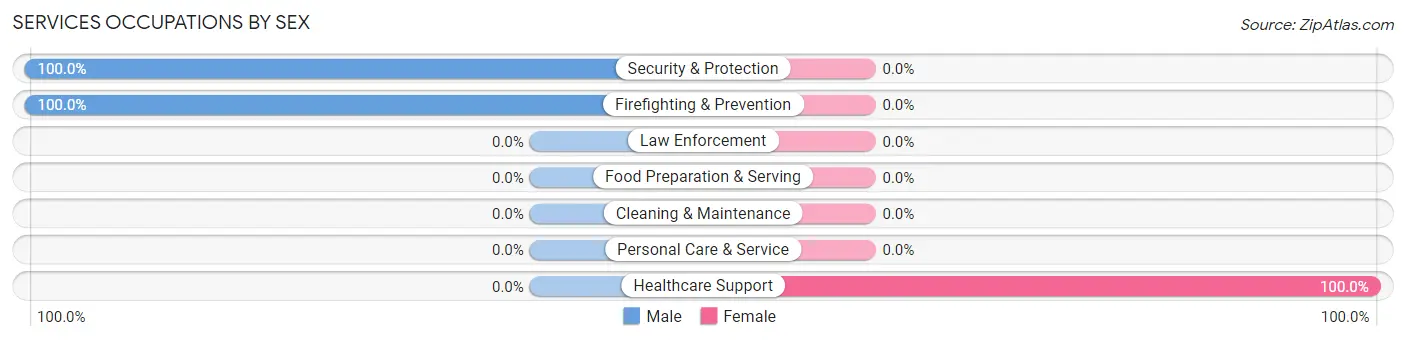
| Occupation | Male | Female |
| Healthcare Support | 0 (0.0%) | 59 (100.0%) |
| Security & Protection | 37 (100.0%) | 0 (0.0%) |
| Firefighting & Prevention | 37 (100.0%) | 0 (0.0%) |
| Law Enforcement | 0 (0.0%) | 0 (0.0%) |
| Food Preparation & Serving | 0 (0.0%) | 0 (0.0%) |
| Cleaning & Maintenance | 0 (0.0%) | 0 (0.0%) |
| Personal Care & Service | 0 (0.0%) | 0 (0.0%) |
| Total (Category) | 37 (38.5%) | 59 (61.5%) |
| Total (Overall) | 37 (23.9%) | 118 (76.1%) |
Sales and Office Occupations
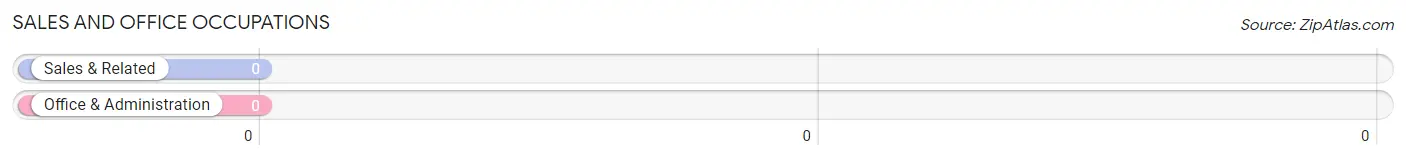
Sales and Office Occupations by Sex
| Occupation | Male | Female |
| Sales & Related | 0 (0.0%) | 0 (0.0%) |
| Office & Administration | 0 (0.0%) | 0 (0.0%) |
| Total (Category) | 0 (0.0%) | 0 (0.0%) |
| Total (Overall) | 37 (23.9%) | 118 (76.1%) |
Natural Resources, Construction and Maintenance Occupations
Natural Resources, Construction and Maintenance Occupations by Sex
| Occupation | Male | Female |
| Farming, Fishing & Forestry | 0 (0.0%) | 0 (0.0%) |
| Construction & Extraction | 0 (0.0%) | 0 (0.0%) |
| Installation, Maintenance & Repair | 0 (0.0%) | 0 (0.0%) |
| Total (Category) | 0 (0.0%) | 0 (0.0%) |
| Total (Overall) | 37 (23.9%) | 118 (76.1%) |
Production, Transportation and Moving Occupations
Production, Transportation and Moving Occupations by Sex
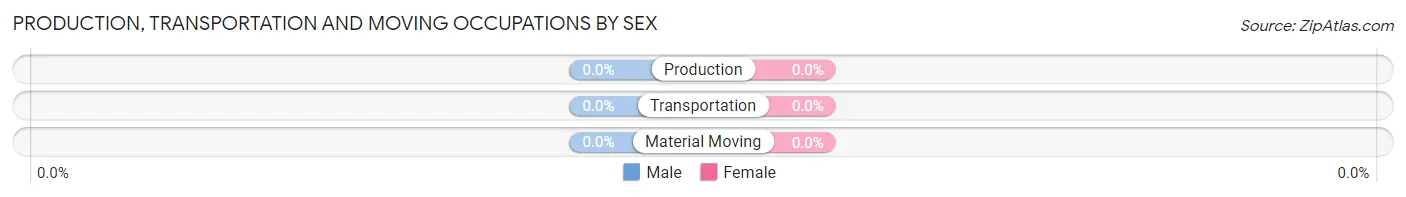
| Occupation | Male | Female |
| Production | 0 (0.0%) | 0 (0.0%) |
| Transportation | 0 (0.0%) | 0 (0.0%) |
| Material Moving | 0 (0.0%) | 0 (0.0%) |
| Total (Category) | 0 (0.0%) | 0 (0.0%) |
| Total (Overall) | 37 (23.9%) | 118 (76.1%) |
Employment Industries by Sex in Chelyan
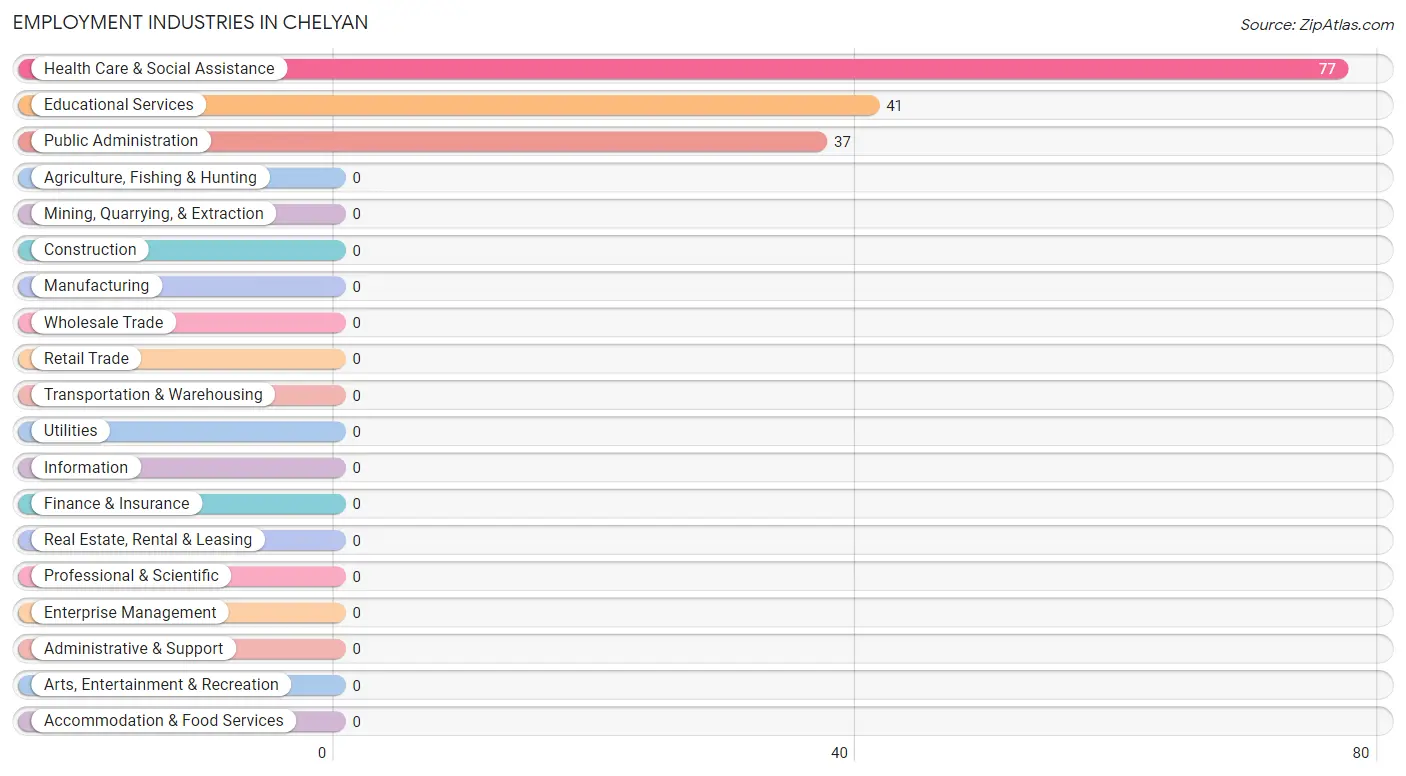
Employment Industries in Chelyan
The major employment industries in Chelyan include Health Care & Social Assistance (77 | 49.7%), Educational Services (41 | 26.5%), and Public Administration (37 | 23.9%).
Employment Industries by Sex in Chelyan
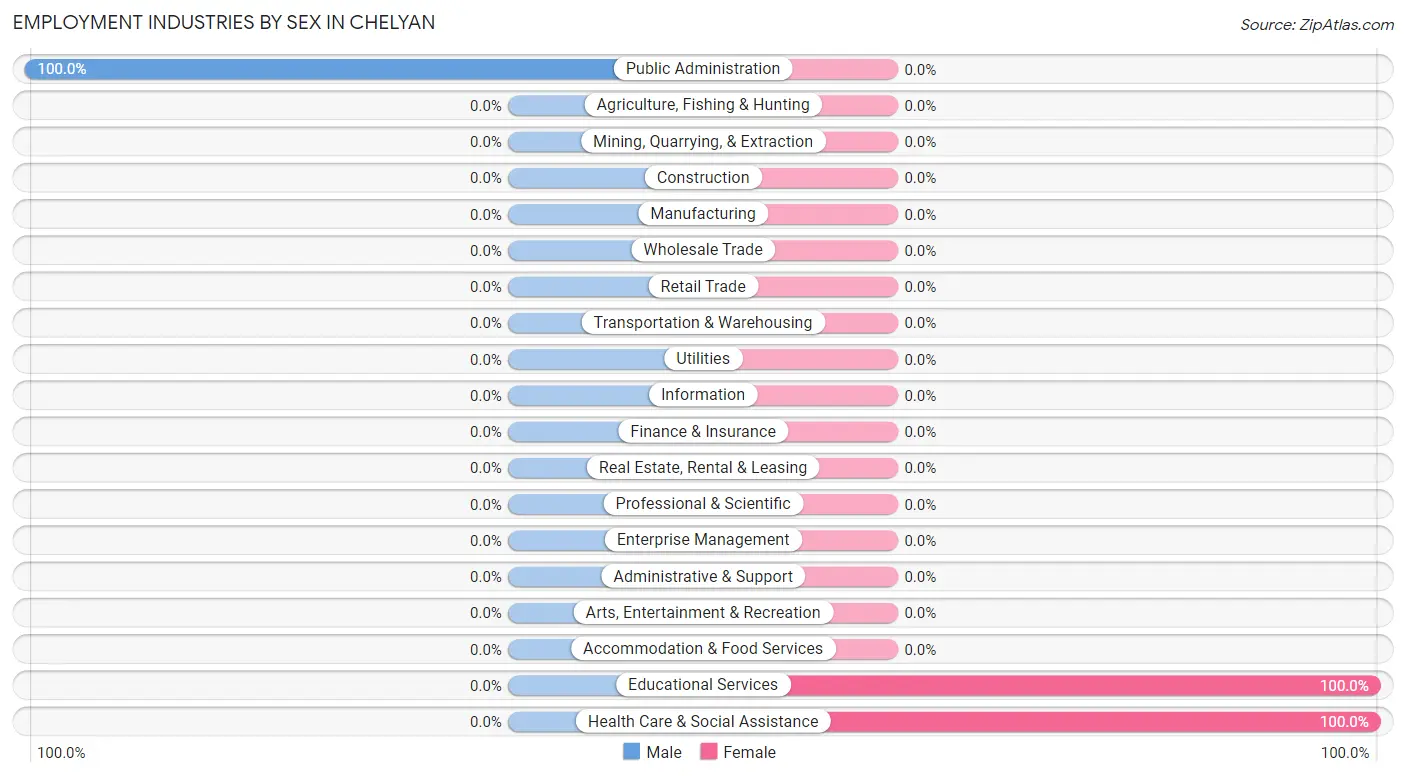
| Industry | Male | Female |
| Agriculture, Fishing & Hunting | 0 (0.0%) | 0 (0.0%) |
| Mining, Quarrying, & Extraction | 0 (0.0%) | 0 (0.0%) |
| Construction | 0 (0.0%) | 0 (0.0%) |
| Manufacturing | 0 (0.0%) | 0 (0.0%) |
| Wholesale Trade | 0 (0.0%) | 0 (0.0%) |
| Retail Trade | 0 (0.0%) | 0 (0.0%) |
| Transportation & Warehousing | 0 (0.0%) | 0 (0.0%) |
| Utilities | 0 (0.0%) | 0 (0.0%) |
| Information | 0 (0.0%) | 0 (0.0%) |
| Finance & Insurance | 0 (0.0%) | 0 (0.0%) |
| Real Estate, Rental & Leasing | 0 (0.0%) | 0 (0.0%) |
| Professional & Scientific | 0 (0.0%) | 0 (0.0%) |
| Enterprise Management | 0 (0.0%) | 0 (0.0%) |
| Administrative & Support | 0 (0.0%) | 0 (0.0%) |
| Educational Services | 0 (0.0%) | 41 (100.0%) |
| Health Care & Social Assistance | 0 (0.0%) | 77 (100.0%) |
| Arts, Entertainment & Recreation | 0 (0.0%) | 0 (0.0%) |
| Accommodation & Food Services | 0 (0.0%) | 0 (0.0%) |
| Public Administration | 37 (100.0%) | 0 (0.0%) |
| Total | 37 (23.9%) | 118 (76.1%) |
Education in Chelyan
School Enrollment in Chelyan
The most common levels of schooling among the 101 students in Chelyan are middle school (60 | 59.4%), and graduate / professional (41 | 40.6%).
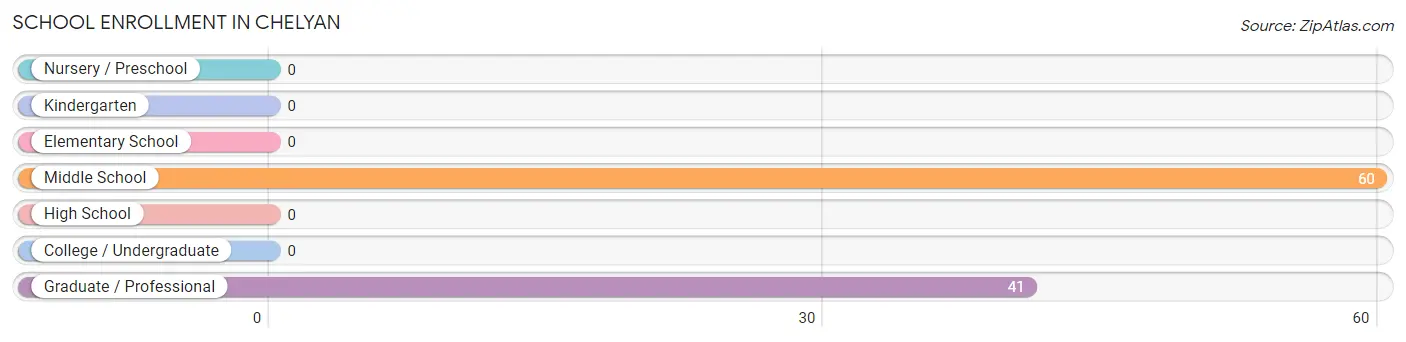
| School Level | # Students | % Students |
| Nursery / Preschool | 0 | 0.0% |
| Kindergarten | 0 | 0.0% |
| Elementary School | 0 | 0.0% |
| Middle School | 60 | 59.4% |
| High School | 0 | 0.0% |
| College / Undergraduate | 0 | 0.0% |
| Graduate / Professional | 41 | 40.6% |
| Total | 101 | 100.0% |
School Enrollment by Age by Funding Source in Chelyan
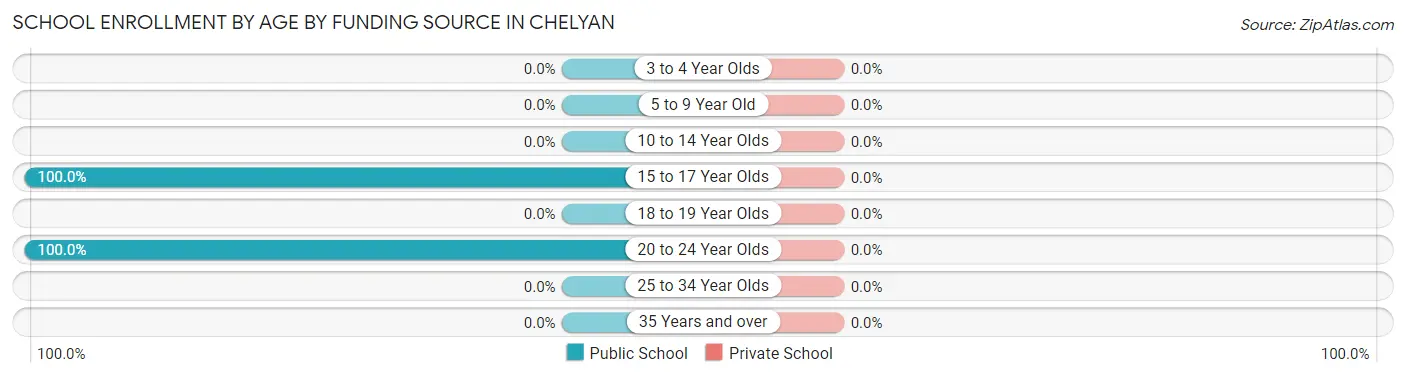
| Age Bracket | Public School | Private School |
| 3 to 4 Year Olds | 0 (0.0%) | 0 (0.0%) |
| 5 to 9 Year Old | 0 (0.0%) | 0 (0.0%) |
| 10 to 14 Year Olds | 0 (0.0%) | 0 (0.0%) |
| 15 to 17 Year Olds | 60 (100.0%) | 0 (0.0%) |
| 18 to 19 Year Olds | 0 (0.0%) | 0 (0.0%) |
| 20 to 24 Year Olds | 41 (100.0%) | 0 (0.0%) |
| 25 to 34 Year Olds | 0 (0.0%) | 0 (0.0%) |
| 35 Years and over | 0 (0.0%) | 0 (0.0%) |
| Total | 101 (100.0%) | 0 (0.0%) |
Educational Attainment by Field of Study in Chelyan
Bio, nature & agricultural (18 | 64.3%), and education (10 | 35.7%) are the most common fields of study among 28 individuals in Chelyan who have obtained a bachelor's degree or higher.
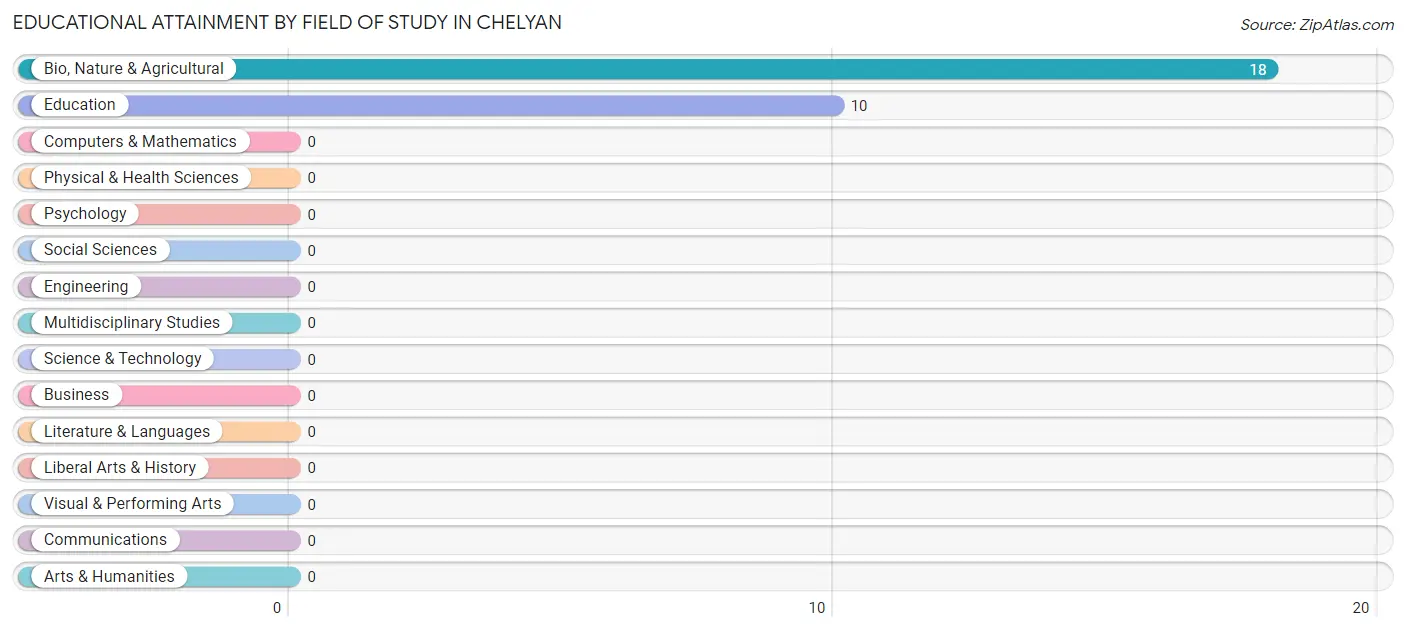
| Field of Study | # Graduates | % Graduates |
| Computers & Mathematics | 0 | 0.0% |
| Bio, Nature & Agricultural | 18 | 64.3% |
| Physical & Health Sciences | 0 | 0.0% |
| Psychology | 0 | 0.0% |
| Social Sciences | 0 | 0.0% |
| Engineering | 0 | 0.0% |
| Multidisciplinary Studies | 0 | 0.0% |
| Science & Technology | 0 | 0.0% |
| Business | 0 | 0.0% |
| Education | 10 | 35.7% |
| Literature & Languages | 0 | 0.0% |
| Liberal Arts & History | 0 | 0.0% |
| Visual & Performing Arts | 0 | 0.0% |
| Communications | 0 | 0.0% |
| Arts & Humanities | 0 | 0.0% |
| Total | 28 | 100.0% |
Transportation & Commute in Chelyan
Vehicle Availability by Sex in Chelyan
The most prevalent vehicle ownership categories in Chelyan are males with 2 vehicles (37, accounting for 100.0%) and females with 2 vehicles (118, making up 31.4%).
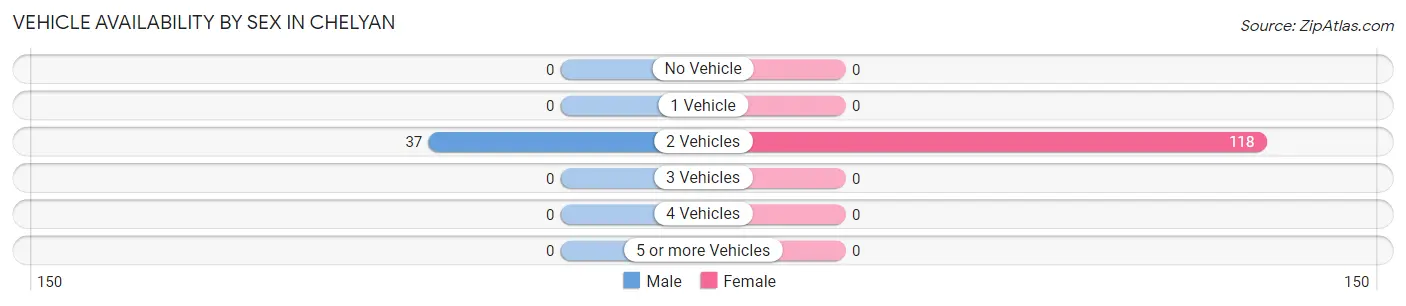
| Vehicles Available | Male | Female |
| No Vehicle | 0 (0.0%) | 0 (0.0%) |
| 1 Vehicle | 0 (0.0%) | 0 (0.0%) |
| 2 Vehicles | 37 (100.0%) | 118 (100.0%) |
| 3 Vehicles | 0 (0.0%) | 0 (0.0%) |
| 4 Vehicles | 0 (0.0%) | 0 (0.0%) |
| 5 or more Vehicles | 0 (0.0%) | 0 (0.0%) |
| Total | 37 (100.0%) | 118 (100.0%) |
Commute Time in Chelyan
The most frequently occuring commute durations in Chelyan are 20 to 24 minutes (100 commuters, 64.5%), 30 to 34 minutes (37 commuters, 23.9%), and less than 5 minutes (18 commuters, 11.6%).
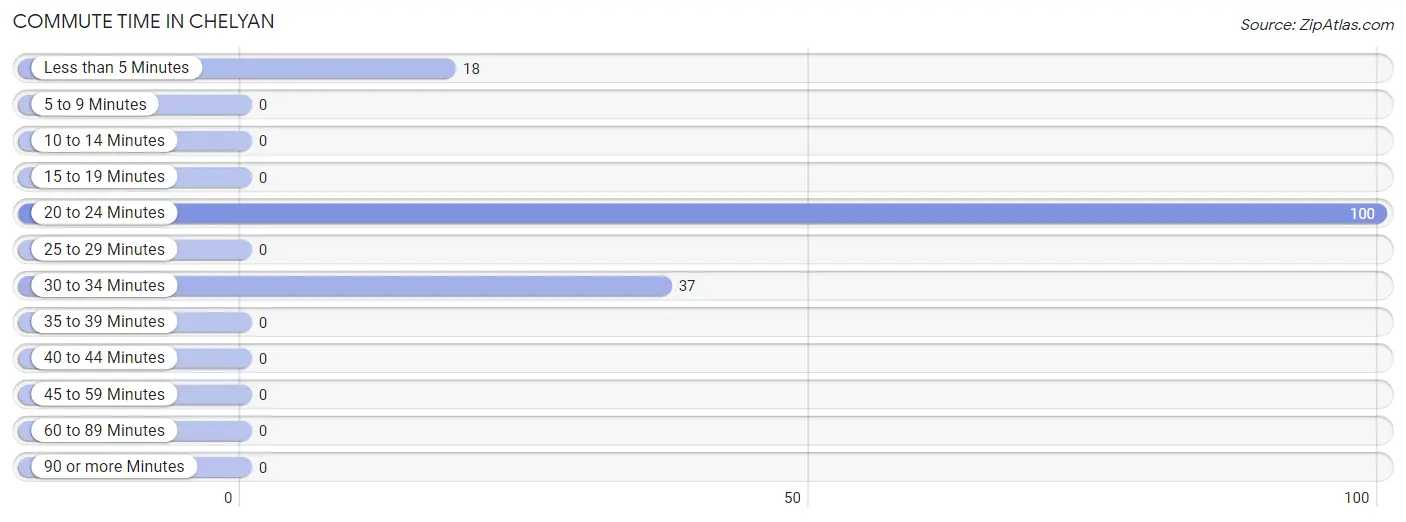
| Commute Time | # Commuters | % Commuters |
| Less than 5 Minutes | 18 | 11.6% |
| 5 to 9 Minutes | 0 | 0.0% |
| 10 to 14 Minutes | 0 | 0.0% |
| 15 to 19 Minutes | 0 | 0.0% |
| 20 to 24 Minutes | 100 | 64.5% |
| 25 to 29 Minutes | 0 | 0.0% |
| 30 to 34 Minutes | 37 | 23.9% |
| 35 to 39 Minutes | 0 | 0.0% |
| 40 to 44 Minutes | 0 | 0.0% |
| 45 to 59 Minutes | 0 | 0.0% |
| 60 to 89 Minutes | 0 | 0.0% |
| 90 or more Minutes | 0 | 0.0% |
Commute Time by Sex in Chelyan
The most common commute times in Chelyan are 30 to 34 minutes (37 commuters, 100.0%) for males and 20 to 24 minutes (100 commuters, 84.8%) for females.
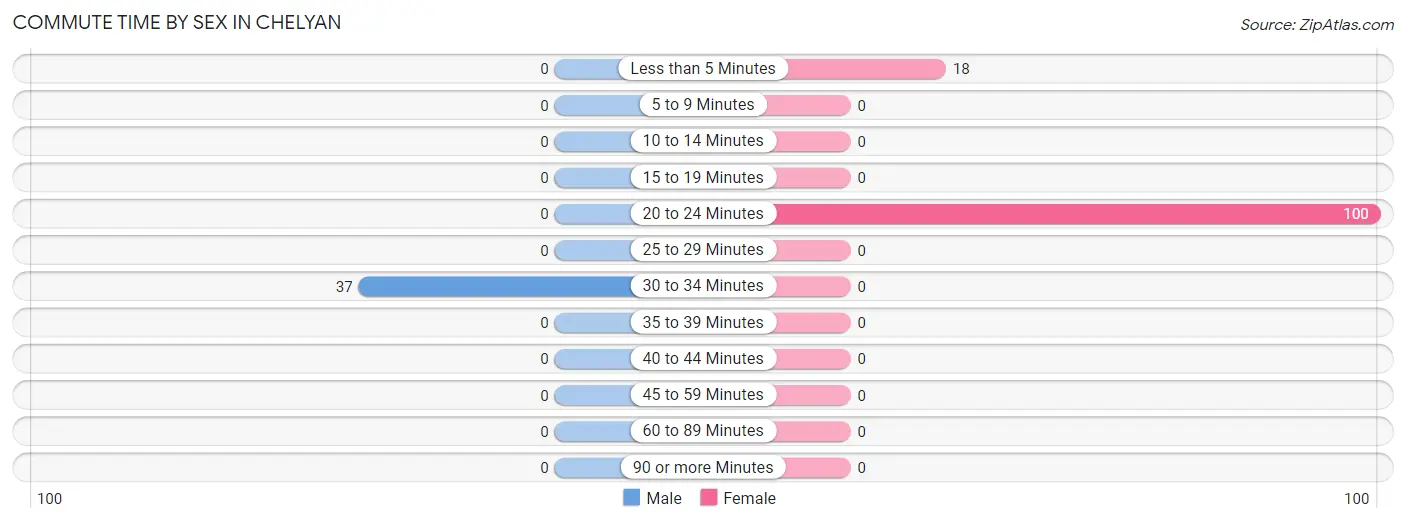
| Commute Time | Male | Female |
| Less than 5 Minutes | 0 (0.0%) | 18 (15.2%) |
| 5 to 9 Minutes | 0 (0.0%) | 0 (0.0%) |
| 10 to 14 Minutes | 0 (0.0%) | 0 (0.0%) |
| 15 to 19 Minutes | 0 (0.0%) | 0 (0.0%) |
| 20 to 24 Minutes | 0 (0.0%) | 100 (84.8%) |
| 25 to 29 Minutes | 0 (0.0%) | 0 (0.0%) |
| 30 to 34 Minutes | 37 (100.0%) | 0 (0.0%) |
| 35 to 39 Minutes | 0 (0.0%) | 0 (0.0%) |
| 40 to 44 Minutes | 0 (0.0%) | 0 (0.0%) |
| 45 to 59 Minutes | 0 (0.0%) | 0 (0.0%) |
| 60 to 89 Minutes | 0 (0.0%) | 0 (0.0%) |
| 90 or more Minutes | 0 (0.0%) | 0 (0.0%) |
Time of Departure to Work by Sex in Chelyan
The most frequent times of departure to work in Chelyan are 6:30 AM to 6:59 AM (37, 100.0%) for males and 12:00 PM to 3:59 PM (59, 50.0%) for females.
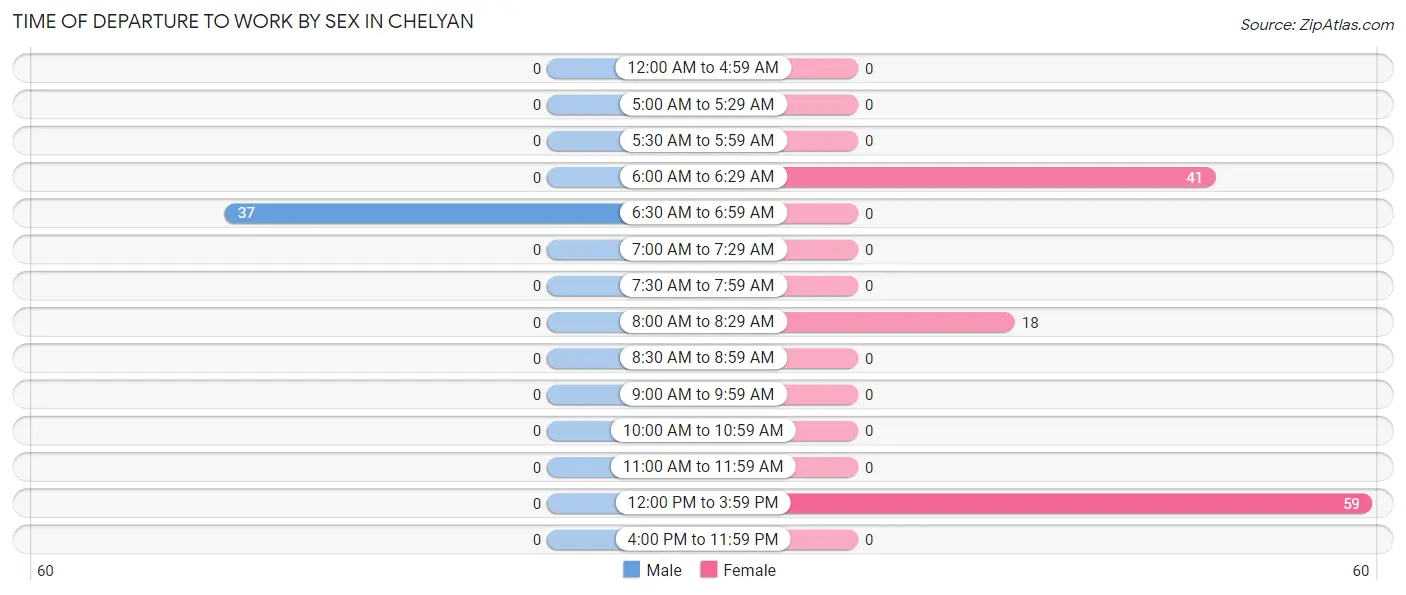
| Time of Departure | Male | Female |
| 12:00 AM to 4:59 AM | 0 (0.0%) | 0 (0.0%) |
| 5:00 AM to 5:29 AM | 0 (0.0%) | 0 (0.0%) |
| 5:30 AM to 5:59 AM | 0 (0.0%) | 0 (0.0%) |
| 6:00 AM to 6:29 AM | 0 (0.0%) | 41 (34.7%) |
| 6:30 AM to 6:59 AM | 37 (100.0%) | 0 (0.0%) |
| 7:00 AM to 7:29 AM | 0 (0.0%) | 0 (0.0%) |
| 7:30 AM to 7:59 AM | 0 (0.0%) | 0 (0.0%) |
| 8:00 AM to 8:29 AM | 0 (0.0%) | 18 (15.2%) |
| 8:30 AM to 8:59 AM | 0 (0.0%) | 0 (0.0%) |
| 9:00 AM to 9:59 AM | 0 (0.0%) | 0 (0.0%) |
| 10:00 AM to 10:59 AM | 0 (0.0%) | 0 (0.0%) |
| 11:00 AM to 11:59 AM | 0 (0.0%) | 0 (0.0%) |
| 12:00 PM to 3:59 PM | 0 (0.0%) | 59 (50.0%) |
| 4:00 PM to 11:59 PM | 0 (0.0%) | 0 (0.0%) |
| Total | 37 (100.0%) | 118 (100.0%) |
Housing Occupancy in Chelyan
Occupancy by Ownership in Chelyan
Of the total 128 dwellings in Chelyan, owner-occupied units account for 49 (38.3%), while renter-occupied units make up 79 (61.7%).
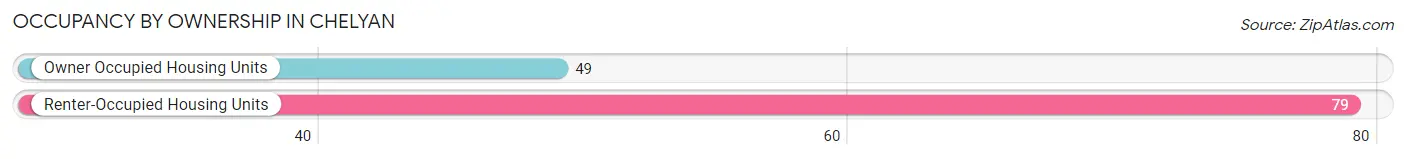
| Occupancy | # Housing Units | % Housing Units |
| Owner Occupied Housing Units | 49 | 38.3% |
| Renter-Occupied Housing Units | 79 | 61.7% |
| Total Occupied Housing Units | 128 | 100.0% |
Occupancy by Household Size in Chelyan
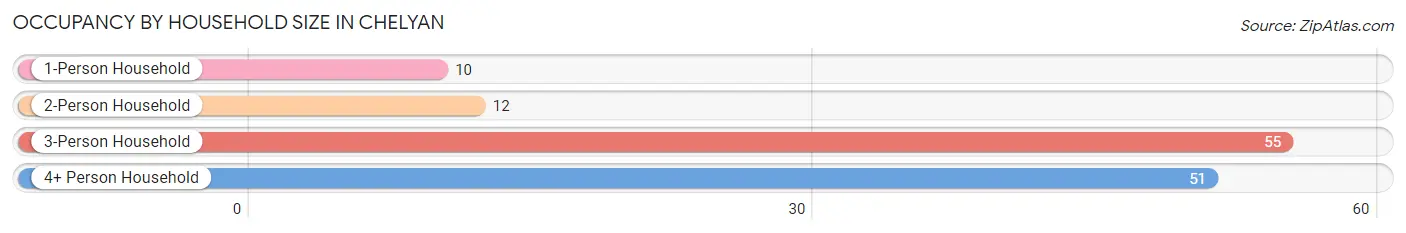
| Household Size | # Housing Units | % Housing Units |
| 1-Person Household | 10 | 7.8% |
| 2-Person Household | 12 | 9.4% |
| 3-Person Household | 55 | 43.0% |
| 4+ Person Household | 51 | 39.8% |
| Total Housing Units | 128 | 100.0% |
Occupancy by Ownership by Household Size in Chelyan
| Household Size | Owner-occupied | Renter-occupied |
| 1-Person Household | 0 (0.0%) | 10 (100.0%) |
| 2-Person Household | 12 (100.0%) | 0 (0.0%) |
| 3-Person Household | 37 (67.3%) | 18 (32.7%) |
| 4+ Person Household | 0 (0.0%) | 51 (100.0%) |
| Total Housing Units | 49 (38.3%) | 79 (61.7%) |
Occupancy by Educational Attainment in Chelyan
| Household Size | Owner-occupied | Renter-occupied |
| Less than High School | 0 (0.0%) | 0 (0.0%) |
| High School Diploma | 12 (16.4%) | 61 (83.6%) |
| College/Associate Degree | 37 (100.0%) | 0 (0.0%) |
| Bachelor's Degree or higher | 0 (0.0%) | 18 (100.0%) |
Occupancy by Age of Householder in Chelyan
| Age Bracket | # Households | % Households |
| Under 35 Years | 55 | 43.0% |
| 35 to 44 Years | 0 | 0.0% |
| 45 to 54 Years | 51 | 39.8% |
| 55 to 64 Years | 0 | 0.0% |
| 65 to 74 Years | 10 | 7.8% |
| 75 to 84 Years | 12 | 9.4% |
| 85 Years and Over | 0 | 0.0% |
| Total | 128 | 100.0% |
Housing Finances in Chelyan
Median Income by Occupancy in Chelyan
| Occupancy Type | # Households | Median Income |
| Owner-Occupied | 49 (38.3%) | $0 |
| Renter-Occupied | 79 (61.7%) | $0 |
| Average | 128 (100.0%) | $72,059 |
Occupancy by Householder Income Bracket in Chelyan
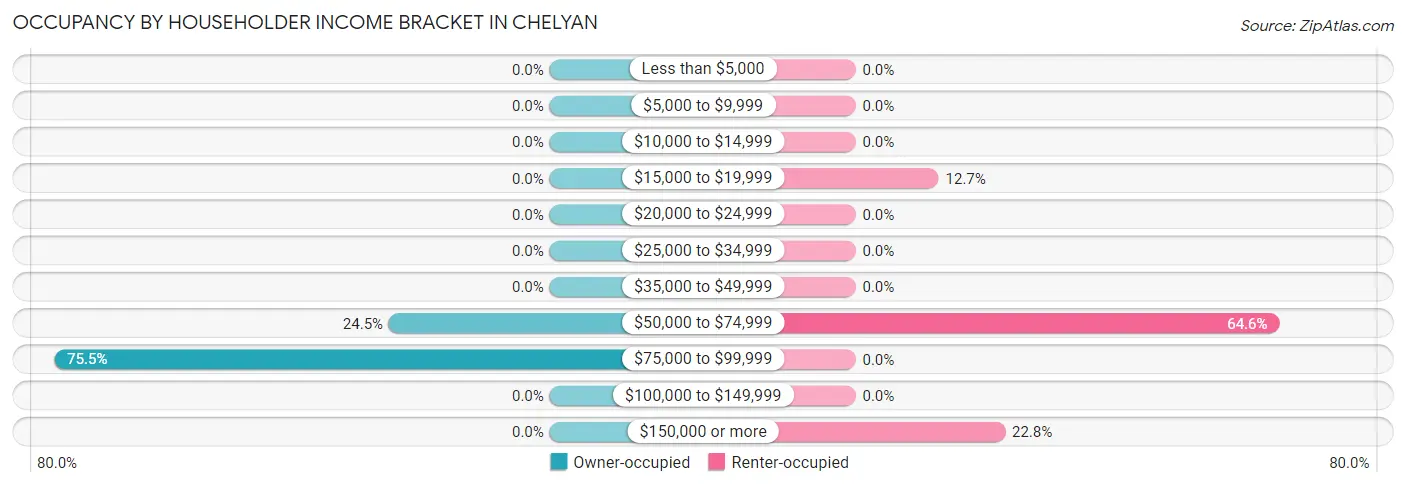
| Income Bracket | Owner-occupied | Renter-occupied |
| Less than $5,000 | 0 (0.0%) | 0 (0.0%) |
| $5,000 to $9,999 | 0 (0.0%) | 0 (0.0%) |
| $10,000 to $14,999 | 0 (0.0%) | 0 (0.0%) |
| $15,000 to $19,999 | 0 (0.0%) | 10 (12.7%) |
| $20,000 to $24,999 | 0 (0.0%) | 0 (0.0%) |
| $25,000 to $34,999 | 0 (0.0%) | 0 (0.0%) |
| $35,000 to $49,999 | 0 (0.0%) | 0 (0.0%) |
| $50,000 to $74,999 | 12 (24.5%) | 51 (64.6%) |
| $75,000 to $99,999 | 37 (75.5%) | 0 (0.0%) |
| $100,000 to $149,999 | 0 (0.0%) | 0 (0.0%) |
| $150,000 or more | 0 (0.0%) | 18 (22.8%) |
| Total | 49 (100.0%) | 79 (100.0%) |
Monthly Housing Cost Tiers in Chelyan
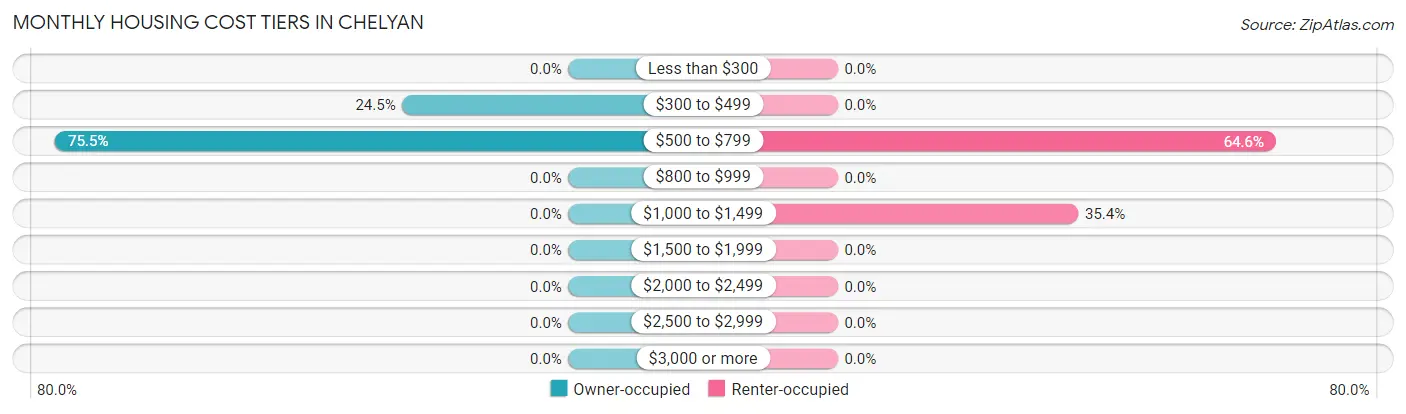
| Monthly Cost | Owner-occupied | Renter-occupied |
| Less than $300 | 0 (0.0%) | 0 (0.0%) |
| $300 to $499 | 12 (24.5%) | 0 (0.0%) |
| $500 to $799 | 37 (75.5%) | 51 (64.6%) |
| $800 to $999 | 0 (0.0%) | 0 (0.0%) |
| $1,000 to $1,499 | 0 (0.0%) | 28 (35.4%) |
| $1,500 to $1,999 | 0 (0.0%) | 0 (0.0%) |
| $2,000 to $2,499 | 0 (0.0%) | 0 (0.0%) |
| $2,500 to $2,999 | 0 (0.0%) | 0 (0.0%) |
| $3,000 or more | 0 (0.0%) | 0 (0.0%) |
| Total | 49 (100.0%) | 79 (100.0%) |
Physical Housing Characteristics in Chelyan
Housing Structures in Chelyan
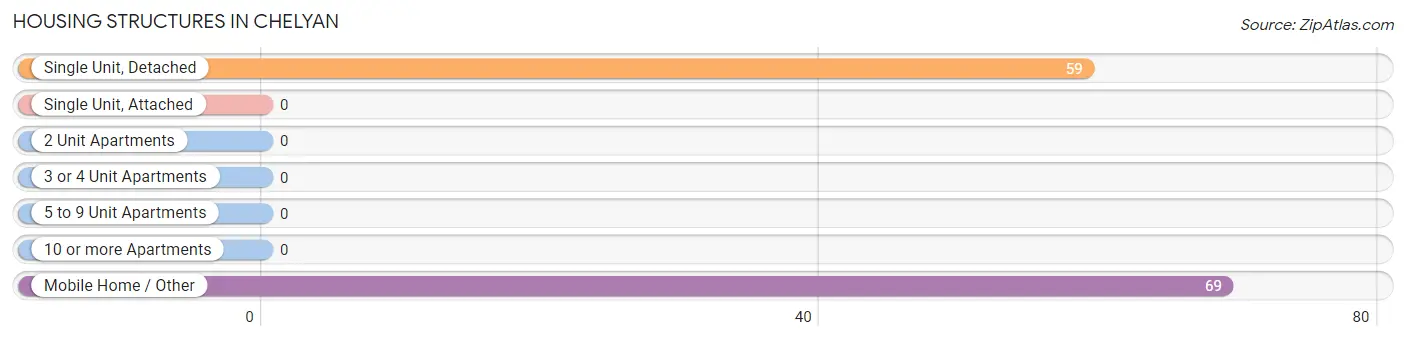
| Structure Type | # Housing Units | % Housing Units |
| Single Unit, Detached | 59 | 46.1% |
| Single Unit, Attached | 0 | 0.0% |
| 2 Unit Apartments | 0 | 0.0% |
| 3 or 4 Unit Apartments | 0 | 0.0% |
| 5 to 9 Unit Apartments | 0 | 0.0% |
| 10 or more Apartments | 0 | 0.0% |
| Mobile Home / Other | 69 | 53.9% |
| Total | 128 | 100.0% |
Housing Structures by Occupancy in Chelyan
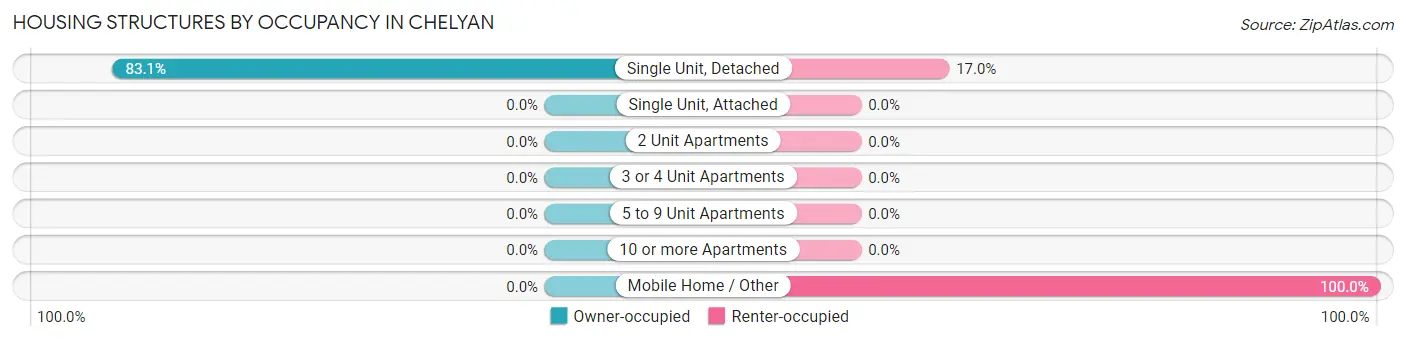
| Structure Type | Owner-occupied | Renter-occupied |
| Single Unit, Detached | 49 (83.1%) | 10 (17.0%) |
| Single Unit, Attached | 0 (0.0%) | 0 (0.0%) |
| 2 Unit Apartments | 0 (0.0%) | 0 (0.0%) |
| 3 or 4 Unit Apartments | 0 (0.0%) | 0 (0.0%) |
| 5 to 9 Unit Apartments | 0 (0.0%) | 0 (0.0%) |
| 10 or more Apartments | 0 (0.0%) | 0 (0.0%) |
| Mobile Home / Other | 0 (0.0%) | 69 (100.0%) |
| Total | 49 (38.3%) | 79 (61.7%) |
Housing Structures by Number of Rooms in Chelyan
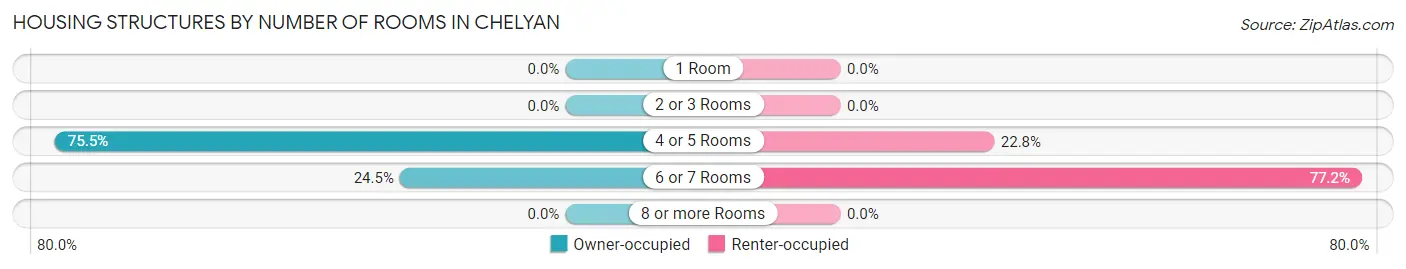
| Number of Rooms | Owner-occupied | Renter-occupied |
| 1 Room | 0 (0.0%) | 0 (0.0%) |
| 2 or 3 Rooms | 0 (0.0%) | 0 (0.0%) |
| 4 or 5 Rooms | 37 (75.5%) | 18 (22.8%) |
| 6 or 7 Rooms | 12 (24.5%) | 61 (77.2%) |
| 8 or more Rooms | 0 (0.0%) | 0 (0.0%) |
| Total | 49 (100.0%) | 79 (100.0%) |
Housing Structure by Heating Type in Chelyan
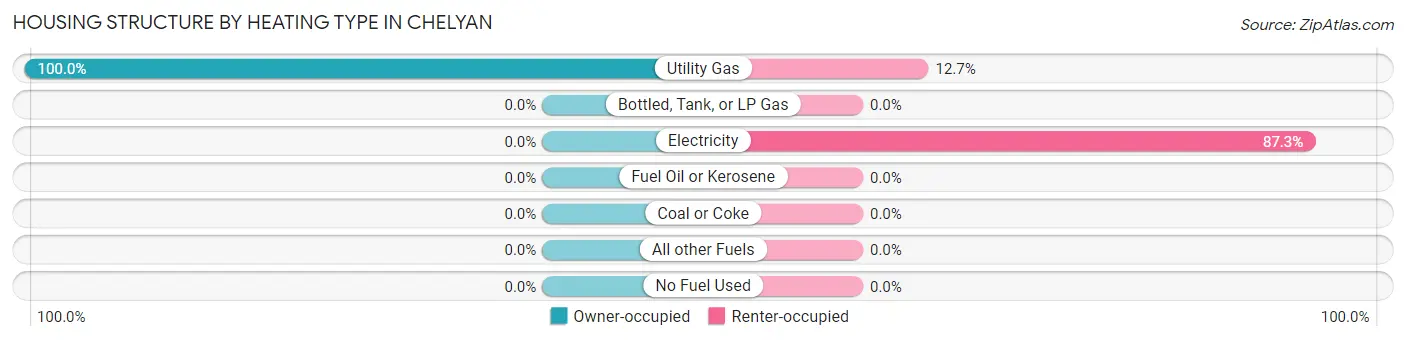
| Heating Type | Owner-occupied | Renter-occupied |
| Utility Gas | 49 (100.0%) | 10 (12.7%) |
| Bottled, Tank, or LP Gas | 0 (0.0%) | 0 (0.0%) |
| Electricity | 0 (0.0%) | 69 (87.3%) |
| Fuel Oil or Kerosene | 0 (0.0%) | 0 (0.0%) |
| Coal or Coke | 0 (0.0%) | 0 (0.0%) |
| All other Fuels | 0 (0.0%) | 0 (0.0%) |
| No Fuel Used | 0 (0.0%) | 0 (0.0%) |
| Total | 49 (100.0%) | 79 (100.0%) |
Household Vehicle Usage in Chelyan
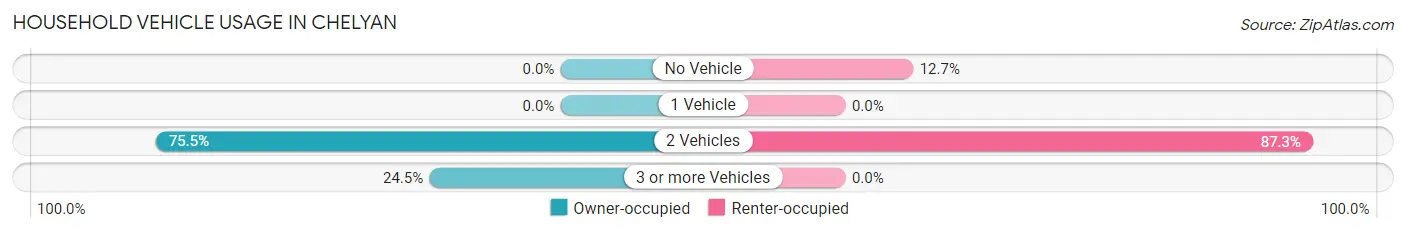
| Vehicles per Household | Owner-occupied | Renter-occupied |
| No Vehicle | 0 (0.0%) | 10 (12.7%) |
| 1 Vehicle | 0 (0.0%) | 0 (0.0%) |
| 2 Vehicles | 37 (75.5%) | 69 (87.3%) |
| 3 or more Vehicles | 12 (24.5%) | 0 (0.0%) |
| Total | 49 (100.0%) | 79 (100.0%) |
Real Estate & Mortgages in Chelyan
Real Estate and Mortgage Overview in Chelyan
| Characteristic | Without Mortgage | With Mortgage |
| Housing Units | 12 | 37 |
| Median Property Value | - | - |
| Median Household Income | - | - |
| Monthly Housing Costs | - | - |
| Real Estate Taxes | - | - |
Property Value by Mortgage Status in Chelyan
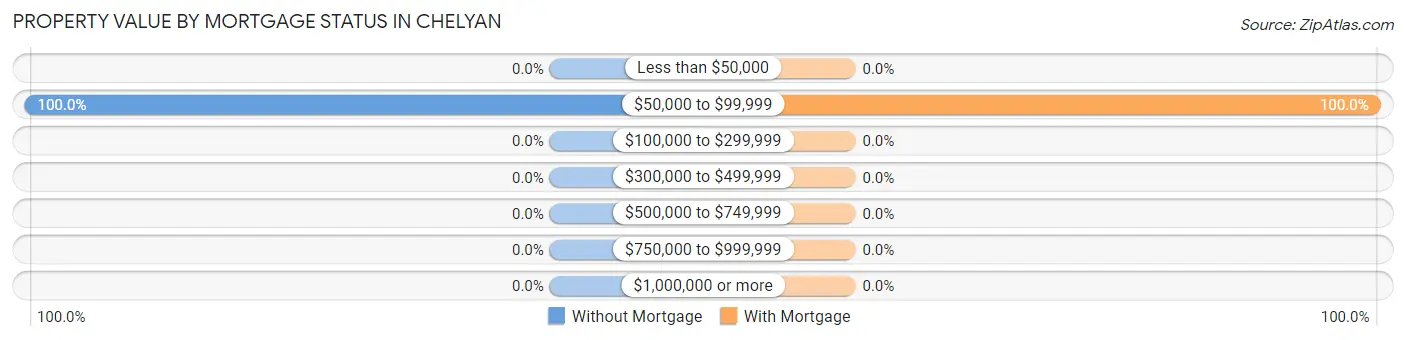
| Property Value | Without Mortgage | With Mortgage |
| Less than $50,000 | 0 (0.0%) | 0 (0.0%) |
| $50,000 to $99,999 | 12 (100.0%) | 37 (100.0%) |
| $100,000 to $299,999 | 0 (0.0%) | 0 (0.0%) |
| $300,000 to $499,999 | 0 (0.0%) | 0 (0.0%) |
| $500,000 to $749,999 | 0 (0.0%) | 0 (0.0%) |
| $750,000 to $999,999 | 0 (0.0%) | 0 (0.0%) |
| $1,000,000 or more | 0 (0.0%) | 0 (0.0%) |
| Total | 12 (100.0%) | 37 (100.0%) |
Household Income by Mortgage Status in Chelyan
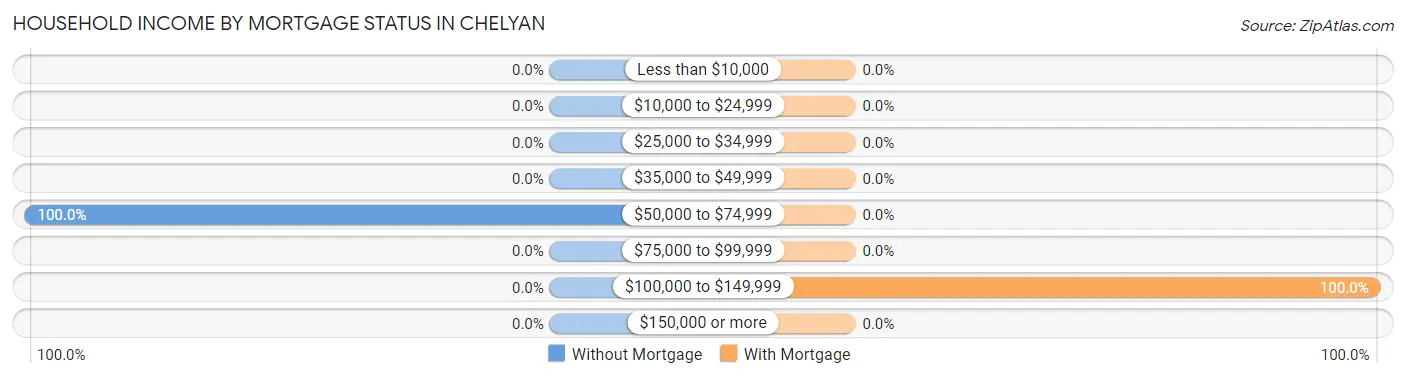
| Household Income | Without Mortgage | With Mortgage |
| Less than $10,000 | 0 (0.0%) | 0 (0.0%) |
| $10,000 to $24,999 | 0 (0.0%) | 0 (0.0%) |
| $25,000 to $34,999 | 0 (0.0%) | 0 (0.0%) |
| $35,000 to $49,999 | 0 (0.0%) | 0 (0.0%) |
| $50,000 to $74,999 | 12 (100.0%) | 0 (0.0%) |
| $75,000 to $99,999 | 0 (0.0%) | 0 (0.0%) |
| $100,000 to $149,999 | 0 (0.0%) | 37 (100.0%) |
| $150,000 or more | 0 (0.0%) | 0 (0.0%) |
| Total | 12 (100.0%) | 37 (100.0%) |
Property Value to Household Income Ratio in Chelyan
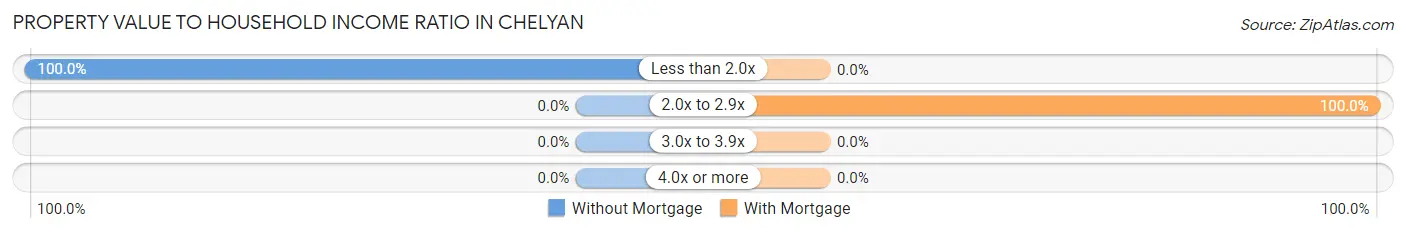
| Value-to-Income Ratio | Without Mortgage | With Mortgage |
| Less than 2.0x | 12 (100.0%) | 0 (0.0%) |
| 2.0x to 2.9x | 0 (0.0%) | 37 (100.0%) |
| 3.0x to 3.9x | 0 (0.0%) | 0 (0.0%) |
| 4.0x or more | 0 (0.0%) | 0 (0.0%) |
| Total | 12 (100.0%) | 37 (100.0%) |
Real Estate Taxes by Mortgage Status in Chelyan
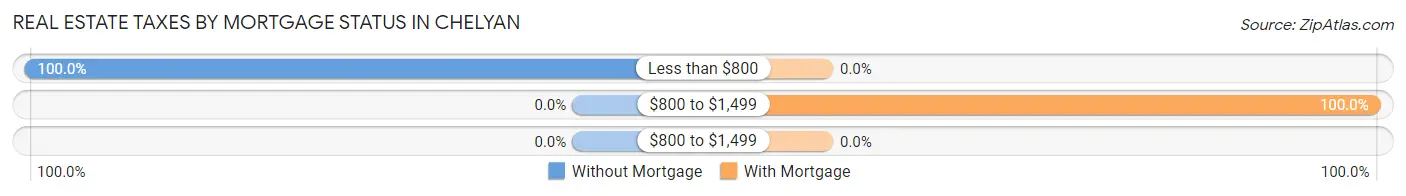
| Property Taxes | Without Mortgage | With Mortgage |
| Less than $800 | 12 (100.0%) | 0 (0.0%) |
| $800 to $1,499 | 0 (0.0%) | 37 (100.0%) |
| $800 to $1,499 | 0 (0.0%) | 0 (0.0%) |
| Total | 12 (100.0%) | 37 (100.0%) |
Health & Disability in Chelyan
Health Insurance Coverage by Age in Chelyan
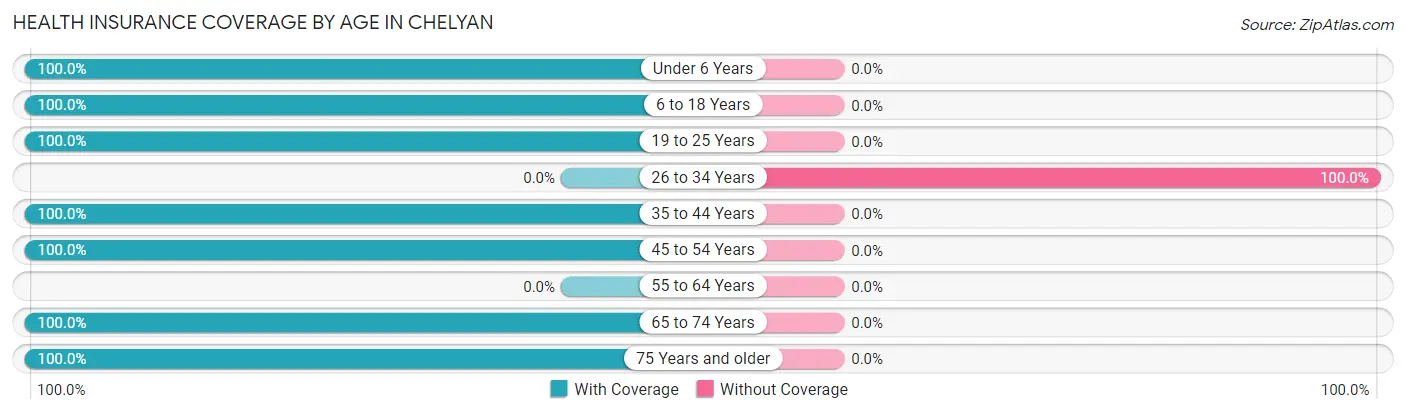
| Age Bracket | With Coverage | Without Coverage |
| Under 6 Years | 84 (100.0%) | 0 (0.0%) |
| 6 to 18 Years | 60 (100.0%) | 0 (0.0%) |
| 19 to 25 Years | 148 (100.0%) | 0 (0.0%) |
| 26 to 34 Years | 0 (0.0%) | 18 (100.0%) |
| 35 to 44 Years | 59 (100.0%) | 0 (0.0%) |
| 45 to 54 Years | 51 (100.0%) | 0 (0.0%) |
| 55 to 64 Years | 0 (0.0%) | 0 (0.0%) |
| 65 to 74 Years | 10 (100.0%) | 0 (0.0%) |
| 75 Years and older | 22 (100.0%) | 0 (0.0%) |
| Total | 434 (96.0%) | 18 (4.0%) |
Health Insurance Coverage by Citizenship Status in Chelyan
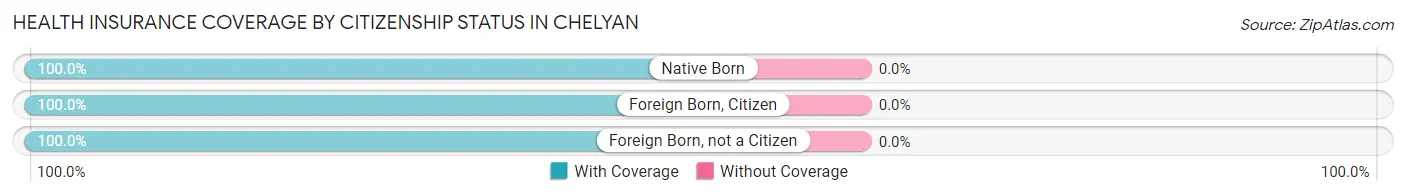
| Citizenship Status | With Coverage | Without Coverage |
| Native Born | 84 (100.0%) | 0 (0.0%) |
| Foreign Born, Citizen | 60 (100.0%) | 0 (0.0%) |
| Foreign Born, not a Citizen | 148 (100.0%) | 0 (0.0%) |
Health Insurance Coverage by Household Income in Chelyan
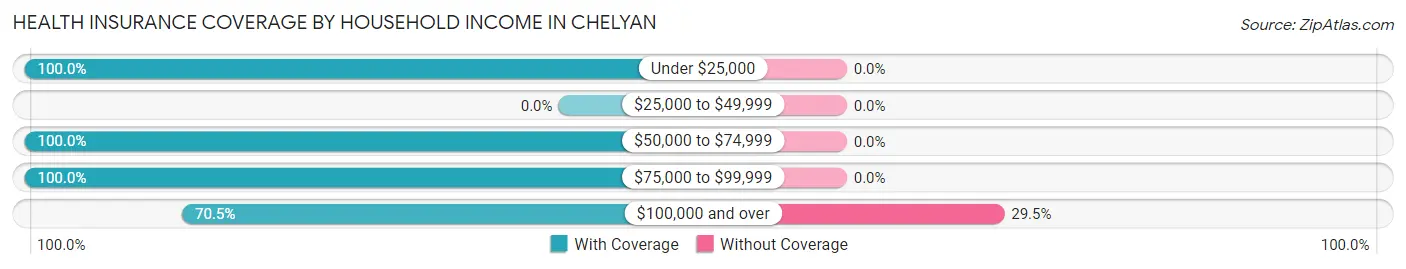
| Household Income | With Coverage | Without Coverage |
| Under $25,000 | 10 (100.0%) | 0 (0.0%) |
| $25,000 to $49,999 | 0 (0.0%) | 0 (0.0%) |
| $50,000 to $74,999 | 262 (100.0%) | 0 (0.0%) |
| $75,000 to $99,999 | 119 (100.0%) | 0 (0.0%) |
| $100,000 and over | 43 (70.5%) | 18 (29.5%) |
Public vs Private Health Insurance Coverage by Age in Chelyan

| Age Bracket | Public Insurance | Private Insurance |
| Under 6 | 43 (51.2%) | 41 (48.8%) |
| 6 to 18 Years | 60 (100.0%) | 0 (0.0%) |
| 19 to 25 Years | 70 (47.3%) | 78 (52.7%) |
| 25 to 34 Years | 0 (0.0%) | 0 (0.0%) |
| 35 to 44 Years | 0 (0.0%) | 59 (100.0%) |
| 45 to 54 Years | 0 (0.0%) | 51 (100.0%) |
| 55 to 64 Years | 0 (0.0%) | 0 (0.0%) |
| 65 to 74 Years | 10 (100.0%) | 0 (0.0%) |
| 75 Years and over | 22 (100.0%) | 22 (100.0%) |
| Total | 205 (45.4%) | 251 (55.5%) |
Disability Status by Sex by Age in Chelyan
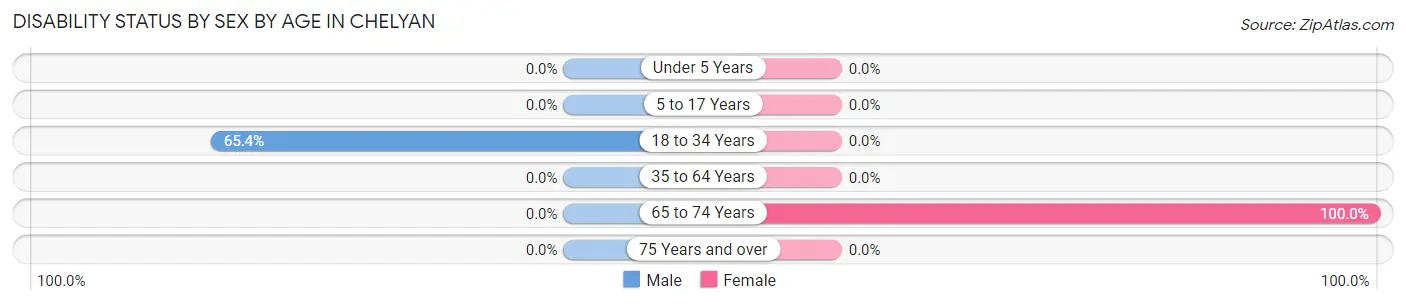
| Age Bracket | Male | Female |
| Under 5 Years | 0 (0.0%) | 0 (0.0%) |
| 5 to 17 Years | 0 (0.0%) | 0 (0.0%) |
| 18 to 34 Years | 70 (65.4%) | 0 (0.0%) |
| 35 to 64 Years | 0 (0.0%) | 0 (0.0%) |
| 65 to 74 Years | 0 (0.0%) | 10 (100.0%) |
| 75 Years and over | 0 (0.0%) | 0 (0.0%) |
Disability Class by Sex by Age in Chelyan
Disability Class: Hearing Difficulty
| Age Bracket | Male | Female |
| Under 5 Years | 0 (0.0%) | 0 (0.0%) |
| 5 to 17 Years | 0 (0.0%) | 0 (0.0%) |
| 18 to 34 Years | 0 (0.0%) | 0 (0.0%) |
| 35 to 64 Years | 0 (0.0%) | 0 (0.0%) |
| 65 to 74 Years | 0 (0.0%) | 0 (0.0%) |
| 75 Years and over | 0 (0.0%) | 0 (0.0%) |
Disability Class: Vision Difficulty
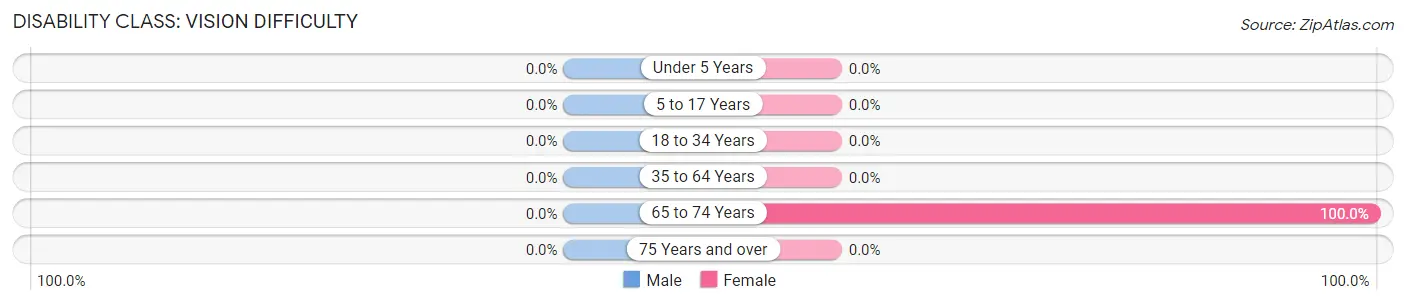
| Age Bracket | Male | Female |
| Under 5 Years | 0 (0.0%) | 0 (0.0%) |
| 5 to 17 Years | 0 (0.0%) | 0 (0.0%) |
| 18 to 34 Years | 0 (0.0%) | 0 (0.0%) |
| 35 to 64 Years | 0 (0.0%) | 0 (0.0%) |
| 65 to 74 Years | 0 (0.0%) | 10 (100.0%) |
| 75 Years and over | 0 (0.0%) | 0 (0.0%) |
Disability Class: Cognitive Difficulty
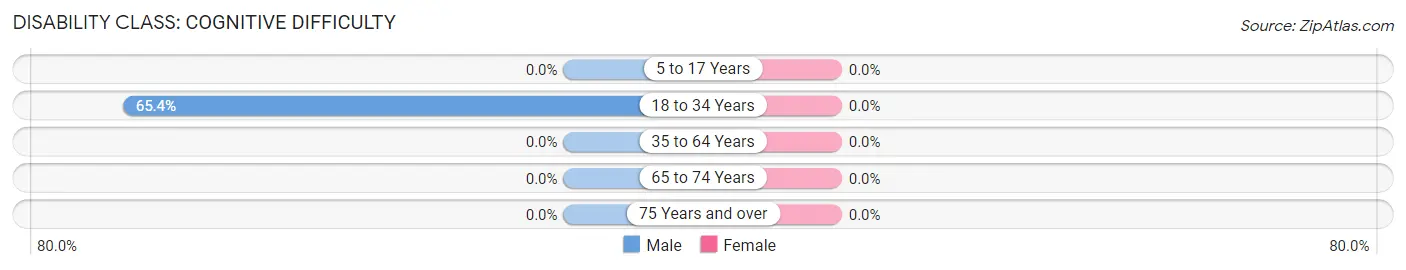
| Age Bracket | Male | Female |
| 5 to 17 Years | 0 (0.0%) | 0 (0.0%) |
| 18 to 34 Years | 70 (65.4%) | 0 (0.0%) |
| 35 to 64 Years | 0 (0.0%) | 0 (0.0%) |
| 65 to 74 Years | 0 (0.0%) | 0 (0.0%) |
| 75 Years and over | 0 (0.0%) | 0 (0.0%) |
Disability Class: Ambulatory Difficulty
| Age Bracket | Male | Female |
| 5 to 17 Years | 0 (0.0%) | 0 (0.0%) |
| 18 to 34 Years | 0 (0.0%) | 0 (0.0%) |
| 35 to 64 Years | 0 (0.0%) | 0 (0.0%) |
| 65 to 74 Years | 0 (0.0%) | 0 (0.0%) |
| 75 Years and over | 0 (0.0%) | 0 (0.0%) |
Disability Class: Self-Care Difficulty
| Age Bracket | Male | Female |
| 5 to 17 Years | 0 (0.0%) | 0 (0.0%) |
| 18 to 34 Years | 0 (0.0%) | 0 (0.0%) |
| 35 to 64 Years | 0 (0.0%) | 0 (0.0%) |
| 65 to 74 Years | 0 (0.0%) | 0 (0.0%) |
| 75 Years and over | 0 (0.0%) | 0 (0.0%) |
Technology Access in Chelyan
Computing Device Access in Chelyan
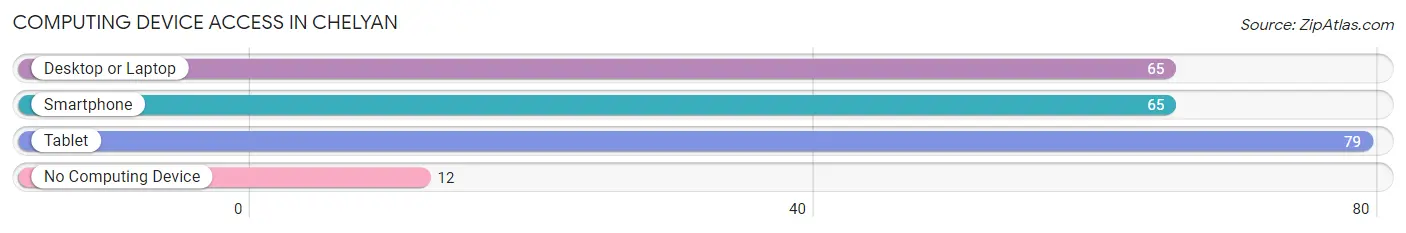
| Device Type | # Households | % Households |
| Desktop or Laptop | 65 | 50.8% |
| Smartphone | 65 | 50.8% |
| Tablet | 79 | 61.7% |
| No Computing Device | 12 | 9.4% |
| Total | 128 | 100.0% |
Internet Access in Chelyan
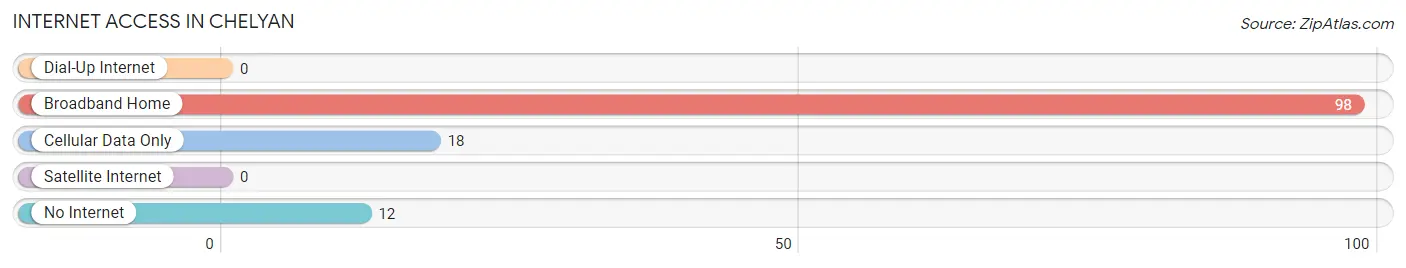
| Internet Type | # Households | % Households |
| Dial-Up Internet | 0 | 0.0% |
| Broadband Home | 98 | 76.6% |
| Cellular Data Only | 18 | 14.1% |
| Satellite Internet | 0 | 0.0% |
| No Internet | 12 | 9.4% |
| Total | 128 | 100.0% |
Chelyan Summary
Chelyan is a small town located in Kanawha County, West Virginia. It is situated along the Kanawha River, approximately 15 miles east of Charleston, the state capital. The town was founded in 1883 and was named after the Chelyan family, who were early settlers in the area. As of the 2010 census, the population of Chelyan was 1,845.
Geography
Chelyan is located at 38°20'45"N 81°30'45"W (38.3458, -81.5125). It is situated along the Kanawha River, approximately 15 miles east of Charleston, the state capital. The town is located in the Appalachian Mountains and is surrounded by hills and valleys. The elevation of Chelyan is 645 feet above sea level.
The climate in Chelyan is humid subtropical, with hot, humid summers and cold, wet winters. The average annual temperature is 54°F, with an average high of 73°F in July and an average low of 34°F in January. The average annual precipitation is 43 inches, with an average of 4 inches of snowfall per year.
Economy
Chelyan’s economy is largely based on the coal industry. The town is home to several coal mines, including the Chelyan Mine, which is owned by the Alpha Natural Resources company. The town is also home to several small businesses, including restaurants, convenience stores, and gas stations.
Demographics
As of the 2010 census, the population of Chelyan was 1,845. The racial makeup of the town was 97.2% White, 0.9% African American, 0.2% Native American, 0.2% Asian, 0.1% Pacific Islander, 0.2% from other races, and 1.2% from two or more races. Hispanic or Latino of any race were 0.7% of the population.
The median household income in Chelyan was $30,938, and the median family income was $37,813. The per capita income for the town was $15,945. About 17.2% of families and 20.2% of the population were below the poverty line, including 28.3% of those under age 18 and 11.2% of those age 65 or over.
Conclusion
Chelyan is a small town located in Kanawha County, West Virginia. It is situated along the Kanawha River, approximately 15 miles east of Charleston, the state capital. The town was founded in 1883 and was named after the Chelyan family, who were early settlers in the area. As of the 2010 census, the population of Chelyan was 1,845. The town’s economy is largely based on the coal industry, and it is home to several small businesses. The racial makeup of the town was 97.2% White, 0.9% African American, 0.2% Native American, 0.2% Asian, 0.1% Pacific Islander, 0.2% from other races, and 1.2% from two or more races. The median household income in Chelyan was $30,938, and the median family income was $37,813. About 17.2% of families and 20.2% of the population were below the poverty line.
Common Questions
What is Per Capita Income in Chelyan?
Per Capita income in Chelyan is $29,724.
What is the Median Family Income in Chelyan?
Median Family Income in Chelyan is $72,304.
What is the Median Household income in Chelyan?
Median Household Income in Chelyan is $72,059.
What is Inequality or Gini Index in Chelyan?
Inequality or Gini Index in Chelyan is 0.30.
What is the Total Population of Chelyan?
Total Population of Chelyan is 452.
What is the Total Male Population of Chelyan?
Total Male Population of Chelyan is 162.
What is the Total Female Population of Chelyan?
Total Female Population of Chelyan is 290.
What is the Ratio of Males per 100 Females in Chelyan?
There are 55.86 Males per 100 Females in Chelyan.
What is the Ratio of Females per 100 Males in Chelyan?
There are 179.01 Females per 100 Males in Chelyan.
What is the Median Population Age in Chelyan?
Median Population Age in Chelyan is 24.3 Years.
What is the Average Family Size in Chelyan
Average Family Size in Chelyan is 3.8 People.
What is the Average Household Size in Chelyan
Average Household Size in Chelyan is 3.5 People.
How Large is the Labor Force in Chelyan?
There are 155 People in the Labor Forcein in Chelyan.
What is the Percentage of People in the Labor Force in Chelyan?
50.3% of People are in the Labor Force in Chelyan.