Van, WV Map & Demographics
Van Map
Van Overview
$18,608
PER CAPITA INCOME
0.33
INEQUALITY / GINI INDEX
133
TOTAL POPULATION
79
MALE POPULATION
54
FEMALE POPULATION
146.30
MALES / 100 FEMALES
68.35
FEMALES / 100 MALES
49.5
MEDIAN AGE
3.1
AVG FAMILY SIZE
3.0
AVG HOUSEHOLD SIZE
72
LABOR FORCE [ PEOPLE ]
64.9%
PERCENT IN LABOR FORCE
Van Zip Codes
Van Area Codes
Income in Van
Income Overview in Van
| Characteristic | Number | Measure |
| Per Capita Income | 133 | $18,608 |
| Median Family Income | 32 | $0 |
| Mean Family Income | 32 | $40,847 |
| Median Household Income | 45 | $0 |
| Mean Household Income | 45 | $38,769 |
| Income Deficit | 32 | $0 |
| Wage / Income Gap (%) | 133 | 0.00% |
| Wage / Income Gap ($) | 133 | 100.00¢ per $1 |
| Gini / Inequality Index | 133 | 0.33 |
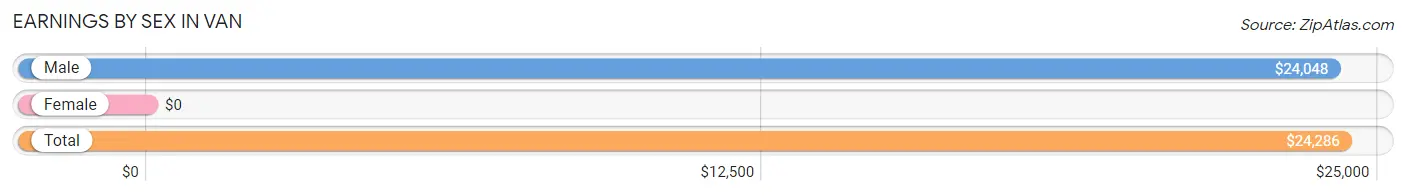
Earnings by Sex in Van
| Sex | Number | Average Earnings |
| Male | 52 (72.2%) | $24,048 |
| Female | 20 (27.8%) | $0 |
| Total | 72 (100.0%) | $24,286 |
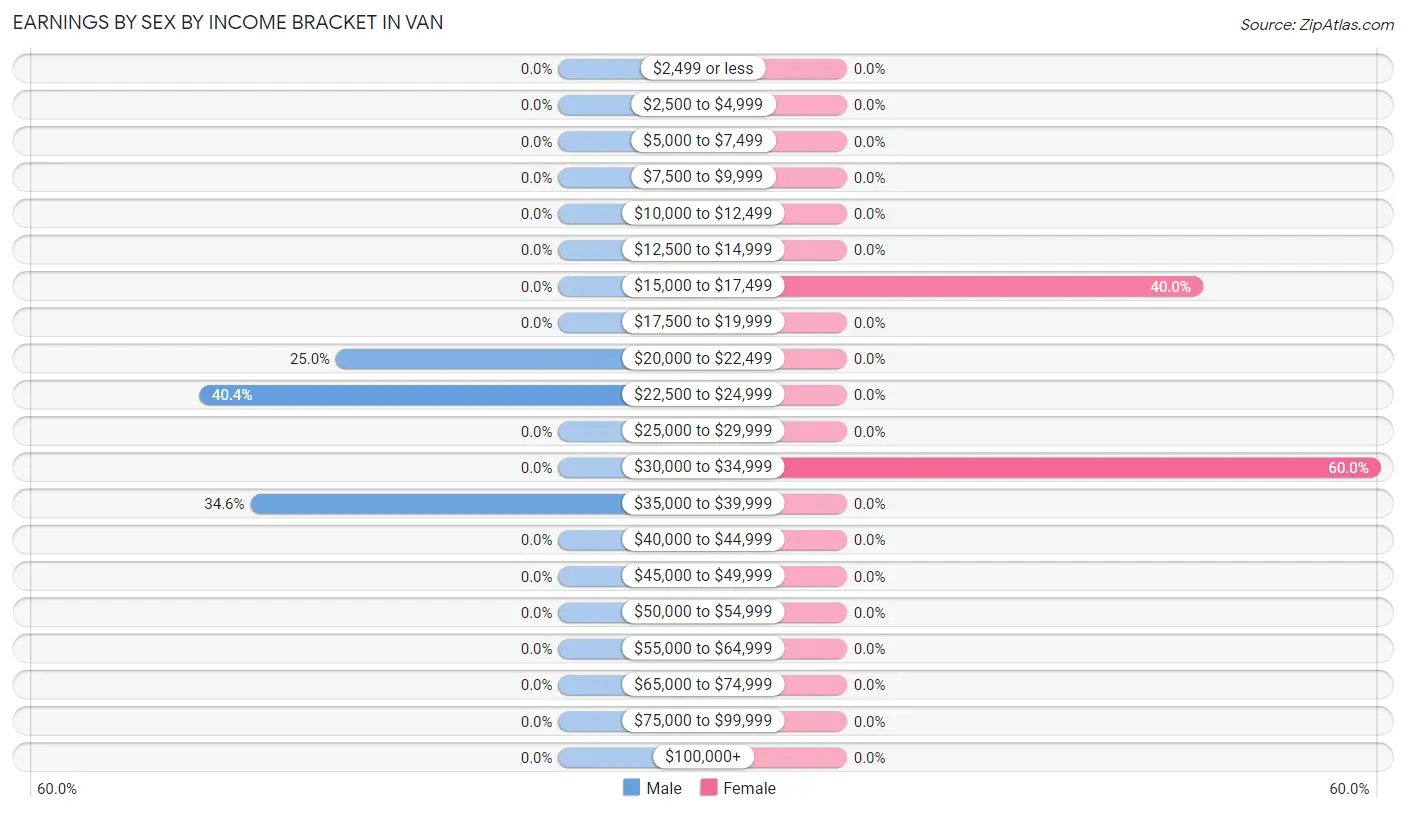
Earnings by Sex by Income Bracket in Van
The most common earnings brackets in Van are $22,500 to $24,999 for men (21 | 40.4%) and $30,000 to $34,999 for women (12 | 60.0%).
| Income | Male | Female |
| $2,499 or less | 0 (0.0%) | 0 (0.0%) |
| $2,500 to $4,999 | 0 (0.0%) | 0 (0.0%) |
| $5,000 to $7,499 | 0 (0.0%) | 0 (0.0%) |
| $7,500 to $9,999 | 0 (0.0%) | 0 (0.0%) |
| $10,000 to $12,499 | 0 (0.0%) | 0 (0.0%) |
| $12,500 to $14,999 | 0 (0.0%) | 0 (0.0%) |
| $15,000 to $17,499 | 0 (0.0%) | 8 (40.0%) |
| $17,500 to $19,999 | 0 (0.0%) | 0 (0.0%) |
| $20,000 to $22,499 | 13 (25.0%) | 0 (0.0%) |
| $22,500 to $24,999 | 21 (40.4%) | 0 (0.0%) |
| $25,000 to $29,999 | 0 (0.0%) | 0 (0.0%) |
| $30,000 to $34,999 | 0 (0.0%) | 12 (60.0%) |
| $35,000 to $39,999 | 18 (34.6%) | 0 (0.0%) |
| $40,000 to $44,999 | 0 (0.0%) | 0 (0.0%) |
| $45,000 to $49,999 | 0 (0.0%) | 0 (0.0%) |
| $50,000 to $54,999 | 0 (0.0%) | 0 (0.0%) |
| $55,000 to $64,999 | 0 (0.0%) | 0 (0.0%) |
| $65,000 to $74,999 | 0 (0.0%) | 0 (0.0%) |
| $75,000 to $99,999 | 0 (0.0%) | 0 (0.0%) |
| $100,000+ | 0 (0.0%) | 0 (0.0%) |
| Total | 52 (100.0%) | 20 (100.0%) |
Earnings by Sex by Educational Attainment in Van
| Educational Attainment | Male Income | Female Income |
| Less than High School | - | - |
| High School Diploma | - | - |
| College or Associate's Degree | - | - |
| Bachelor's Degree | - | - |
| Graduate Degree | - | - |
| Total | $24,048 | $0 |
Family Income in Van
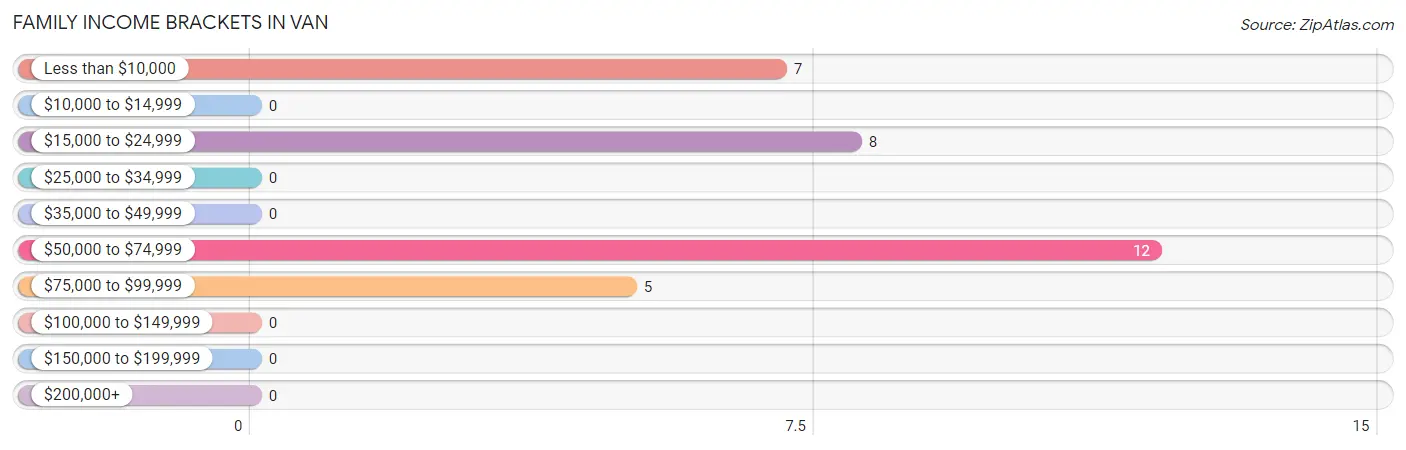
Family Income Brackets in Van
According to the Van family income data, there are 12 families falling into the $50,000 to $74,999 income range, which is the most common income bracket and makes up 37.5% of all families.
| Income Bracket | # Families | % Families |
| Less than $10,000 | 7 | 21.9% |
| $10,000 to $14,999 | 0 | 0.0% |
| $15,000 to $24,999 | 8 | 25.0% |
| $25,000 to $34,999 | 0 | 0.0% |
| $35,000 to $49,999 | 0 | 0.0% |
| $50,000 to $74,999 | 12 | 37.5% |
| $75,000 to $99,999 | 5 | 15.6% |
| $100,000 to $149,999 | 0 | 0.0% |
| $150,000 to $199,999 | 0 | 0.0% |
| $200,000+ | 0 | 0.0% |
Family Income by Famaliy Size in Van
| Income Bracket | # Families | Median Income |
| 2-Person Families | 32 (100.0%) | $0 |
| 3-Person Families | 0 (0.0%) | $0 |
| 4-Person Families | 0 (0.0%) | $0 |
| 5-Person Families | 0 (0.0%) | $0 |
| 6-Person Families | 0 (0.0%) | $0 |
| 7+ Person Families | 0 (0.0%) | $0 |
| Total | 32 (100.0%) | $0 |
Family Income by Number of Earners in Van
| Number of Earners | # Families | Median Income |
| No Earners | 7 (21.9%) | $0 |
| 1 Earner | 13 (40.6%) | $0 |
| 2 Earners | 12 (37.5%) | $0 |
| 3+ Earners | 0 (0.0%) | $0 |
| Total | 32 (100.0%) | $0 |
Household Income in Van
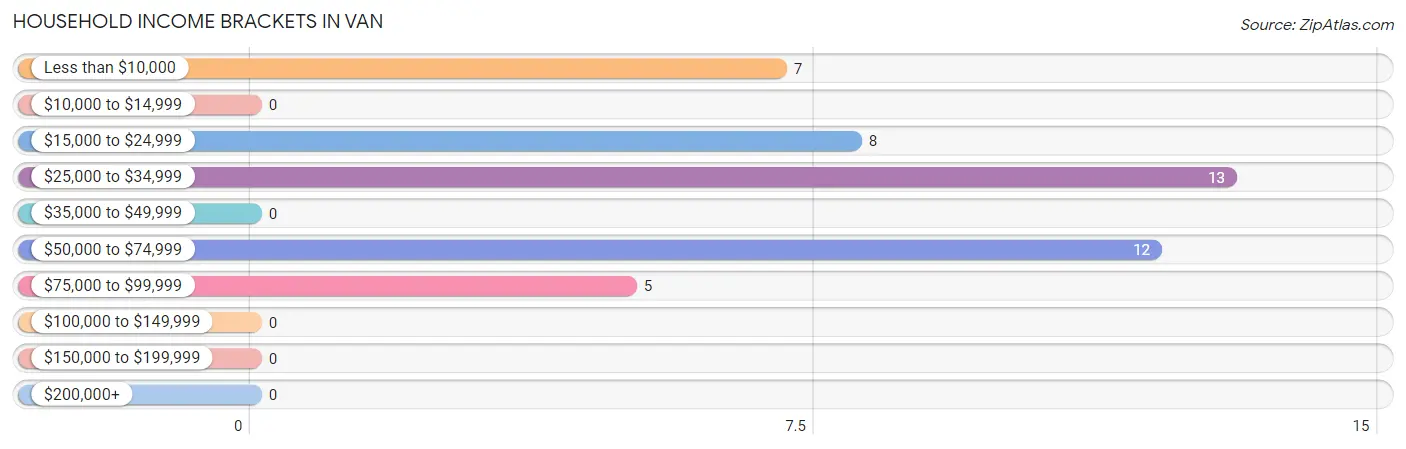
Household Income Brackets in Van
With 13 households falling in the category, the $25,000 to $34,999 income range is the most frequent in Van, accounting for 28.9% of all households.
| Income Bracket | # Households | % Households |
| Less than $10,000 | 7 | 15.6% |
| $10,000 to $14,999 | 0 | 0.0% |
| $15,000 to $24,999 | 8 | 17.8% |
| $25,000 to $34,999 | 13 | 28.9% |
| $35,000 to $49,999 | 0 | 0.0% |
| $50,000 to $74,999 | 12 | 26.7% |
| $75,000 to $99,999 | 5 | 11.1% |
| $100,000 to $149,999 | 0 | 0.0% |
| $150,000 to $199,999 | 0 | 0.0% |
| $200,000+ | 0 | 0.0% |
Household Income by Householder Age in Van
The median household income in Van is $0, with the highest median household income of $28,558 found in the 65+ years age bracket for the primary householder. A total of 25 households (55.6%) fall into this category.
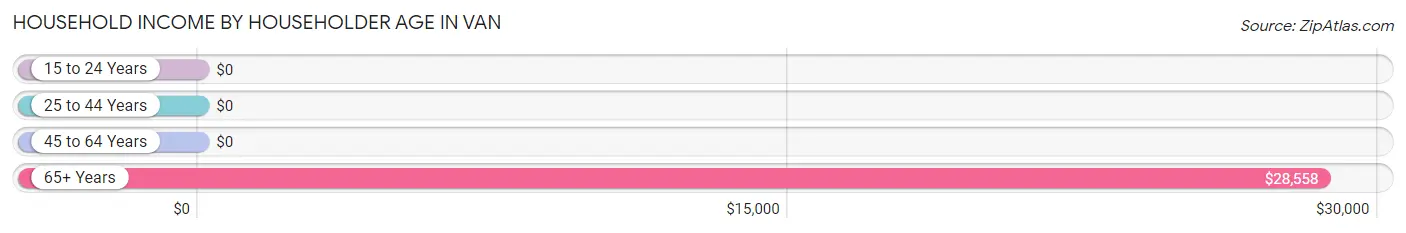
| Income Bracket | # Households | Median Income |
| 15 to 24 Years | 0 (0.0%) | $0 |
| 25 to 44 Years | 0 (0.0%) | $0 |
| 45 to 64 Years | 20 (44.4%) | $0 |
| 65+ Years | 25 (55.6%) | $28,558 |
| Total | 45 (100.0%) | $0 |
Poverty in Van
Income Below Poverty by Sex and Age in Van
With 34.2% poverty level for males and 13.0% for females among the residents of Van, 16 and 17 year old males and 65 to 74 year old females are the most vulnerable to poverty, with 20 males (100.0%) and 7 females (58.3%) in their respective age groups living below the poverty level.
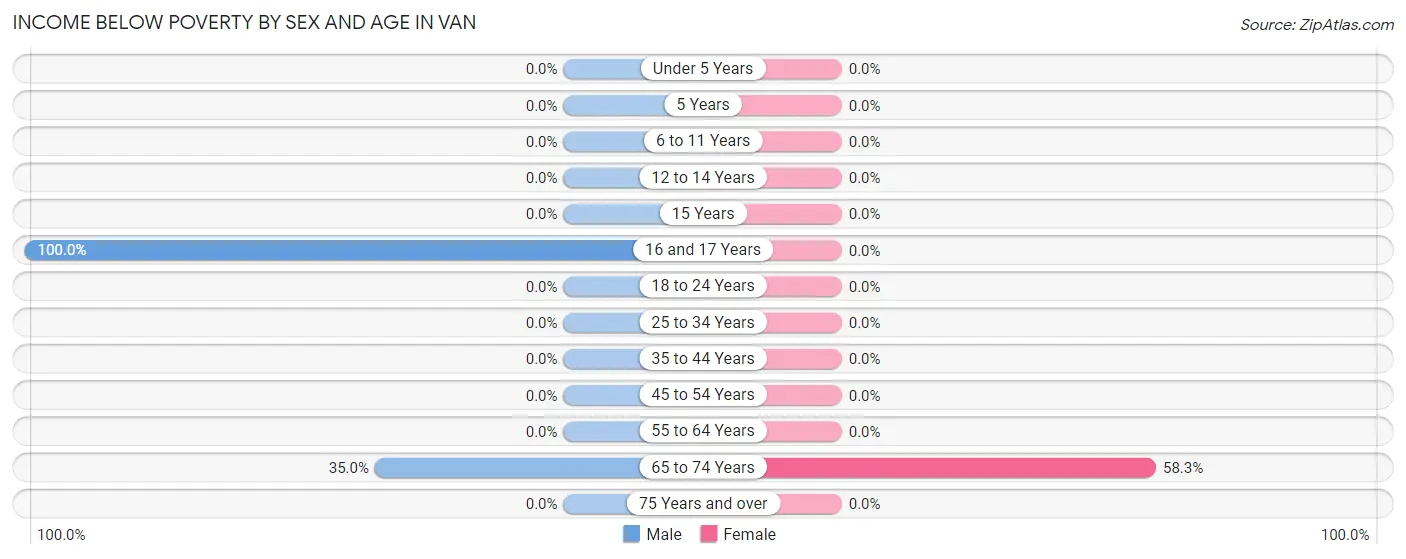
| Age Bracket | Male | Female |
| Under 5 Years | 0 (0.0%) | 0 (0.0%) |
| 5 Years | 0 (0.0%) | 0 (0.0%) |
| 6 to 11 Years | 0 (0.0%) | 0 (0.0%) |
| 12 to 14 Years | 0 (0.0%) | 0 (0.0%) |
| 15 Years | 0 (0.0%) | 0 (0.0%) |
| 16 and 17 Years | 20 (100.0%) | 0 (0.0%) |
| 18 to 24 Years | 0 (0.0%) | 0 (0.0%) |
| 25 to 34 Years | 0 (0.0%) | 0 (0.0%) |
| 35 to 44 Years | 0 (0.0%) | 0 (0.0%) |
| 45 to 54 Years | 0 (0.0%) | 0 (0.0%) |
| 55 to 64 Years | 0 (0.0%) | 0 (0.0%) |
| 65 to 74 Years | 7 (35.0%) | 7 (58.3%) |
| 75 Years and over | 0 (0.0%) | 0 (0.0%) |
| Total | 27 (34.2%) | 7 (13.0%) |
Income Above Poverty by Sex and Age in Van
According to the poverty statistics in Van, males aged 25 to 34 years and females aged 12 to 14 years are the age groups that are most secure financially, with 100.0% of males and 100.0% of females in these age groups living above the poverty line.
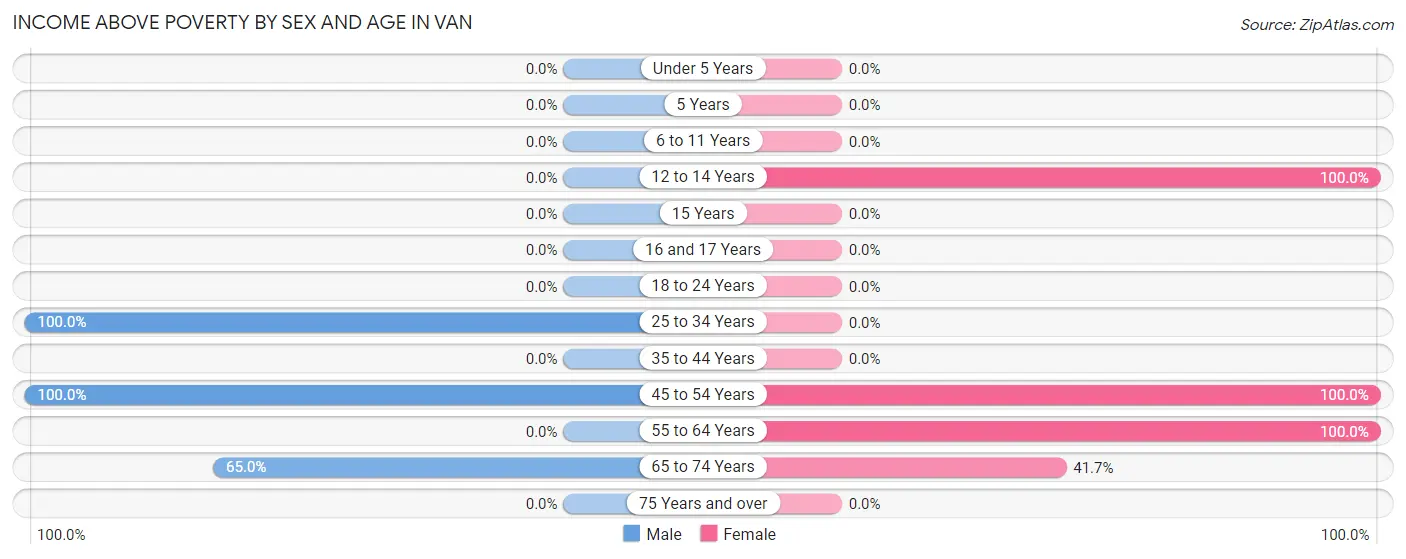
| Age Bracket | Male | Female |
| Under 5 Years | 0 (0.0%) | 0 (0.0%) |
| 5 Years | 0 (0.0%) | 0 (0.0%) |
| 6 to 11 Years | 0 (0.0%) | 0 (0.0%) |
| 12 to 14 Years | 0 (0.0%) | 22 (100.0%) |
| 15 Years | 0 (0.0%) | 0 (0.0%) |
| 16 and 17 Years | 0 (0.0%) | 0 (0.0%) |
| 18 to 24 Years | 0 (0.0%) | 0 (0.0%) |
| 25 to 34 Years | 18 (100.0%) | 0 (0.0%) |
| 35 to 44 Years | 0 (0.0%) | 0 (0.0%) |
| 45 to 54 Years | 21 (100.0%) | 12 (100.0%) |
| 55 to 64 Years | 0 (0.0%) | 8 (100.0%) |
| 65 to 74 Years | 13 (65.0%) | 5 (41.7%) |
| 75 Years and over | 0 (0.0%) | 0 (0.0%) |
| Total | 52 (65.8%) | 47 (87.0%) |
Income Below Poverty Among Married-Couple Families in Van
The poverty statistics for married-couple families in Van show that 36.8% or 7 of the total 19 families live below the poverty line. Families with no children have the highest poverty rate of 36.8%, comprising of 7 families. On the other hand, families with no children have the lowest poverty rate of 36.8%, which includes 7 families.
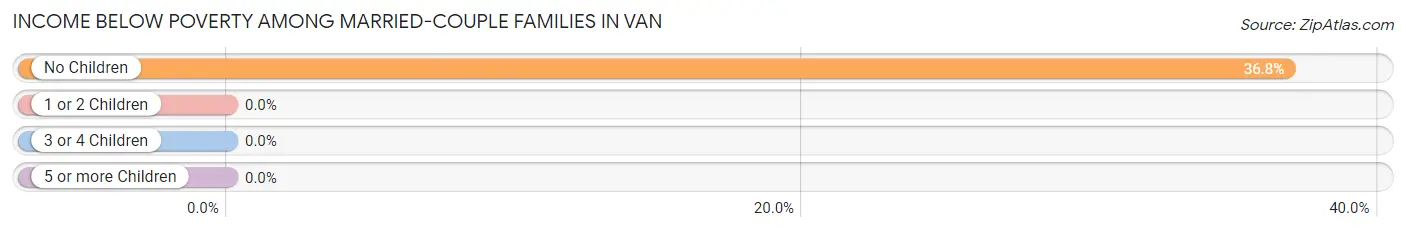
| Children | Above Poverty | Below Poverty |
| No Children | 12 (63.2%) | 7 (36.8%) |
| 1 or 2 Children | 0 (0.0%) | 0 (0.0%) |
| 3 or 4 Children | 0 (0.0%) | 0 (0.0%) |
| 5 or more Children | 0 (0.0%) | 0 (0.0%) |
| Total | 12 (63.2%) | 7 (36.8%) |
Income Below Poverty Among Single-Parent Households in Van
| Children | Single Father | Single Mother |
| No Children | 0 (0.0%) | 0 (0.0%) |
| 1 or 2 Children | 0 (0.0%) | 0 (0.0%) |
| 3 or 4 Children | 0 (0.0%) | 0 (0.0%) |
| 5 or more Children | 0 (0.0%) | 0 (0.0%) |
| Total | 0 (0.0%) | 0 (0.0%) |
Income Below Poverty Among Married-Couple vs Single-Parent Households in Van
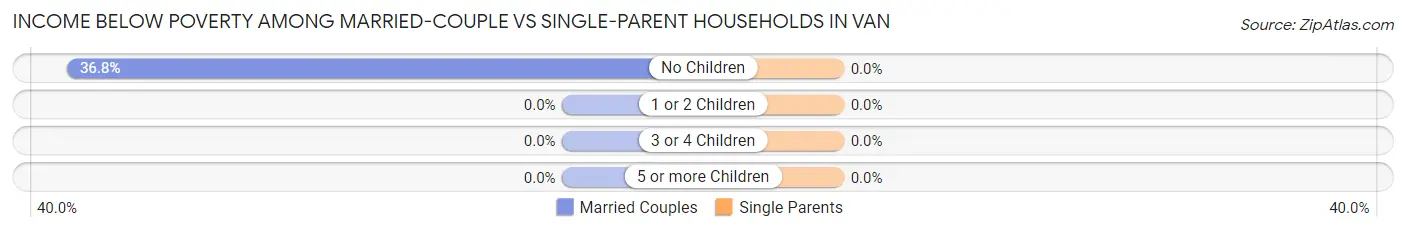
| Children | Married-Couple Families | Single-Parent Households |
| No Children | 7 (36.8%) | 0 (0.0%) |
| 1 or 2 Children | 0 (0.0%) | 0 (0.0%) |
| 3 or 4 Children | 0 (0.0%) | 0 (0.0%) |
| 5 or more Children | 0 (0.0%) | 0 (0.0%) |
| Total | 7 (36.8%) | 0 (0.0%) |
Race in Van
The most populous races in Van are White / Caucasian (98 | 73.7%), Two or more Races (22 | 16.5%), and Black / African American (13 | 9.8%).
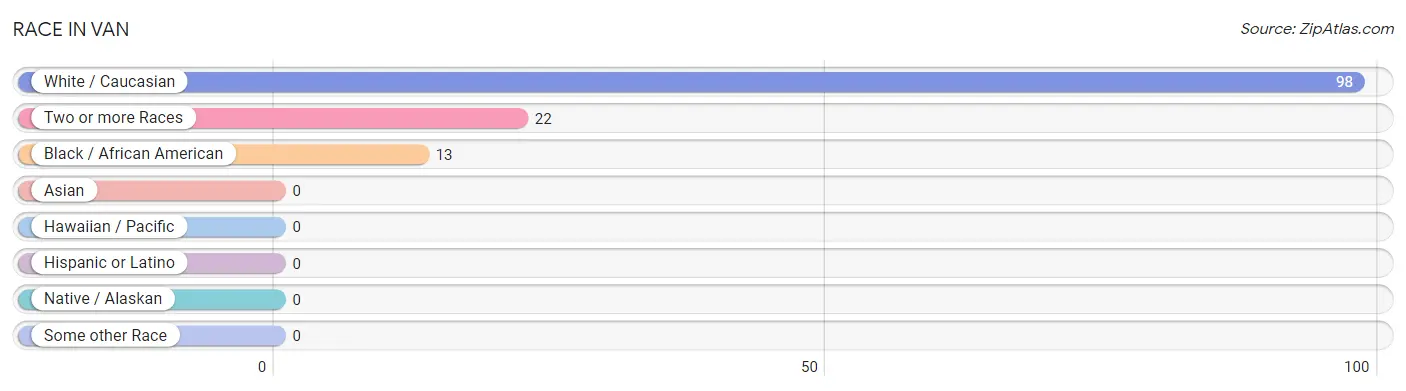
| Race | # Population | % Population |
| Asian | 0 | 0.0% |
| Black / African American | 13 | 9.8% |
| Hawaiian / Pacific | 0 | 0.0% |
| Hispanic or Latino | 0 | 0.0% |
| Native / Alaskan | 0 | 0.0% |
| White / Caucasian | 98 | 73.7% |
| Two or more Races | 22 | 16.5% |
| Some other Race | 0 | 0.0% |
| Total | 133 | 100.0% |
Ancestry in Van
The most populous ancestries reported in Van are American (53 | 39.9%), French (30 | 22.6%), German (30 | 22.6%), English (7 | 5.3%), and Greek (7 | 5.3%), together accounting for 95.5% of all Van residents.
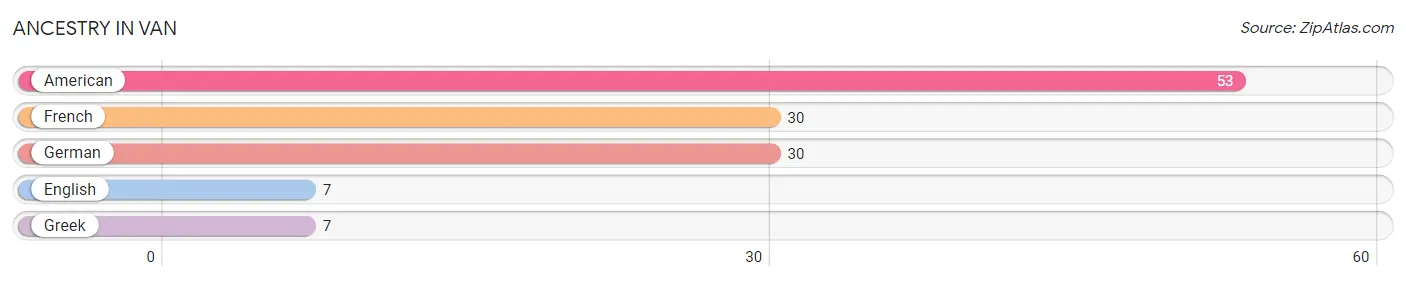
| Ancestry | # Population | % Population |
| American | 53 | 39.9% |
| English | 7 | 5.3% |
| French | 30 | 22.6% |
| German | 30 | 22.6% |
| Greek | 7 | 5.3% | View All 5 Rows |
Immigrants in Van

| Immigration Origin | # Population | % Population | View All 0 Rows |
Sex and Age in Van
Sex and Age in Van
The most populous age groups in Van are 50 to 54 Years (21 | 26.6%) for men and 10 to 14 Years (22 | 40.7%) for women.
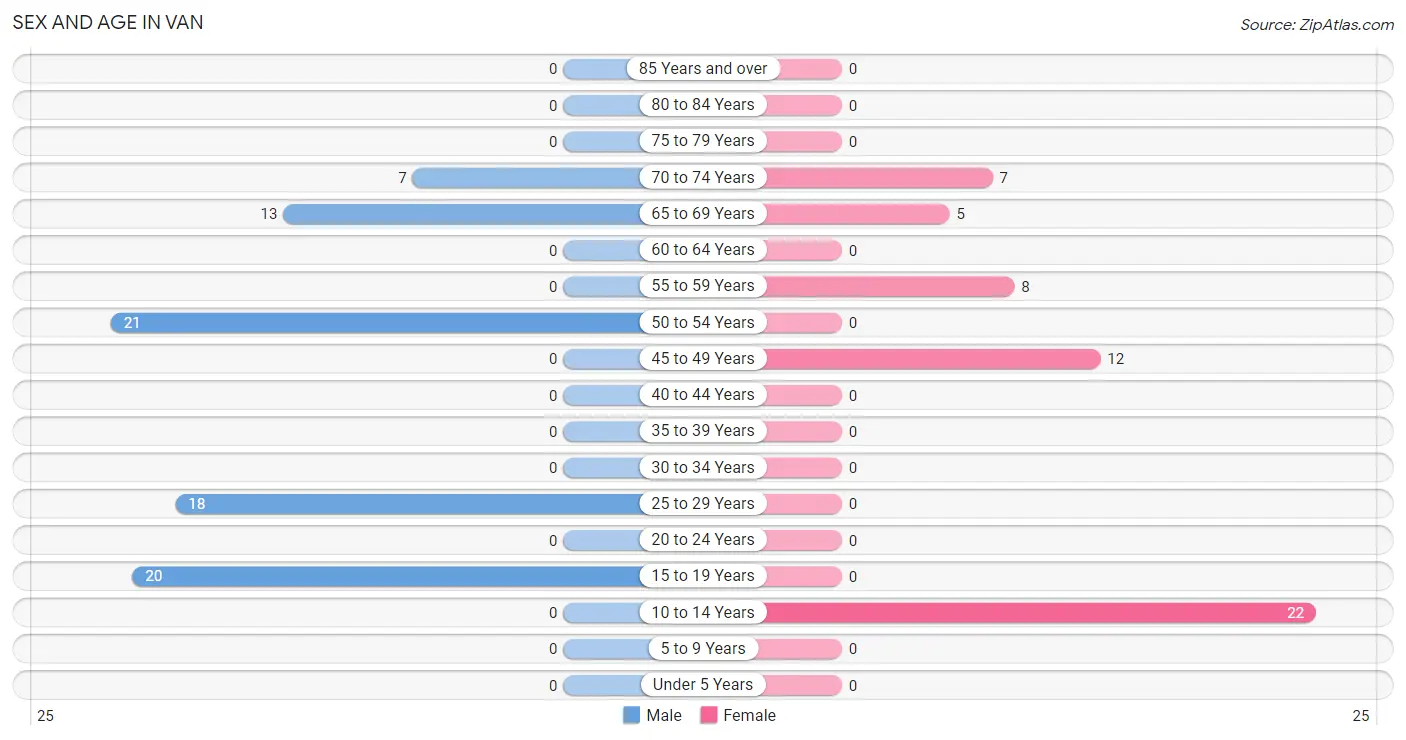
| Age Bracket | Male | Female |
| Under 5 Years | 0 (0.0%) | 0 (0.0%) |
| 5 to 9 Years | 0 (0.0%) | 0 (0.0%) |
| 10 to 14 Years | 0 (0.0%) | 22 (40.7%) |
| 15 to 19 Years | 20 (25.3%) | 0 (0.0%) |
| 20 to 24 Years | 0 (0.0%) | 0 (0.0%) |
| 25 to 29 Years | 18 (22.8%) | 0 (0.0%) |
| 30 to 34 Years | 0 (0.0%) | 0 (0.0%) |
| 35 to 39 Years | 0 (0.0%) | 0 (0.0%) |
| 40 to 44 Years | 0 (0.0%) | 0 (0.0%) |
| 45 to 49 Years | 0 (0.0%) | 12 (22.2%) |
| 50 to 54 Years | 21 (26.6%) | 0 (0.0%) |
| 55 to 59 Years | 0 (0.0%) | 8 (14.8%) |
| 60 to 64 Years | 0 (0.0%) | 0 (0.0%) |
| 65 to 69 Years | 13 (16.5%) | 5 (9.3%) |
| 70 to 74 Years | 7 (8.9%) | 7 (13.0%) |
| 75 to 79 Years | 0 (0.0%) | 0 (0.0%) |
| 80 to 84 Years | 0 (0.0%) | 0 (0.0%) |
| 85 Years and over | 0 (0.0%) | 0 (0.0%) |
| Total | 79 (100.0%) | 54 (100.0%) |
Families and Households in Van
Median Family Size in Van
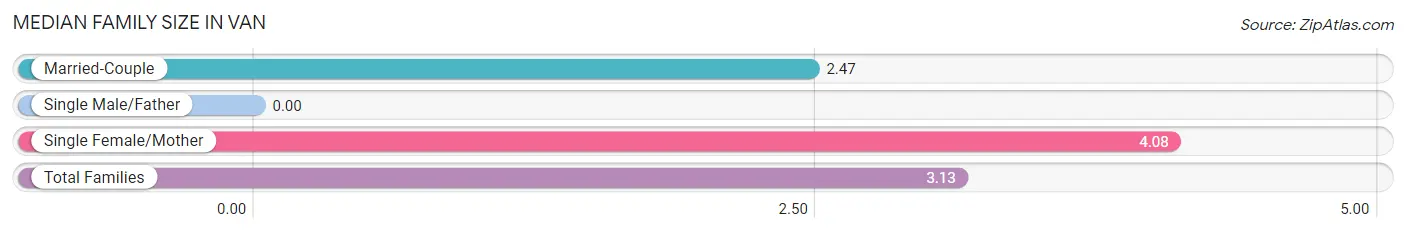
| Family Type | # Families | Family Size |
| Married-Couple | 19 (59.4%) | 2.47 |
| Single Male/Father | 0 (0.0%) | - |
| Single Female/Mother | 13 (40.6%) | 4.08 |
| Total Families | 32 (100.0%) | 3.13 |
Median Household Size in Van
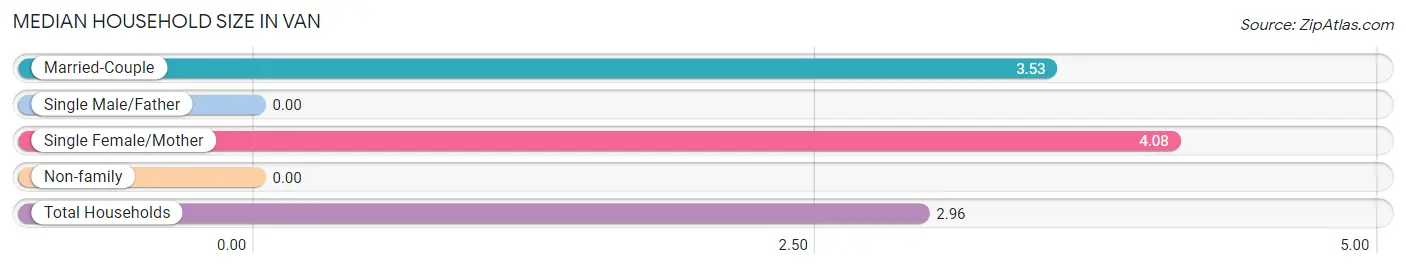
| Household Type | # Households | Household Size |
| Married-Couple | 19 (42.2%) | 3.53 |
| Single Male/Father | 0 (0.0%) | - |
| Single Female/Mother | 13 (28.9%) | 4.08 |
| Non-family | 13 (28.9%) | - |
| Total Households | 45 (100.0%) | 2.96 |
Household Size by Marriage Status in Van
Out of a total of 45 households in Van, 32 (71.1%) are family households, while 13 (28.9%) are nonfamily households. The most numerous type of family households are 2-person households, comprising 20, and the most common type of nonfamily households are 1-person households, comprising 13.
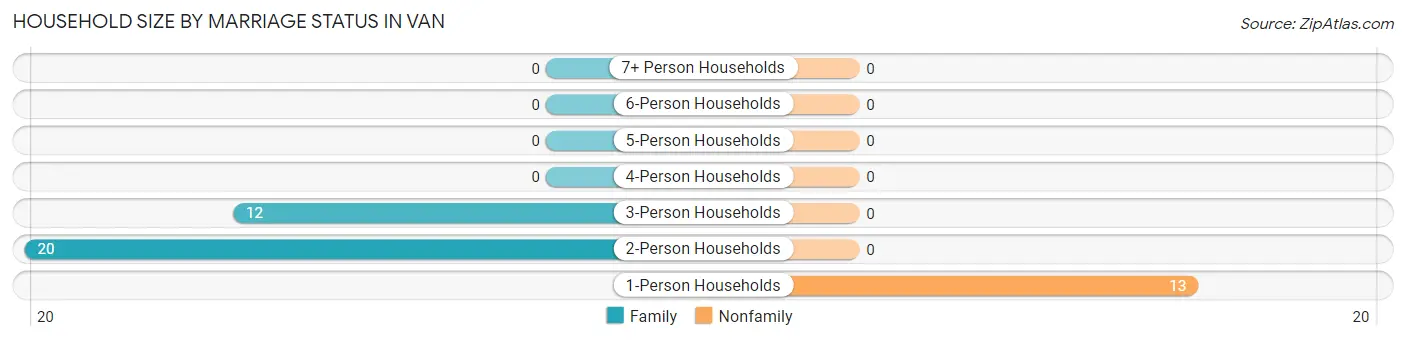
| Household Size | Family Households | Nonfamily Households |
| 1-Person Households | - | 13 (28.9%) |
| 2-Person Households | 20 (44.4%) | 0 (0.0%) |
| 3-Person Households | 12 (26.7%) | 0 (0.0%) |
| 4-Person Households | 0 (0.0%) | 0 (0.0%) |
| 5-Person Households | 0 (0.0%) | 0 (0.0%) |
| 6-Person Households | 0 (0.0%) | 0 (0.0%) |
| 7+ Person Households | 0 (0.0%) | 0 (0.0%) |
| Total | 32 (71.1%) | 13 (28.9%) |
Female Fertility in Van
Fertility by Age in Van
| Age Bracket | Women with Births | Births / 1,000 Women |
| 15 to 19 years | 0 (0.0%) | 0.0 |
| 20 to 34 years | 0 (0.0%) | 0.0 |
| 35 to 50 years | 0 (0.0%) | 0.0 |
| Total | 0 (0.0%) | 0.0 |
Fertility by Age by Marriage Status in Van
| Age Bracket | Married | Unmarried |
| 15 to 19 years | 0 (0.0%) | 0 (0.0%) |
| 20 to 34 years | 0 (0.0%) | 0 (0.0%) |
| 35 to 50 years | 0 (0.0%) | 0 (0.0%) |
| Total | 0 (0.0%) | 0 (0.0%) |
Fertility by Education in Van
| Educational Attainment | Women with Births | Births / 1,000 Women |
| Less than High School | 0 (0.0%) | 0.0 |
| High School Diploma | 0 (0.0%) | 0.0 |
| College or Associate's Degree | 0 (0.0%) | 0.0 |
| Bachelor's Degree | 0 (0.0%) | 0.0 |
| Graduate Degree | 0 (0.0%) | 0.0 |
| Total | 0 (0.0%) | 0.0 |
Fertility by Education by Marriage Status in Van
| Educational Attainment | Married | Unmarried |
| Less than High School | 0 (0.0%) | 0 (0.0%) |
| High School Diploma | 0 (0.0%) | 0 (0.0%) |
| College or Associate's Degree | 0 (0.0%) | 0 (0.0%) |
| Bachelor's Degree | 0 (0.0%) | 0 (0.0%) |
| Graduate Degree | 0 (0.0%) | 0 (0.0%) |
| Total | 0 (0.0%) | 0 (0.0%) |
Employment Characteristics in Van
Employment by Class of Employer in Van
Among the 72 employed individuals in Van, private company employees (43 | 59.7%), and not-for-profit organizations (29 | 40.3%) make up the most common classes of employment.
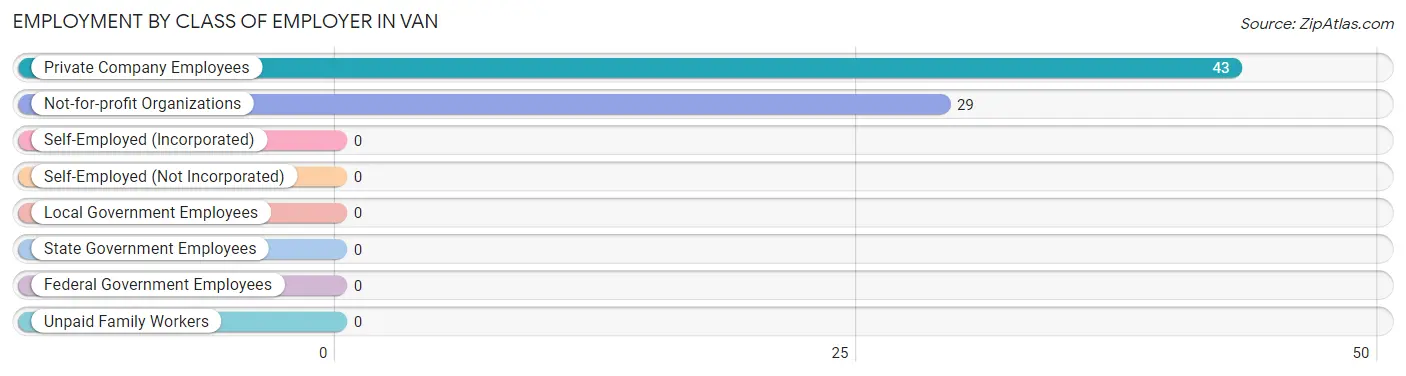
| Employer Class | # Employees | % Employees |
| Private Company Employees | 43 | 59.7% |
| Self-Employed (Incorporated) | 0 | 0.0% |
| Self-Employed (Not Incorporated) | 0 | 0.0% |
| Not-for-profit Organizations | 29 | 40.3% |
| Local Government Employees | 0 | 0.0% |
| State Government Employees | 0 | 0.0% |
| Federal Government Employees | 0 | 0.0% |
| Unpaid Family Workers | 0 | 0.0% |
| Total | 72 | 100.0% |
Employment Status by Age in Van
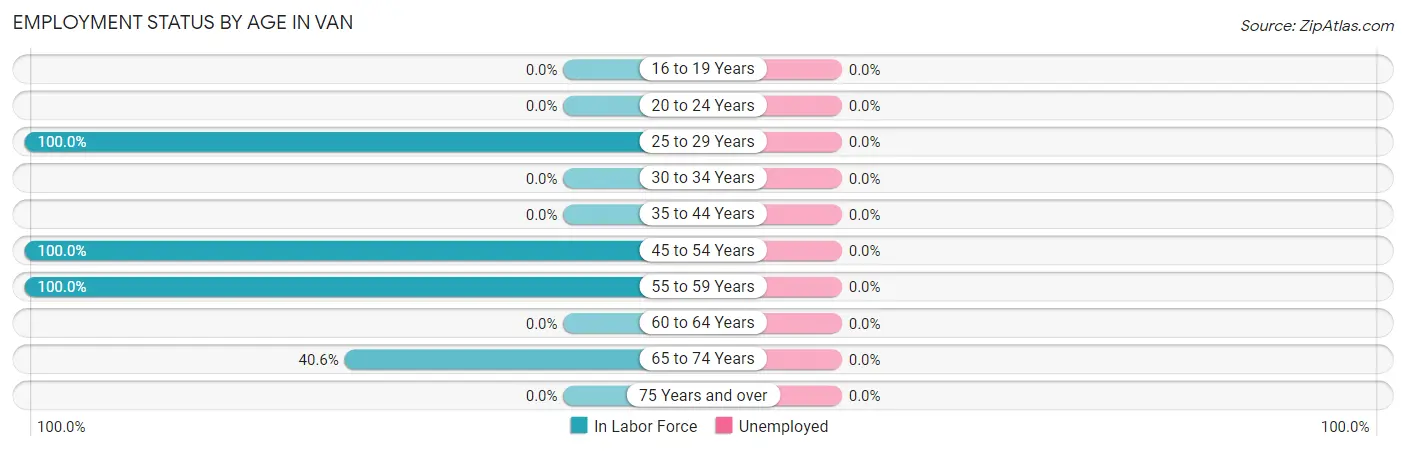
| Age Bracket | In Labor Force | Unemployed |
| 16 to 19 Years | 0 (0.0%) | 0 (0.0%) |
| 20 to 24 Years | 0 (0.0%) | 0 (0.0%) |
| 25 to 29 Years | 18 (100.0%) | 0 (0.0%) |
| 30 to 34 Years | 0 (0.0%) | 0 (0.0%) |
| 35 to 44 Years | 0 (0.0%) | 0 (0.0%) |
| 45 to 54 Years | 33 (100.0%) | 0 (0.0%) |
| 55 to 59 Years | 8 (100.0%) | 0 (0.0%) |
| 60 to 64 Years | 0 (0.0%) | 0 (0.0%) |
| 65 to 74 Years | 13 (40.6%) | 0 (0.0%) |
| 75 Years and over | 0 (0.0%) | 0 (0.0%) |
| Total | 72 (64.9%) | 0 (0.0%) |
Employment Status by Educational Attainment in Van
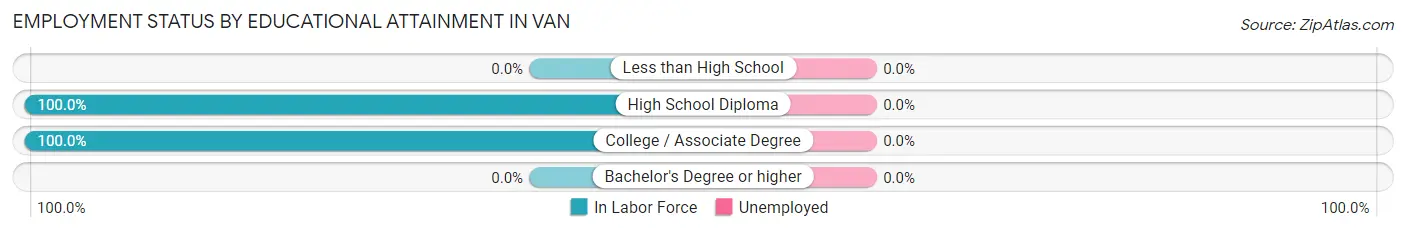
| Educational Attainment | In Labor Force | Unemployed |
| Less than High School | 0 (0.0%) | 0 (0.0%) |
| High School Diploma | 33 (100.0%) | 0 (0.0%) |
| College / Associate Degree | 26 (100.0%) | 0 (0.0%) |
| Bachelor's Degree or higher | 0 (0.0%) | 0 (0.0%) |
| Total | 59 (100.0%) | 0 (0.0%) |
Employment Occupations by Sex in Van
Management, Business, Science and Arts Occupations
The most common Management, Business, Science and Arts occupations in Van are Health Diagnosing & Treating (30 | 41.7%), Community & Social Service (21 | 29.2%), and Education, Arts & Media (21 | 29.2%).
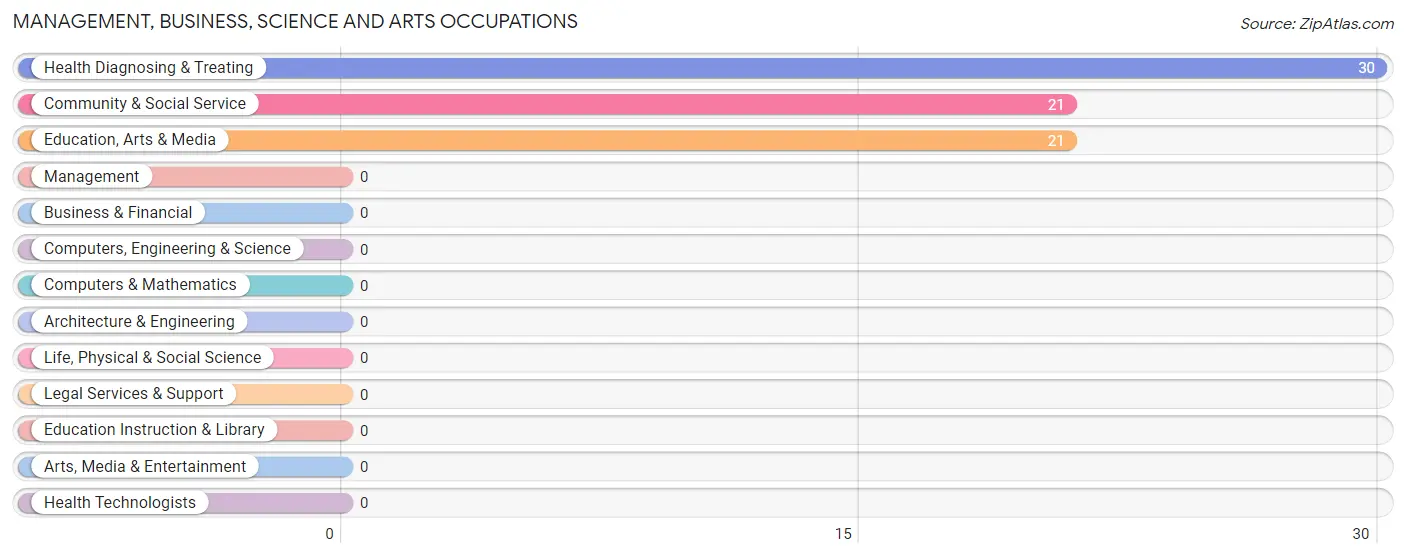
Management, Business, Science and Arts Occupations by Sex
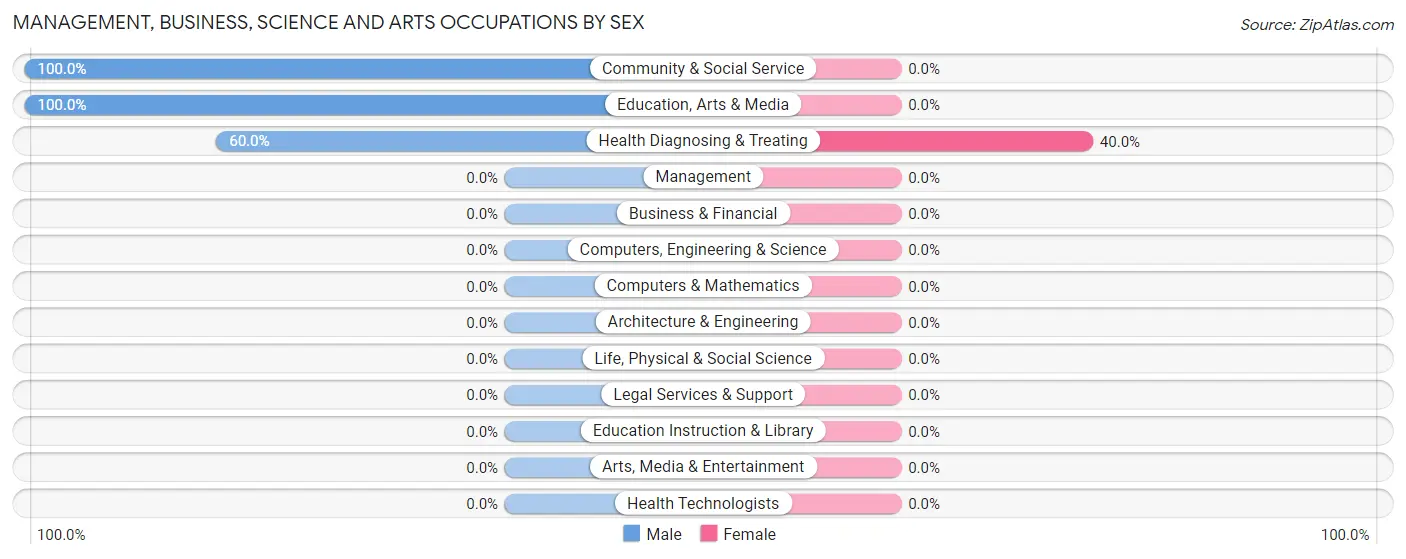
| Occupation | Male | Female |
| Management | 0 (0.0%) | 0 (0.0%) |
| Business & Financial | 0 (0.0%) | 0 (0.0%) |
| Computers, Engineering & Science | 0 (0.0%) | 0 (0.0%) |
| Computers & Mathematics | 0 (0.0%) | 0 (0.0%) |
| Architecture & Engineering | 0 (0.0%) | 0 (0.0%) |
| Life, Physical & Social Science | 0 (0.0%) | 0 (0.0%) |
| Community & Social Service | 21 (100.0%) | 0 (0.0%) |
| Education, Arts & Media | 21 (100.0%) | 0 (0.0%) |
| Legal Services & Support | 0 (0.0%) | 0 (0.0%) |
| Education Instruction & Library | 0 (0.0%) | 0 (0.0%) |
| Arts, Media & Entertainment | 0 (0.0%) | 0 (0.0%) |
| Health Diagnosing & Treating | 18 (60.0%) | 12 (40.0%) |
| Health Technologists | 0 (0.0%) | 0 (0.0%) |
| Total (Category) | 39 (76.5%) | 12 (23.5%) |
| Total (Overall) | 52 (72.2%) | 20 (27.8%) |
Services Occupations
The most common Services occupations in Van are Security & Protection (13 | 18.1%), and Firefighting & Prevention (13 | 18.1%).
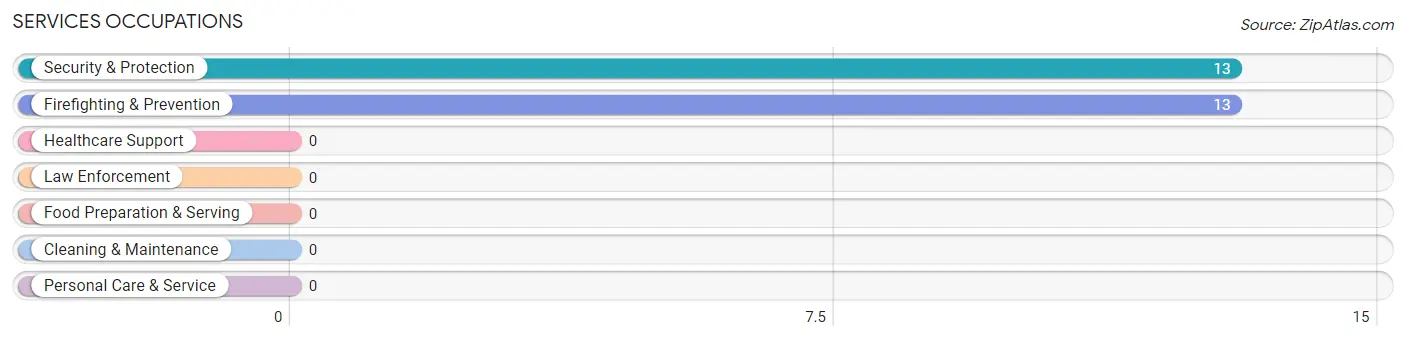
Services Occupations by Sex
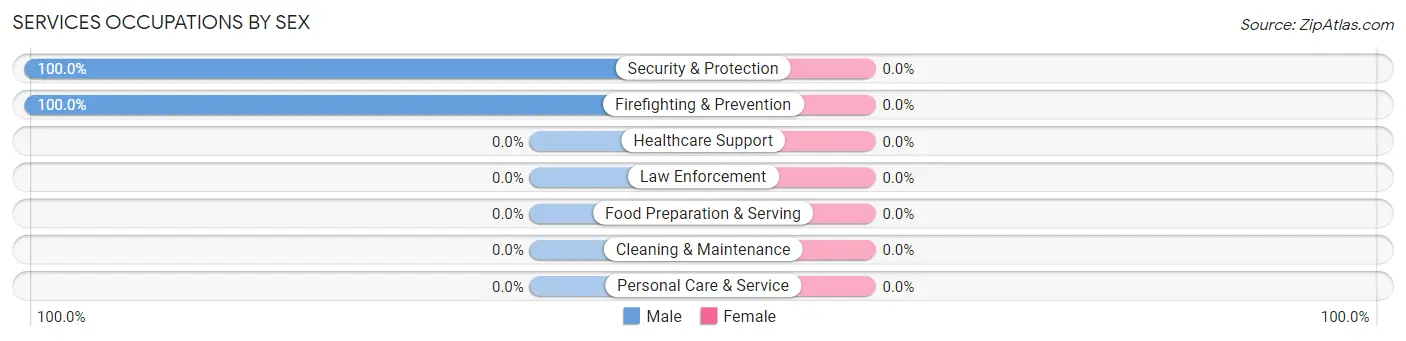
| Occupation | Male | Female |
| Healthcare Support | 0 (0.0%) | 0 (0.0%) |
| Security & Protection | 13 (100.0%) | 0 (0.0%) |
| Firefighting & Prevention | 13 (100.0%) | 0 (0.0%) |
| Law Enforcement | 0 (0.0%) | 0 (0.0%) |
| Food Preparation & Serving | 0 (0.0%) | 0 (0.0%) |
| Cleaning & Maintenance | 0 (0.0%) | 0 (0.0%) |
| Personal Care & Service | 0 (0.0%) | 0 (0.0%) |
| Total (Category) | 13 (100.0%) | 0 (0.0%) |
| Total (Overall) | 52 (72.2%) | 20 (27.8%) |
Sales and Office Occupations
The most common Sales and Office occupations in Van are , and Office & Administration (8 | 11.1%).
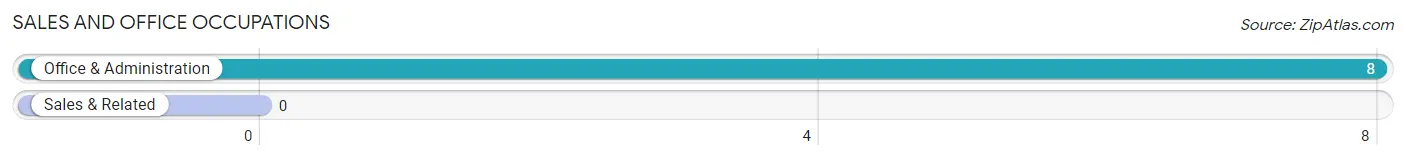
Sales and Office Occupations by Sex
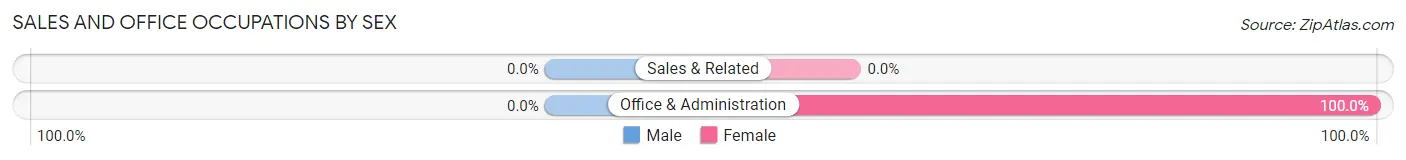
| Occupation | Male | Female |
| Sales & Related | 0 (0.0%) | 0 (0.0%) |
| Office & Administration | 0 (0.0%) | 8 (100.0%) |
| Total (Category) | 0 (0.0%) | 8 (100.0%) |
| Total (Overall) | 52 (72.2%) | 20 (27.8%) |
Natural Resources, Construction and Maintenance Occupations

Natural Resources, Construction and Maintenance Occupations by Sex
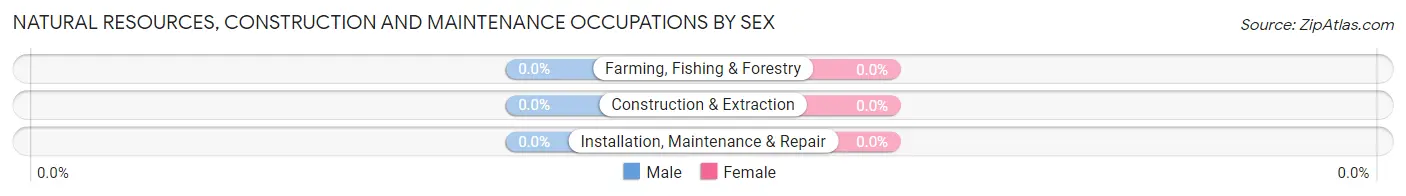
| Occupation | Male | Female |
| Farming, Fishing & Forestry | 0 (0.0%) | 0 (0.0%) |
| Construction & Extraction | 0 (0.0%) | 0 (0.0%) |
| Installation, Maintenance & Repair | 0 (0.0%) | 0 (0.0%) |
| Total (Category) | 0 (0.0%) | 0 (0.0%) |
| Total (Overall) | 52 (72.2%) | 20 (27.8%) |
Production, Transportation and Moving Occupations
Production, Transportation and Moving Occupations by Sex
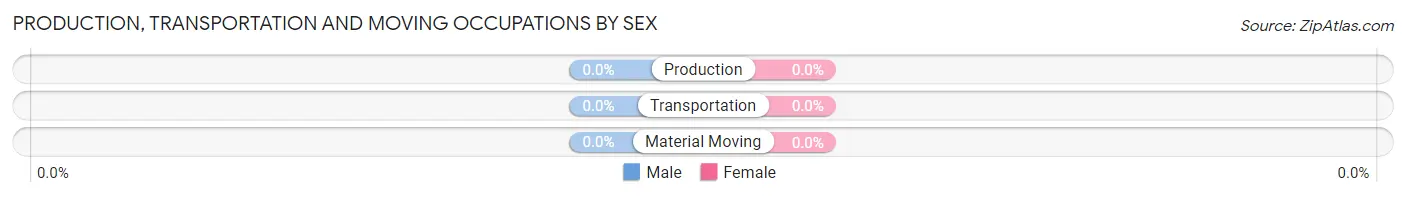
| Occupation | Male | Female |
| Production | 0 (0.0%) | 0 (0.0%) |
| Transportation | 0 (0.0%) | 0 (0.0%) |
| Material Moving | 0 (0.0%) | 0 (0.0%) |
| Total (Category) | 0 (0.0%) | 0 (0.0%) |
| Total (Overall) | 52 (72.2%) | 20 (27.8%) |
Employment Industries by Sex in Van
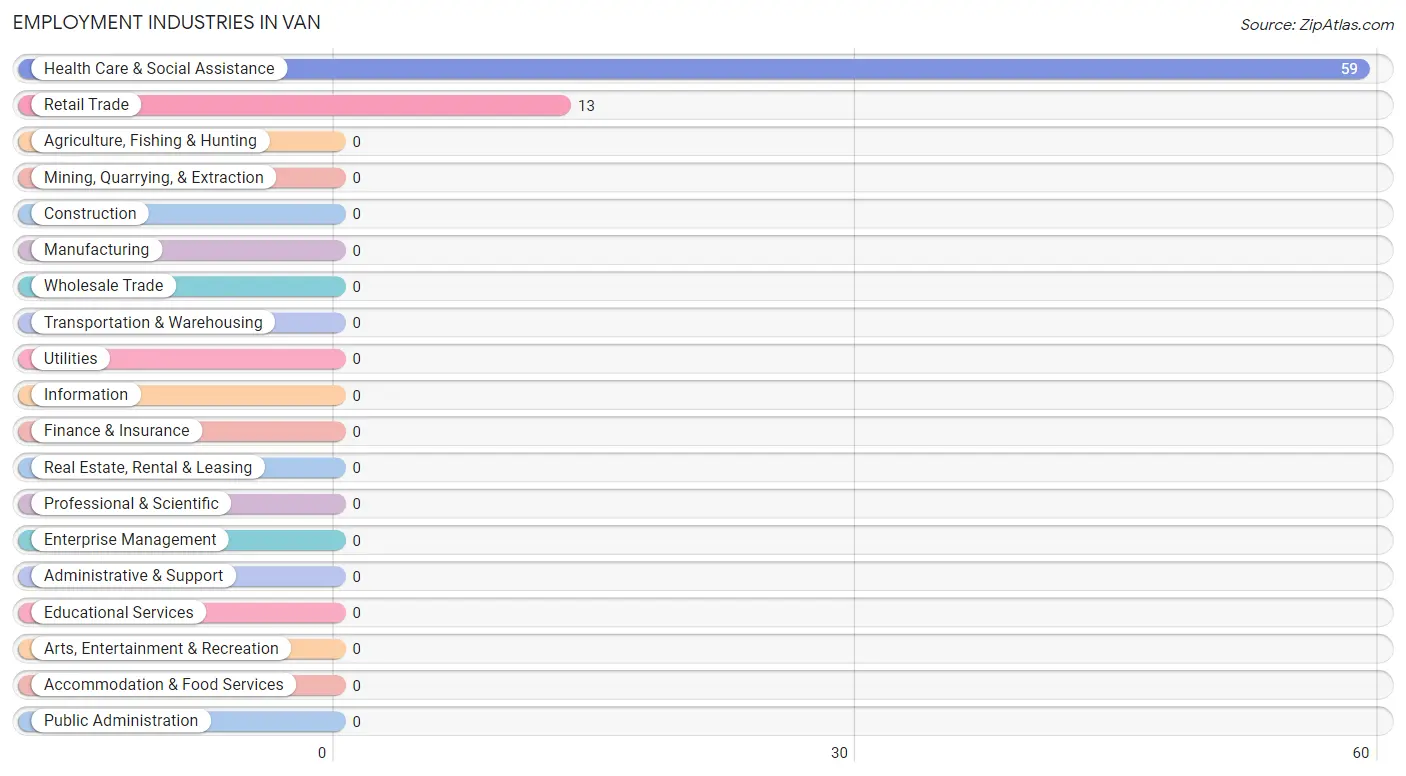
Employment Industries in Van
The major employment industries in Van include Health Care & Social Assistance (59 | 81.9%), and Retail Trade (13 | 18.1%).
Employment Industries by Sex in Van
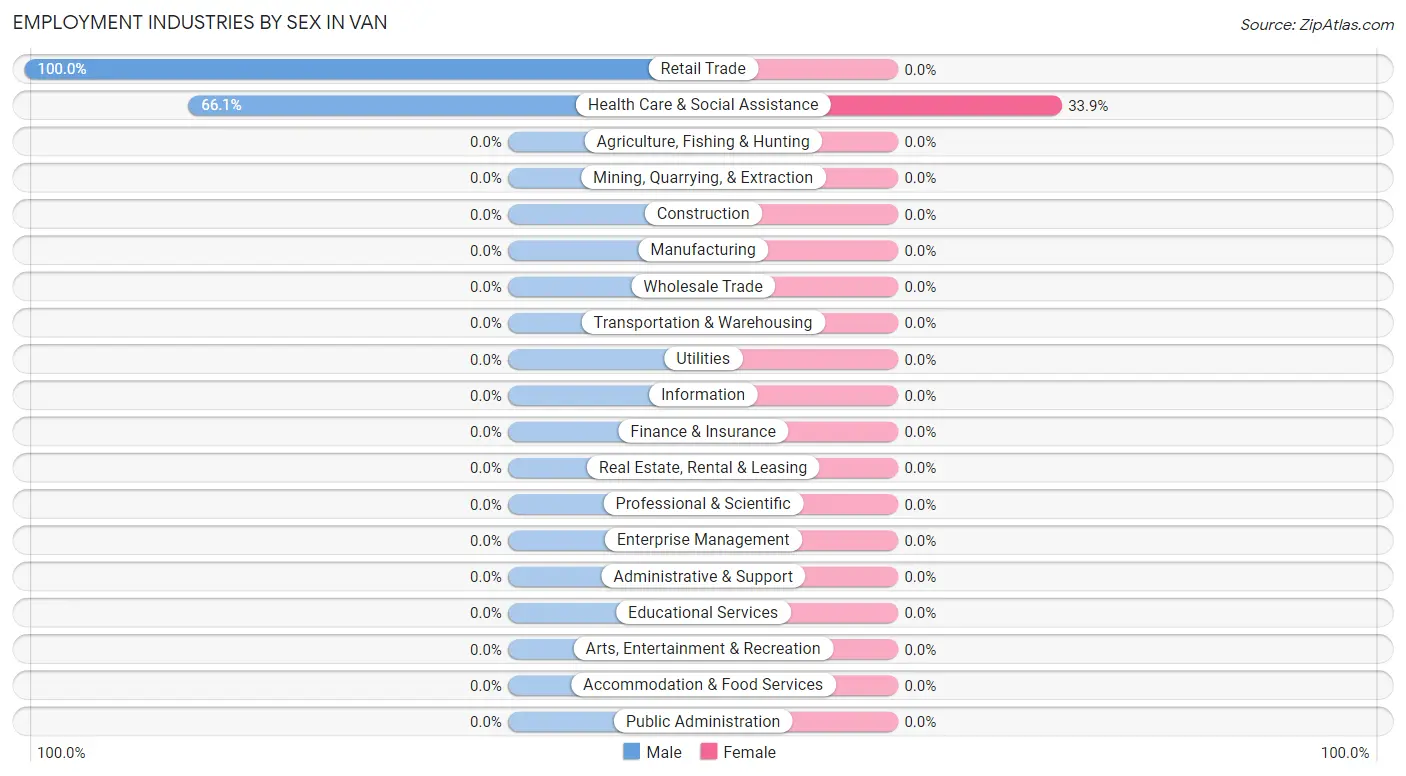
| Industry | Male | Female |
| Agriculture, Fishing & Hunting | 0 (0.0%) | 0 (0.0%) |
| Mining, Quarrying, & Extraction | 0 (0.0%) | 0 (0.0%) |
| Construction | 0 (0.0%) | 0 (0.0%) |
| Manufacturing | 0 (0.0%) | 0 (0.0%) |
| Wholesale Trade | 0 (0.0%) | 0 (0.0%) |
| Retail Trade | 13 (100.0%) | 0 (0.0%) |
| Transportation & Warehousing | 0 (0.0%) | 0 (0.0%) |
| Utilities | 0 (0.0%) | 0 (0.0%) |
| Information | 0 (0.0%) | 0 (0.0%) |
| Finance & Insurance | 0 (0.0%) | 0 (0.0%) |
| Real Estate, Rental & Leasing | 0 (0.0%) | 0 (0.0%) |
| Professional & Scientific | 0 (0.0%) | 0 (0.0%) |
| Enterprise Management | 0 (0.0%) | 0 (0.0%) |
| Administrative & Support | 0 (0.0%) | 0 (0.0%) |
| Educational Services | 0 (0.0%) | 0 (0.0%) |
| Health Care & Social Assistance | 39 (66.1%) | 20 (33.9%) |
| Arts, Entertainment & Recreation | 0 (0.0%) | 0 (0.0%) |
| Accommodation & Food Services | 0 (0.0%) | 0 (0.0%) |
| Public Administration | 0 (0.0%) | 0 (0.0%) |
| Total | 52 (72.2%) | 20 (27.8%) |
Education in Van
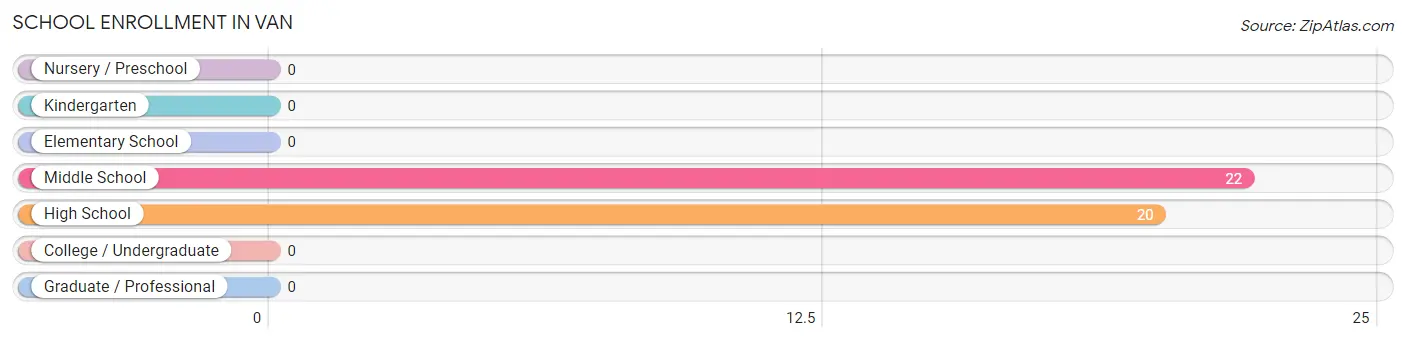
School Enrollment in Van
The most common levels of schooling among the 42 students in Van are middle school (22 | 52.4%), and high school (20 | 47.6%).
| School Level | # Students | % Students |
| Nursery / Preschool | 0 | 0.0% |
| Kindergarten | 0 | 0.0% |
| Elementary School | 0 | 0.0% |
| Middle School | 22 | 52.4% |
| High School | 20 | 47.6% |
| College / Undergraduate | 0 | 0.0% |
| Graduate / Professional | 0 | 0.0% |
| Total | 42 | 100.0% |
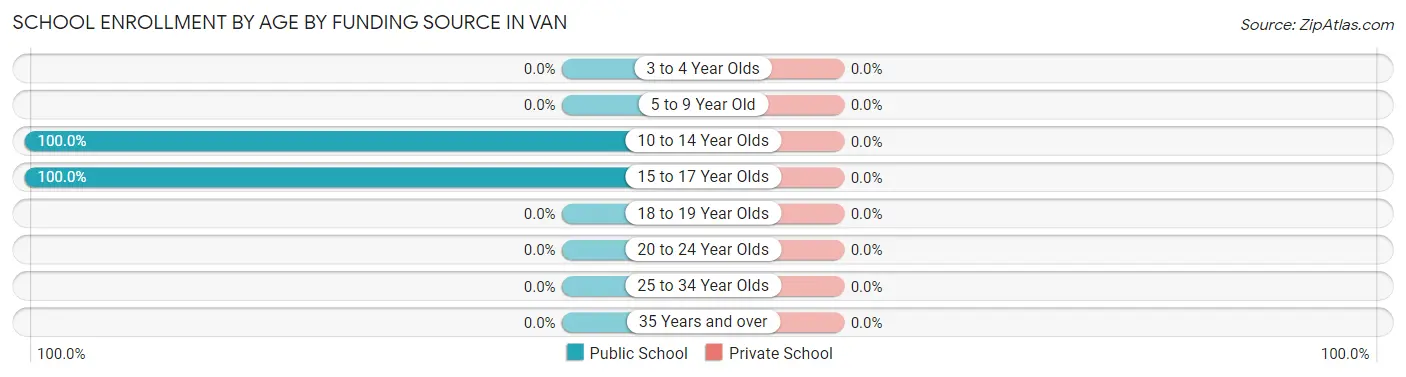
School Enrollment by Age by Funding Source in Van
| Age Bracket | Public School | Private School |
| 3 to 4 Year Olds | 0 (0.0%) | 0 (0.0%) |
| 5 to 9 Year Old | 0 (0.0%) | 0 (0.0%) |
| 10 to 14 Year Olds | 22 (100.0%) | 0 (0.0%) |
| 15 to 17 Year Olds | 20 (100.0%) | 0 (0.0%) |
| 18 to 19 Year Olds | 0 (0.0%) | 0 (0.0%) |
| 20 to 24 Year Olds | 0 (0.0%) | 0 (0.0%) |
| 25 to 34 Year Olds | 0 (0.0%) | 0 (0.0%) |
| 35 Years and over | 0 (0.0%) | 0 (0.0%) |
| Total | 42 (100.0%) | 0 (0.0%) |
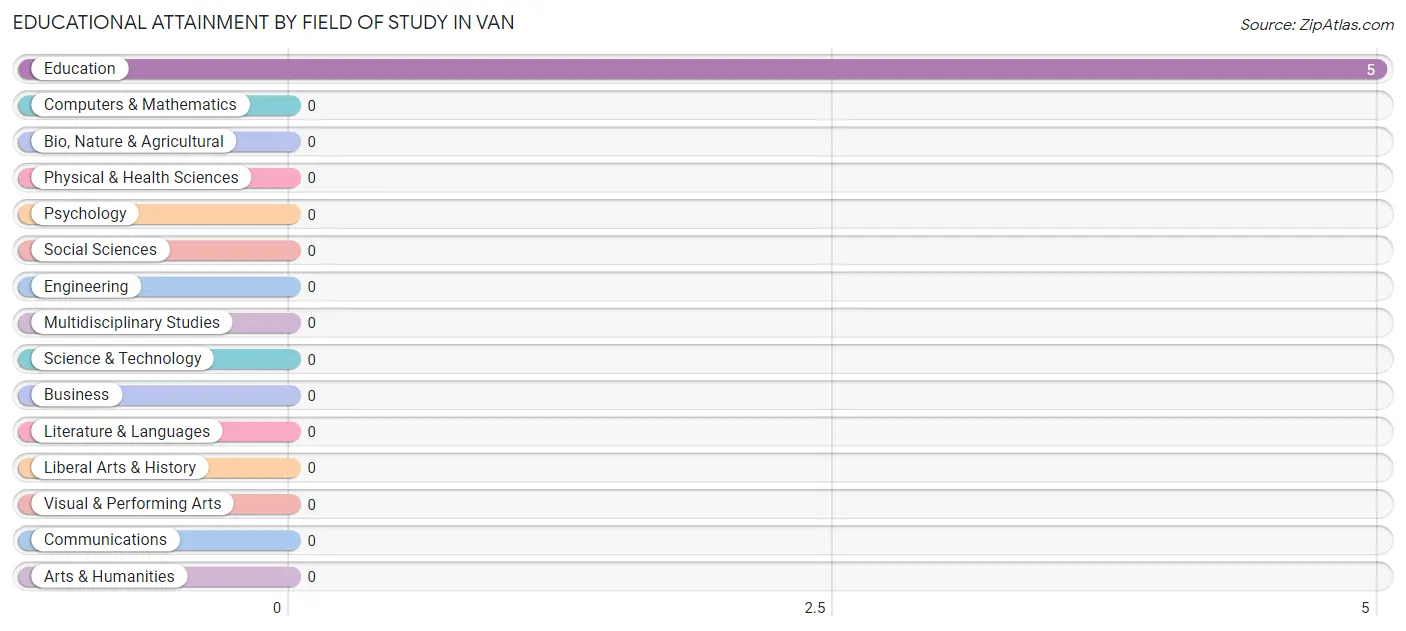
Educational Attainment by Field of Study in Van
, and education (5 | 100.0%) are the most common fields of study among 5 individuals in Van who have obtained a bachelor's degree or higher.
| Field of Study | # Graduates | % Graduates |
| Computers & Mathematics | 0 | 0.0% |
| Bio, Nature & Agricultural | 0 | 0.0% |
| Physical & Health Sciences | 0 | 0.0% |
| Psychology | 0 | 0.0% |
| Social Sciences | 0 | 0.0% |
| Engineering | 0 | 0.0% |
| Multidisciplinary Studies | 0 | 0.0% |
| Science & Technology | 0 | 0.0% |
| Business | 0 | 0.0% |
| Education | 5 | 100.0% |
| Literature & Languages | 0 | 0.0% |
| Liberal Arts & History | 0 | 0.0% |
| Visual & Performing Arts | 0 | 0.0% |
| Communications | 0 | 0.0% |
| Arts & Humanities | 0 | 0.0% |
| Total | 5 | 100.0% |
Transportation & Commute in Van
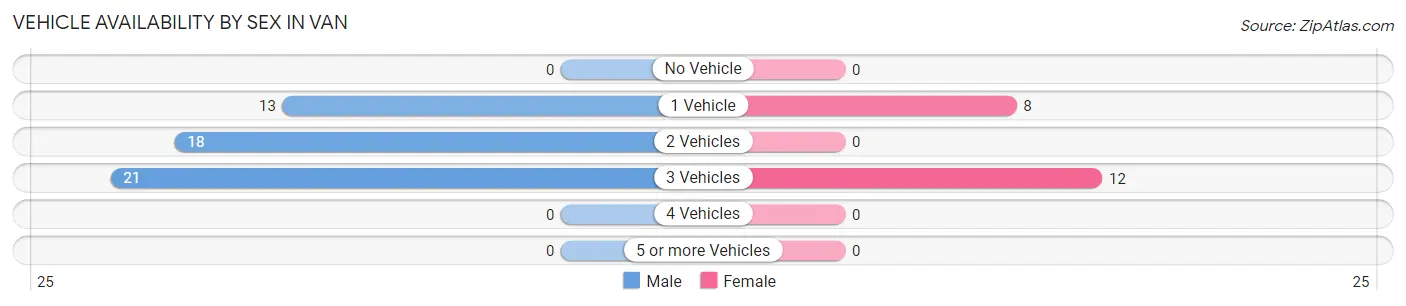
Vehicle Availability by Sex in Van
The most prevalent vehicle ownership categories in Van are males with 3 vehicles (21, accounting for 40.4%) and females with 3 vehicles (12, making up 105.0%).
| Vehicles Available | Male | Female |
| No Vehicle | 0 (0.0%) | 0 (0.0%) |
| 1 Vehicle | 13 (25.0%) | 8 (40.0%) |
| 2 Vehicles | 18 (34.6%) | 0 (0.0%) |
| 3 Vehicles | 21 (40.4%) | 12 (60.0%) |
| 4 Vehicles | 0 (0.0%) | 0 (0.0%) |
| 5 or more Vehicles | 0 (0.0%) | 0 (0.0%) |
| Total | 52 (100.0%) | 20 (100.0%) |
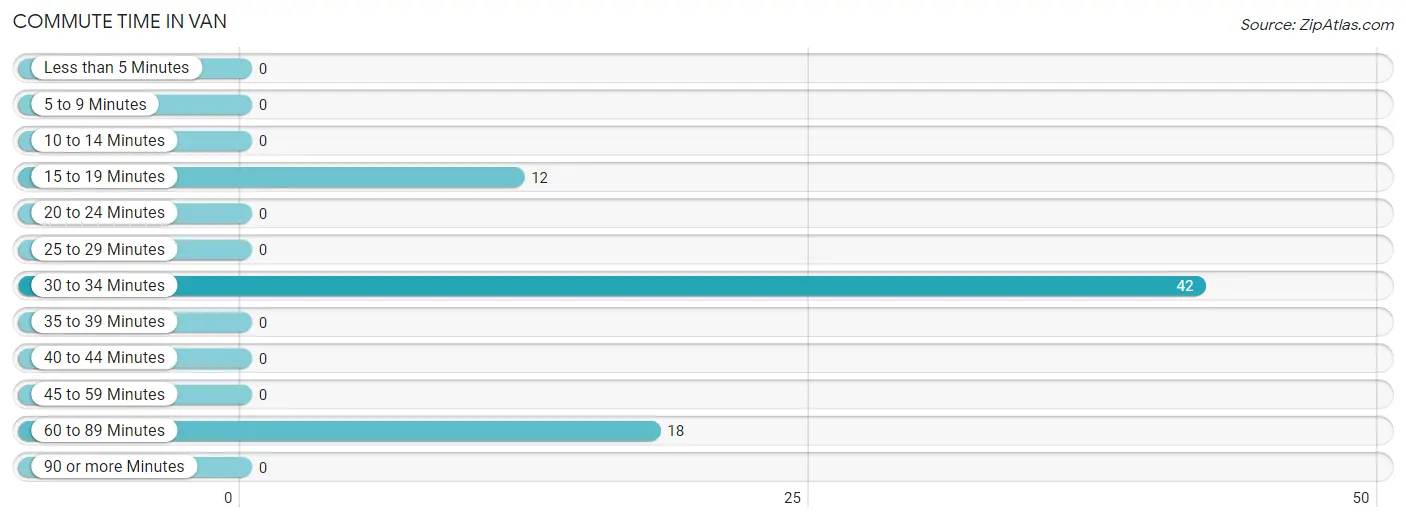
Commute Time in Van
The most frequently occuring commute durations in Van are 30 to 34 minutes (42 commuters, 58.3%), 60 to 89 minutes (18 commuters, 25.0%), and 15 to 19 minutes (12 commuters, 16.7%).
| Commute Time | # Commuters | % Commuters |
| Less than 5 Minutes | 0 | 0.0% |
| 5 to 9 Minutes | 0 | 0.0% |
| 10 to 14 Minutes | 0 | 0.0% |
| 15 to 19 Minutes | 12 | 16.7% |
| 20 to 24 Minutes | 0 | 0.0% |
| 25 to 29 Minutes | 0 | 0.0% |
| 30 to 34 Minutes | 42 | 58.3% |
| 35 to 39 Minutes | 0 | 0.0% |
| 40 to 44 Minutes | 0 | 0.0% |
| 45 to 59 Minutes | 0 | 0.0% |
| 60 to 89 Minutes | 18 | 25.0% |
| 90 or more Minutes | 0 | 0.0% |
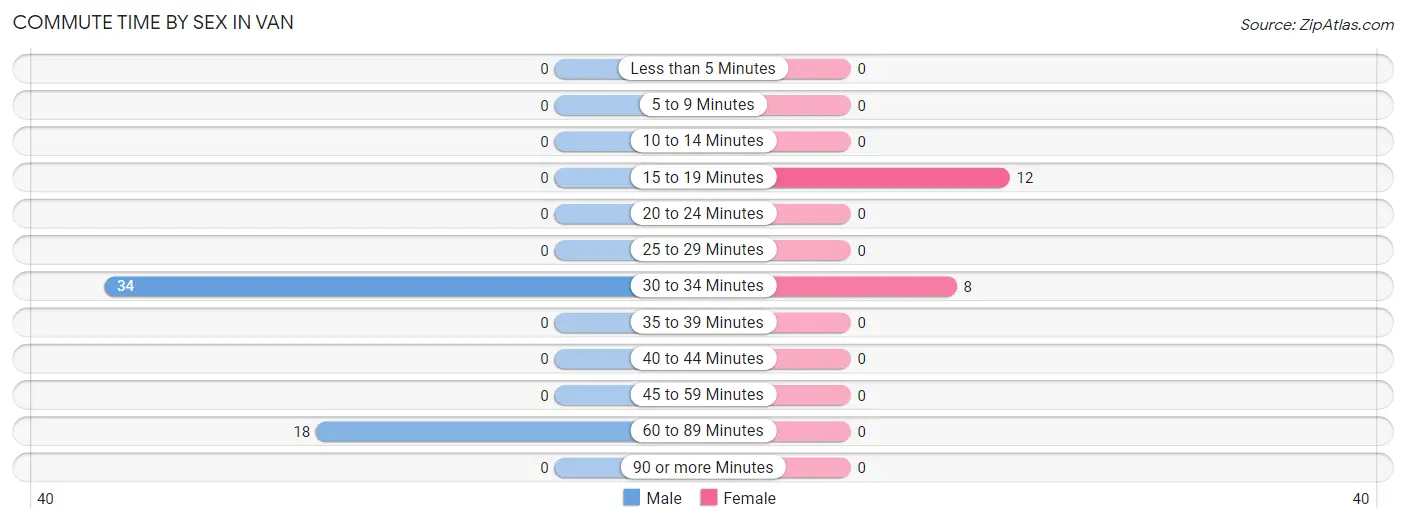
Commute Time by Sex in Van
The most common commute times in Van are 30 to 34 minutes (34 commuters, 65.4%) for males and 15 to 19 minutes (12 commuters, 60.0%) for females.
| Commute Time | Male | Female |
| Less than 5 Minutes | 0 (0.0%) | 0 (0.0%) |
| 5 to 9 Minutes | 0 (0.0%) | 0 (0.0%) |
| 10 to 14 Minutes | 0 (0.0%) | 0 (0.0%) |
| 15 to 19 Minutes | 0 (0.0%) | 12 (60.0%) |
| 20 to 24 Minutes | 0 (0.0%) | 0 (0.0%) |
| 25 to 29 Minutes | 0 (0.0%) | 0 (0.0%) |
| 30 to 34 Minutes | 34 (65.4%) | 8 (40.0%) |
| 35 to 39 Minutes | 0 (0.0%) | 0 (0.0%) |
| 40 to 44 Minutes | 0 (0.0%) | 0 (0.0%) |
| 45 to 59 Minutes | 0 (0.0%) | 0 (0.0%) |
| 60 to 89 Minutes | 18 (34.6%) | 0 (0.0%) |
| 90 or more Minutes | 0 (0.0%) | 0 (0.0%) |
Time of Departure to Work by Sex in Van
The most frequent times of departure to work in Van are 12:00 PM to 3:59 PM (21, 40.4%) for males and 7:00 AM to 7:29 AM (12, 60.0%) for females.
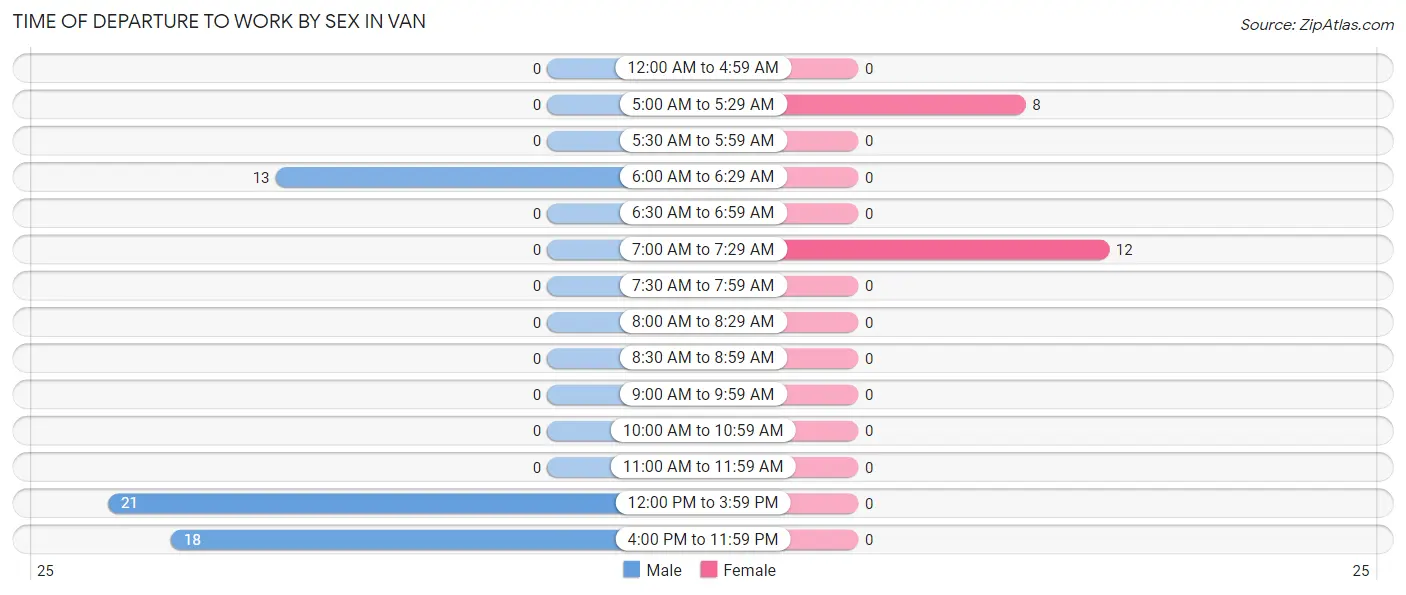
| Time of Departure | Male | Female |
| 12:00 AM to 4:59 AM | 0 (0.0%) | 0 (0.0%) |
| 5:00 AM to 5:29 AM | 0 (0.0%) | 8 (40.0%) |
| 5:30 AM to 5:59 AM | 0 (0.0%) | 0 (0.0%) |
| 6:00 AM to 6:29 AM | 13 (25.0%) | 0 (0.0%) |
| 6:30 AM to 6:59 AM | 0 (0.0%) | 0 (0.0%) |
| 7:00 AM to 7:29 AM | 0 (0.0%) | 12 (60.0%) |
| 7:30 AM to 7:59 AM | 0 (0.0%) | 0 (0.0%) |
| 8:00 AM to 8:29 AM | 0 (0.0%) | 0 (0.0%) |
| 8:30 AM to 8:59 AM | 0 (0.0%) | 0 (0.0%) |
| 9:00 AM to 9:59 AM | 0 (0.0%) | 0 (0.0%) |
| 10:00 AM to 10:59 AM | 0 (0.0%) | 0 (0.0%) |
| 11:00 AM to 11:59 AM | 0 (0.0%) | 0 (0.0%) |
| 12:00 PM to 3:59 PM | 21 (40.4%) | 0 (0.0%) |
| 4:00 PM to 11:59 PM | 18 (34.6%) | 0 (0.0%) |
| Total | 52 (100.0%) | 20 (100.0%) |
Housing Occupancy in Van
Occupancy by Ownership in Van
Of the total 45 dwellings in Van, owner-occupied units account for 32 (71.1%), while renter-occupied units make up 13 (28.9%).
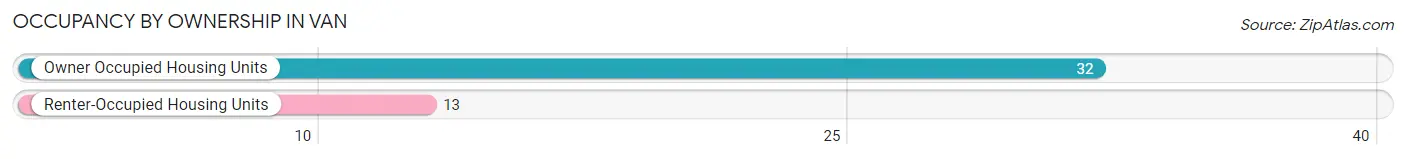
| Occupancy | # Housing Units | % Housing Units |
| Owner Occupied Housing Units | 32 | 71.1% |
| Renter-Occupied Housing Units | 13 | 28.9% |
| Total Occupied Housing Units | 45 | 100.0% |
Occupancy by Household Size in Van
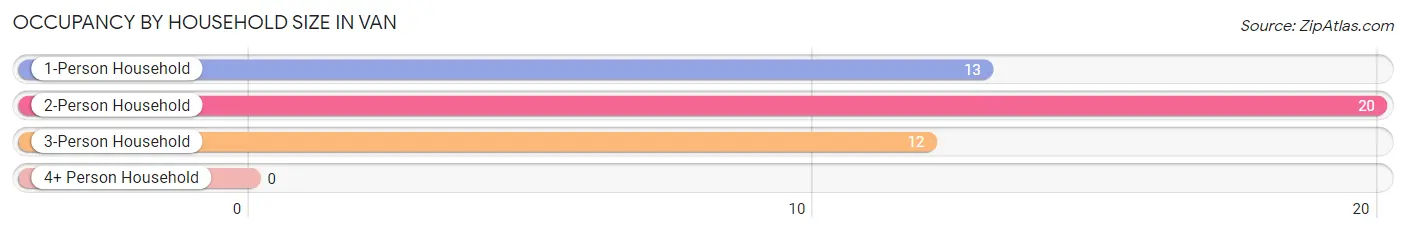
| Household Size | # Housing Units | % Housing Units |
| 1-Person Household | 13 | 28.9% |
| 2-Person Household | 20 | 44.4% |
| 3-Person Household | 12 | 26.7% |
| 4+ Person Household | 0 | 0.0% |
| Total Housing Units | 45 | 100.0% |
Occupancy by Ownership by Household Size in Van
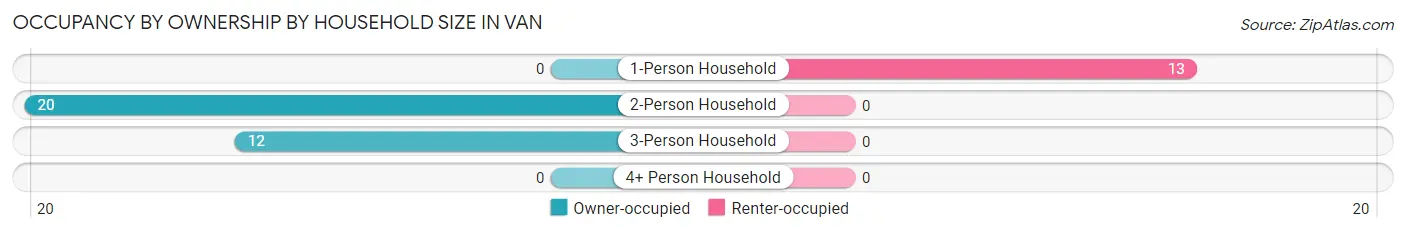
| Household Size | Owner-occupied | Renter-occupied |
| 1-Person Household | 0 (0.0%) | 13 (100.0%) |
| 2-Person Household | 20 (100.0%) | 0 (0.0%) |
| 3-Person Household | 12 (100.0%) | 0 (0.0%) |
| 4+ Person Household | 0 (0.0%) | 0 (0.0%) |
| Total Housing Units | 32 (71.1%) | 13 (28.9%) |
Occupancy by Educational Attainment in Van
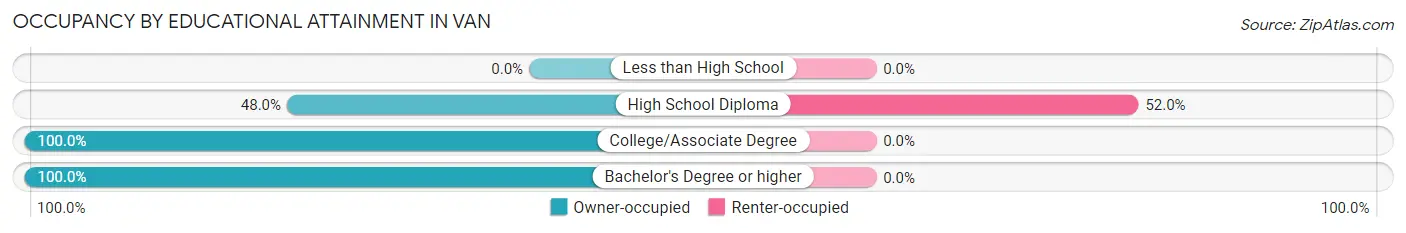
| Household Size | Owner-occupied | Renter-occupied |
| Less than High School | 0 (0.0%) | 0 (0.0%) |
| High School Diploma | 12 (48.0%) | 13 (52.0%) |
| College/Associate Degree | 15 (100.0%) | 0 (0.0%) |
| Bachelor's Degree or higher | 5 (100.0%) | 0 (0.0%) |
Occupancy by Age of Householder in Van
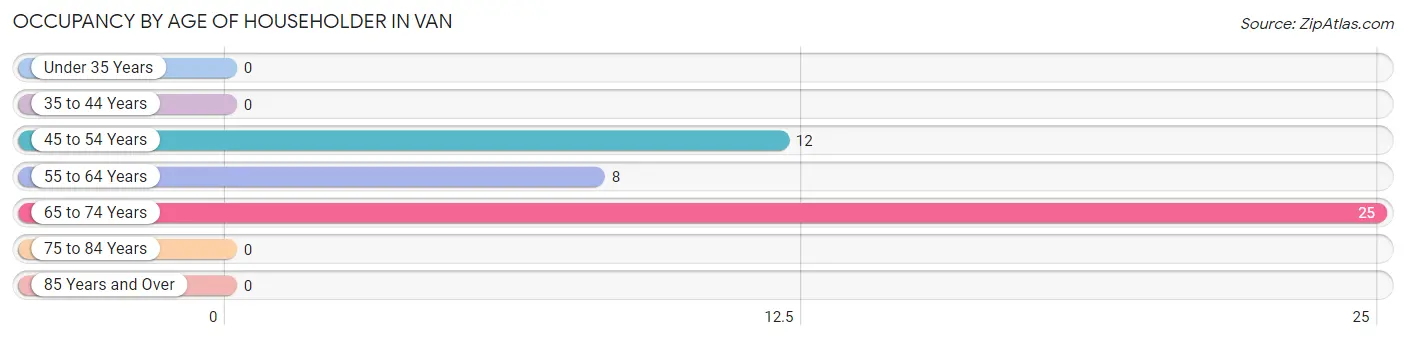
| Age Bracket | # Households | % Households |
| Under 35 Years | 0 | 0.0% |
| 35 to 44 Years | 0 | 0.0% |
| 45 to 54 Years | 12 | 26.7% |
| 55 to 64 Years | 8 | 17.8% |
| 65 to 74 Years | 25 | 55.6% |
| 75 to 84 Years | 0 | 0.0% |
| 85 Years and Over | 0 | 0.0% |
| Total | 45 | 100.0% |
Housing Finances in Van
Median Income by Occupancy in Van
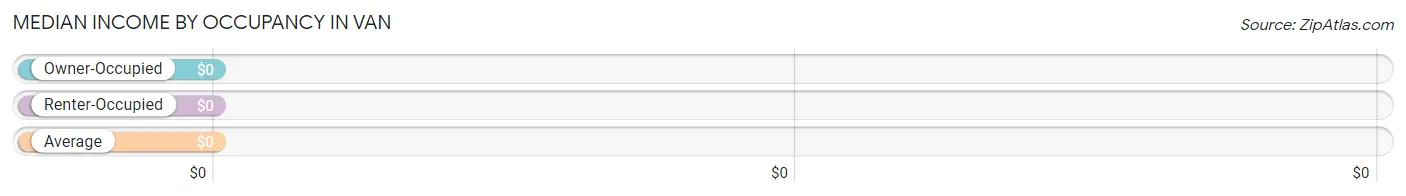
| Occupancy Type | # Households | Median Income |
| Owner-Occupied | 32 (71.1%) | $0 |
| Renter-Occupied | 13 (28.9%) | $0 |
| Average | 45 (100.0%) | $0 |
Occupancy by Householder Income Bracket in Van
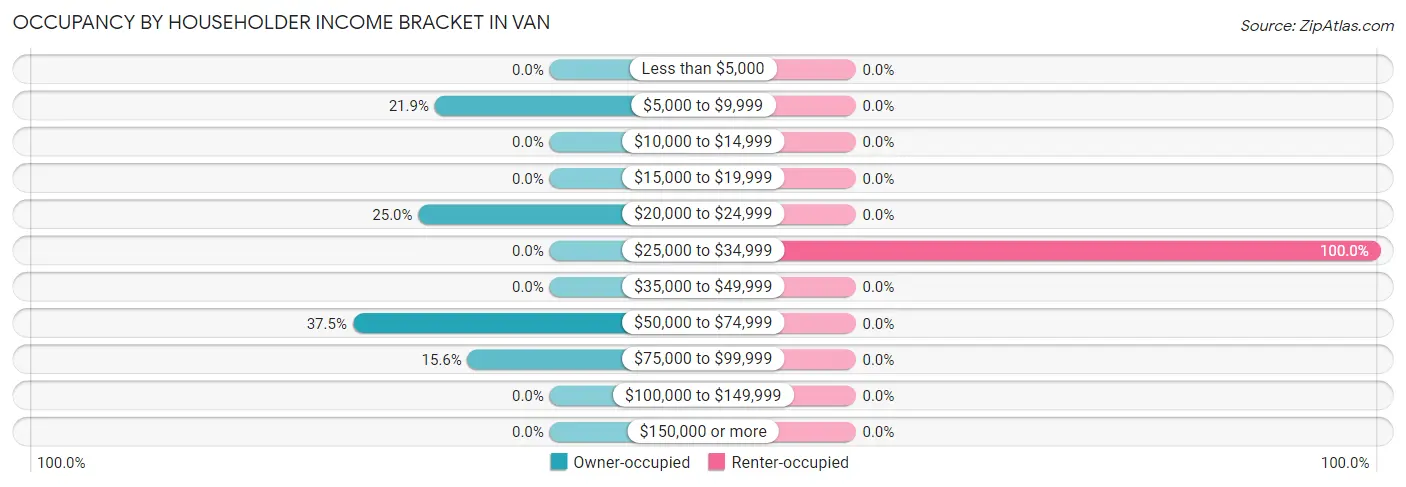
| Income Bracket | Owner-occupied | Renter-occupied |
| Less than $5,000 | 0 (0.0%) | 0 (0.0%) |
| $5,000 to $9,999 | 7 (21.9%) | 0 (0.0%) |
| $10,000 to $14,999 | 0 (0.0%) | 0 (0.0%) |
| $15,000 to $19,999 | 0 (0.0%) | 0 (0.0%) |
| $20,000 to $24,999 | 8 (25.0%) | 0 (0.0%) |
| $25,000 to $34,999 | 0 (0.0%) | 13 (100.0%) |
| $35,000 to $49,999 | 0 (0.0%) | 0 (0.0%) |
| $50,000 to $74,999 | 12 (37.5%) | 0 (0.0%) |
| $75,000 to $99,999 | 5 (15.6%) | 0 (0.0%) |
| $100,000 to $149,999 | 0 (0.0%) | 0 (0.0%) |
| $150,000 or more | 0 (0.0%) | 0 (0.0%) |
| Total | 32 (100.0%) | 13 (100.0%) |
Monthly Housing Cost Tiers in Van
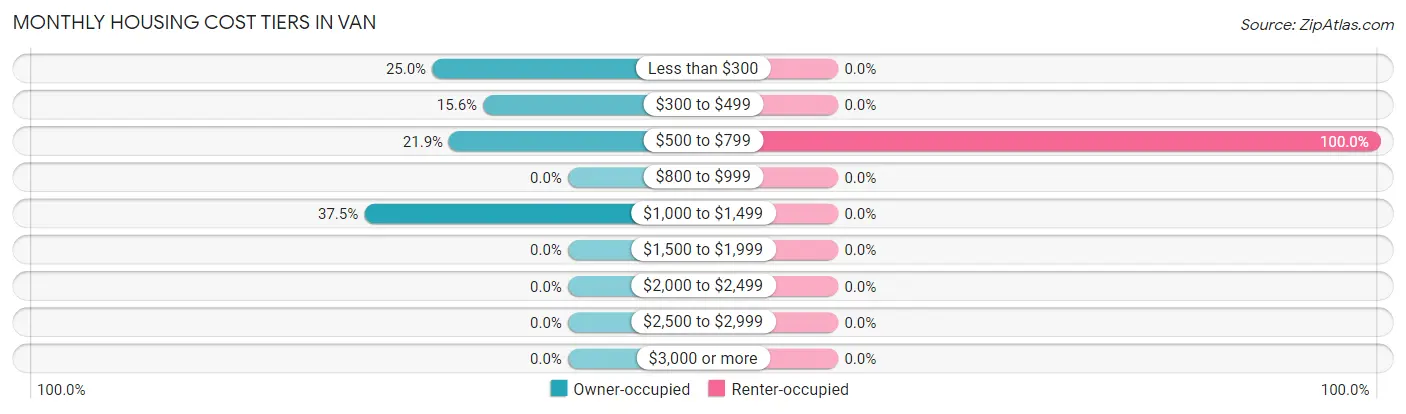
| Monthly Cost | Owner-occupied | Renter-occupied |
| Less than $300 | 8 (25.0%) | 0 (0.0%) |
| $300 to $499 | 5 (15.6%) | 0 (0.0%) |
| $500 to $799 | 7 (21.9%) | 13 (100.0%) |
| $800 to $999 | 0 (0.0%) | 0 (0.0%) |
| $1,000 to $1,499 | 12 (37.5%) | 0 (0.0%) |
| $1,500 to $1,999 | 0 (0.0%) | 0 (0.0%) |
| $2,000 to $2,499 | 0 (0.0%) | 0 (0.0%) |
| $2,500 to $2,999 | 0 (0.0%) | 0 (0.0%) |
| $3,000 or more | 0 (0.0%) | 0 (0.0%) |
| Total | 32 (100.0%) | 13 (100.0%) |
Physical Housing Characteristics in Van
Housing Structures in Van
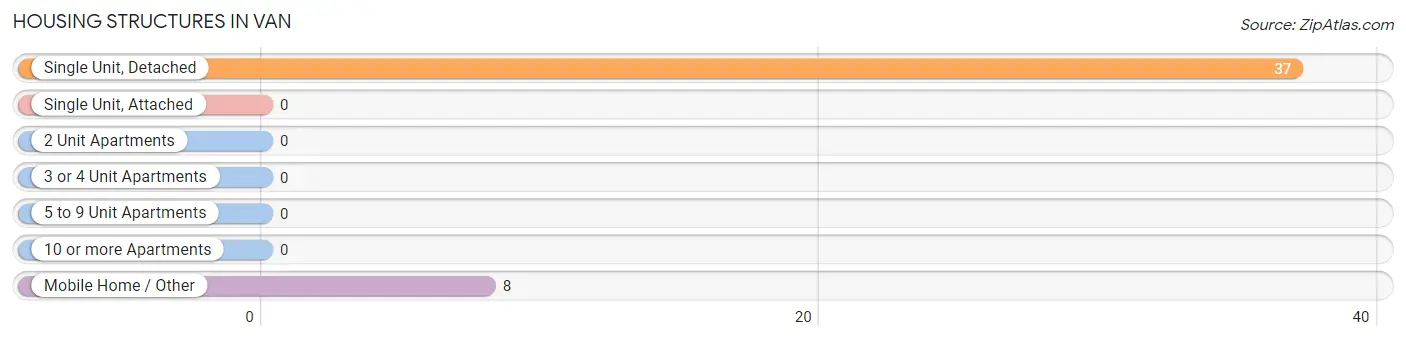
| Structure Type | # Housing Units | % Housing Units |
| Single Unit, Detached | 37 | 82.2% |
| Single Unit, Attached | 0 | 0.0% |
| 2 Unit Apartments | 0 | 0.0% |
| 3 or 4 Unit Apartments | 0 | 0.0% |
| 5 to 9 Unit Apartments | 0 | 0.0% |
| 10 or more Apartments | 0 | 0.0% |
| Mobile Home / Other | 8 | 17.8% |
| Total | 45 | 100.0% |
Housing Structures by Occupancy in Van
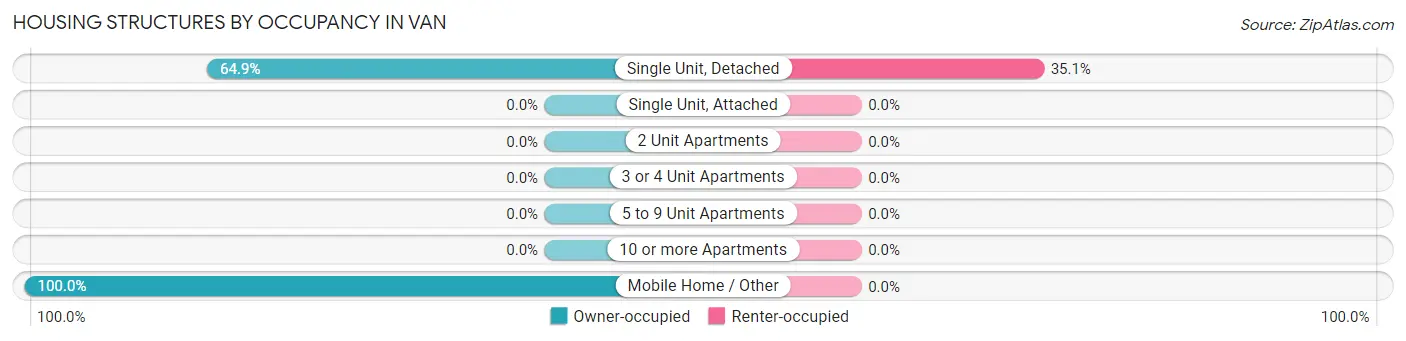
| Structure Type | Owner-occupied | Renter-occupied |
| Single Unit, Detached | 24 (64.9%) | 13 (35.1%) |
| Single Unit, Attached | 0 (0.0%) | 0 (0.0%) |
| 2 Unit Apartments | 0 (0.0%) | 0 (0.0%) |
| 3 or 4 Unit Apartments | 0 (0.0%) | 0 (0.0%) |
| 5 to 9 Unit Apartments | 0 (0.0%) | 0 (0.0%) |
| 10 or more Apartments | 0 (0.0%) | 0 (0.0%) |
| Mobile Home / Other | 8 (100.0%) | 0 (0.0%) |
| Total | 32 (71.1%) | 13 (28.9%) |
Housing Structures by Number of Rooms in Van
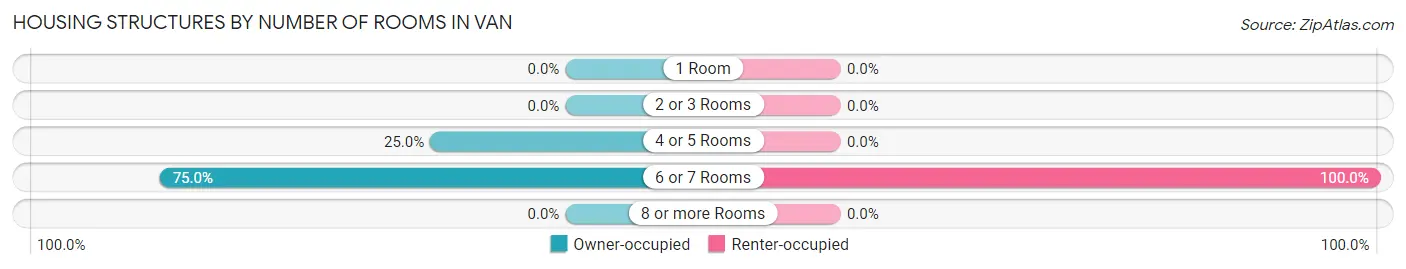
| Number of Rooms | Owner-occupied | Renter-occupied |
| 1 Room | 0 (0.0%) | 0 (0.0%) |
| 2 or 3 Rooms | 0 (0.0%) | 0 (0.0%) |
| 4 or 5 Rooms | 8 (25.0%) | 0 (0.0%) |
| 6 or 7 Rooms | 24 (75.0%) | 13 (100.0%) |
| 8 or more Rooms | 0 (0.0%) | 0 (0.0%) |
| Total | 32 (100.0%) | 13 (100.0%) |
Housing Structure by Heating Type in Van
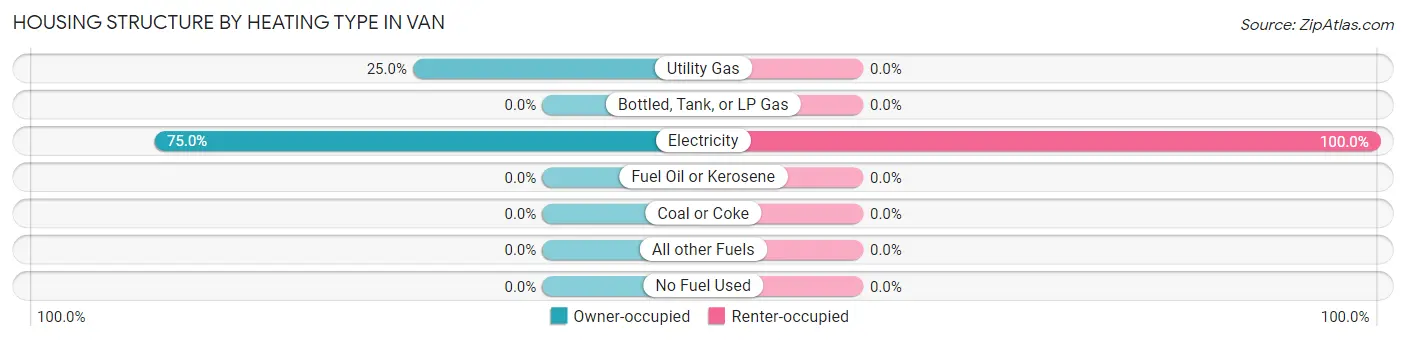
| Heating Type | Owner-occupied | Renter-occupied |
| Utility Gas | 8 (25.0%) | 0 (0.0%) |
| Bottled, Tank, or LP Gas | 0 (0.0%) | 0 (0.0%) |
| Electricity | 24 (75.0%) | 13 (100.0%) |
| Fuel Oil or Kerosene | 0 (0.0%) | 0 (0.0%) |
| Coal or Coke | 0 (0.0%) | 0 (0.0%) |
| All other Fuels | 0 (0.0%) | 0 (0.0%) |
| No Fuel Used | 0 (0.0%) | 0 (0.0%) |
| Total | 32 (100.0%) | 13 (100.0%) |
Household Vehicle Usage in Van
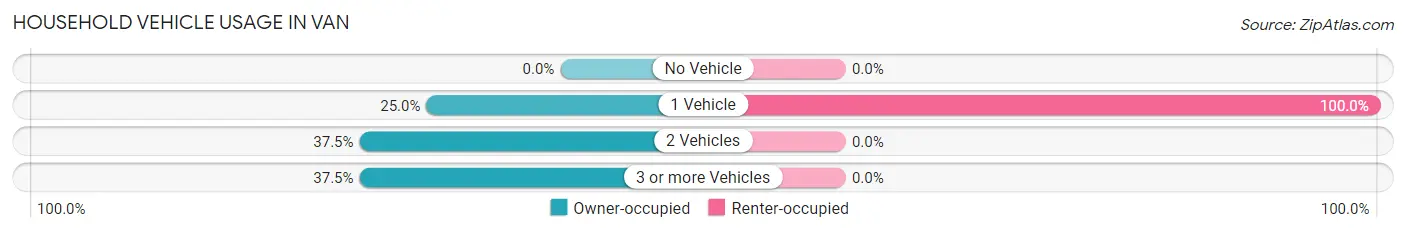
| Vehicles per Household | Owner-occupied | Renter-occupied |
| No Vehicle | 0 (0.0%) | 0 (0.0%) |
| 1 Vehicle | 8 (25.0%) | 13 (100.0%) |
| 2 Vehicles | 12 (37.5%) | 0 (0.0%) |
| 3 or more Vehicles | 12 (37.5%) | 0 (0.0%) |
| Total | 32 (100.0%) | 13 (100.0%) |
Real Estate & Mortgages in Van
Real Estate and Mortgage Overview in Van
| Characteristic | Without Mortgage | With Mortgage |
| Housing Units | 20 | 12 |
| Median Property Value | - | - |
| Median Household Income | - | - |
| Monthly Housing Costs | $320 | $0 |
| Real Estate Taxes | - | - |
Property Value by Mortgage Status in Van
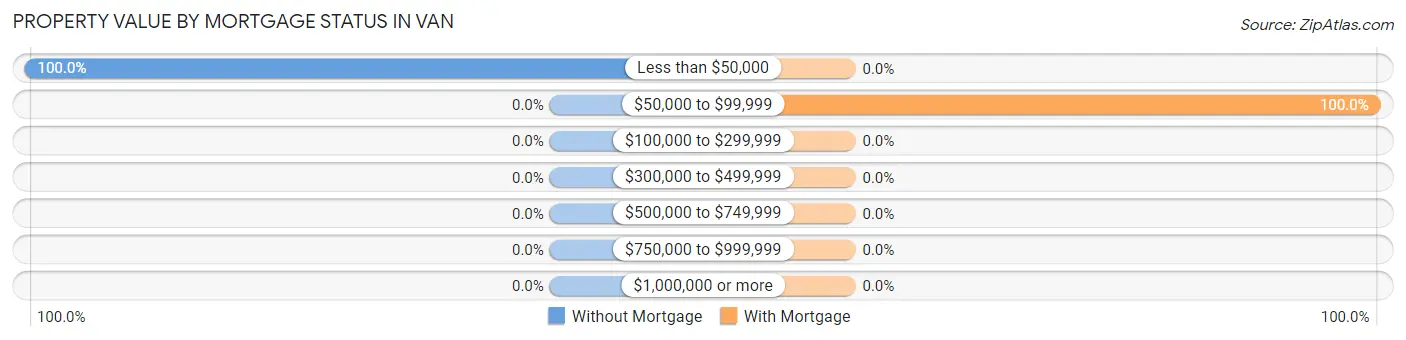
| Property Value | Without Mortgage | With Mortgage |
| Less than $50,000 | 20 (100.0%) | 0 (0.0%) |
| $50,000 to $99,999 | 0 (0.0%) | 12 (100.0%) |
| $100,000 to $299,999 | 0 (0.0%) | 0 (0.0%) |
| $300,000 to $499,999 | 0 (0.0%) | 0 (0.0%) |
| $500,000 to $749,999 | 0 (0.0%) | 0 (0.0%) |
| $750,000 to $999,999 | 0 (0.0%) | 0 (0.0%) |
| $1,000,000 or more | 0 (0.0%) | 0 (0.0%) |
| Total | 20 (100.0%) | 12 (100.0%) |
Household Income by Mortgage Status in Van
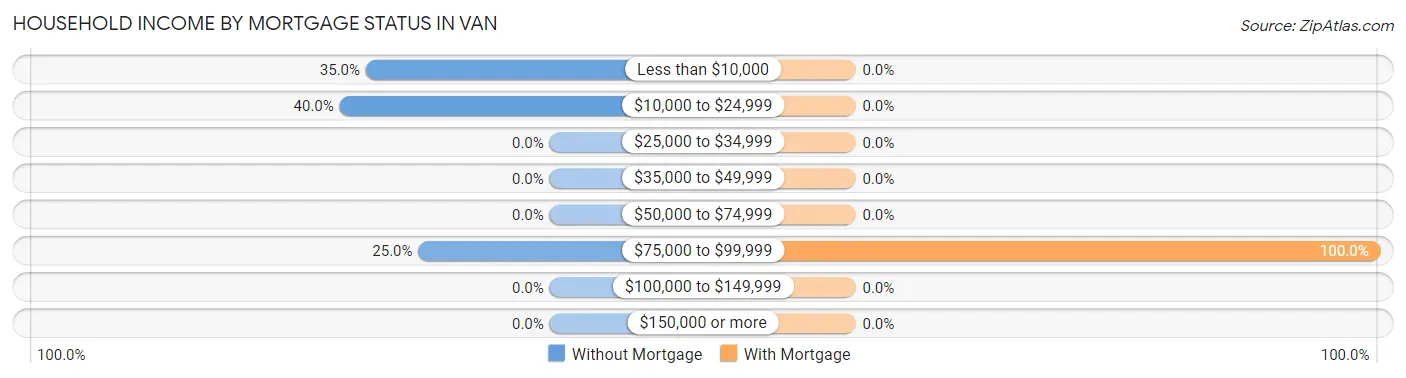
| Household Income | Without Mortgage | With Mortgage |
| Less than $10,000 | 7 (35.0%) | 0 (0.0%) |
| $10,000 to $24,999 | 8 (40.0%) | 0 (0.0%) |
| $25,000 to $34,999 | 0 (0.0%) | 0 (0.0%) |
| $35,000 to $49,999 | 0 (0.0%) | 0 (0.0%) |
| $50,000 to $74,999 | 0 (0.0%) | 0 (0.0%) |
| $75,000 to $99,999 | 5 (25.0%) | 12 (100.0%) |
| $100,000 to $149,999 | 0 (0.0%) | 0 (0.0%) |
| $150,000 or more | 0 (0.0%) | 0 (0.0%) |
| Total | 20 (100.0%) | 12 (100.0%) |
Property Value to Household Income Ratio in Van
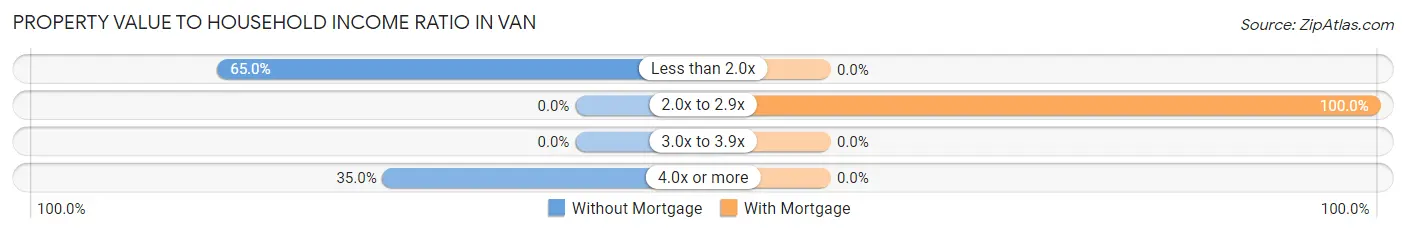
| Value-to-Income Ratio | Without Mortgage | With Mortgage |
| Less than 2.0x | 13 (65.0%) | 0 (0.0%) |
| 2.0x to 2.9x | 0 (0.0%) | 12 (100.0%) |
| 3.0x to 3.9x | 0 (0.0%) | 0 (0.0%) |
| 4.0x or more | 7 (35.0%) | 0 (0.0%) |
| Total | 20 (100.0%) | 12 (100.0%) |
Real Estate Taxes by Mortgage Status in Van
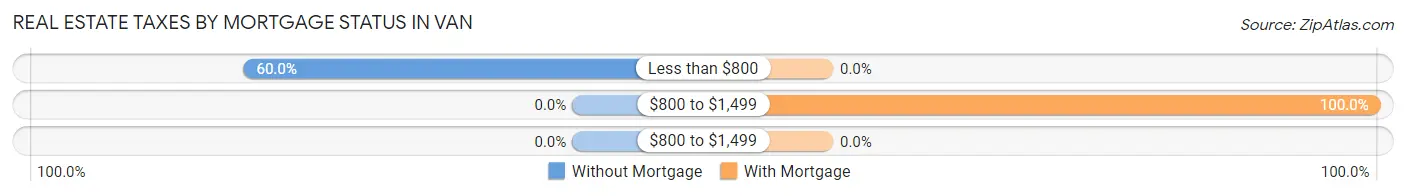
| Property Taxes | Without Mortgage | With Mortgage |
| Less than $800 | 12 (60.0%) | 0 (0.0%) |
| $800 to $1,499 | 0 (0.0%) | 12 (100.0%) |
| $800 to $1,499 | 0 (0.0%) | 0 (0.0%) |
| Total | 20 (100.0%) | 12 (100.0%) |
Health & Disability in Van
Health Insurance Coverage by Age in Van
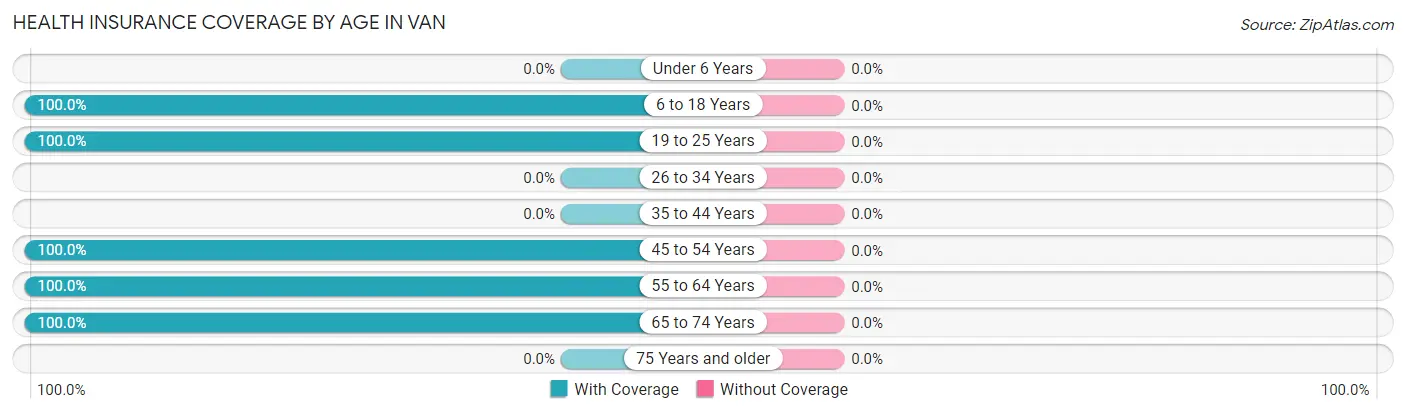
| Age Bracket | With Coverage | Without Coverage |
| Under 6 Years | 0 (0.0%) | 0 (0.0%) |
| 6 to 18 Years | 42 (100.0%) | 0 (0.0%) |
| 19 to 25 Years | 18 (100.0%) | 0 (0.0%) |
| 26 to 34 Years | 0 (0.0%) | 0 (0.0%) |
| 35 to 44 Years | 0 (0.0%) | 0 (0.0%) |
| 45 to 54 Years | 33 (100.0%) | 0 (0.0%) |
| 55 to 64 Years | 8 (100.0%) | 0 (0.0%) |
| 65 to 74 Years | 32 (100.0%) | 0 (0.0%) |
| 75 Years and older | 0 (0.0%) | 0 (0.0%) |
| Total | 133 (100.0%) | 0 (0.0%) |
Health Insurance Coverage by Citizenship Status in Van
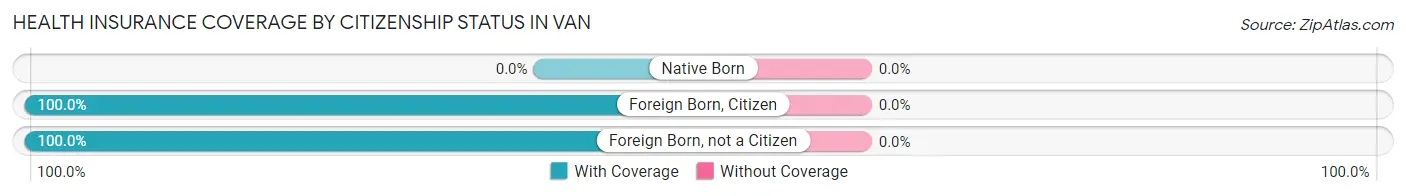
| Citizenship Status | With Coverage | Without Coverage |
| Native Born | 0 (0.0%) | 0 (0.0%) |
| Foreign Born, Citizen | 42 (100.0%) | 0 (0.0%) |
| Foreign Born, not a Citizen | 18 (100.0%) | 0 (0.0%) |
Health Insurance Coverage by Household Income in Van
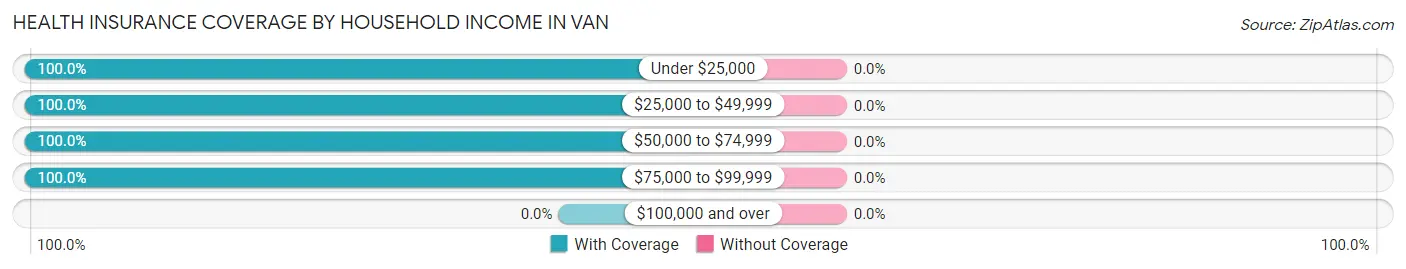
| Household Income | With Coverage | Without Coverage |
| Under $25,000 | 44 (100.0%) | 0 (0.0%) |
| $25,000 to $49,999 | 13 (100.0%) | 0 (0.0%) |
| $50,000 to $74,999 | 53 (100.0%) | 0 (0.0%) |
| $75,000 to $99,999 | 23 (100.0%) | 0 (0.0%) |
| $100,000 and over | 0 (0.0%) | 0 (0.0%) |
Public vs Private Health Insurance Coverage by Age in Van
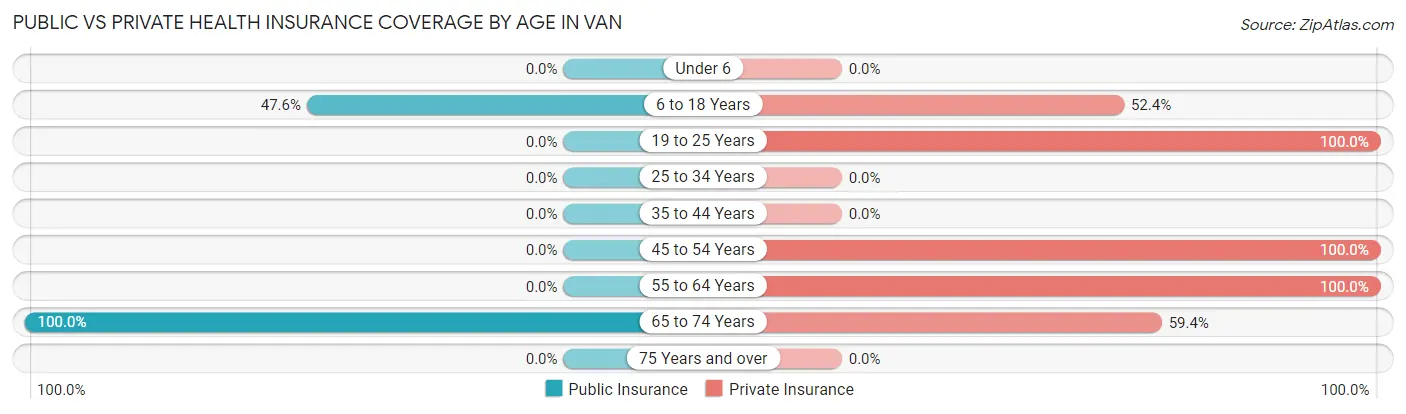
| Age Bracket | Public Insurance | Private Insurance |
| Under 6 | 0 (0.0%) | 0 (0.0%) |
| 6 to 18 Years | 20 (47.6%) | 22 (52.4%) |
| 19 to 25 Years | 0 (0.0%) | 18 (100.0%) |
| 25 to 34 Years | 0 (0.0%) | 0 (0.0%) |
| 35 to 44 Years | 0 (0.0%) | 0 (0.0%) |
| 45 to 54 Years | 0 (0.0%) | 33 (100.0%) |
| 55 to 64 Years | 0 (0.0%) | 8 (100.0%) |
| 65 to 74 Years | 32 (100.0%) | 19 (59.4%) |
| 75 Years and over | 0 (0.0%) | 0 (0.0%) |
| Total | 52 (39.1%) | 100 (75.2%) |
Disability Status by Sex by Age in Van
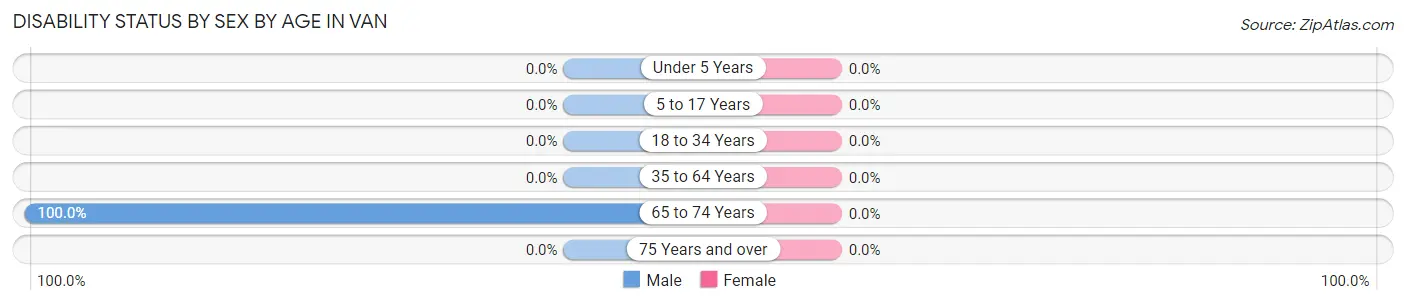
| Age Bracket | Male | Female |
| Under 5 Years | 0 (0.0%) | 0 (0.0%) |
| 5 to 17 Years | 0 (0.0%) | 0 (0.0%) |
| 18 to 34 Years | 0 (0.0%) | 0 (0.0%) |
| 35 to 64 Years | 0 (0.0%) | 0 (0.0%) |
| 65 to 74 Years | 20 (100.0%) | 0 (0.0%) |
| 75 Years and over | 0 (0.0%) | 0 (0.0%) |
Disability Class by Sex by Age in Van
Disability Class: Hearing Difficulty
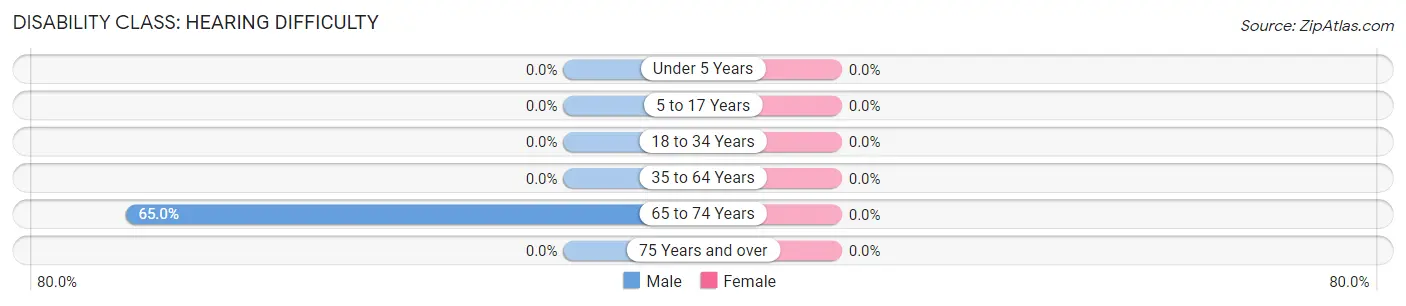
| Age Bracket | Male | Female |
| Under 5 Years | 0 (0.0%) | 0 (0.0%) |
| 5 to 17 Years | 0 (0.0%) | 0 (0.0%) |
| 18 to 34 Years | 0 (0.0%) | 0 (0.0%) |
| 35 to 64 Years | 0 (0.0%) | 0 (0.0%) |
| 65 to 74 Years | 13 (65.0%) | 0 (0.0%) |
| 75 Years and over | 0 (0.0%) | 0 (0.0%) |
Disability Class: Vision Difficulty
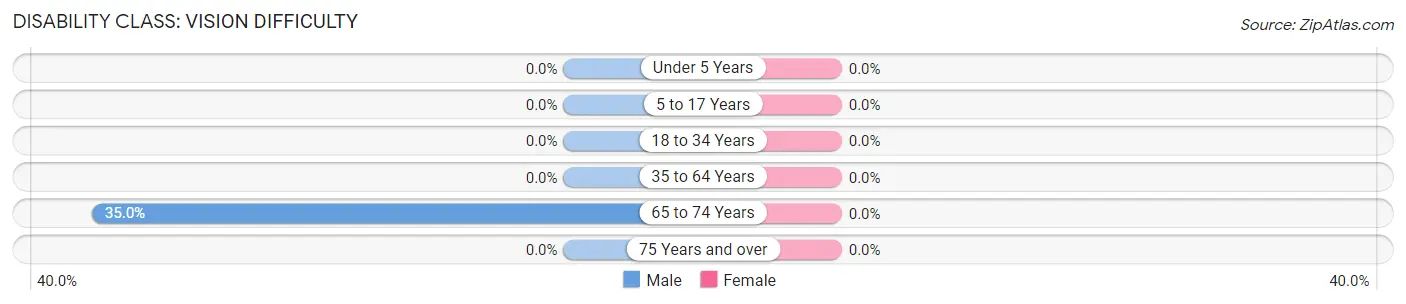
| Age Bracket | Male | Female |
| Under 5 Years | 0 (0.0%) | 0 (0.0%) |
| 5 to 17 Years | 0 (0.0%) | 0 (0.0%) |
| 18 to 34 Years | 0 (0.0%) | 0 (0.0%) |
| 35 to 64 Years | 0 (0.0%) | 0 (0.0%) |
| 65 to 74 Years | 7 (35.0%) | 0 (0.0%) |
| 75 Years and over | 0 (0.0%) | 0 (0.0%) |
Disability Class: Cognitive Difficulty
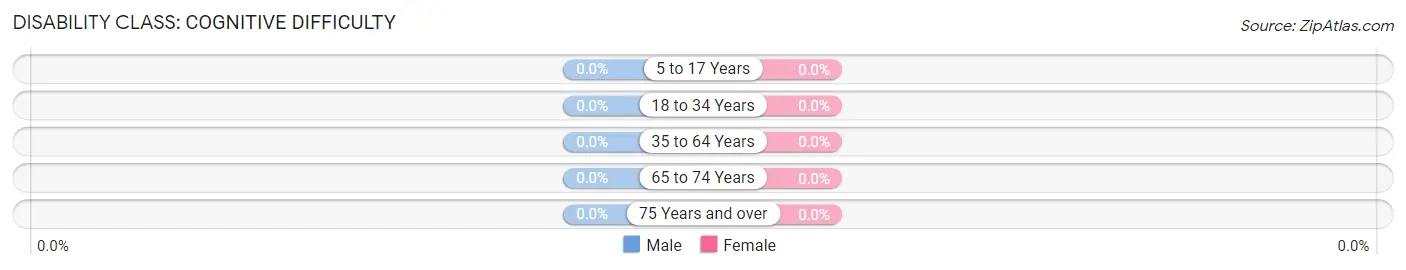
| Age Bracket | Male | Female |
| 5 to 17 Years | 0 (0.0%) | 0 (0.0%) |
| 18 to 34 Years | 0 (0.0%) | 0 (0.0%) |
| 35 to 64 Years | 0 (0.0%) | 0 (0.0%) |
| 65 to 74 Years | 0 (0.0%) | 0 (0.0%) |
| 75 Years and over | 0 (0.0%) | 0 (0.0%) |
Disability Class: Ambulatory Difficulty
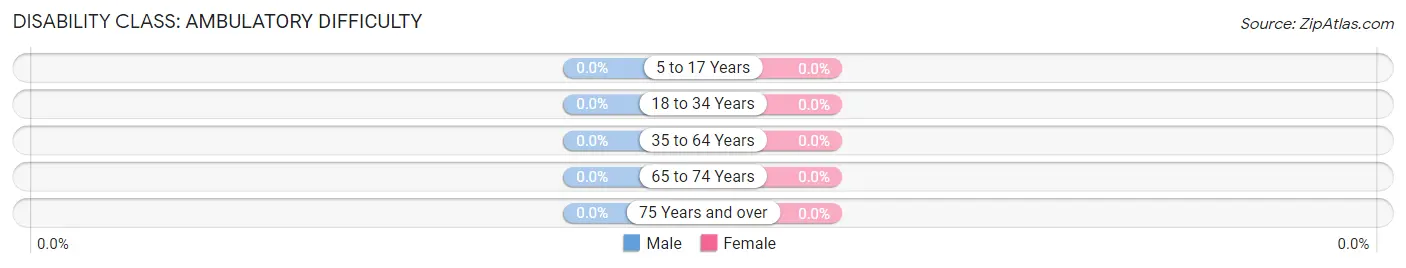
| Age Bracket | Male | Female |
| 5 to 17 Years | 0 (0.0%) | 0 (0.0%) |
| 18 to 34 Years | 0 (0.0%) | 0 (0.0%) |
| 35 to 64 Years | 0 (0.0%) | 0 (0.0%) |
| 65 to 74 Years | 0 (0.0%) | 0 (0.0%) |
| 75 Years and over | 0 (0.0%) | 0 (0.0%) |
Disability Class: Self-Care Difficulty
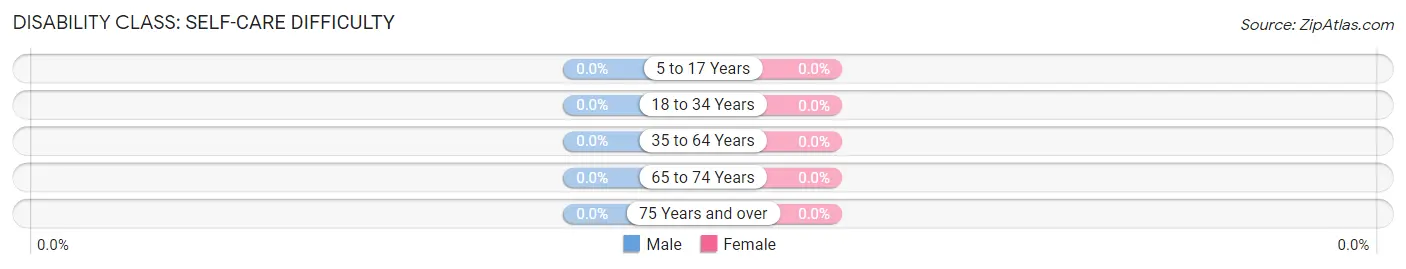
| Age Bracket | Male | Female |
| 5 to 17 Years | 0 (0.0%) | 0 (0.0%) |
| 18 to 34 Years | 0 (0.0%) | 0 (0.0%) |
| 35 to 64 Years | 0 (0.0%) | 0 (0.0%) |
| 65 to 74 Years | 0 (0.0%) | 0 (0.0%) |
| 75 Years and over | 0 (0.0%) | 0 (0.0%) |
Technology Access in Van
Computing Device Access in Van
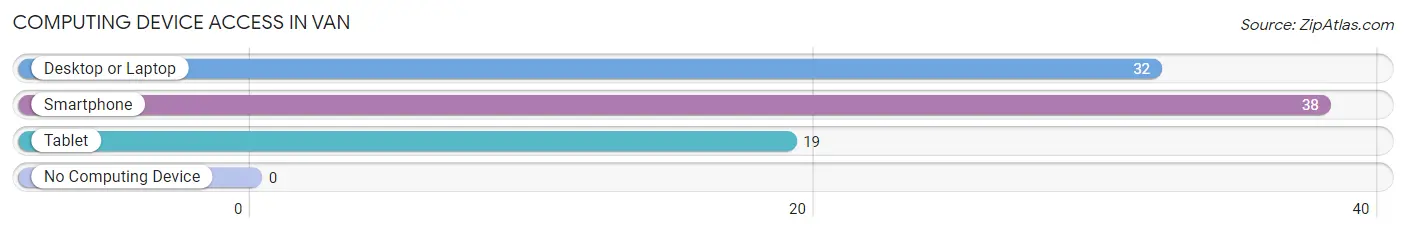
| Device Type | # Households | % Households |
| Desktop or Laptop | 32 | 71.1% |
| Smartphone | 38 | 84.4% |
| Tablet | 19 | 42.2% |
| No Computing Device | 0 | 0.0% |
| Total | 45 | 100.0% |
Internet Access in Van
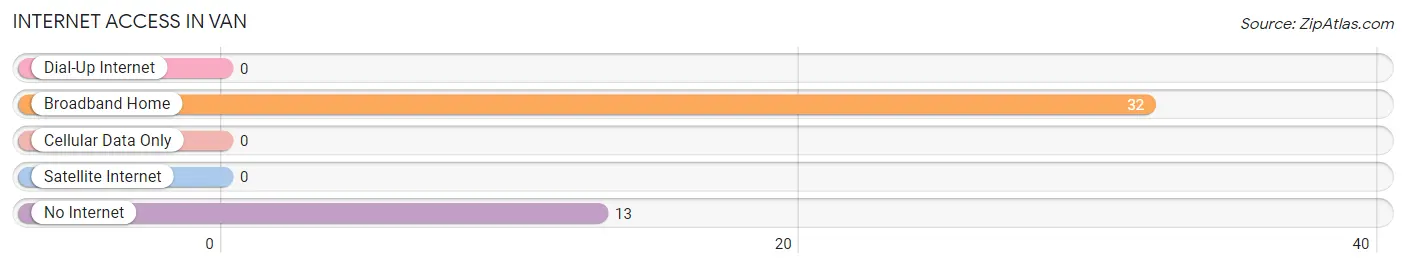
| Internet Type | # Households | % Households |
| Dial-Up Internet | 0 | 0.0% |
| Broadband Home | 32 | 71.1% |
| Cellular Data Only | 0 | 0.0% |
| Satellite Internet | 0 | 0.0% |
| No Internet | 13 | 28.9% |
| Total | 45 | 100.0% |
Van Summary
Van is a small town located in the southwestern corner of West Virginia, in the Appalachian Mountains. It is situated in the heart of the state’s coal country, and is home to a population of just over 1,000 people. The town was founded in 1883, and has a rich history of coal mining and timber production.
History
Van was founded in 1883 by the Van Mining and Manufacturing Company, which was established to exploit the coal and timber resources of the area. The company built a railroad line to connect the town to the larger cities of Charleston and Huntington, and the town quickly grew to become a major coal mining center. The town was named after the Van family, who owned the mining company.
In the early 1900s, the town was home to several large coal mines, and the population grew to over 1,000 people. The town was also home to several sawmills, which provided lumber for the surrounding area. The town was also home to a number of churches, schools, and other businesses.
In the 1950s, the coal industry began to decline, and the town’s population began to decline as well. The town’s economy shifted to focus on timber production, and the town’s population stabilized. In the late 1990s, the town began to experience a resurgence, as new businesses and industries began to move into the area.
Geography
Van is located in the southwestern corner of West Virginia, in the Appalachian Mountains. The town is situated in the heart of the state’s coal country, and is surrounded by rolling hills and forests. The town is located near the Tug Fork River, and is just a few miles from the Kentucky border.
The town is located at an elevation of 1,400 feet, and has a humid continental climate. The average temperature in the summer is around 75 degrees Fahrenheit, and the average temperature in the winter is around 35 degrees Fahrenheit. The town receives an average of 40 inches of precipitation per year.
Economy
Van’s economy is largely based on timber production and coal mining. The town is home to several sawmills, which provide lumber for the surrounding area. The town is also home to several coal mines, which provide coal for the local power plants.
The town is also home to several small businesses, including restaurants, stores, and other services. The town is also home to a number of churches, schools, and other organizations.
Demographics
As of the 2010 census, the population of Van was 1,072 people. The town is predominantly white, with a small African American population. The median household income in the town is $30,000, and the median age is 44 years old. The town has a poverty rate of 17.5%, and the unemployment rate is 8.2%.
Common Questions
What is Per Capita Income in Van?
Per Capita income in Van is $18,608.
What is Inequality or Gini Index in Van?
Inequality or Gini Index in Van is 0.33.
What is the Total Population of Van?
Total Population of Van is 133.
What is the Total Male Population of Van?
Total Male Population of Van is 79.
What is the Total Female Population of Van?
Total Female Population of Van is 54.
What is the Ratio of Males per 100 Females in Van?
There are 146.30 Males per 100 Females in Van.
What is the Ratio of Females per 100 Males in Van?
There are 68.35 Females per 100 Males in Van.
What is the Median Population Age in Van?
Median Population Age in Van is 49.5 Years.
What is the Average Family Size in Van
Average Family Size in Van is 3.1 People.
What is the Average Household Size in Van
Average Household Size in Van is 3.0 People.
How Large is the Labor Force in Van?
There are 72 People in the Labor Forcein in Van.
What is the Percentage of People in the Labor Force in Van?
64.9% of People are in the Labor Force in Van.