Zip Codes with the Highest Percentage of Population Employed in Security & Protection in Charleston, WV
RELATED REPORTS & OPTIONS
Security & Protection
Charleston
Compare Zip Codes
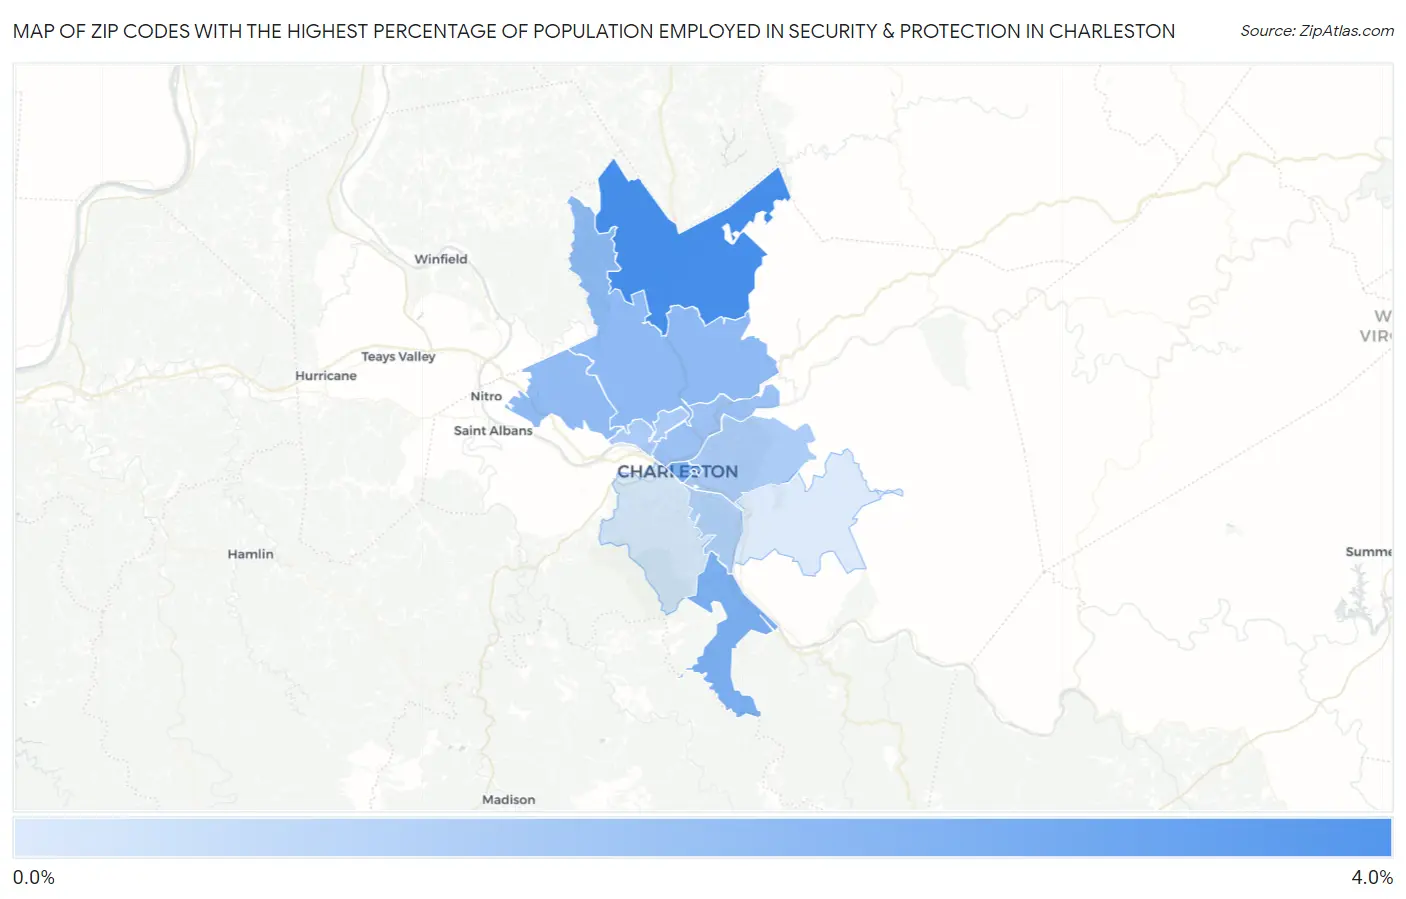
Map of Zip Codes with the Highest Percentage of Population Employed in Security & Protection in Charleston
0.46%
3.8%
Zip Codes with the Highest Percentage of Population Employed in Security & Protection in Charleston, WV
| Zip Code | % Employed | vs State | vs National | |
| 1. | 25320 | 3.8% | 2.4%(+1.39)#135 | 2.1%(+1.67)#4,864 |
| 2. | 25315 | 2.5% | 2.4%(+0.118)#191 | 2.1%(+0.395)#9,279 |
| 3. | 25301 | 2.5% | 2.4%(+0.098)#192 | 2.1%(+0.376)#9,389 |
| 4. | 25312 | 2.2% | 2.4%(-0.218)#217 | 2.1%(+0.059)#11,210 |
| 5. | 25313 | 2.2% | 2.4%(-0.271)#221 | 2.1%(+0.006)#11,542 |
| 6. | 25302 | 1.9% | 2.4%(-0.534)#233 | 2.1%(-0.257)#13,286 |
| 7. | 25387 | 1.6% | 2.4%(-0.823)#250 | 2.1%(-0.545)#15,392 |
| 8. | 25311 | 1.5% | 2.4%(-0.894)#253 | 2.1%(-0.616)#15,926 |
| 9. | 25304 | 1.4% | 2.4%(-1.00)#267 | 2.1%(-0.725)#16,781 |
| 10. | 25314 | 0.61% | 2.4%(-1.82)#307 | 2.1%(-1.54)#22,615 |
| 11. | 25306 | 0.46% | 2.4%(-1.97)#315 | 2.1%(-1.69)#23,464 |
1
Common Questions
What are the Top 10 Zip Codes with the Highest Percentage of Population Employed in Security & Protection in Charleston, WV?
Top 10 Zip Codes with the Highest Percentage of Population Employed in Security & Protection in Charleston, WV are:
What zip code has the Highest Percentage of Population Employed in Security & Protection in Charleston, WV?
25320 has the Highest Percentage of Population Employed in Security & Protection in Charleston, WV with 3.8%.
What is the Percentage of Population Employed in Security & Protection in Charleston, WV?
Percentage of Population Employed in Security & Protection in Charleston is 1.2%.
What is the Percentage of Population Employed in Security & Protection in West Virginia?
Percentage of Population Employed in Security & Protection in West Virginia is 2.4%.
What is the Percentage of Population Employed in Security & Protection in the United States?
Percentage of Population Employed in Security & Protection in the United States is 2.1%.