Sand Fork, WV Map & Demographics
Sand Fork Map
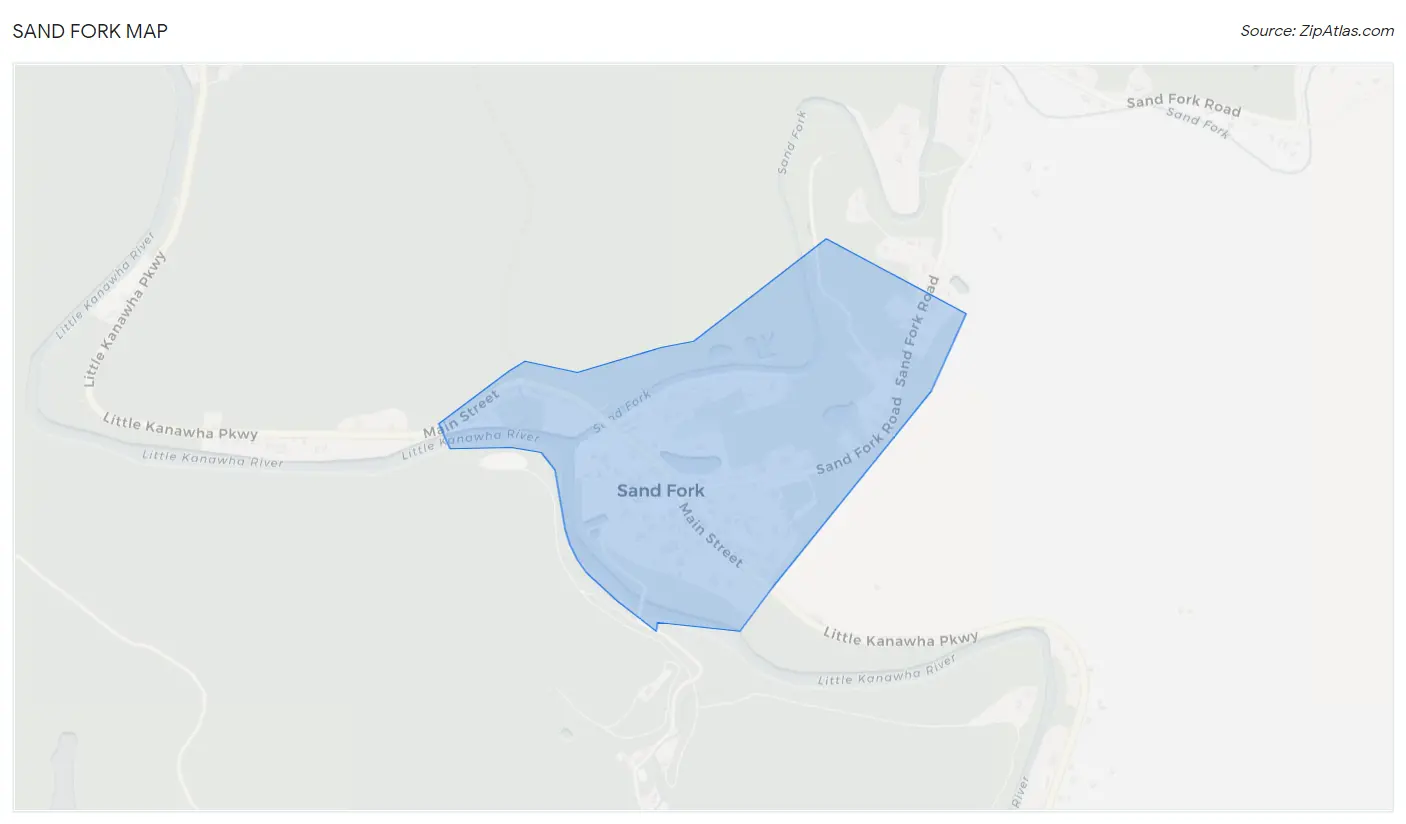
Sand Fork Overview
$21,703
PER CAPITA INCOME
$51,250
AVG FAMILY INCOME
$51,154
AVG HOUSEHOLD INCOME
0.38
INEQUALITY / GINI INDEX
112
TOTAL POPULATION
58
MALE POPULATION
54
FEMALE POPULATION
107.41
MALES / 100 FEMALES
93.10
FEMALES / 100 MALES
30.7
MEDIAN AGE
3.8
AVG FAMILY SIZE
3.1
AVG HOUSEHOLD SIZE
40
LABOR FORCE [ PEOPLE ]
58.0%
PERCENT IN LABOR FORCE
Sand Fork Zip Codes
Sand Fork Area Codes
Income in Sand Fork
Income Overview in Sand Fork
Per Capita Income in Sand Fork is $21,703, while median incomes of families and households are $51,250 and $51,154 respectively.
| Characteristic | Number | Measure |
| Per Capita Income | 112 | $21,703 |
| Median Family Income | 27 | $51,250 |
| Mean Family Income | 27 | $58,444 |
| Median Household Income | 36 | $51,154 |
| Mean Household Income | 36 | $63,344 |
| Income Deficit | 27 | $0 |
| Wage / Income Gap (%) | 112 | 0.00% |
| Wage / Income Gap ($) | 112 | 100.00¢ per $1 |
| Gini / Inequality Index | 112 | 0.38 |
Earnings by Sex in Sand Fork
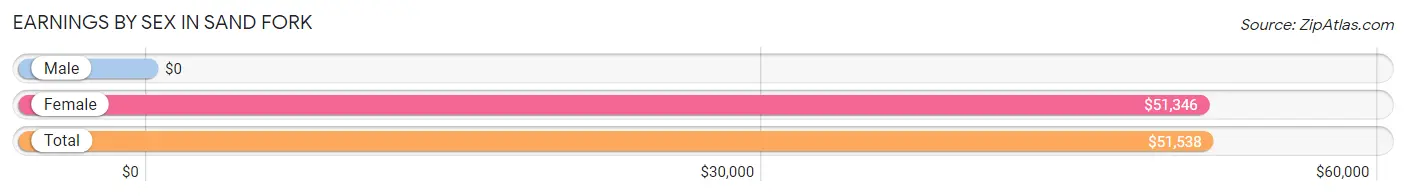
| Sex | Number | Average Earnings |
| Male | 12 (30.0%) | $0 |
| Female | 28 (70.0%) | $51,346 |
| Total | 40 (100.0%) | $51,538 |
Earnings by Sex by Income Bracket in Sand Fork
The most common earnings brackets in Sand Fork are $17,500 to $19,999 for men (5 | 41.7%) and $50,000 to $54,999 for women (13 | 46.4%).
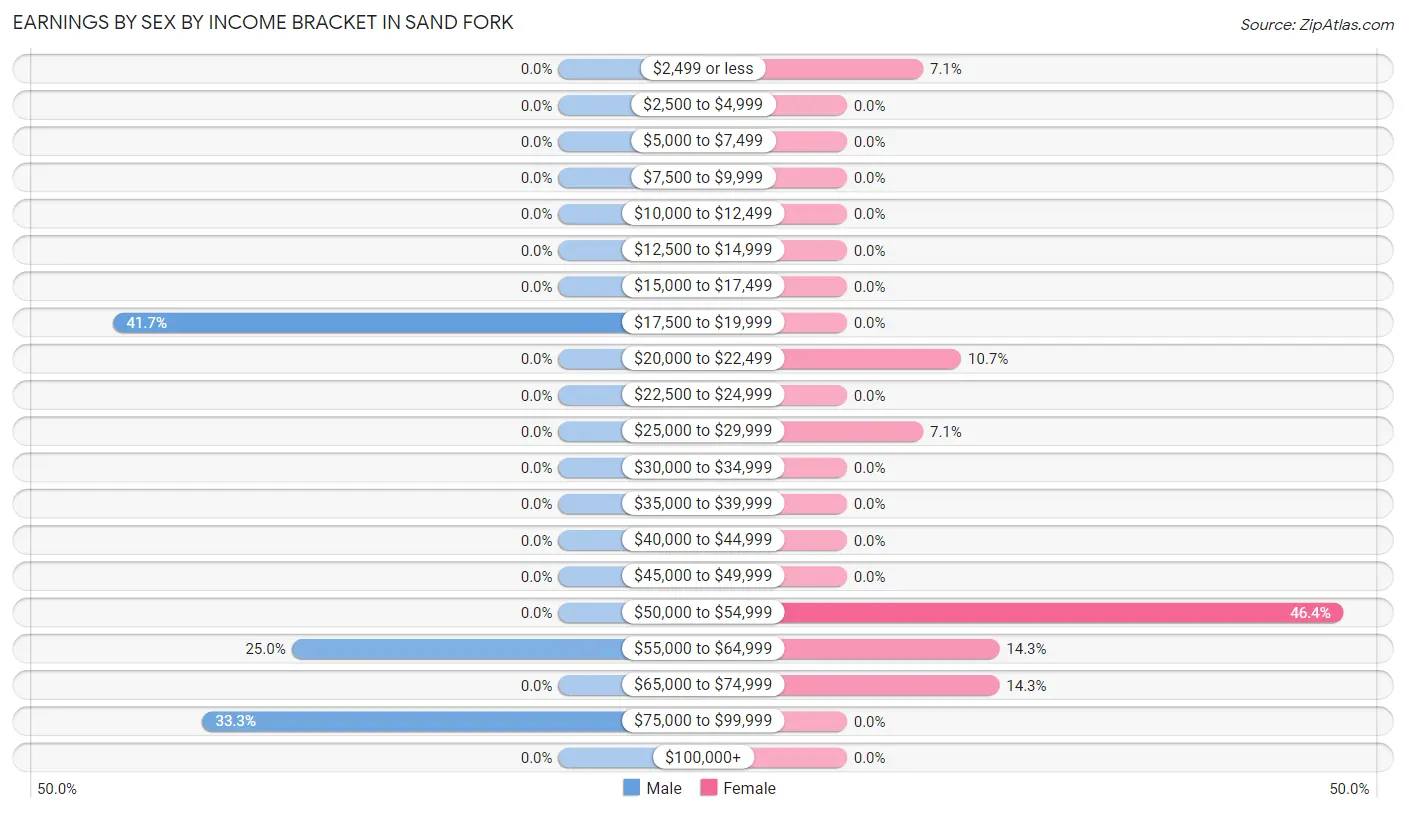
| Income | Male | Female |
| $2,499 or less | 0 (0.0%) | 2 (7.1%) |
| $2,500 to $4,999 | 0 (0.0%) | 0 (0.0%) |
| $5,000 to $7,499 | 0 (0.0%) | 0 (0.0%) |
| $7,500 to $9,999 | 0 (0.0%) | 0 (0.0%) |
| $10,000 to $12,499 | 0 (0.0%) | 0 (0.0%) |
| $12,500 to $14,999 | 0 (0.0%) | 0 (0.0%) |
| $15,000 to $17,499 | 0 (0.0%) | 0 (0.0%) |
| $17,500 to $19,999 | 5 (41.7%) | 0 (0.0%) |
| $20,000 to $22,499 | 0 (0.0%) | 3 (10.7%) |
| $22,500 to $24,999 | 0 (0.0%) | 0 (0.0%) |
| $25,000 to $29,999 | 0 (0.0%) | 2 (7.1%) |
| $30,000 to $34,999 | 0 (0.0%) | 0 (0.0%) |
| $35,000 to $39,999 | 0 (0.0%) | 0 (0.0%) |
| $40,000 to $44,999 | 0 (0.0%) | 0 (0.0%) |
| $45,000 to $49,999 | 0 (0.0%) | 0 (0.0%) |
| $50,000 to $54,999 | 0 (0.0%) | 13 (46.4%) |
| $55,000 to $64,999 | 3 (25.0%) | 4 (14.3%) |
| $65,000 to $74,999 | 0 (0.0%) | 4 (14.3%) |
| $75,000 to $99,999 | 4 (33.3%) | 0 (0.0%) |
| $100,000+ | 0 (0.0%) | 0 (0.0%) |
| Total | 12 (100.0%) | 28 (100.0%) |
Earnings by Sex by Educational Attainment in Sand Fork
| Educational Attainment | Male Income | Female Income |
| Less than High School | - | - |
| High School Diploma | - | - |
| College or Associate's Degree | - | - |
| Bachelor's Degree | - | - |
| Graduate Degree | - | - |
| Total | $87,813 | $51,346 |
Family Income in Sand Fork
Family Income Brackets in Sand Fork
According to the Sand Fork family income data, there are 13 families falling into the $50,000 to $74,999 income range, which is the most common income bracket and makes up 48.1% of all families.
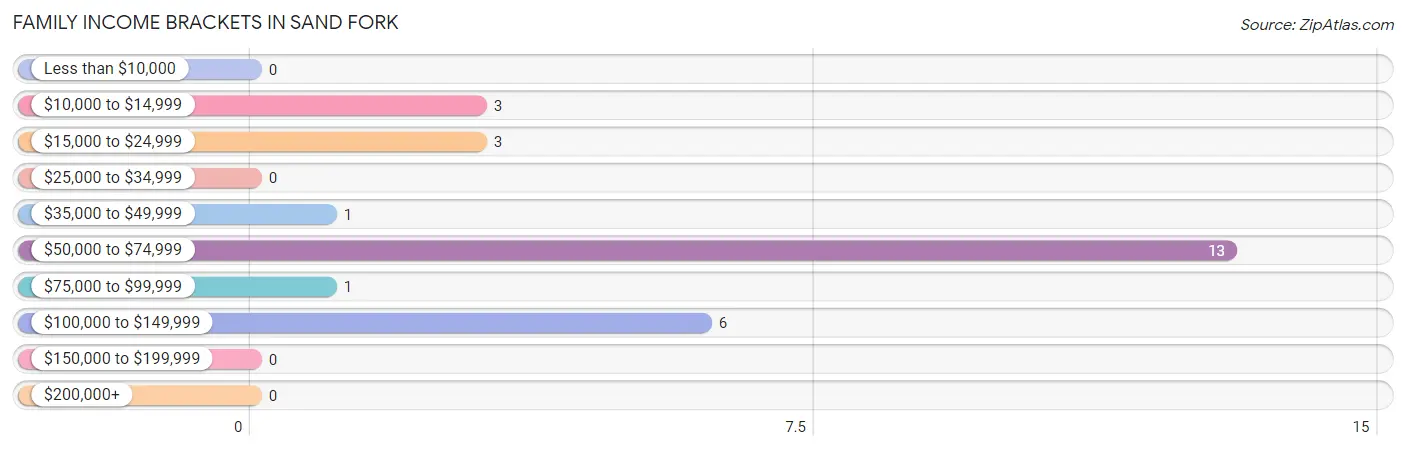
| Income Bracket | # Families | % Families |
| Less than $10,000 | 0 | 0.0% |
| $10,000 to $14,999 | 3 | 11.1% |
| $15,000 to $24,999 | 3 | 11.1% |
| $25,000 to $34,999 | 0 | 0.0% |
| $35,000 to $49,999 | 1 | 3.7% |
| $50,000 to $74,999 | 13 | 48.1% |
| $75,000 to $99,999 | 1 | 3.7% |
| $100,000 to $149,999 | 6 | 22.2% |
| $150,000 to $199,999 | 0 | 0.0% |
| $200,000+ | 0 | 0.0% |
Family Income by Famaliy Size in Sand Fork
3-person families (18 | 66.7%) account for the highest median family income in Sand Fork with $51,538 per family, while 3-person families (18 | 66.7%) have the highest median income of $17,179 per family member.
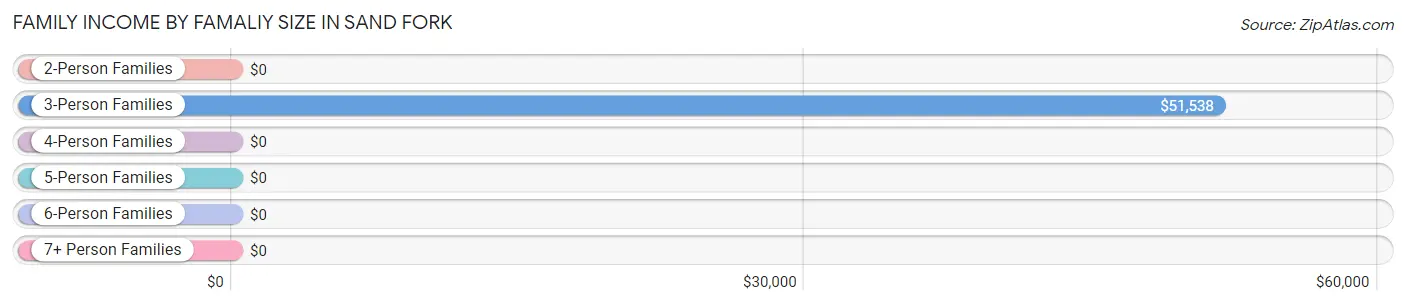
| Income Bracket | # Families | Median Income |
| 2-Person Families | 4 (14.8%) | $0 |
| 3-Person Families | 18 (66.7%) | $51,538 |
| 4-Person Families | 2 (7.4%) | $0 |
| 5-Person Families | 3 (11.1%) | $0 |
| 6-Person Families | 0 (0.0%) | $0 |
| 7+ Person Families | 0 (0.0%) | $0 |
| Total | 27 (100.0%) | $51,250 |
Family Income by Number of Earners in Sand Fork
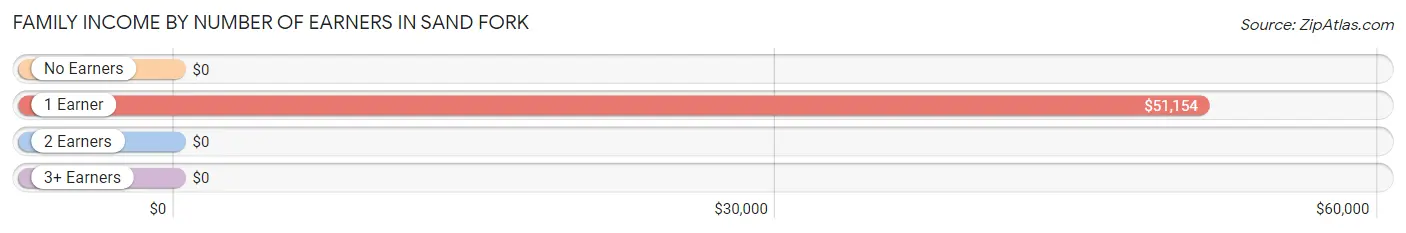
| Number of Earners | # Families | Median Income |
| No Earners | 5 (18.5%) | $0 |
| 1 Earner | 16 (59.3%) | $51,154 |
| 2 Earners | 6 (22.2%) | $0 |
| 3+ Earners | 0 (0.0%) | $0 |
| Total | 27 (100.0%) | $51,250 |
Household Income in Sand Fork
Household Income Brackets in Sand Fork
With 13 households falling in the category, the $50,000 to $74,999 income range is the most frequent in Sand Fork, accounting for 36.1% of all households.
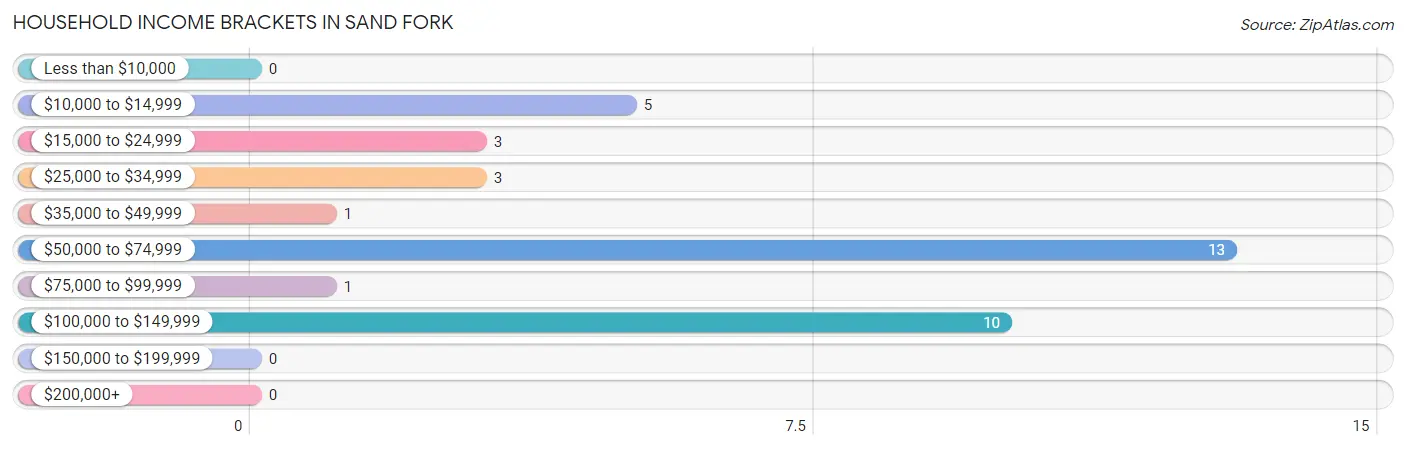
| Income Bracket | # Households | % Households |
| Less than $10,000 | 0 | 0.0% |
| $10,000 to $14,999 | 5 | 13.9% |
| $15,000 to $24,999 | 3 | 8.3% |
| $25,000 to $34,999 | 3 | 8.3% |
| $35,000 to $49,999 | 1 | 2.8% |
| $50,000 to $74,999 | 13 | 36.1% |
| $75,000 to $99,999 | 1 | 2.8% |
| $100,000 to $149,999 | 10 | 27.8% |
| $150,000 to $199,999 | 0 | 0.0% |
| $200,000+ | 0 | 0.0% |
Household Income by Householder Age in Sand Fork
The median household income in Sand Fork is $51,154, with the highest median household income of $51,635 found in the 25 to 44 years age bracket for the primary householder. A total of 23 households (63.9%) fall into this category. Meanwhile, the 15 to 24 years age bracket for the primary householder has the lowest median household income of $0, with 1 households (2.8%) in this group.
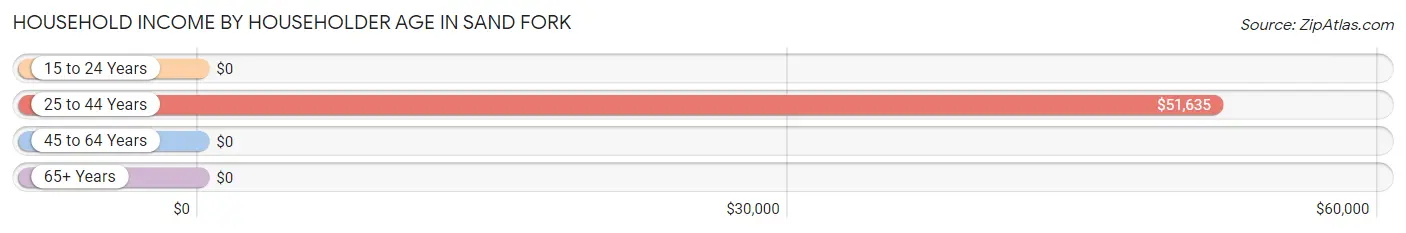
| Income Bracket | # Households | Median Income |
| 15 to 24 Years | 1 (2.8%) | $0 |
| 25 to 44 Years | 23 (63.9%) | $51,635 |
| 45 to 64 Years | 2 (5.6%) | $0 |
| 65+ Years | 10 (27.8%) | $0 |
| Total | 36 (100.0%) | $51,154 |
Poverty in Sand Fork
Income Below Poverty by Sex and Age in Sand Fork
With 46.6% poverty level for males and 13.0% for females among the residents of Sand Fork, under 5 year old males and 18 to 24 year old females are the most vulnerable to poverty, with 4 males (100.0%) and 1 females (100.0%) in their respective age groups living below the poverty level.
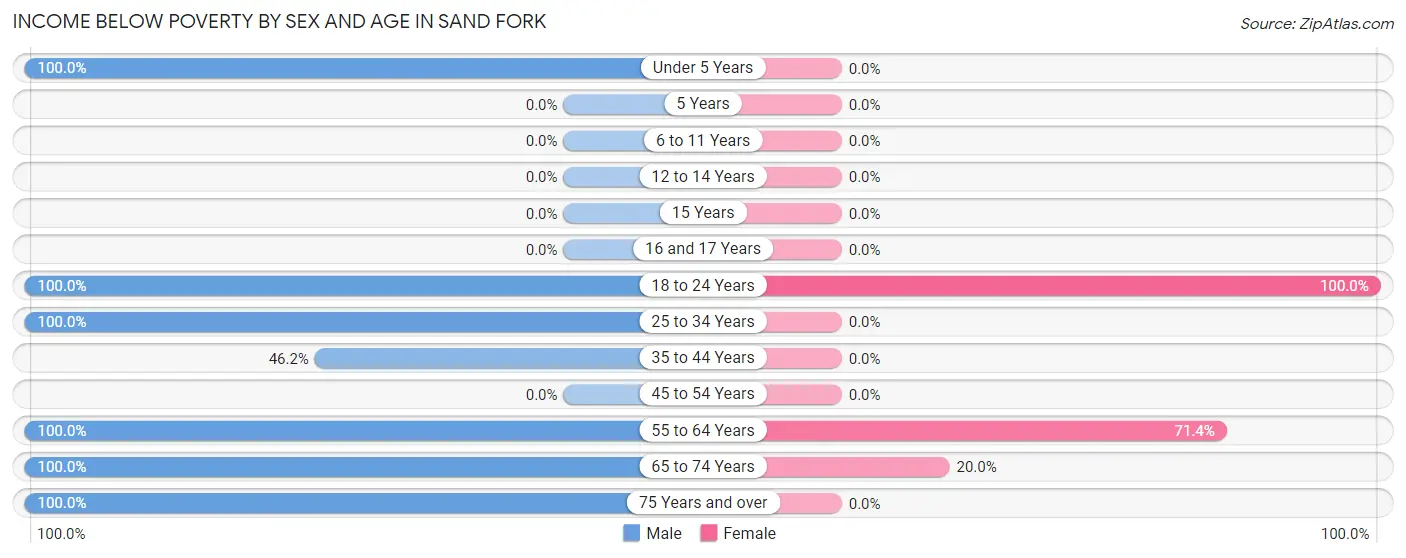
| Age Bracket | Male | Female |
| Under 5 Years | 4 (100.0%) | 0 (0.0%) |
| 5 Years | 0 (0.0%) | 0 (0.0%) |
| 6 to 11 Years | 0 (0.0%) | 0 (0.0%) |
| 12 to 14 Years | 0 (0.0%) | 0 (0.0%) |
| 15 Years | 0 (0.0%) | 0 (0.0%) |
| 16 and 17 Years | 0 (0.0%) | 0 (0.0%) |
| 18 to 24 Years | 10 (100.0%) | 1 (100.0%) |
| 25 to 34 Years | 1 (100.0%) | 0 (0.0%) |
| 35 to 44 Years | 6 (46.2%) | 0 (0.0%) |
| 45 to 54 Years | 0 (0.0%) | 0 (0.0%) |
| 55 to 64 Years | 2 (100.0%) | 5 (71.4%) |
| 65 to 74 Years | 2 (100.0%) | 1 (20.0%) |
| 75 Years and over | 2 (100.0%) | 0 (0.0%) |
| Total | 27 (46.6%) | 7 (13.0%) |
Income Above Poverty by Sex and Age in Sand Fork
According to the poverty statistics in Sand Fork, males aged 6 to 11 years and females aged under 5 years are the age groups that are most secure financially, with 100.0% of males and 100.0% of females in these age groups living above the poverty line.
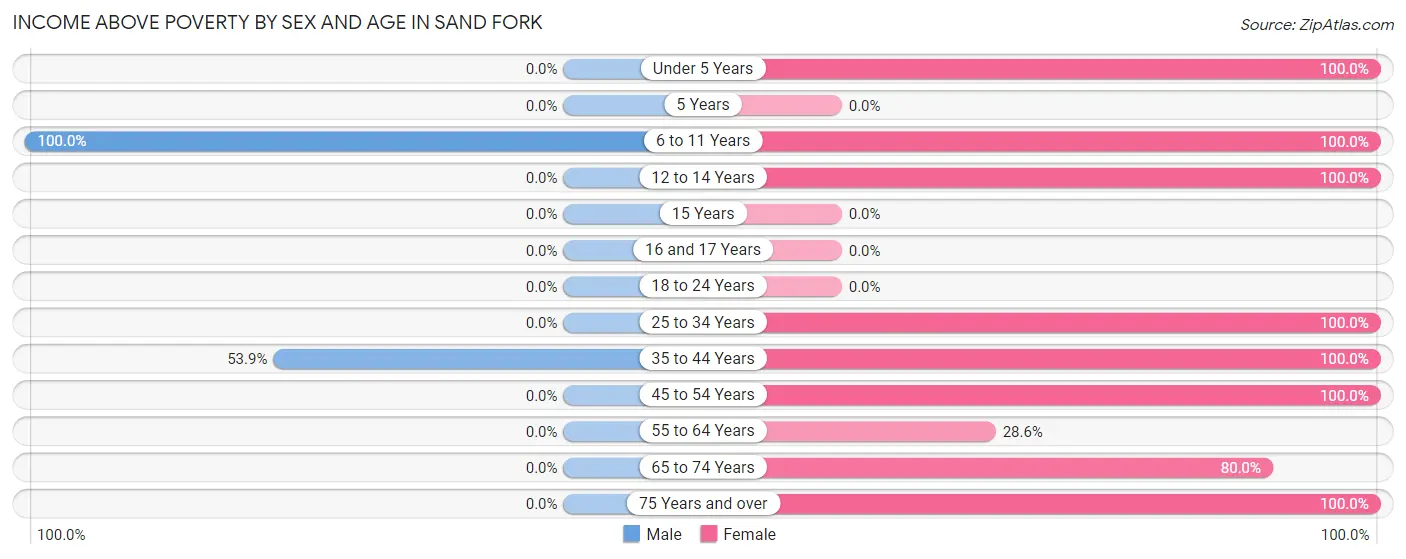
| Age Bracket | Male | Female |
| Under 5 Years | 0 (0.0%) | 8 (100.0%) |
| 5 Years | 0 (0.0%) | 0 (0.0%) |
| 6 to 11 Years | 24 (100.0%) | 5 (100.0%) |
| 12 to 14 Years | 0 (0.0%) | 2 (100.0%) |
| 15 Years | 0 (0.0%) | 0 (0.0%) |
| 16 and 17 Years | 0 (0.0%) | 0 (0.0%) |
| 18 to 24 Years | 0 (0.0%) | 0 (0.0%) |
| 25 to 34 Years | 0 (0.0%) | 5 (100.0%) |
| 35 to 44 Years | 7 (53.8%) | 17 (100.0%) |
| 45 to 54 Years | 0 (0.0%) | 3 (100.0%) |
| 55 to 64 Years | 0 (0.0%) | 2 (28.6%) |
| 65 to 74 Years | 0 (0.0%) | 4 (80.0%) |
| 75 Years and over | 0 (0.0%) | 1 (100.0%) |
| Total | 31 (53.4%) | 47 (87.0%) |
Income Below Poverty Among Married-Couple Families in Sand Fork
The poverty statistics for married-couple families in Sand Fork show that 41.7% or 5 of the total 12 families live below the poverty line. Families with no children have the highest poverty rate of 100.0%, comprising of 4 families. On the other hand, families with 3 or 4 children have the lowest poverty rate of 0.0%, which includes 0 families.
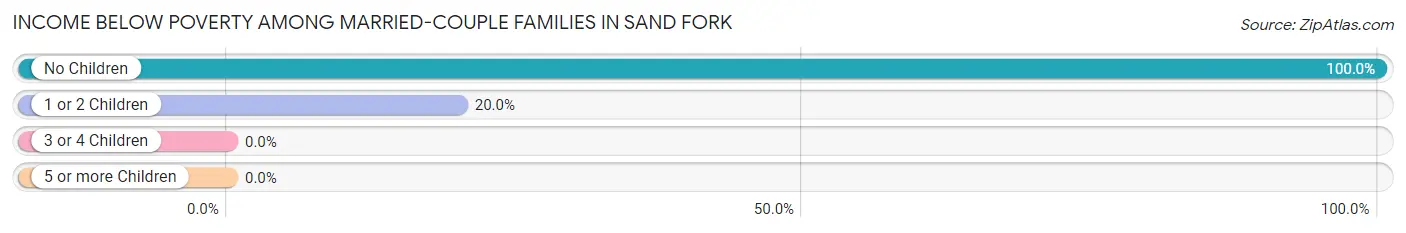
| Children | Above Poverty | Below Poverty |
| No Children | 0 (0.0%) | 4 (100.0%) |
| 1 or 2 Children | 4 (80.0%) | 1 (20.0%) |
| 3 or 4 Children | 3 (100.0%) | 0 (0.0%) |
| 5 or more Children | 0 (0.0%) | 0 (0.0%) |
| Total | 7 (58.3%) | 5 (41.7%) |
Income Below Poverty Among Single-Parent Households in Sand Fork
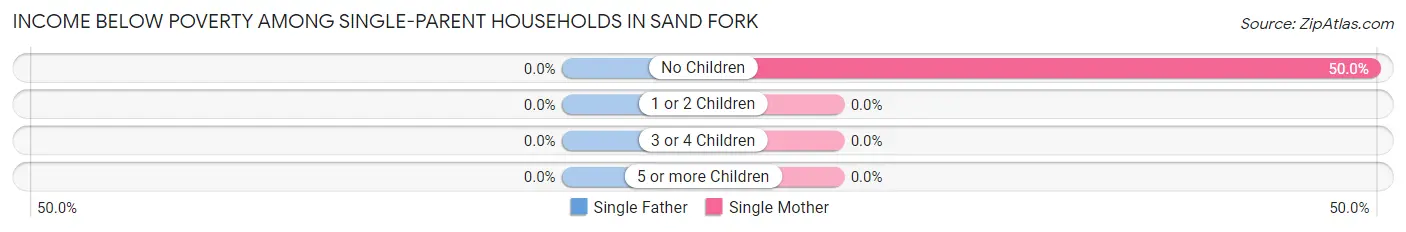
| Children | Single Father | Single Mother |
| No Children | 0 (0.0%) | 1 (50.0%) |
| 1 or 2 Children | 0 (0.0%) | 0 (0.0%) |
| 3 or 4 Children | 0 (0.0%) | 0 (0.0%) |
| 5 or more Children | 0 (0.0%) | 0 (0.0%) |
| Total | 0 (0.0%) | 1 (6.7%) |
Income Below Poverty Among Married-Couple vs Single-Parent Households in Sand Fork
The poverty data for Sand Fork shows that 5 of the married-couple family households (41.7%) and 1 of the single-parent households (6.7%) are living below the poverty level. Within the married-couple family households, those with no children have the highest poverty rate, with 4 households (100.0%) falling below the poverty line. Among the single-parent households, those with no children have the highest poverty rate, with 1 household (50.0%) living below poverty.
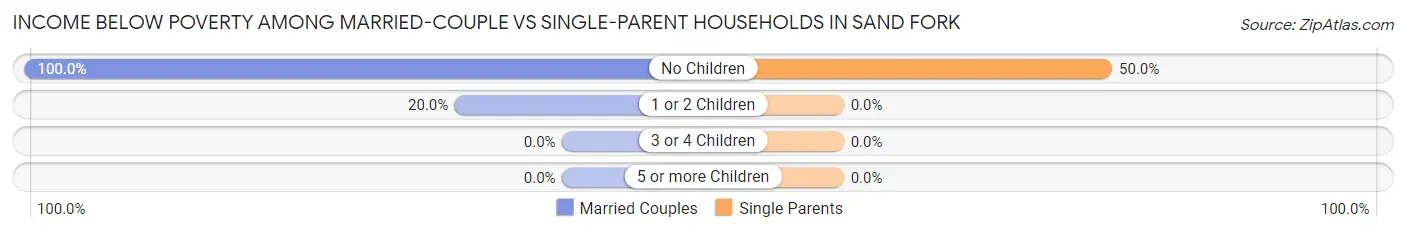
| Children | Married-Couple Families | Single-Parent Households |
| No Children | 4 (100.0%) | 1 (50.0%) |
| 1 or 2 Children | 1 (20.0%) | 0 (0.0%) |
| 3 or 4 Children | 0 (0.0%) | 0 (0.0%) |
| 5 or more Children | 0 (0.0%) | 0 (0.0%) |
| Total | 5 (41.7%) | 1 (6.7%) |
Race in Sand Fork
The most populous races in Sand Fork are White / Caucasian (105 | 93.8%), and Two or more Races (7 | 6.2%).
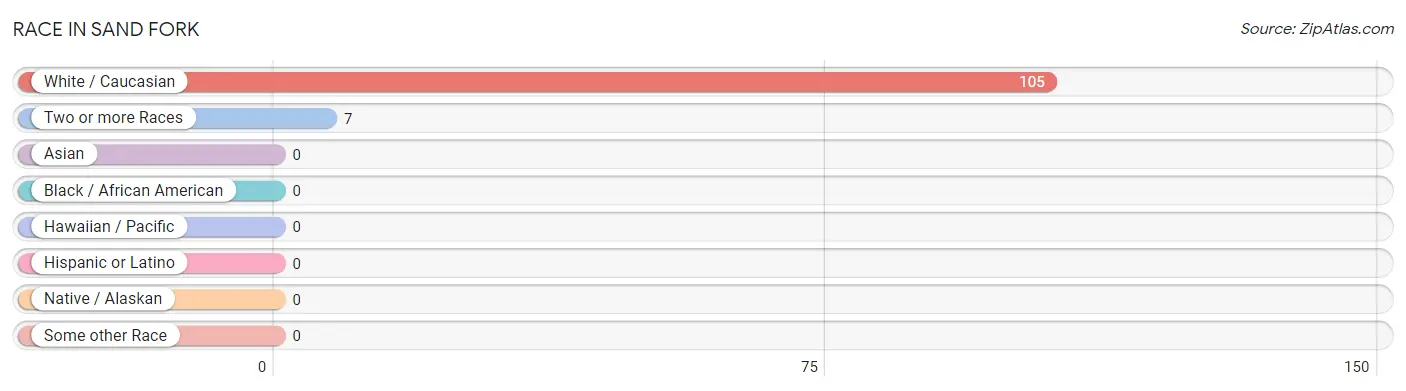
| Race | # Population | % Population |
| Asian | 0 | 0.0% |
| Black / African American | 0 | 0.0% |
| Hawaiian / Pacific | 0 | 0.0% |
| Hispanic or Latino | 0 | 0.0% |
| Native / Alaskan | 0 | 0.0% |
| White / Caucasian | 105 | 93.8% |
| Two or more Races | 7 | 6.2% |
| Some other Race | 0 | 0.0% |
| Total | 112 | 100.0% |
Ancestry in Sand Fork
The most populous ancestries reported in Sand Fork are Irish (35 | 31.2%), Italian (33 | 29.5%), German (24 | 21.4%), American (10 | 8.9%), and English (6 | 5.4%), together accounting for 96.4% of all Sand Fork residents.
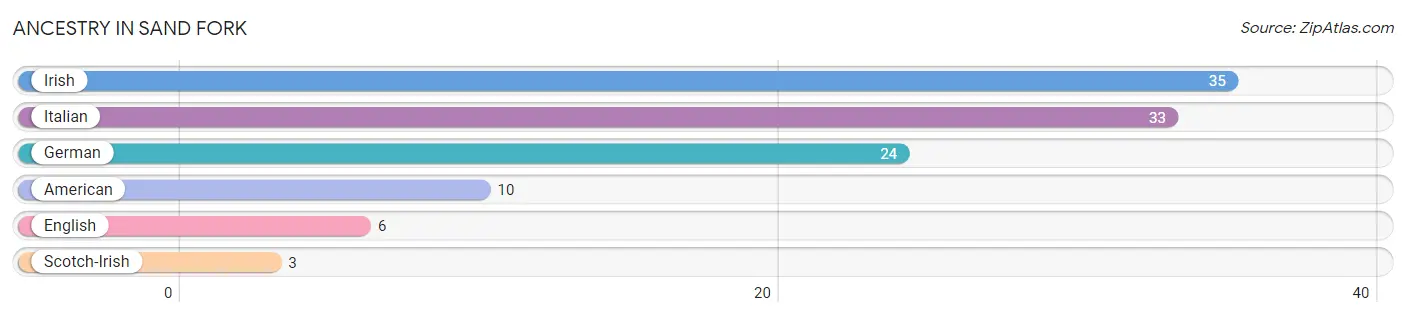
| Ancestry | # Population | % Population |
| American | 10 | 8.9% |
| English | 6 | 5.4% |
| German | 24 | 21.4% |
| Irish | 35 | 31.2% |
| Italian | 33 | 29.5% |
| Scotch-Irish | 3 | 2.7% | View All 6 Rows |
Immigrants in Sand Fork

| Immigration Origin | # Population | % Population | View All 0 Rows |
Sex and Age in Sand Fork
Sex and Age in Sand Fork
The most populous age groups in Sand Fork are 5 to 9 Years (14 | 24.1%) for men and 35 to 39 Years (17 | 31.5%) for women.
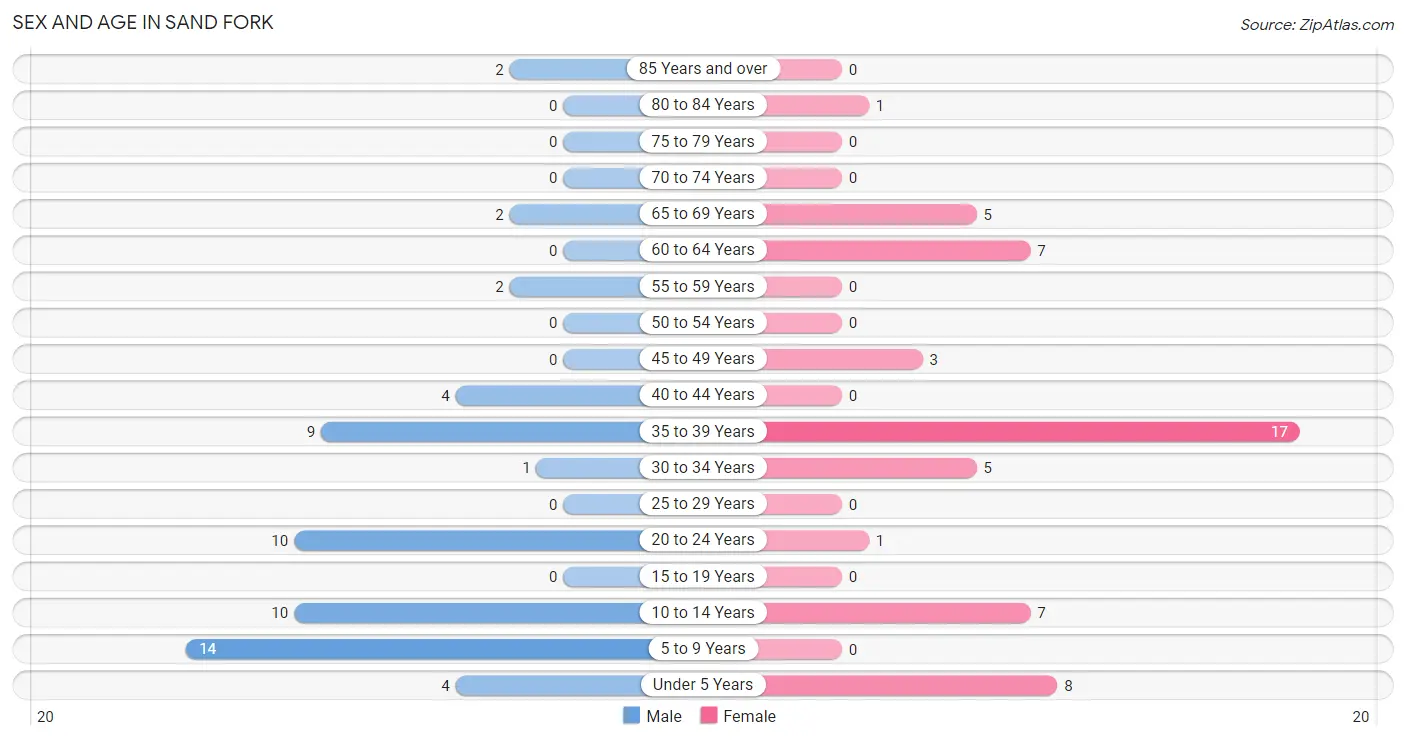
| Age Bracket | Male | Female |
| Under 5 Years | 4 (6.9%) | 8 (14.8%) |
| 5 to 9 Years | 14 (24.1%) | 0 (0.0%) |
| 10 to 14 Years | 10 (17.2%) | 7 (13.0%) |
| 15 to 19 Years | 0 (0.0%) | 0 (0.0%) |
| 20 to 24 Years | 10 (17.2%) | 1 (1.8%) |
| 25 to 29 Years | 0 (0.0%) | 0 (0.0%) |
| 30 to 34 Years | 1 (1.7%) | 5 (9.3%) |
| 35 to 39 Years | 9 (15.5%) | 17 (31.5%) |
| 40 to 44 Years | 4 (6.9%) | 0 (0.0%) |
| 45 to 49 Years | 0 (0.0%) | 3 (5.6%) |
| 50 to 54 Years | 0 (0.0%) | 0 (0.0%) |
| 55 to 59 Years | 2 (3.5%) | 0 (0.0%) |
| 60 to 64 Years | 0 (0.0%) | 7 (13.0%) |
| 65 to 69 Years | 2 (3.5%) | 5 (9.3%) |
| 70 to 74 Years | 0 (0.0%) | 0 (0.0%) |
| 75 to 79 Years | 0 (0.0%) | 0 (0.0%) |
| 80 to 84 Years | 0 (0.0%) | 1 (1.8%) |
| 85 Years and over | 2 (3.5%) | 0 (0.0%) |
| Total | 58 (100.0%) | 54 (100.0%) |
Families and Households in Sand Fork
Median Family Size in Sand Fork

| Family Type | # Families | Family Size |
| Married-Couple | 12 (44.4%) | 4.92 |
| Single Male/Father | 0 (0.0%) | - |
| Single Female/Mother | 15 (55.6%) | 2.87 |
| Total Families | 27 (100.0%) | 3.78 |
Median Household Size in Sand Fork
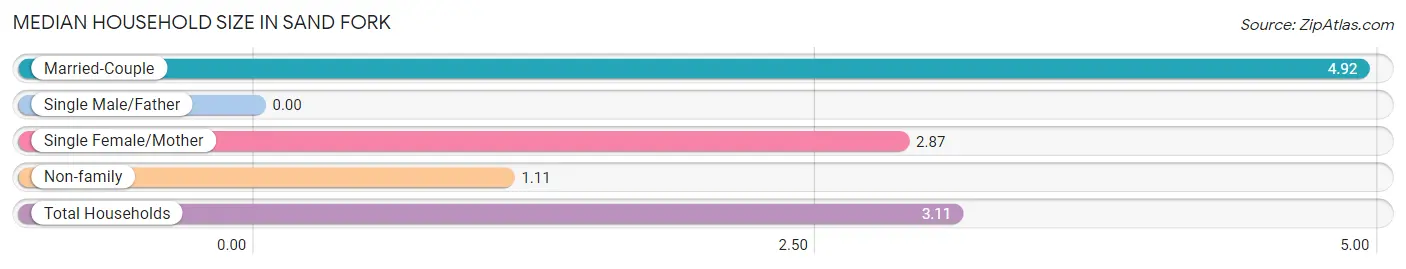
| Household Type | # Households | Household Size |
| Married-Couple | 12 (33.3%) | 4.92 |
| Single Male/Father | 0 (0.0%) | - |
| Single Female/Mother | 15 (41.7%) | 2.87 |
| Non-family | 9 (25.0%) | 1.11 |
| Total Households | 36 (100.0%) | 3.11 |
Household Size by Marriage Status in Sand Fork
Out of a total of 36 households in Sand Fork, 27 (75.0%) are family households, while 9 (25.0%) are nonfamily households. The most numerous type of family households are 3-person households, comprising 18, and the most common type of nonfamily households are 1-person households, comprising 6.
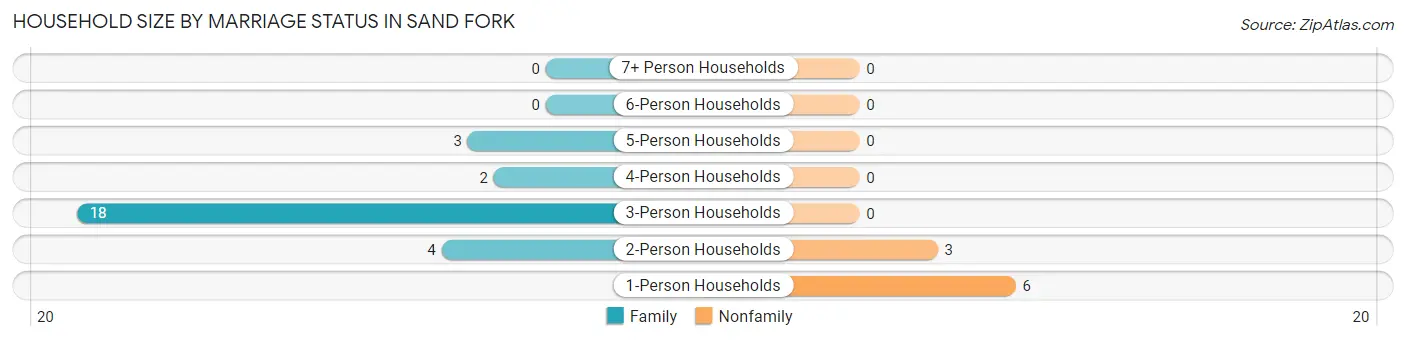
| Household Size | Family Households | Nonfamily Households |
| 1-Person Households | - | 6 (16.7%) |
| 2-Person Households | 4 (11.1%) | 3 (8.3%) |
| 3-Person Households | 18 (50.0%) | 0 (0.0%) |
| 4-Person Households | 2 (5.6%) | 0 (0.0%) |
| 5-Person Households | 3 (8.3%) | 0 (0.0%) |
| 6-Person Households | 0 (0.0%) | 0 (0.0%) |
| 7+ Person Households | 0 (0.0%) | 0 (0.0%) |
| Total | 27 (75.0%) | 9 (25.0%) |
Female Fertility in Sand Fork
Fertility by Age in Sand Fork
Average fertility rate in Sand Fork is 231.0 births per 1,000 women. Women in the age bracket of 20 to 34 years have the highest fertility rate with 333.0 births per 1,000 women. Women in the age bracket of 35 to 50 years acount for 66.7% of all women with births.
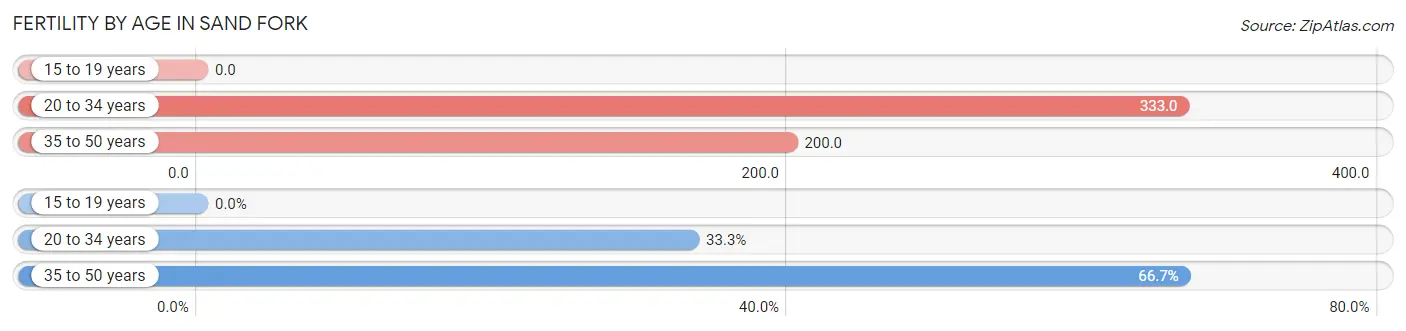
| Age Bracket | Women with Births | Births / 1,000 Women |
| 15 to 19 years | 0 (0.0%) | 0.0 |
| 20 to 34 years | 2 (33.3%) | 333.0 |
| 35 to 50 years | 4 (66.7%) | 200.0 |
| Total | 6 (100.0%) | 231.0 |
Fertility by Age by Marriage Status in Sand Fork
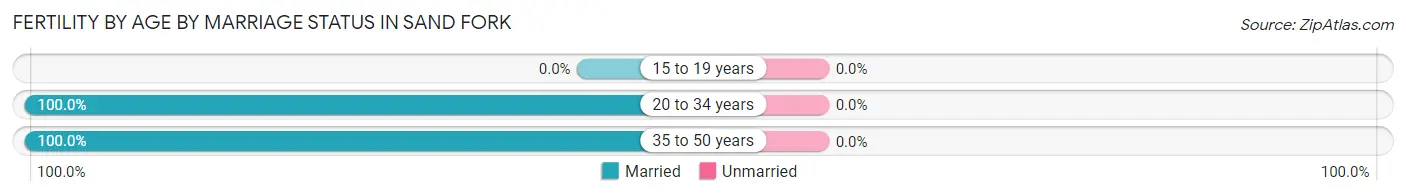
| Age Bracket | Married | Unmarried |
| 15 to 19 years | 0 (0.0%) | 0 (0.0%) |
| 20 to 34 years | 2 (100.0%) | 0 (0.0%) |
| 35 to 50 years | 4 (100.0%) | 0 (0.0%) |
| Total | 6 (100.0%) | 0 (0.0%) |
Fertility by Education in Sand Fork
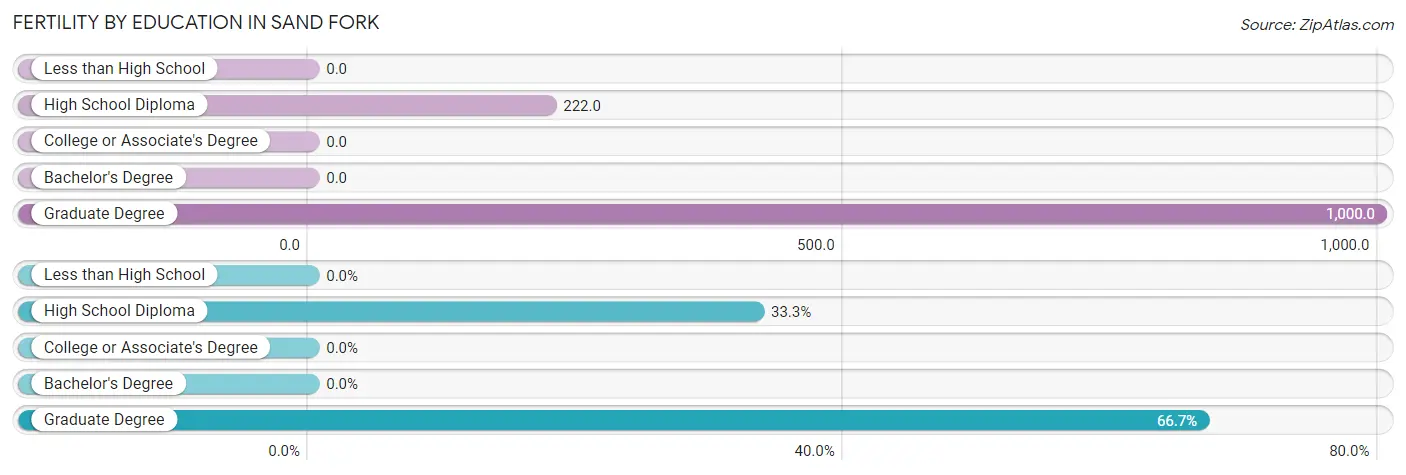
| Educational Attainment | Women with Births | Births / 1,000 Women |
| Less than High School | 0 (0.0%) | 0.0 |
| High School Diploma | 2 (33.3%) | 222.0 |
| College or Associate's Degree | 0 (0.0%) | 0.0 |
| Bachelor's Degree | 0 (0.0%) | 0.0 |
| Graduate Degree | 4 (66.7%) | 1,000.0 |
| Total | 6 (100.0%) | 231.0 |
Fertility by Education by Marriage Status in Sand Fork
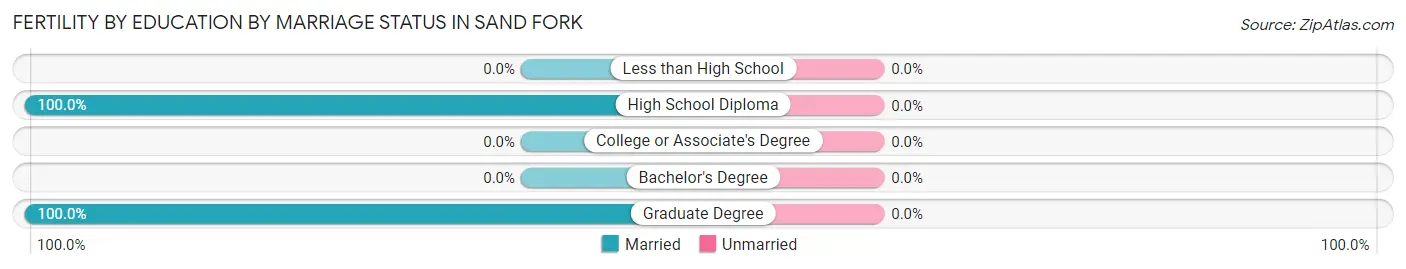
| Educational Attainment | Married | Unmarried |
| Less than High School | 0 (0.0%) | 0 (0.0%) |
| High School Diploma | 2 (100.0%) | 0 (0.0%) |
| College or Associate's Degree | 0 (0.0%) | 0 (0.0%) |
| Bachelor's Degree | 0 (0.0%) | 0 (0.0%) |
| Graduate Degree | 4 (100.0%) | 0 (0.0%) |
| Total | 6 (100.0%) | 0 (0.0%) |
Employment Characteristics in Sand Fork
Employment by Class of Employer in Sand Fork
Among the 36 employed individuals in Sand Fork, state government employees (15 | 41.7%), federal government employees (11 | 30.6%), and not-for-profit organizations (5 | 13.9%) make up the most common classes of employment.
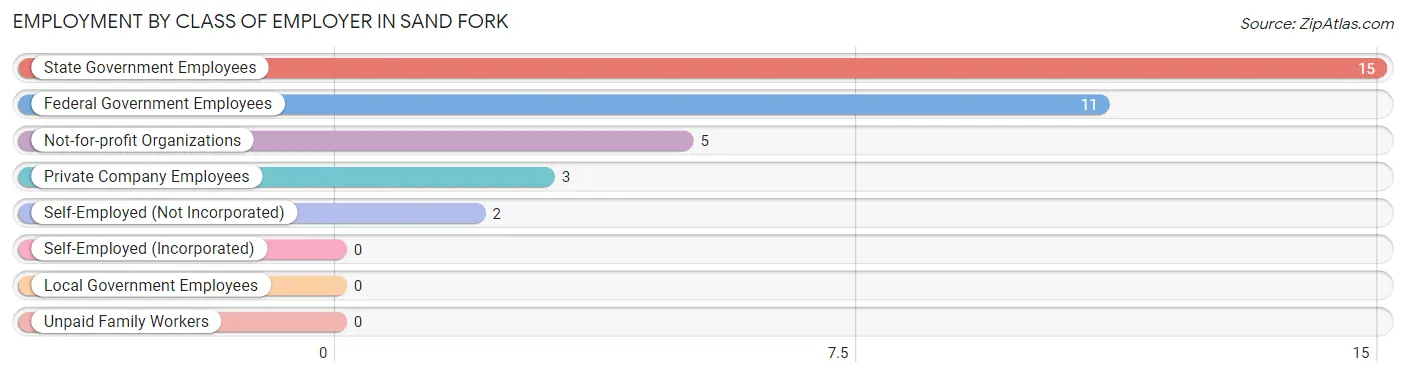
| Employer Class | # Employees | % Employees |
| Private Company Employees | 3 | 8.3% |
| Self-Employed (Incorporated) | 0 | 0.0% |
| Self-Employed (Not Incorporated) | 2 | 5.6% |
| Not-for-profit Organizations | 5 | 13.9% |
| Local Government Employees | 0 | 0.0% |
| State Government Employees | 15 | 41.7% |
| Federal Government Employees | 11 | 30.6% |
| Unpaid Family Workers | 0 | 0.0% |
| Total | 36 | 100.0% |
Employment Status by Age in Sand Fork
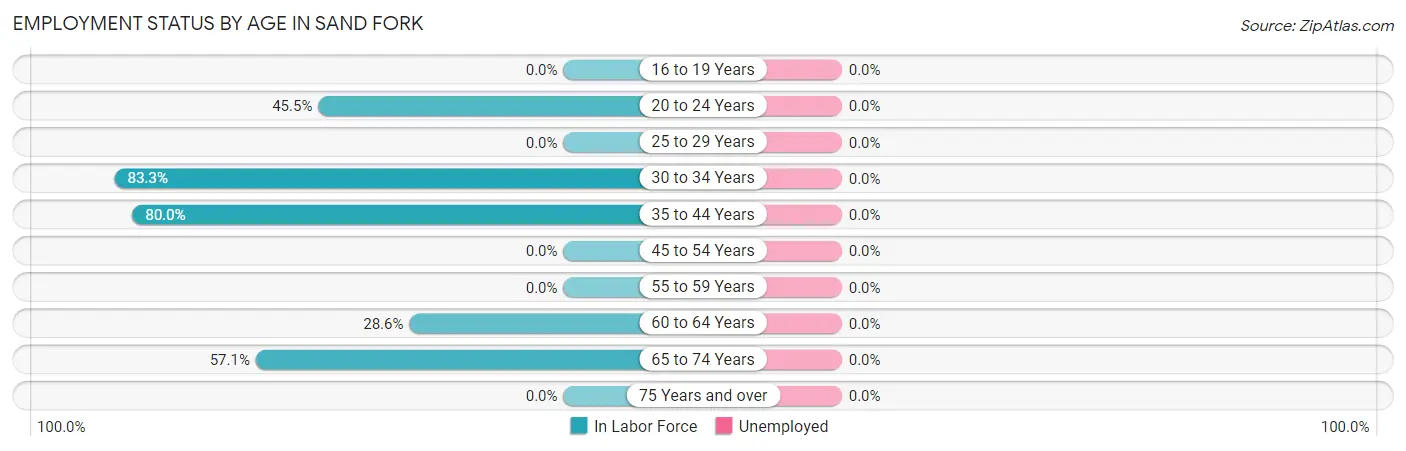
| Age Bracket | In Labor Force | Unemployed |
| 16 to 19 Years | 0 (0.0%) | 0 (0.0%) |
| 20 to 24 Years | 5 (45.5%) | 0 (0.0%) |
| 25 to 29 Years | 0 (0.0%) | 0 (0.0%) |
| 30 to 34 Years | 5 (83.3%) | 0 (0.0%) |
| 35 to 44 Years | 24 (80.0%) | 0 (0.0%) |
| 45 to 54 Years | 0 (0.0%) | 0 (0.0%) |
| 55 to 59 Years | 0 (0.0%) | 0 (0.0%) |
| 60 to 64 Years | 2 (28.6%) | 0 (0.0%) |
| 65 to 74 Years | 4 (57.1%) | 0 (0.0%) |
| 75 Years and over | 0 (0.0%) | 0 (0.0%) |
| Total | 40 (58.0%) | 0 (0.0%) |
Employment Status by Educational Attainment in Sand Fork
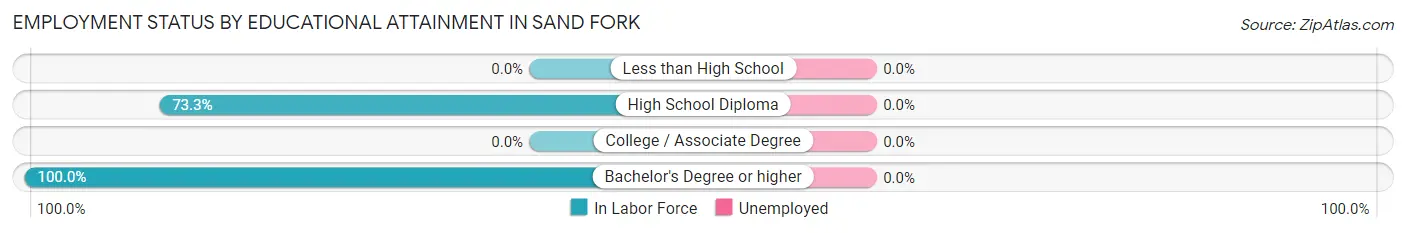
| Educational Attainment | In Labor Force | Unemployed |
| Less than High School | 0 (0.0%) | 0 (0.0%) |
| High School Diploma | 11 (73.3%) | 0 (0.0%) |
| College / Associate Degree | 0 (0.0%) | 0 (0.0%) |
| Bachelor's Degree or higher | 20 (100.0%) | 0 (0.0%) |
| Total | 31 (64.6%) | 0 (0.0%) |
Employment Occupations by Sex in Sand Fork
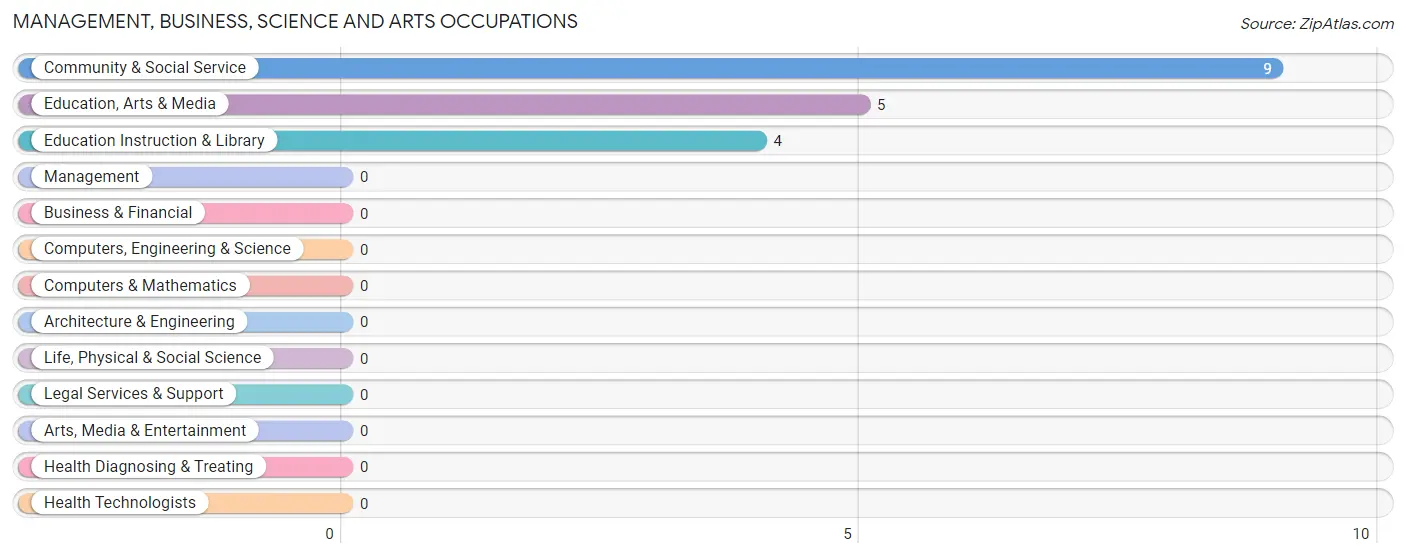
Management, Business, Science and Arts Occupations
The most common Management, Business, Science and Arts occupations in Sand Fork are Community & Social Service (9 | 22.5%), Education, Arts & Media (5 | 12.5%), and Education Instruction & Library (4 | 10.0%).
Management, Business, Science and Arts Occupations by Sex
Within the Management, Business, Science and Arts occupations in Sand Fork, the most male-oriented occupations are Education, Arts & Media (100.0%), and Community & Social Service (55.6%), while the most female-oriented occupations are Education Instruction & Library (100.0%), and Community & Social Service (44.4%).
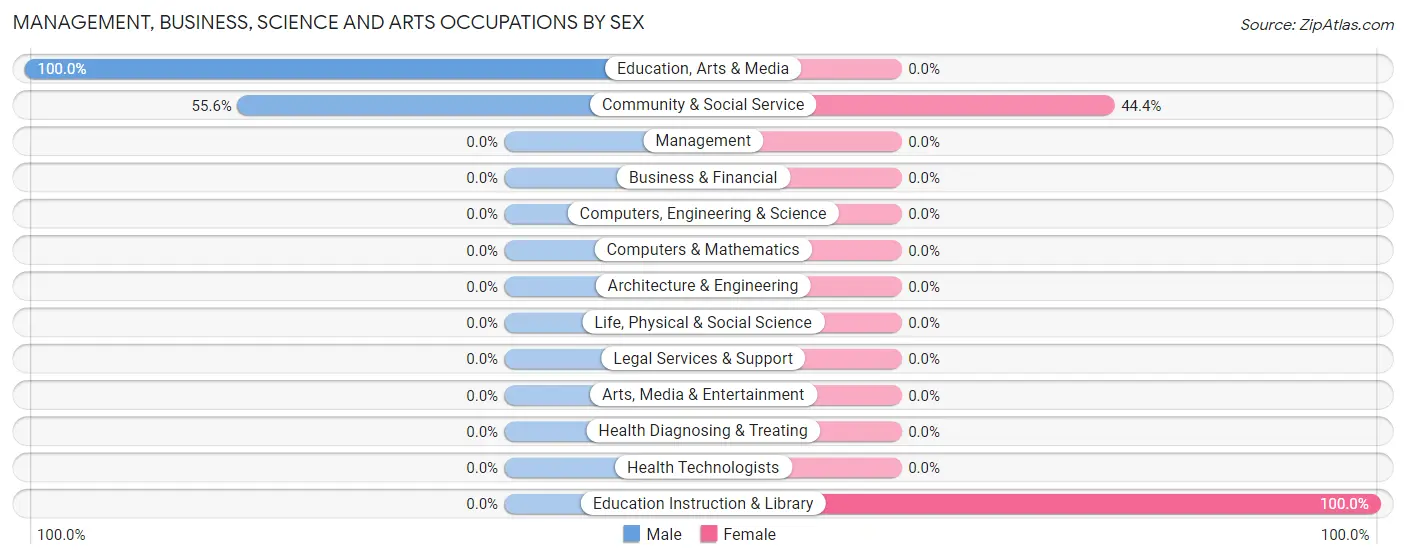
| Occupation | Male | Female |
| Management | 0 (0.0%) | 0 (0.0%) |
| Business & Financial | 0 (0.0%) | 0 (0.0%) |
| Computers, Engineering & Science | 0 (0.0%) | 0 (0.0%) |
| Computers & Mathematics | 0 (0.0%) | 0 (0.0%) |
| Architecture & Engineering | 0 (0.0%) | 0 (0.0%) |
| Life, Physical & Social Science | 0 (0.0%) | 0 (0.0%) |
| Community & Social Service | 5 (55.6%) | 4 (44.4%) |
| Education, Arts & Media | 5 (100.0%) | 0 (0.0%) |
| Legal Services & Support | 0 (0.0%) | 0 (0.0%) |
| Education Instruction & Library | 0 (0.0%) | 4 (100.0%) |
| Arts, Media & Entertainment | 0 (0.0%) | 0 (0.0%) |
| Health Diagnosing & Treating | 0 (0.0%) | 0 (0.0%) |
| Health Technologists | 0 (0.0%) | 0 (0.0%) |
| Total (Category) | 5 (55.6%) | 4 (44.4%) |
| Total (Overall) | 12 (30.0%) | 28 (70.0%) |
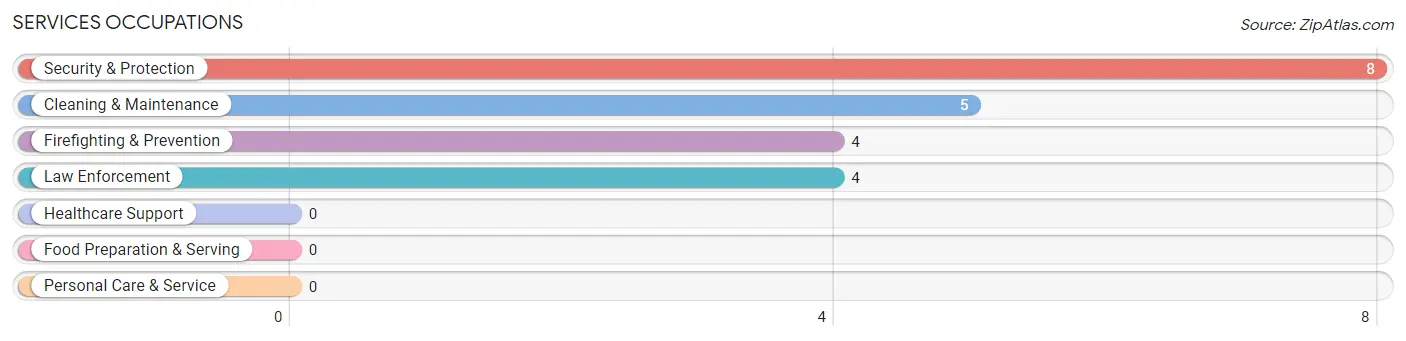
Services Occupations
The most common Services occupations in Sand Fork are Security & Protection (8 | 20.0%), Cleaning & Maintenance (5 | 12.5%), Firefighting & Prevention (4 | 10.0%), and Law Enforcement (4 | 10.0%).
Services Occupations by Sex
Within the Services occupations in Sand Fork, the most male-oriented occupations are Law Enforcement (100.0%), and Security & Protection (50.0%), while the most female-oriented occupations are Firefighting & Prevention (100.0%), Cleaning & Maintenance (100.0%), and Security & Protection (50.0%).
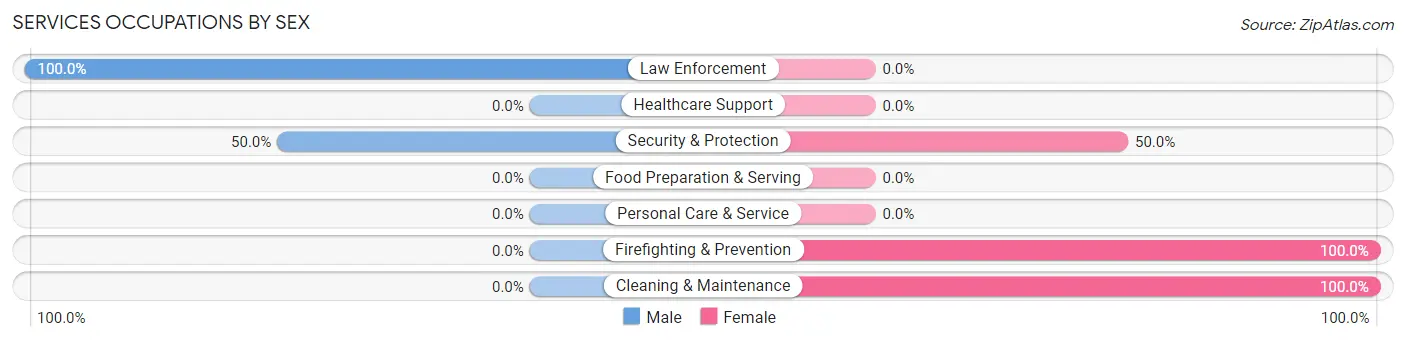
| Occupation | Male | Female |
| Healthcare Support | 0 (0.0%) | 0 (0.0%) |
| Security & Protection | 4 (50.0%) | 4 (50.0%) |
| Firefighting & Prevention | 0 (0.0%) | 4 (100.0%) |
| Law Enforcement | 4 (100.0%) | 0 (0.0%) |
| Food Preparation & Serving | 0 (0.0%) | 0 (0.0%) |
| Cleaning & Maintenance | 0 (0.0%) | 5 (100.0%) |
| Personal Care & Service | 0 (0.0%) | 0 (0.0%) |
| Total (Category) | 4 (30.8%) | 9 (69.2%) |
| Total (Overall) | 12 (30.0%) | 28 (70.0%) |
Sales and Office Occupations
The most common Sales and Office occupations in Sand Fork are Office & Administration (13 | 32.5%), and Sales & Related (2 | 5.0%).
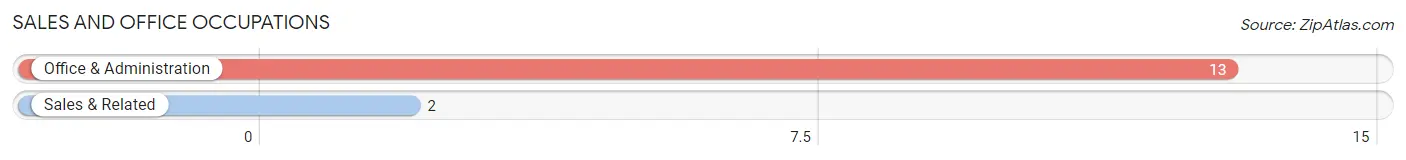
Sales and Office Occupations by Sex
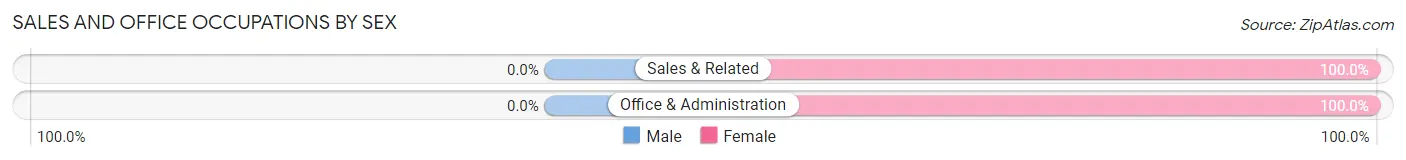
| Occupation | Male | Female |
| Sales & Related | 0 (0.0%) | 2 (100.0%) |
| Office & Administration | 0 (0.0%) | 13 (100.0%) |
| Total (Category) | 0 (0.0%) | 15 (100.0%) |
| Total (Overall) | 12 (30.0%) | 28 (70.0%) |
Natural Resources, Construction and Maintenance Occupations
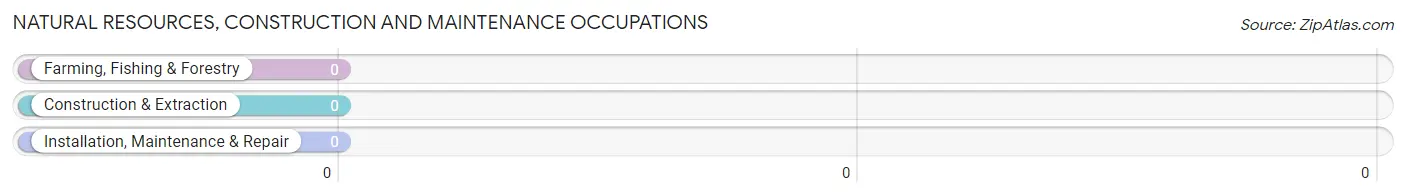
Natural Resources, Construction and Maintenance Occupations by Sex
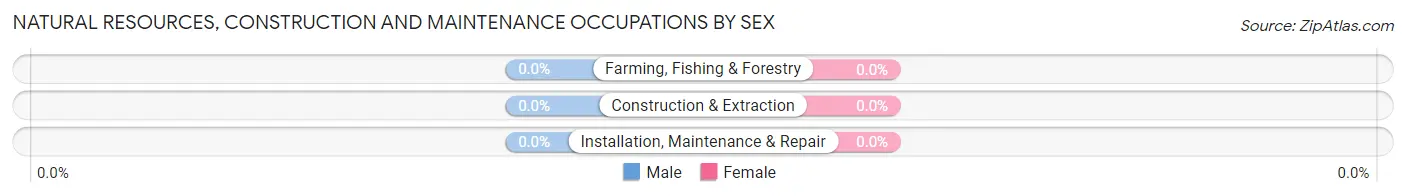
| Occupation | Male | Female |
| Farming, Fishing & Forestry | 0 (0.0%) | 0 (0.0%) |
| Construction & Extraction | 0 (0.0%) | 0 (0.0%) |
| Installation, Maintenance & Repair | 0 (0.0%) | 0 (0.0%) |
| Total (Category) | 0 (0.0%) | 0 (0.0%) |
| Total (Overall) | 12 (30.0%) | 28 (70.0%) |
Production, Transportation and Moving Occupations
The most common Production, Transportation and Moving occupations in Sand Fork are , and Production (3 | 7.5%).
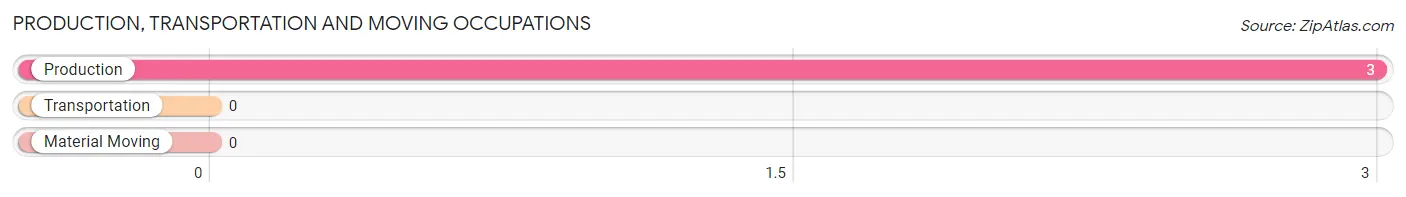
Production, Transportation and Moving Occupations by Sex
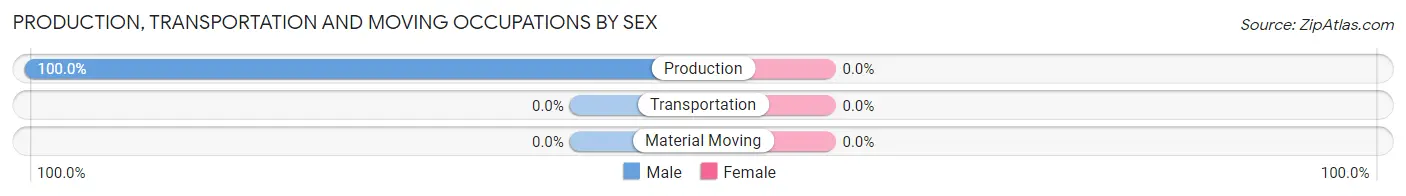
| Occupation | Male | Female |
| Production | 3 (100.0%) | 0 (0.0%) |
| Transportation | 0 (0.0%) | 0 (0.0%) |
| Material Moving | 0 (0.0%) | 0 (0.0%) |
| Total (Category) | 3 (100.0%) | 0 (0.0%) |
| Total (Overall) | 12 (30.0%) | 28 (70.0%) |
Employment Industries by Sex in Sand Fork
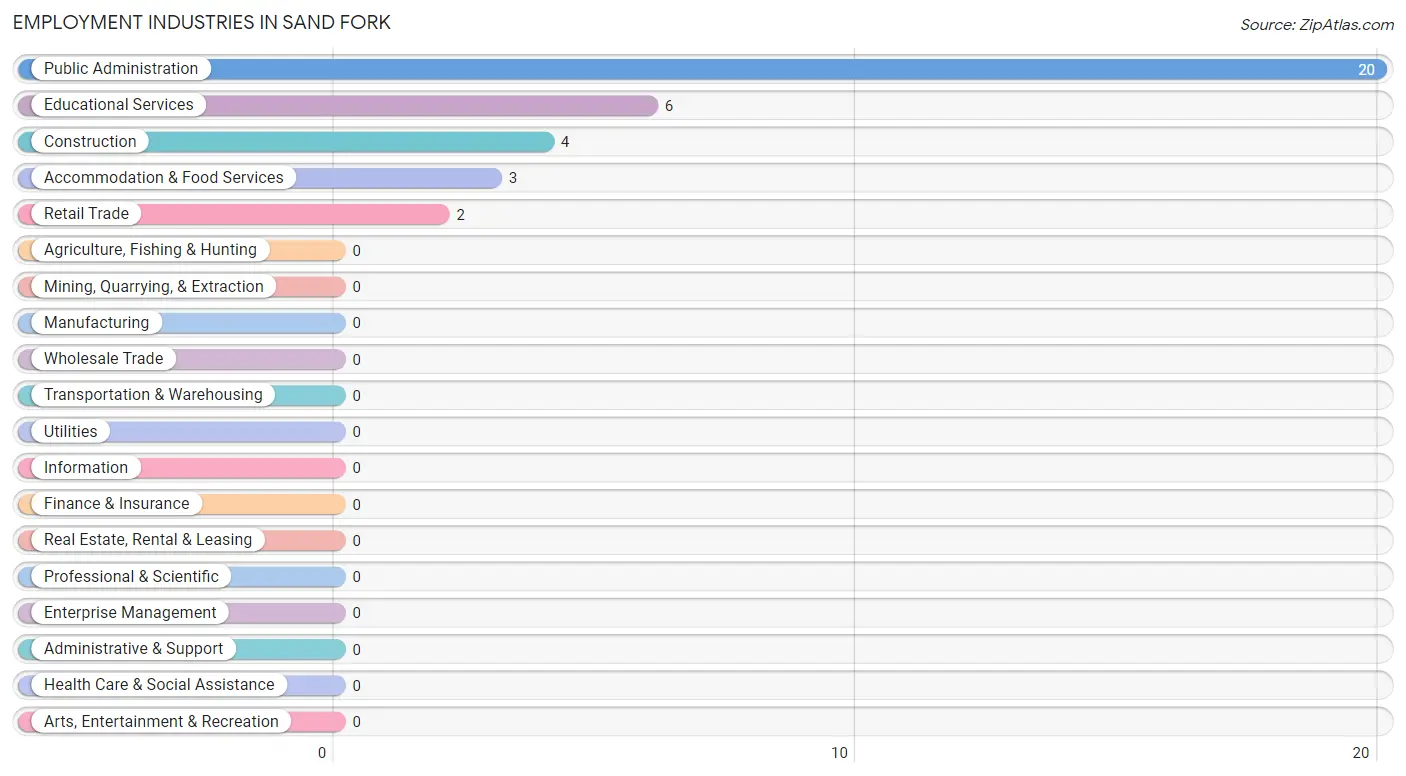
Employment Industries in Sand Fork
The major employment industries in Sand Fork include Public Administration (20 | 50.0%), Educational Services (6 | 15.0%), Construction (4 | 10.0%), Accommodation & Food Services (3 | 7.5%), and Retail Trade (2 | 5.0%).
Employment Industries by Sex in Sand Fork
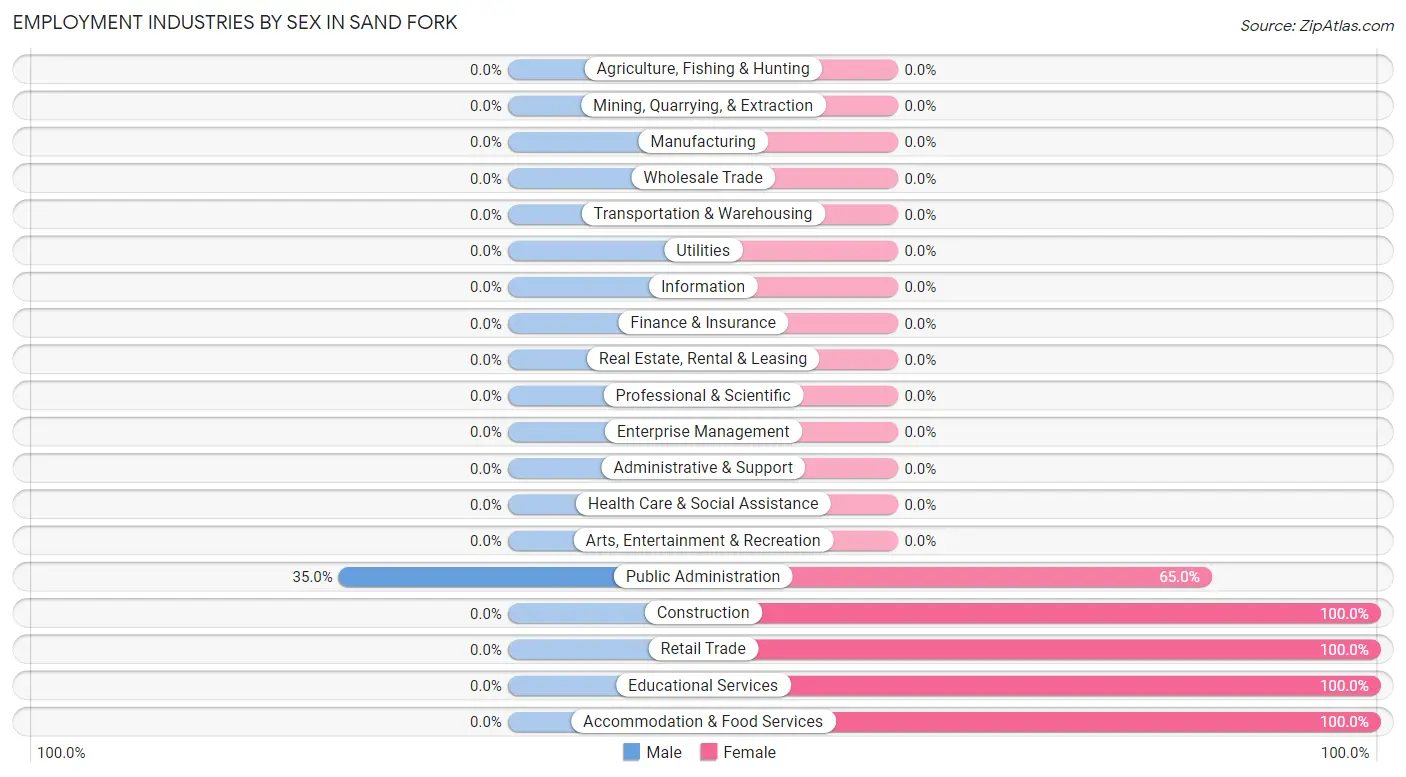
| Industry | Male | Female |
| Agriculture, Fishing & Hunting | 0 (0.0%) | 0 (0.0%) |
| Mining, Quarrying, & Extraction | 0 (0.0%) | 0 (0.0%) |
| Construction | 0 (0.0%) | 4 (100.0%) |
| Manufacturing | 0 (0.0%) | 0 (0.0%) |
| Wholesale Trade | 0 (0.0%) | 0 (0.0%) |
| Retail Trade | 0 (0.0%) | 2 (100.0%) |
| Transportation & Warehousing | 0 (0.0%) | 0 (0.0%) |
| Utilities | 0 (0.0%) | 0 (0.0%) |
| Information | 0 (0.0%) | 0 (0.0%) |
| Finance & Insurance | 0 (0.0%) | 0 (0.0%) |
| Real Estate, Rental & Leasing | 0 (0.0%) | 0 (0.0%) |
| Professional & Scientific | 0 (0.0%) | 0 (0.0%) |
| Enterprise Management | 0 (0.0%) | 0 (0.0%) |
| Administrative & Support | 0 (0.0%) | 0 (0.0%) |
| Educational Services | 0 (0.0%) | 6 (100.0%) |
| Health Care & Social Assistance | 0 (0.0%) | 0 (0.0%) |
| Arts, Entertainment & Recreation | 0 (0.0%) | 0 (0.0%) |
| Accommodation & Food Services | 0 (0.0%) | 3 (100.0%) |
| Public Administration | 7 (35.0%) | 13 (65.0%) |
| Total | 12 (30.0%) | 28 (70.0%) |
Education in Sand Fork
School Enrollment in Sand Fork
The most common levels of schooling among the 32 students in Sand Fork are elementary school (20 | 62.5%), middle school (5 | 15.6%), and graduate / professional (5 | 15.6%).
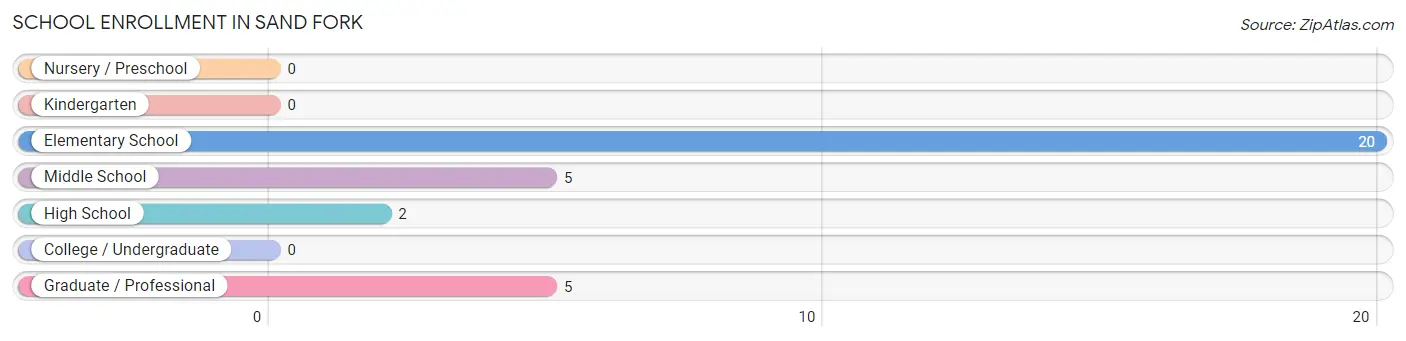
| School Level | # Students | % Students |
| Nursery / Preschool | 0 | 0.0% |
| Kindergarten | 0 | 0.0% |
| Elementary School | 20 | 62.5% |
| Middle School | 5 | 15.6% |
| High School | 2 | 6.2% |
| College / Undergraduate | 0 | 0.0% |
| Graduate / Professional | 5 | 15.6% |
| Total | 32 | 100.0% |
School Enrollment by Age by Funding Source in Sand Fork
Out of a total of 32 students who are enrolled in schools in Sand Fork, 2 (6.3%) attend a private institution, while the remaining 30 (93.7%) are enrolled in public schools. The age group of 10 to 14 year olds has the highest likelihood of being enrolled in private schools, with 2 (11.8% in the age bracket) enrolled. Conversely, the age group of 5 to 9 year old has the lowest likelihood of being enrolled in a private school, with 10 (100.0% in the age bracket) attending a public institution.
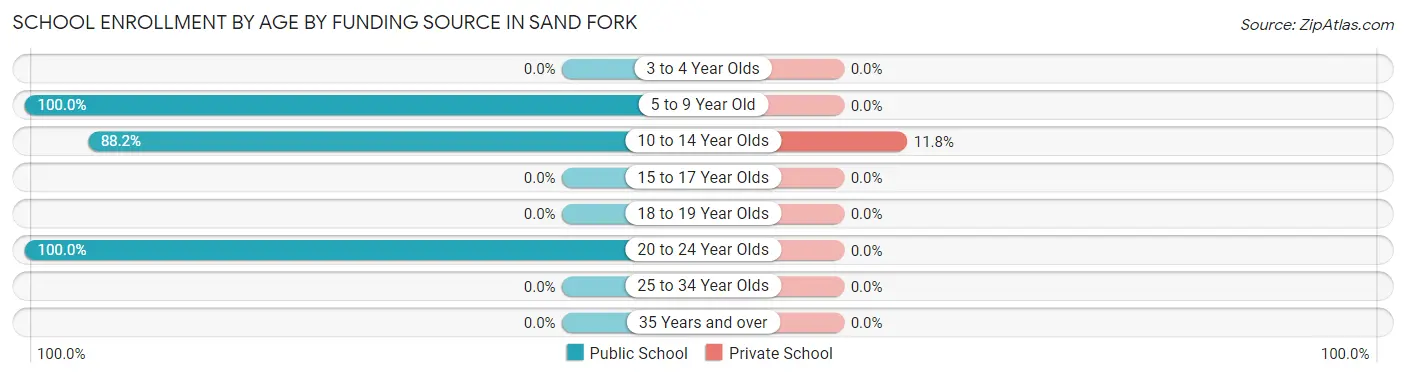
| Age Bracket | Public School | Private School |
| 3 to 4 Year Olds | 0 (0.0%) | 0 (0.0%) |
| 5 to 9 Year Old | 10 (100.0%) | 0 (0.0%) |
| 10 to 14 Year Olds | 15 (88.2%) | 2 (11.8%) |
| 15 to 17 Year Olds | 0 (0.0%) | 0 (0.0%) |
| 18 to 19 Year Olds | 0 (0.0%) | 0 (0.0%) |
| 20 to 24 Year Olds | 5 (100.0%) | 0 (0.0%) |
| 25 to 34 Year Olds | 0 (0.0%) | 0 (0.0%) |
| 35 Years and over | 0 (0.0%) | 0 (0.0%) |
| Total | 30 (93.8%) | 2 (6.3%) |
Educational Attainment by Field of Study in Sand Fork
Bio, nature & agricultural (17 | 70.8%), education (4 | 16.7%), and multidisciplinary studies (3 | 12.5%) are the most common fields of study among 24 individuals in Sand Fork who have obtained a bachelor's degree or higher.
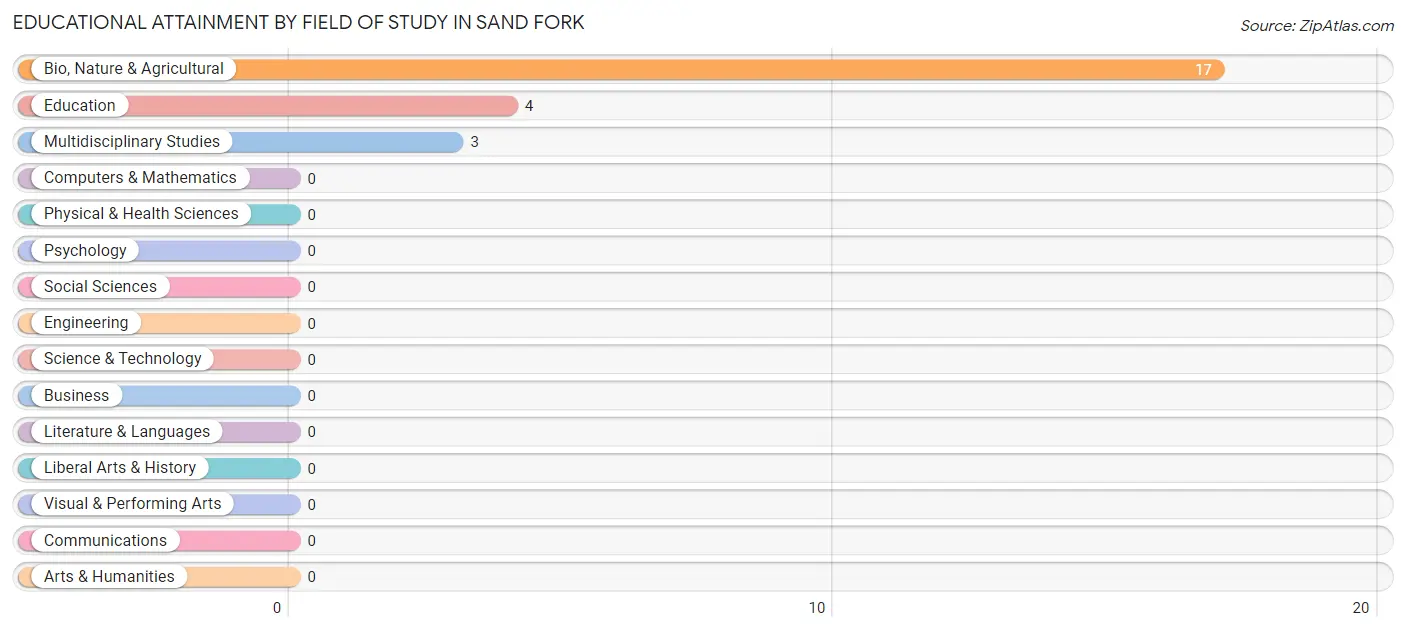
| Field of Study | # Graduates | % Graduates |
| Computers & Mathematics | 0 | 0.0% |
| Bio, Nature & Agricultural | 17 | 70.8% |
| Physical & Health Sciences | 0 | 0.0% |
| Psychology | 0 | 0.0% |
| Social Sciences | 0 | 0.0% |
| Engineering | 0 | 0.0% |
| Multidisciplinary Studies | 3 | 12.5% |
| Science & Technology | 0 | 0.0% |
| Business | 0 | 0.0% |
| Education | 4 | 16.7% |
| Literature & Languages | 0 | 0.0% |
| Liberal Arts & History | 0 | 0.0% |
| Visual & Performing Arts | 0 | 0.0% |
| Communications | 0 | 0.0% |
| Arts & Humanities | 0 | 0.0% |
| Total | 24 | 100.0% |
Transportation & Commute in Sand Fork
Vehicle Availability by Sex in Sand Fork
The most prevalent vehicle ownership categories in Sand Fork are males with 2 vehicles (9, accounting for 75.0%) and females with 2 vehicles (2, making up 37.5%).
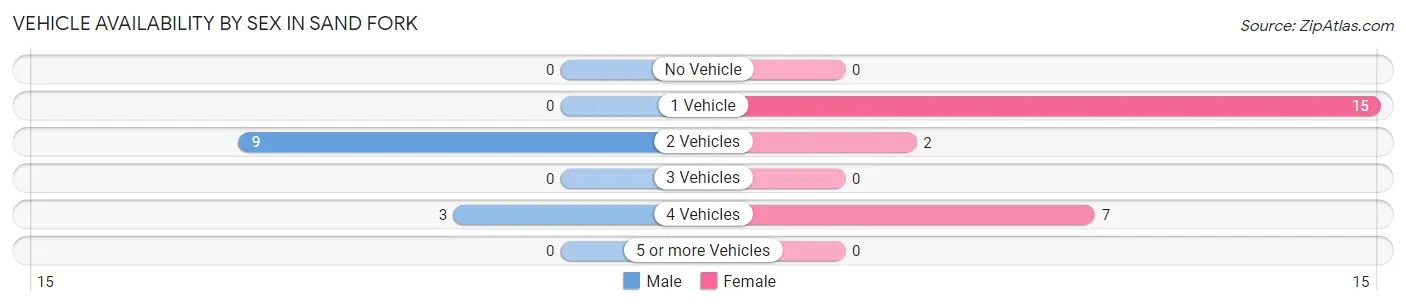
| Vehicles Available | Male | Female |
| No Vehicle | 0 (0.0%) | 0 (0.0%) |
| 1 Vehicle | 0 (0.0%) | 15 (62.5%) |
| 2 Vehicles | 9 (75.0%) | 2 (8.3%) |
| 3 Vehicles | 0 (0.0%) | 0 (0.0%) |
| 4 Vehicles | 3 (25.0%) | 7 (29.2%) |
| 5 or more Vehicles | 0 (0.0%) | 0 (0.0%) |
| Total | 12 (100.0%) | 24 (100.0%) |
Commute Time in Sand Fork
The most frequently occuring commute durations in Sand Fork are 5 to 9 minutes (6 commuters, 28.6%), less than 5 minutes (5 commuters, 23.8%), and 10 to 14 minutes (4 commuters, 19.1%).
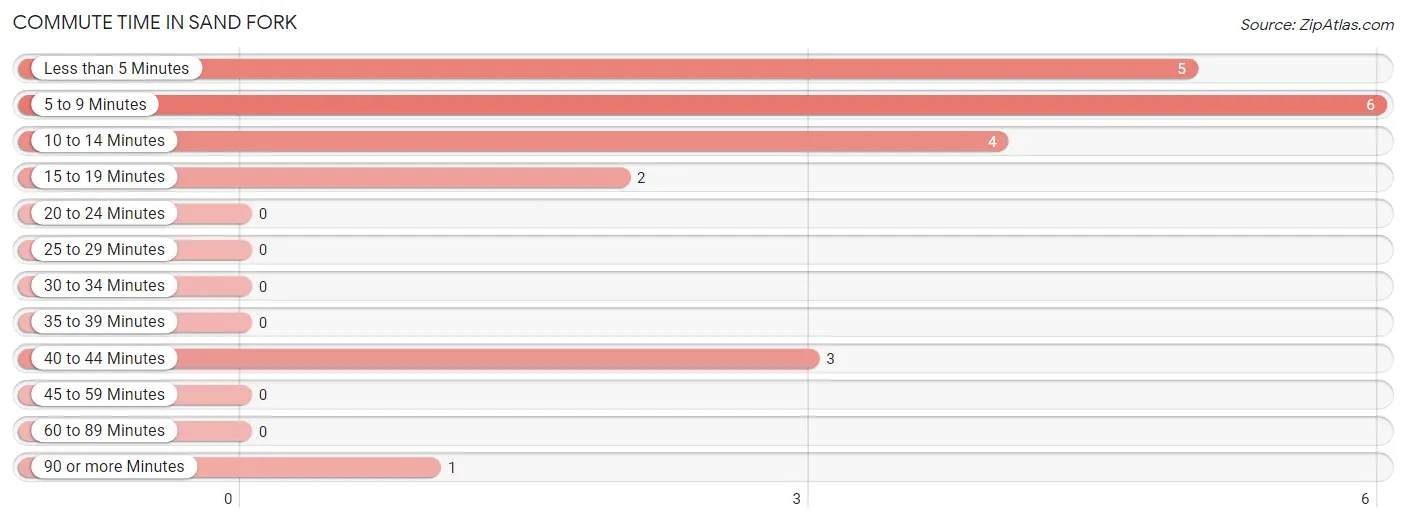
| Commute Time | # Commuters | % Commuters |
| Less than 5 Minutes | 5 | 23.8% |
| 5 to 9 Minutes | 6 | 28.6% |
| 10 to 14 Minutes | 4 | 19.1% |
| 15 to 19 Minutes | 2 | 9.5% |
| 20 to 24 Minutes | 0 | 0.0% |
| 25 to 29 Minutes | 0 | 0.0% |
| 30 to 34 Minutes | 0 | 0.0% |
| 35 to 39 Minutes | 0 | 0.0% |
| 40 to 44 Minutes | 3 | 14.3% |
| 45 to 59 Minutes | 0 | 0.0% |
| 60 to 89 Minutes | 0 | 0.0% |
| 90 or more Minutes | 1 | 4.8% |
Commute Time by Sex in Sand Fork
The most common commute times in Sand Fork are 5 to 9 minutes (6 commuters, 50.0%) for males and 10 to 14 minutes (4 commuters, 44.4%) for females.
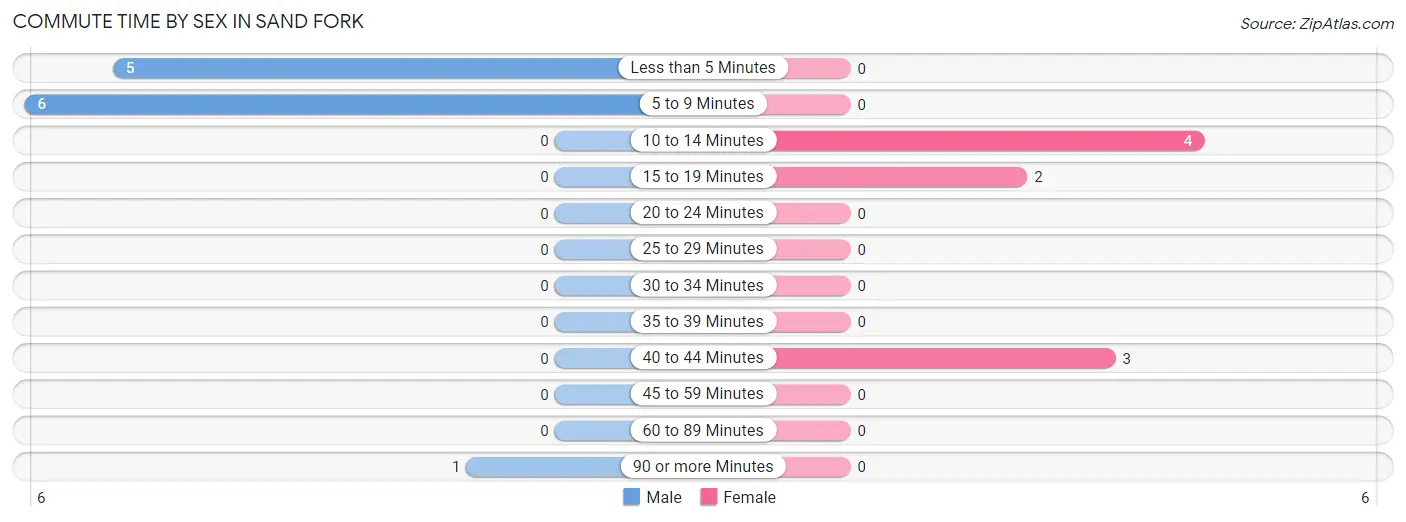
| Commute Time | Male | Female |
| Less than 5 Minutes | 5 (41.7%) | 0 (0.0%) |
| 5 to 9 Minutes | 6 (50.0%) | 0 (0.0%) |
| 10 to 14 Minutes | 0 (0.0%) | 4 (44.4%) |
| 15 to 19 Minutes | 0 (0.0%) | 2 (22.2%) |
| 20 to 24 Minutes | 0 (0.0%) | 0 (0.0%) |
| 25 to 29 Minutes | 0 (0.0%) | 0 (0.0%) |
| 30 to 34 Minutes | 0 (0.0%) | 0 (0.0%) |
| 35 to 39 Minutes | 0 (0.0%) | 0 (0.0%) |
| 40 to 44 Minutes | 0 (0.0%) | 3 (33.3%) |
| 45 to 59 Minutes | 0 (0.0%) | 0 (0.0%) |
| 60 to 89 Minutes | 0 (0.0%) | 0 (0.0%) |
| 90 or more Minutes | 1 (8.3%) | 0 (0.0%) |
Time of Departure to Work by Sex in Sand Fork
The most frequent times of departure to work in Sand Fork are 12:00 AM to 4:59 AM (5, 41.7%) for males and 7:00 AM to 7:29 AM (7, 77.8%) for females.
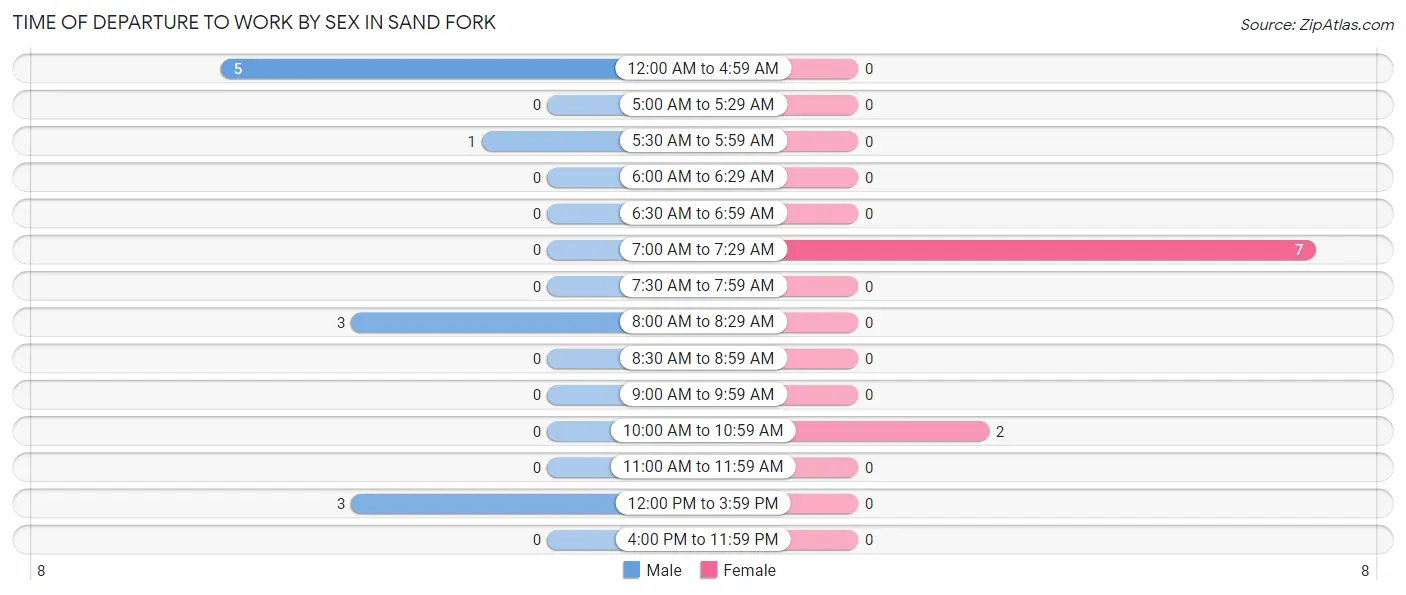
| Time of Departure | Male | Female |
| 12:00 AM to 4:59 AM | 5 (41.7%) | 0 (0.0%) |
| 5:00 AM to 5:29 AM | 0 (0.0%) | 0 (0.0%) |
| 5:30 AM to 5:59 AM | 1 (8.3%) | 0 (0.0%) |
| 6:00 AM to 6:29 AM | 0 (0.0%) | 0 (0.0%) |
| 6:30 AM to 6:59 AM | 0 (0.0%) | 0 (0.0%) |
| 7:00 AM to 7:29 AM | 0 (0.0%) | 7 (77.8%) |
| 7:30 AM to 7:59 AM | 0 (0.0%) | 0 (0.0%) |
| 8:00 AM to 8:29 AM | 3 (25.0%) | 0 (0.0%) |
| 8:30 AM to 8:59 AM | 0 (0.0%) | 0 (0.0%) |
| 9:00 AM to 9:59 AM | 0 (0.0%) | 0 (0.0%) |
| 10:00 AM to 10:59 AM | 0 (0.0%) | 2 (22.2%) |
| 11:00 AM to 11:59 AM | 0 (0.0%) | 0 (0.0%) |
| 12:00 PM to 3:59 PM | 3 (25.0%) | 0 (0.0%) |
| 4:00 PM to 11:59 PM | 0 (0.0%) | 0 (0.0%) |
| Total | 12 (100.0%) | 9 (100.0%) |
Housing Occupancy in Sand Fork
Occupancy by Ownership in Sand Fork
Of the total 36 dwellings in Sand Fork, owner-occupied units account for 31 (86.1%), while renter-occupied units make up 5 (13.9%).
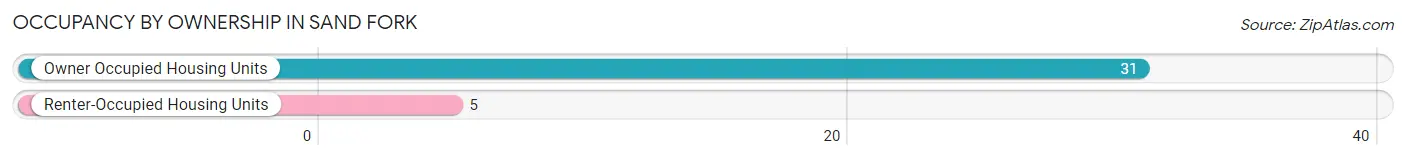
| Occupancy | # Housing Units | % Housing Units |
| Owner Occupied Housing Units | 31 | 86.1% |
| Renter-Occupied Housing Units | 5 | 13.9% |
| Total Occupied Housing Units | 36 | 100.0% |
Occupancy by Household Size in Sand Fork
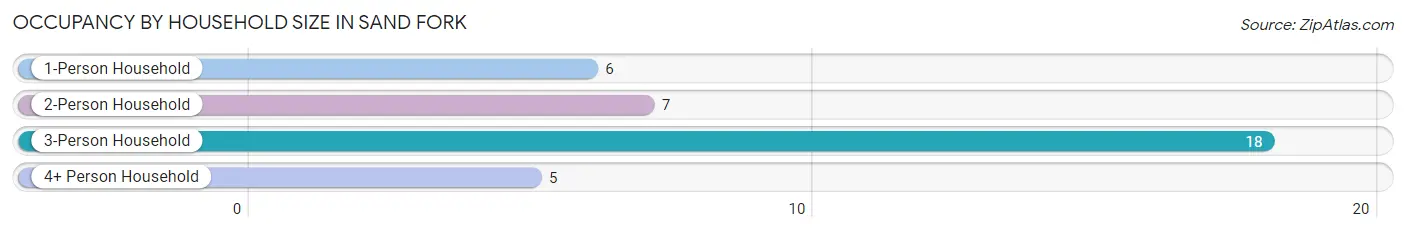
| Household Size | # Housing Units | % Housing Units |
| 1-Person Household | 6 | 16.7% |
| 2-Person Household | 7 | 19.4% |
| 3-Person Household | 18 | 50.0% |
| 4+ Person Household | 5 | 13.9% |
| Total Housing Units | 36 | 100.0% |
Occupancy by Ownership by Household Size in Sand Fork
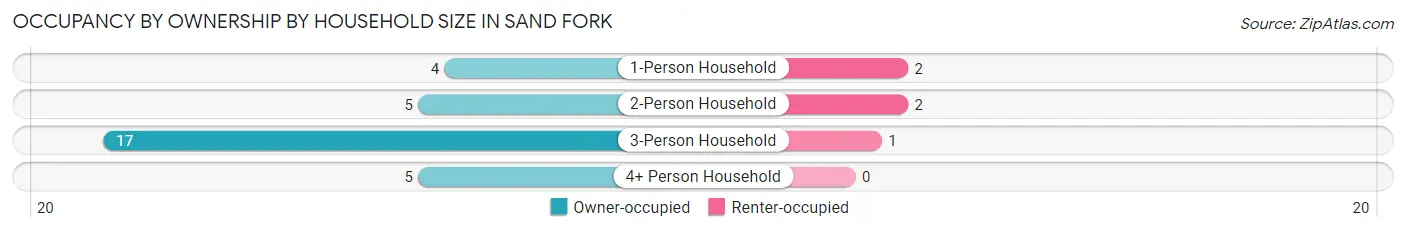
| Household Size | Owner-occupied | Renter-occupied |
| 1-Person Household | 4 (66.7%) | 2 (33.3%) |
| 2-Person Household | 5 (71.4%) | 2 (28.6%) |
| 3-Person Household | 17 (94.4%) | 1 (5.6%) |
| 4+ Person Household | 5 (100.0%) | 0 (0.0%) |
| Total Housing Units | 31 (86.1%) | 5 (13.9%) |
Occupancy by Educational Attainment in Sand Fork
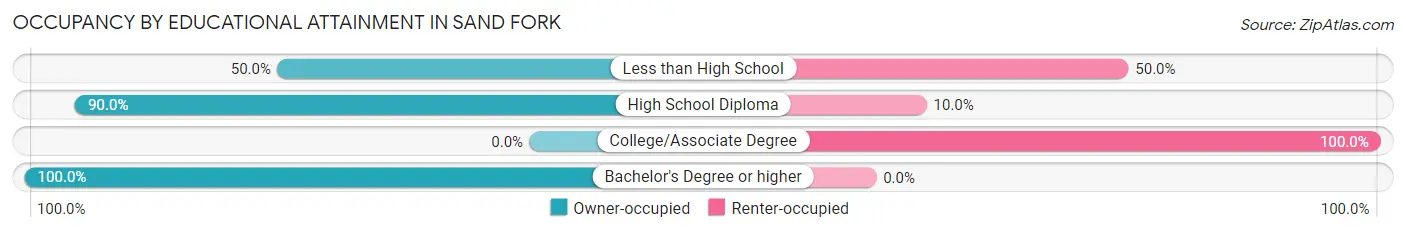
| Household Size | Owner-occupied | Renter-occupied |
| Less than High School | 2 (50.0%) | 2 (50.0%) |
| High School Diploma | 9 (90.0%) | 1 (10.0%) |
| College/Associate Degree | 0 (0.0%) | 2 (100.0%) |
| Bachelor's Degree or higher | 20 (100.0%) | 0 (0.0%) |
Occupancy by Age of Householder in Sand Fork
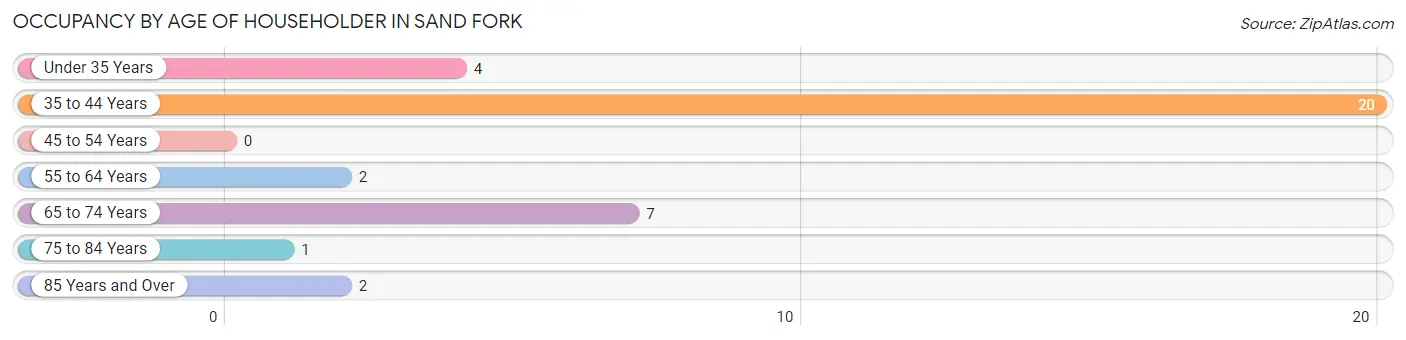
| Age Bracket | # Households | % Households |
| Under 35 Years | 4 | 11.1% |
| 35 to 44 Years | 20 | 55.6% |
| 45 to 54 Years | 0 | 0.0% |
| 55 to 64 Years | 2 | 5.6% |
| 65 to 74 Years | 7 | 19.4% |
| 75 to 84 Years | 1 | 2.8% |
| 85 Years and Over | 2 | 5.6% |
| Total | 36 | 100.0% |
Housing Finances in Sand Fork
Median Income by Occupancy in Sand Fork
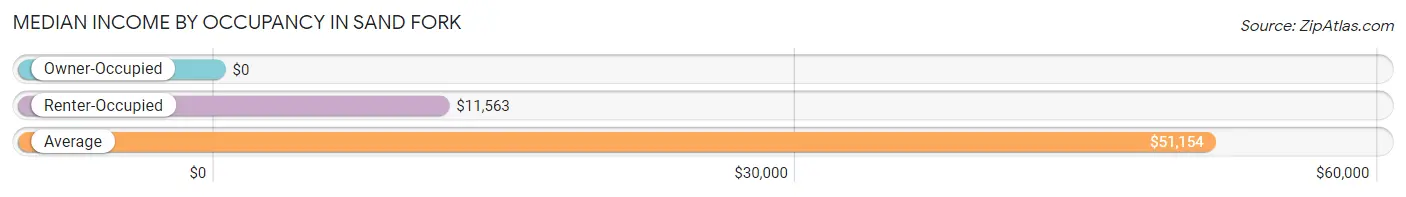
| Occupancy Type | # Households | Median Income |
| Owner-Occupied | 31 (86.1%) | $0 |
| Renter-Occupied | 5 (13.9%) | $11,563 |
| Average | 36 (100.0%) | $51,154 |
Occupancy by Householder Income Bracket in Sand Fork
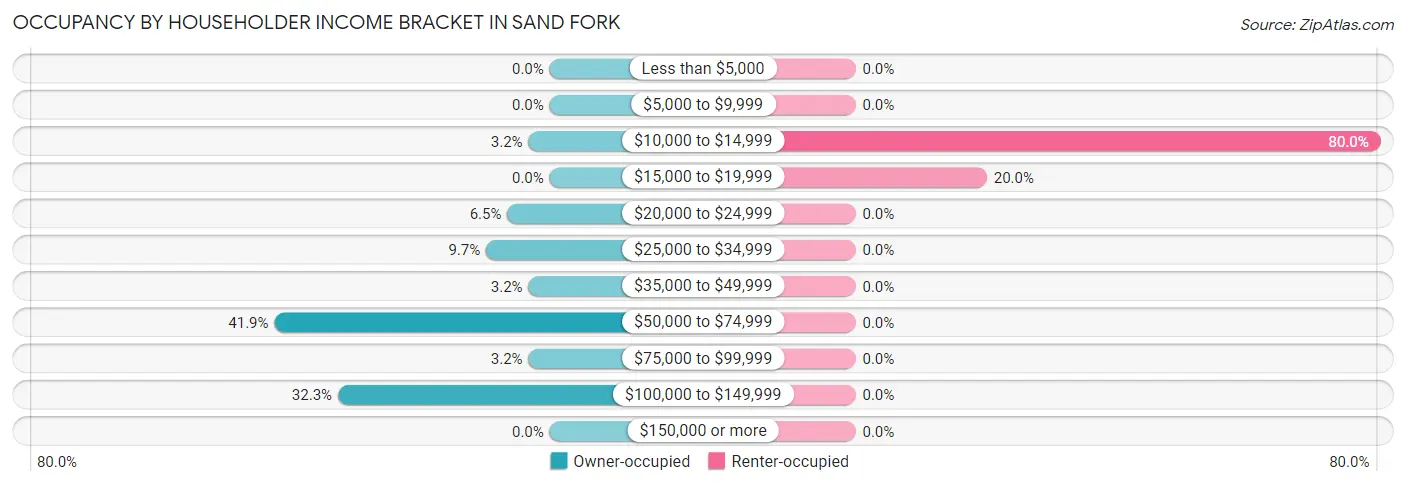
| Income Bracket | Owner-occupied | Renter-occupied |
| Less than $5,000 | 0 (0.0%) | 0 (0.0%) |
| $5,000 to $9,999 | 0 (0.0%) | 0 (0.0%) |
| $10,000 to $14,999 | 1 (3.2%) | 4 (80.0%) |
| $15,000 to $19,999 | 0 (0.0%) | 1 (20.0%) |
| $20,000 to $24,999 | 2 (6.5%) | 0 (0.0%) |
| $25,000 to $34,999 | 3 (9.7%) | 0 (0.0%) |
| $35,000 to $49,999 | 1 (3.2%) | 0 (0.0%) |
| $50,000 to $74,999 | 13 (41.9%) | 0 (0.0%) |
| $75,000 to $99,999 | 1 (3.2%) | 0 (0.0%) |
| $100,000 to $149,999 | 10 (32.3%) | 0 (0.0%) |
| $150,000 or more | 0 (0.0%) | 0 (0.0%) |
| Total | 31 (100.0%) | 5 (100.0%) |
Monthly Housing Cost Tiers in Sand Fork
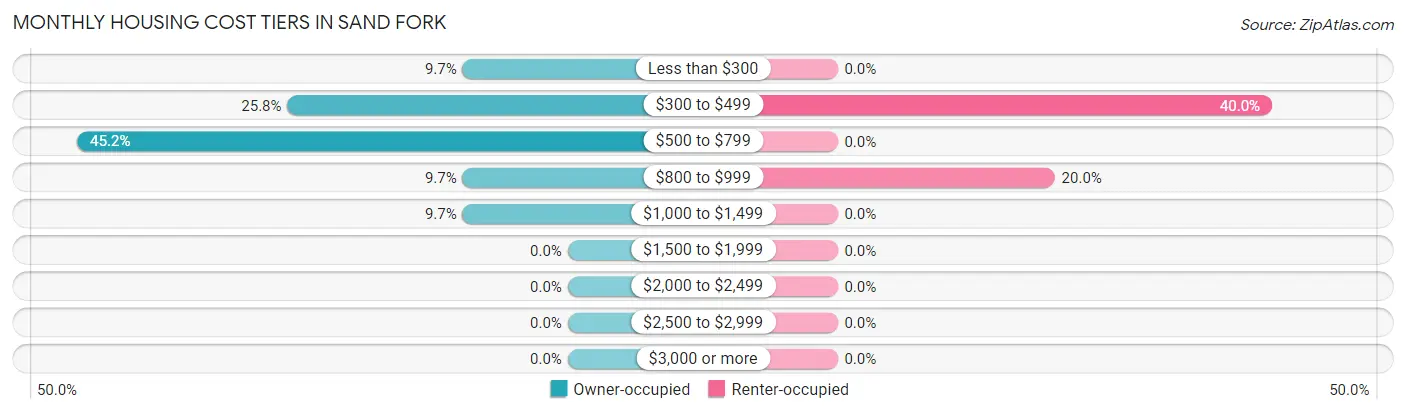
| Monthly Cost | Owner-occupied | Renter-occupied |
| Less than $300 | 3 (9.7%) | 0 (0.0%) |
| $300 to $499 | 8 (25.8%) | 2 (40.0%) |
| $500 to $799 | 14 (45.2%) | 0 (0.0%) |
| $800 to $999 | 3 (9.7%) | 1 (20.0%) |
| $1,000 to $1,499 | 3 (9.7%) | 0 (0.0%) |
| $1,500 to $1,999 | 0 (0.0%) | 0 (0.0%) |
| $2,000 to $2,499 | 0 (0.0%) | 0 (0.0%) |
| $2,500 to $2,999 | 0 (0.0%) | 0 (0.0%) |
| $3,000 or more | 0 (0.0%) | 0 (0.0%) |
| Total | 31 (100.0%) | 5 (100.0%) |
Physical Housing Characteristics in Sand Fork
Housing Structures in Sand Fork
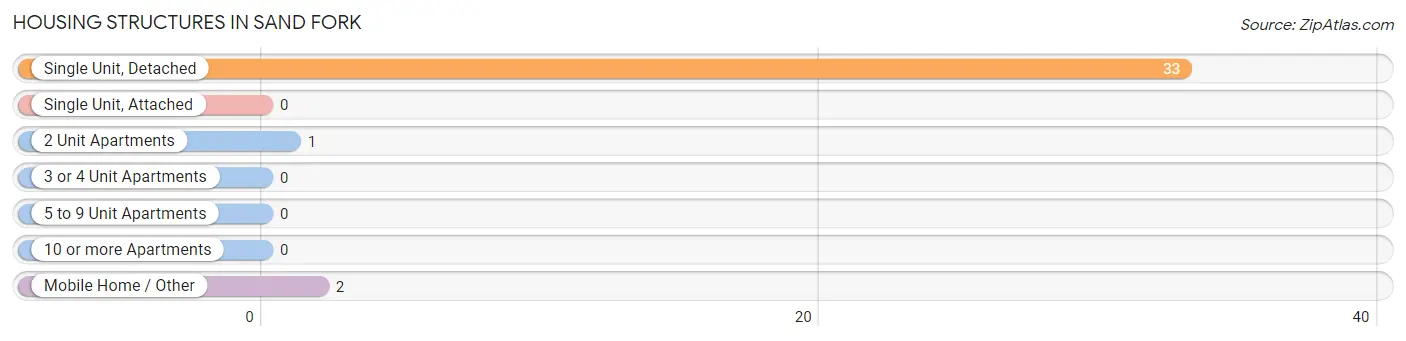
| Structure Type | # Housing Units | % Housing Units |
| Single Unit, Detached | 33 | 91.7% |
| Single Unit, Attached | 0 | 0.0% |
| 2 Unit Apartments | 1 | 2.8% |
| 3 or 4 Unit Apartments | 0 | 0.0% |
| 5 to 9 Unit Apartments | 0 | 0.0% |
| 10 or more Apartments | 0 | 0.0% |
| Mobile Home / Other | 2 | 5.6% |
| Total | 36 | 100.0% |
Housing Structures by Occupancy in Sand Fork
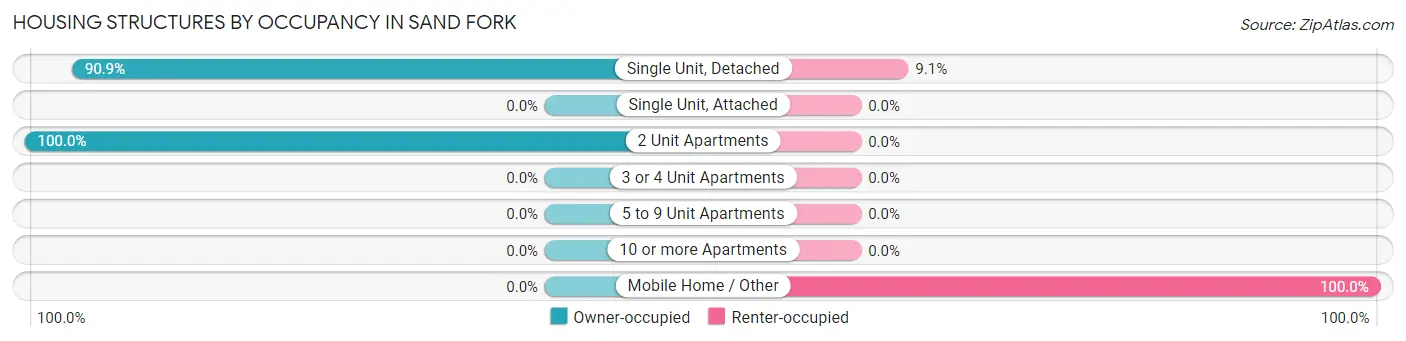
| Structure Type | Owner-occupied | Renter-occupied |
| Single Unit, Detached | 30 (90.9%) | 3 (9.1%) |
| Single Unit, Attached | 0 (0.0%) | 0 (0.0%) |
| 2 Unit Apartments | 1 (100.0%) | 0 (0.0%) |
| 3 or 4 Unit Apartments | 0 (0.0%) | 0 (0.0%) |
| 5 to 9 Unit Apartments | 0 (0.0%) | 0 (0.0%) |
| 10 or more Apartments | 0 (0.0%) | 0 (0.0%) |
| Mobile Home / Other | 0 (0.0%) | 2 (100.0%) |
| Total | 31 (86.1%) | 5 (13.9%) |
Housing Structures by Number of Rooms in Sand Fork
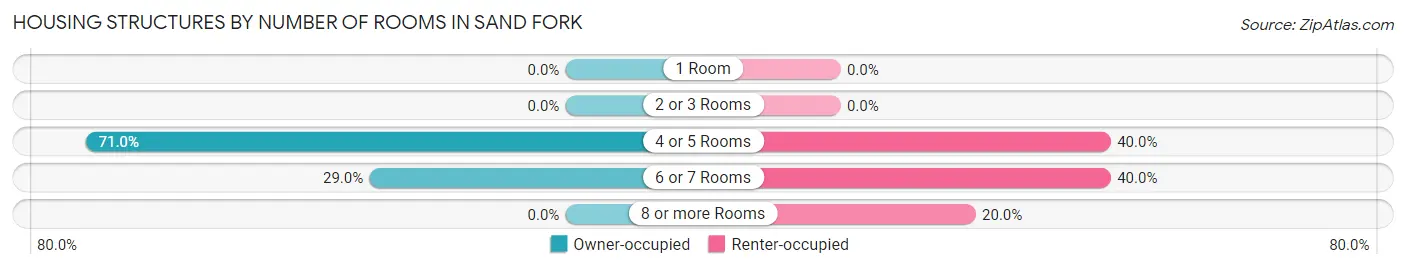
| Number of Rooms | Owner-occupied | Renter-occupied |
| 1 Room | 0 (0.0%) | 0 (0.0%) |
| 2 or 3 Rooms | 0 (0.0%) | 0 (0.0%) |
| 4 or 5 Rooms | 22 (71.0%) | 2 (40.0%) |
| 6 or 7 Rooms | 9 (29.0%) | 2 (40.0%) |
| 8 or more Rooms | 0 (0.0%) | 1 (20.0%) |
| Total | 31 (100.0%) | 5 (100.0%) |
Housing Structure by Heating Type in Sand Fork
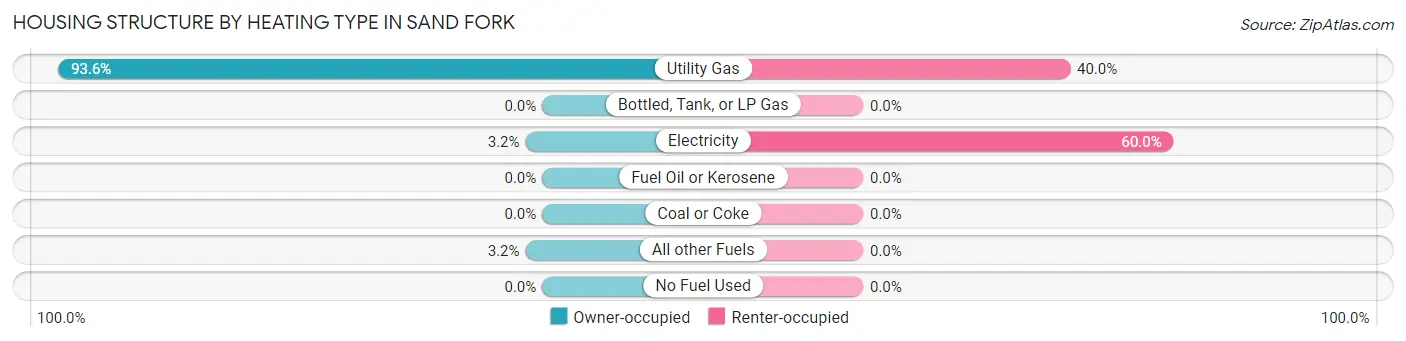
| Heating Type | Owner-occupied | Renter-occupied |
| Utility Gas | 29 (93.5%) | 2 (40.0%) |
| Bottled, Tank, or LP Gas | 0 (0.0%) | 0 (0.0%) |
| Electricity | 1 (3.2%) | 3 (60.0%) |
| Fuel Oil or Kerosene | 0 (0.0%) | 0 (0.0%) |
| Coal or Coke | 0 (0.0%) | 0 (0.0%) |
| All other Fuels | 1 (3.2%) | 0 (0.0%) |
| No Fuel Used | 0 (0.0%) | 0 (0.0%) |
| Total | 31 (100.0%) | 5 (100.0%) |
Household Vehicle Usage in Sand Fork
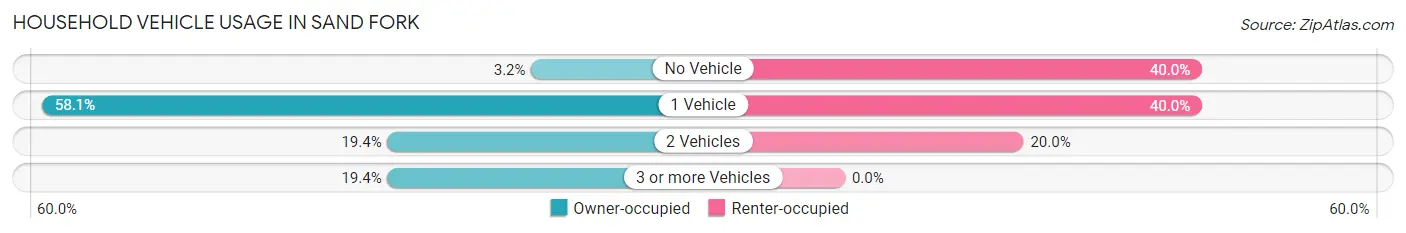
| Vehicles per Household | Owner-occupied | Renter-occupied |
| No Vehicle | 1 (3.2%) | 2 (40.0%) |
| 1 Vehicle | 18 (58.1%) | 2 (40.0%) |
| 2 Vehicles | 6 (19.4%) | 1 (20.0%) |
| 3 or more Vehicles | 6 (19.4%) | 0 (0.0%) |
| Total | 31 (100.0%) | 5 (100.0%) |
Real Estate & Mortgages in Sand Fork
Real Estate and Mortgage Overview in Sand Fork
| Characteristic | Without Mortgage | With Mortgage |
| Housing Units | 24 | 7 |
| Median Property Value | $178,800 | $103,100 |
| Median Household Income | $50,962 | $0 |
| Monthly Housing Costs | $708 | $0 |
| Real Estate Taxes | - | - |
Property Value by Mortgage Status in Sand Fork
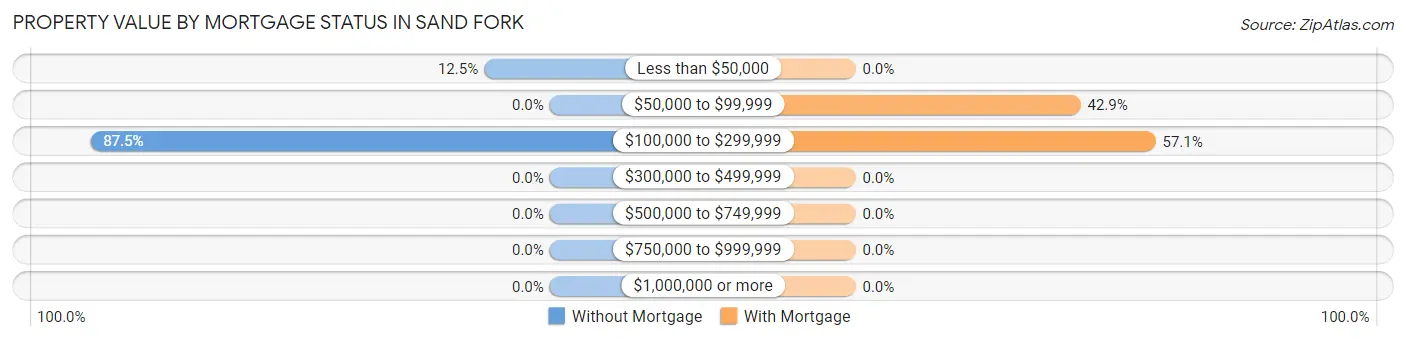
| Property Value | Without Mortgage | With Mortgage |
| Less than $50,000 | 3 (12.5%) | 0 (0.0%) |
| $50,000 to $99,999 | 0 (0.0%) | 3 (42.9%) |
| $100,000 to $299,999 | 21 (87.5%) | 4 (57.1%) |
| $300,000 to $499,999 | 0 (0.0%) | 0 (0.0%) |
| $500,000 to $749,999 | 0 (0.0%) | 0 (0.0%) |
| $750,000 to $999,999 | 0 (0.0%) | 0 (0.0%) |
| $1,000,000 or more | 0 (0.0%) | 0 (0.0%) |
| Total | 24 (100.0%) | 7 (100.0%) |
Household Income by Mortgage Status in Sand Fork
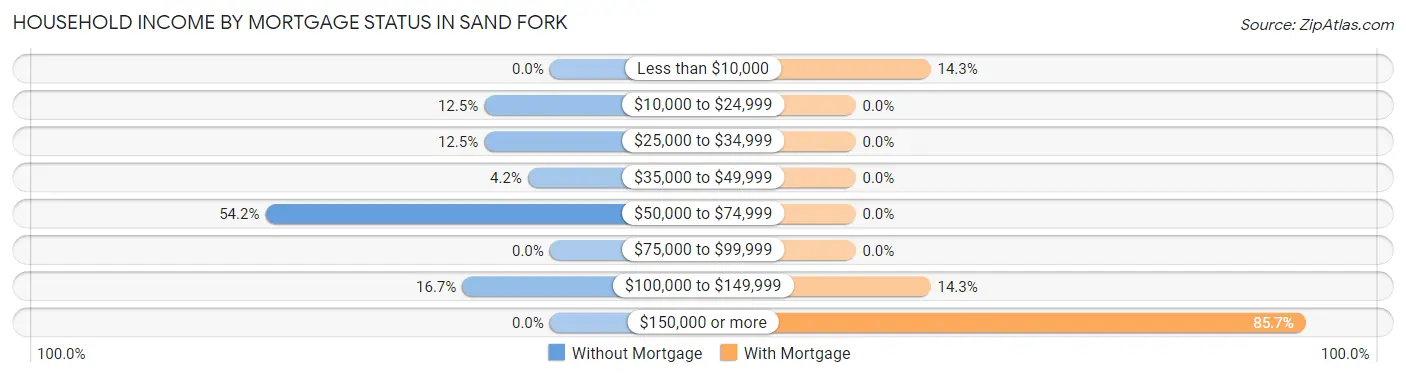
| Household Income | Without Mortgage | With Mortgage |
| Less than $10,000 | 0 (0.0%) | 1 (14.3%) |
| $10,000 to $24,999 | 3 (12.5%) | 0 (0.0%) |
| $25,000 to $34,999 | 3 (12.5%) | 0 (0.0%) |
| $35,000 to $49,999 | 1 (4.2%) | 0 (0.0%) |
| $50,000 to $74,999 | 13 (54.2%) | 0 (0.0%) |
| $75,000 to $99,999 | 0 (0.0%) | 0 (0.0%) |
| $100,000 to $149,999 | 4 (16.7%) | 1 (14.3%) |
| $150,000 or more | 0 (0.0%) | 6 (85.7%) |
| Total | 24 (100.0%) | 7 (100.0%) |
Property Value to Household Income Ratio in Sand Fork
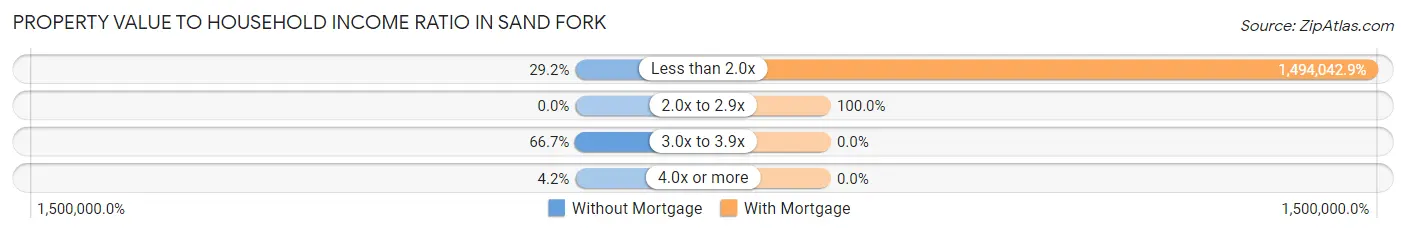
| Value-to-Income Ratio | Without Mortgage | With Mortgage |
| Less than 2.0x | 7 (29.2%) | 104,583 (1,494,042.9%) |
| 2.0x to 2.9x | 0 (0.0%) | 7 (100.0%) |
| 3.0x to 3.9x | 16 (66.7%) | 0 (0.0%) |
| 4.0x or more | 1 (4.2%) | 0 (0.0%) |
| Total | 24 (100.0%) | 7 (100.0%) |
Real Estate Taxes by Mortgage Status in Sand Fork
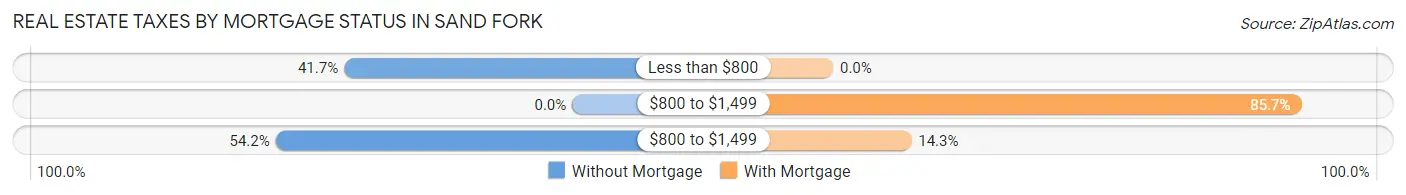
| Property Taxes | Without Mortgage | With Mortgage |
| Less than $800 | 10 (41.7%) | 0 (0.0%) |
| $800 to $1,499 | 0 (0.0%) | 6 (85.7%) |
| $800 to $1,499 | 13 (54.2%) | 1 (14.3%) |
| Total | 24 (100.0%) | 7 (100.0%) |
Health & Disability in Sand Fork
Health Insurance Coverage by Age in Sand Fork
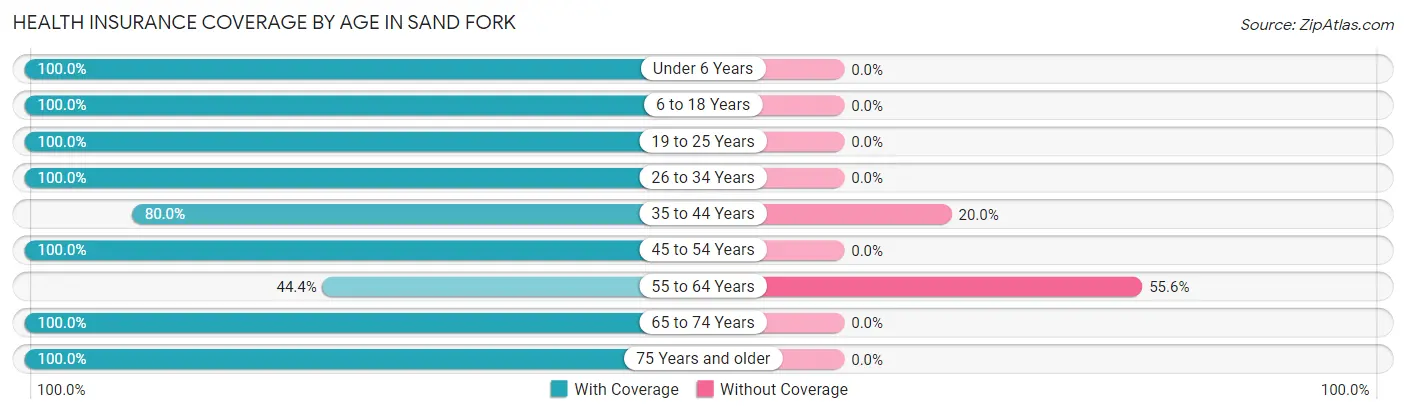
| Age Bracket | With Coverage | Without Coverage |
| Under 6 Years | 12 (100.0%) | 0 (0.0%) |
| 6 to 18 Years | 31 (100.0%) | 0 (0.0%) |
| 19 to 25 Years | 11 (100.0%) | 0 (0.0%) |
| 26 to 34 Years | 6 (100.0%) | 0 (0.0%) |
| 35 to 44 Years | 24 (80.0%) | 6 (20.0%) |
| 45 to 54 Years | 3 (100.0%) | 0 (0.0%) |
| 55 to 64 Years | 4 (44.4%) | 5 (55.6%) |
| 65 to 74 Years | 7 (100.0%) | 0 (0.0%) |
| 75 Years and older | 3 (100.0%) | 0 (0.0%) |
| Total | 101 (90.2%) | 11 (9.8%) |
Health Insurance Coverage by Citizenship Status in Sand Fork
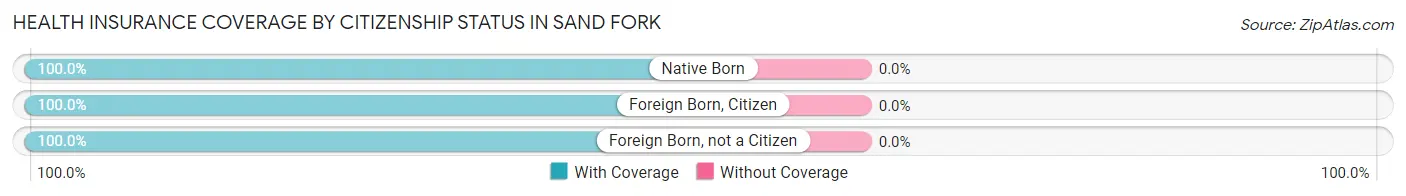
| Citizenship Status | With Coverage | Without Coverage |
| Native Born | 12 (100.0%) | 0 (0.0%) |
| Foreign Born, Citizen | 31 (100.0%) | 0 (0.0%) |
| Foreign Born, not a Citizen | 11 (100.0%) | 0 (0.0%) |
Health Insurance Coverage by Household Income in Sand Fork
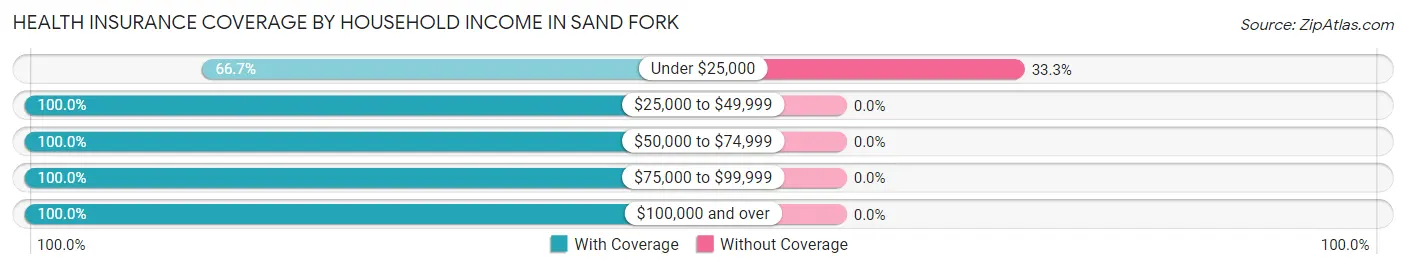
| Household Income | With Coverage | Without Coverage |
| Under $25,000 | 22 (66.7%) | 11 (33.3%) |
| $25,000 to $49,999 | 7 (100.0%) | 0 (0.0%) |
| $50,000 to $74,999 | 33 (100.0%) | 0 (0.0%) |
| $75,000 to $99,999 | 6 (100.0%) | 0 (0.0%) |
| $100,000 and over | 33 (100.0%) | 0 (0.0%) |
Public vs Private Health Insurance Coverage by Age in Sand Fork
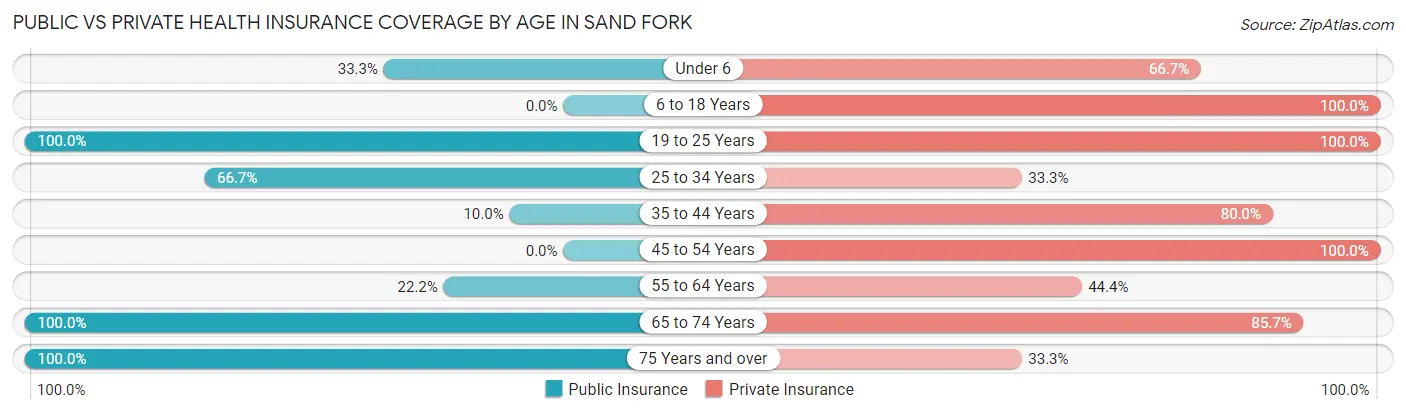
| Age Bracket | Public Insurance | Private Insurance |
| Under 6 | 4 (33.3%) | 8 (66.7%) |
| 6 to 18 Years | 0 (0.0%) | 31 (100.0%) |
| 19 to 25 Years | 11 (100.0%) | 11 (100.0%) |
| 25 to 34 Years | 4 (66.7%) | 2 (33.3%) |
| 35 to 44 Years | 3 (10.0%) | 24 (80.0%) |
| 45 to 54 Years | 0 (0.0%) | 3 (100.0%) |
| 55 to 64 Years | 2 (22.2%) | 4 (44.4%) |
| 65 to 74 Years | 7 (100.0%) | 6 (85.7%) |
| 75 Years and over | 3 (100.0%) | 1 (33.3%) |
| Total | 34 (30.4%) | 90 (80.4%) |
Disability Status by Sex by Age in Sand Fork
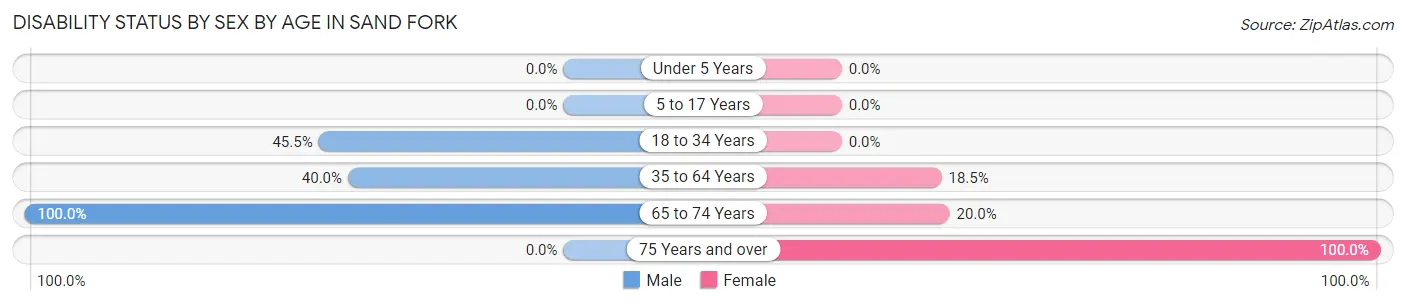
| Age Bracket | Male | Female |
| Under 5 Years | 0 (0.0%) | 0 (0.0%) |
| 5 to 17 Years | 0 (0.0%) | 0 (0.0%) |
| 18 to 34 Years | 5 (45.5%) | 0 (0.0%) |
| 35 to 64 Years | 6 (40.0%) | 5 (18.5%) |
| 65 to 74 Years | 2 (100.0%) | 1 (20.0%) |
| 75 Years and over | 0 (0.0%) | 1 (100.0%) |
Disability Class by Sex by Age in Sand Fork
Disability Class: Hearing Difficulty
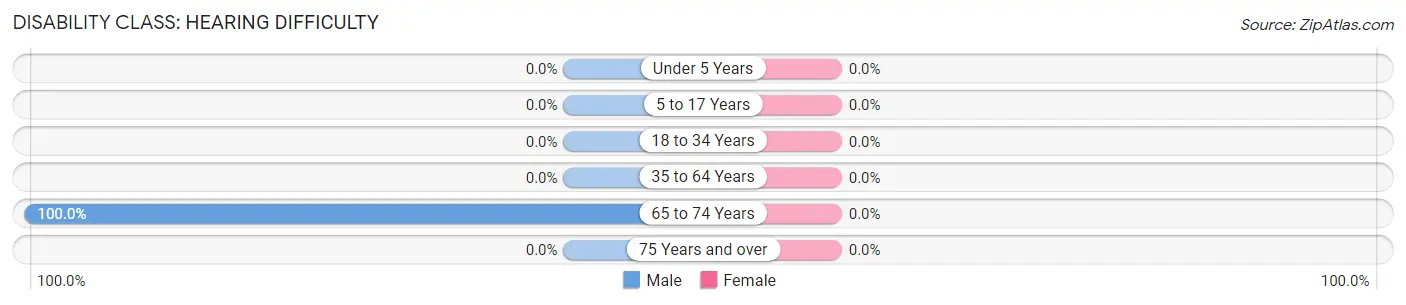
| Age Bracket | Male | Female |
| Under 5 Years | 0 (0.0%) | 0 (0.0%) |
| 5 to 17 Years | 0 (0.0%) | 0 (0.0%) |
| 18 to 34 Years | 0 (0.0%) | 0 (0.0%) |
| 35 to 64 Years | 0 (0.0%) | 0 (0.0%) |
| 65 to 74 Years | 2 (100.0%) | 0 (0.0%) |
| 75 Years and over | 0 (0.0%) | 0 (0.0%) |
Disability Class: Vision Difficulty
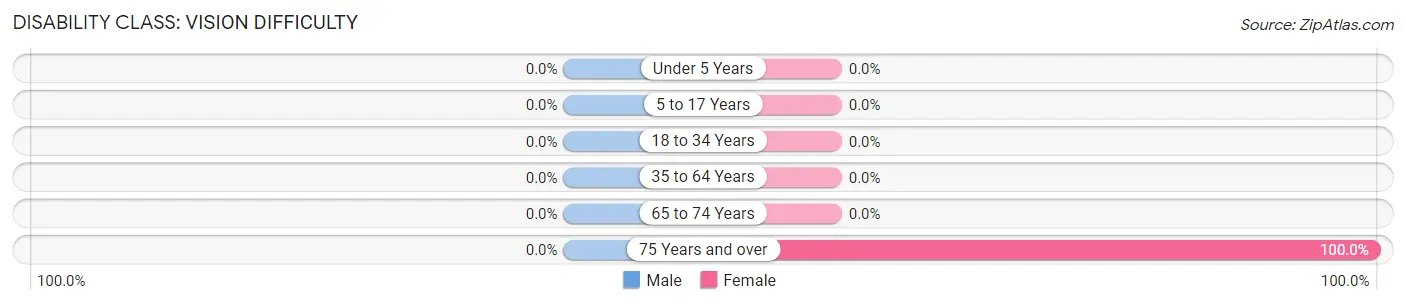
| Age Bracket | Male | Female |
| Under 5 Years | 0 (0.0%) | 0 (0.0%) |
| 5 to 17 Years | 0 (0.0%) | 0 (0.0%) |
| 18 to 34 Years | 0 (0.0%) | 0 (0.0%) |
| 35 to 64 Years | 0 (0.0%) | 0 (0.0%) |
| 65 to 74 Years | 0 (0.0%) | 0 (0.0%) |
| 75 Years and over | 0 (0.0%) | 1 (100.0%) |
Disability Class: Cognitive Difficulty
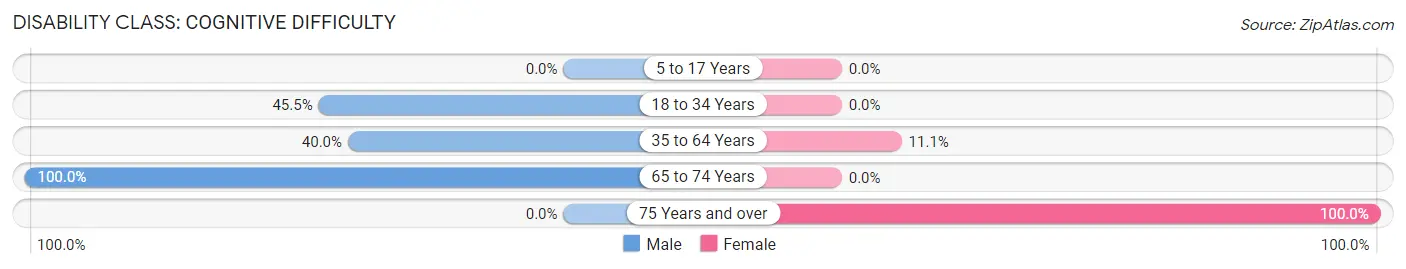
| Age Bracket | Male | Female |
| 5 to 17 Years | 0 (0.0%) | 0 (0.0%) |
| 18 to 34 Years | 5 (45.5%) | 0 (0.0%) |
| 35 to 64 Years | 6 (40.0%) | 3 (11.1%) |
| 65 to 74 Years | 2 (100.0%) | 0 (0.0%) |
| 75 Years and over | 0 (0.0%) | 1 (100.0%) |
Disability Class: Ambulatory Difficulty
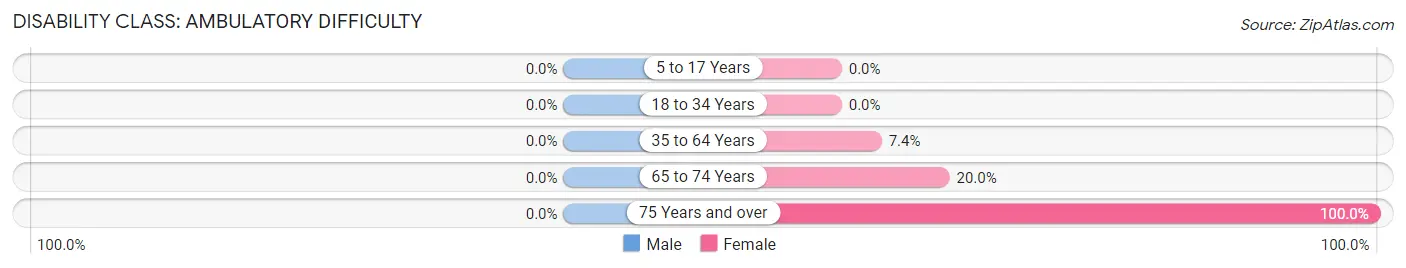
| Age Bracket | Male | Female |
| 5 to 17 Years | 0 (0.0%) | 0 (0.0%) |
| 18 to 34 Years | 0 (0.0%) | 0 (0.0%) |
| 35 to 64 Years | 0 (0.0%) | 2 (7.4%) |
| 65 to 74 Years | 0 (0.0%) | 1 (20.0%) |
| 75 Years and over | 0 (0.0%) | 1 (100.0%) |
Disability Class: Self-Care Difficulty
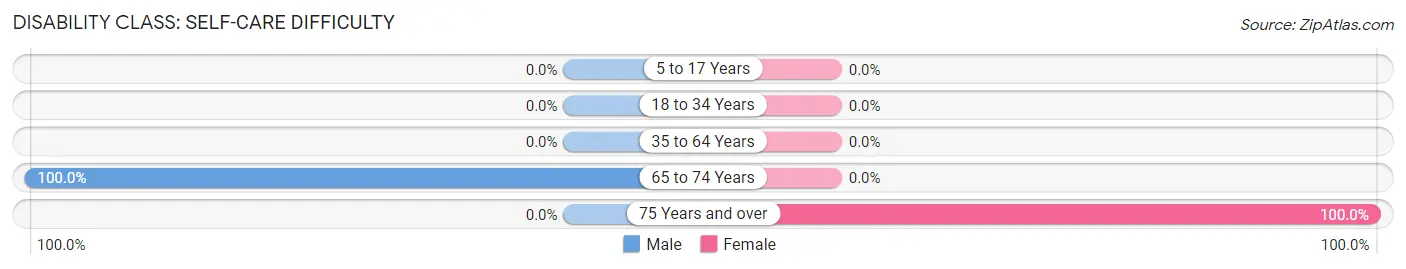
| Age Bracket | Male | Female |
| 5 to 17 Years | 0 (0.0%) | 0 (0.0%) |
| 18 to 34 Years | 0 (0.0%) | 0 (0.0%) |
| 35 to 64 Years | 0 (0.0%) | 0 (0.0%) |
| 65 to 74 Years | 2 (100.0%) | 0 (0.0%) |
| 75 Years and over | 0 (0.0%) | 1 (100.0%) |
Technology Access in Sand Fork
Computing Device Access in Sand Fork
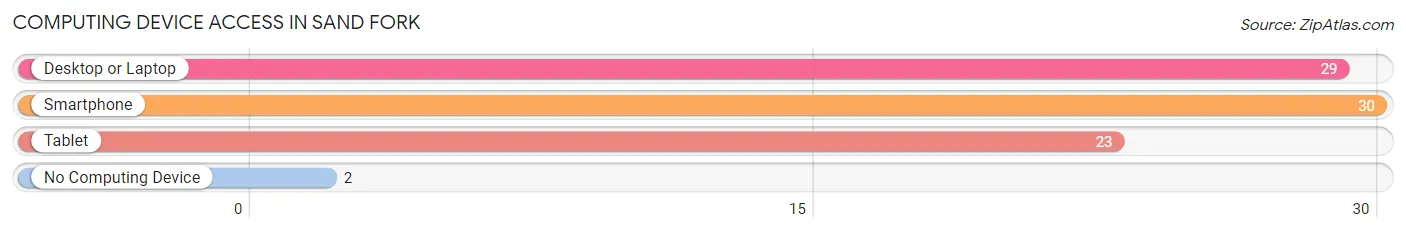
| Device Type | # Households | % Households |
| Desktop or Laptop | 29 | 80.6% |
| Smartphone | 30 | 83.3% |
| Tablet | 23 | 63.9% |
| No Computing Device | 2 | 5.6% |
| Total | 36 | 100.0% |
Internet Access in Sand Fork
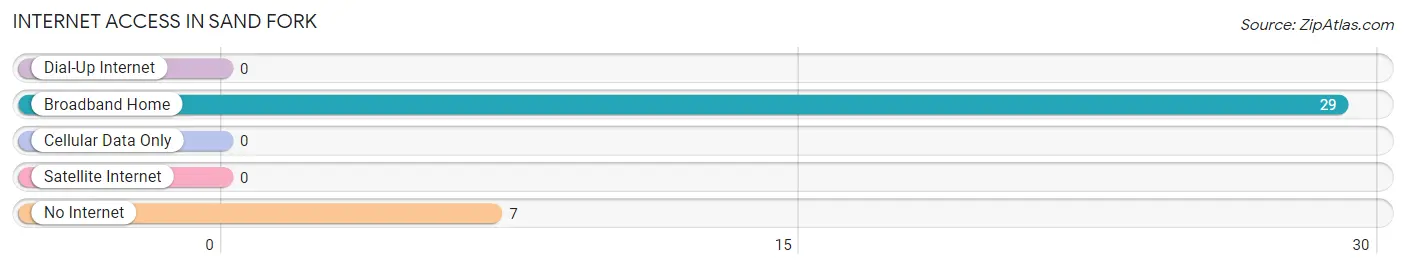
| Internet Type | # Households | % Households |
| Dial-Up Internet | 0 | 0.0% |
| Broadband Home | 29 | 80.6% |
| Cellular Data Only | 0 | 0.0% |
| Satellite Internet | 0 | 0.0% |
| No Internet | 7 | 19.4% |
| Total | 36 | 100.0% |
Sand Fork Summary
Sand Fork is a small unincorporated community located in Gilmer County, West Virginia. It is situated in the foothills of the Appalachian Mountains, approximately 20 miles south of the state capital of Charleston. The population of Sand Fork was estimated to be around 500 people in 2000.
History
Sand Fork was first settled in the late 1700s by a group of settlers from Pennsylvania. The town was originally known as “Sand Fork of Little Kanawha”, and was named after the nearby Sand Fork River. The town was officially incorporated in 1891.
In the early 1900s, the town was a bustling center of commerce and industry. The town was home to several coal mines, a sawmill, a gristmill, and a number of other businesses. The town also had a post office, a bank, and a hotel.
In the 1950s, the coal industry began to decline in the area, and many of the businesses in Sand Fork closed. The town’s population began to decline as well, and by 2000, the population was estimated to be around 500 people.
Geography
Sand Fork is located in the foothills of the Appalachian Mountains in Gilmer County, West Virginia. The town is situated along the Sand Fork River, which is a tributary of the Little Kanawha River. The town is located approximately 20 miles south of the state capital of Charleston.
The terrain around Sand Fork is mostly hilly and forested. The town is located at an elevation of 1,400 feet above sea level. The climate in the area is generally mild, with temperatures ranging from the low 30s in the winter to the mid-80s in the summer.
Economy
The economy of Sand Fork is largely based on agriculture and tourism. The town is home to several farms, which produce a variety of crops, including corn, soybeans, and hay. The town is also home to several tourist attractions, including a historic gristmill, a museum, and a number of outdoor recreation areas.
The town is also home to a number of small businesses, including a grocery store, a hardware store, and a few restaurants. The town is also home to a number of churches, including the Sand Fork United Methodist Church.
Demographics
As of the 2000 census, the population of Sand Fork was estimated to be around 500 people. The racial makeup of the town was 97.2% White, 0.8% African American, 0.2% Native American, 0.2% Asian, and 1.6% from other races. The median household income in the town was $25,000, and the median family income was $30,000.
The town is served by the Gilmer County School District, which includes two elementary schools, one middle school, and one high school. The town is also home to a number of churches, including the Sand Fork United Methodist Church.
Conclusion
Sand Fork is a small unincorporated community located in Gilmer County, West Virginia. It is situated in the foothills of the Appalachian Mountains, approximately 20 miles south of the state capital of Charleston. The population of Sand Fork was estimated to be around 500 people in 2000. The economy of the town is largely based on agriculture and tourism, and the town is home to several tourist attractions, including a historic gristmill, a museum, and a number of outdoor recreation areas. The racial makeup of the town was 97.2% White, 0.8% African American, 0.2% Native American, 0.2% Asian, and 1.6% from other races. The median household income in the town was $25,000, and the median family income was $30,000.
Common Questions
What is Per Capita Income in Sand Fork?
Per Capita income in Sand Fork is $21,703.
What is the Median Family Income in Sand Fork?
Median Family Income in Sand Fork is $51,250.
What is the Median Household income in Sand Fork?
Median Household Income in Sand Fork is $51,154.
What is Inequality or Gini Index in Sand Fork?
Inequality or Gini Index in Sand Fork is 0.38.
What is the Total Population of Sand Fork?
Total Population of Sand Fork is 112.
What is the Total Male Population of Sand Fork?
Total Male Population of Sand Fork is 58.
What is the Total Female Population of Sand Fork?
Total Female Population of Sand Fork is 54.
What is the Ratio of Males per 100 Females in Sand Fork?
There are 107.41 Males per 100 Females in Sand Fork.
What is the Ratio of Females per 100 Males in Sand Fork?
There are 93.10 Females per 100 Males in Sand Fork.
What is the Median Population Age in Sand Fork?
Median Population Age in Sand Fork is 30.7 Years.
What is the Average Family Size in Sand Fork
Average Family Size in Sand Fork is 3.8 People.
What is the Average Household Size in Sand Fork
Average Household Size in Sand Fork is 3.1 People.
How Large is the Labor Force in Sand Fork?
There are 40 People in the Labor Forcein in Sand Fork.
What is the Percentage of People in the Labor Force in Sand Fork?
58.0% of People are in the Labor Force in Sand Fork.