Accoville, WV Map & Demographics
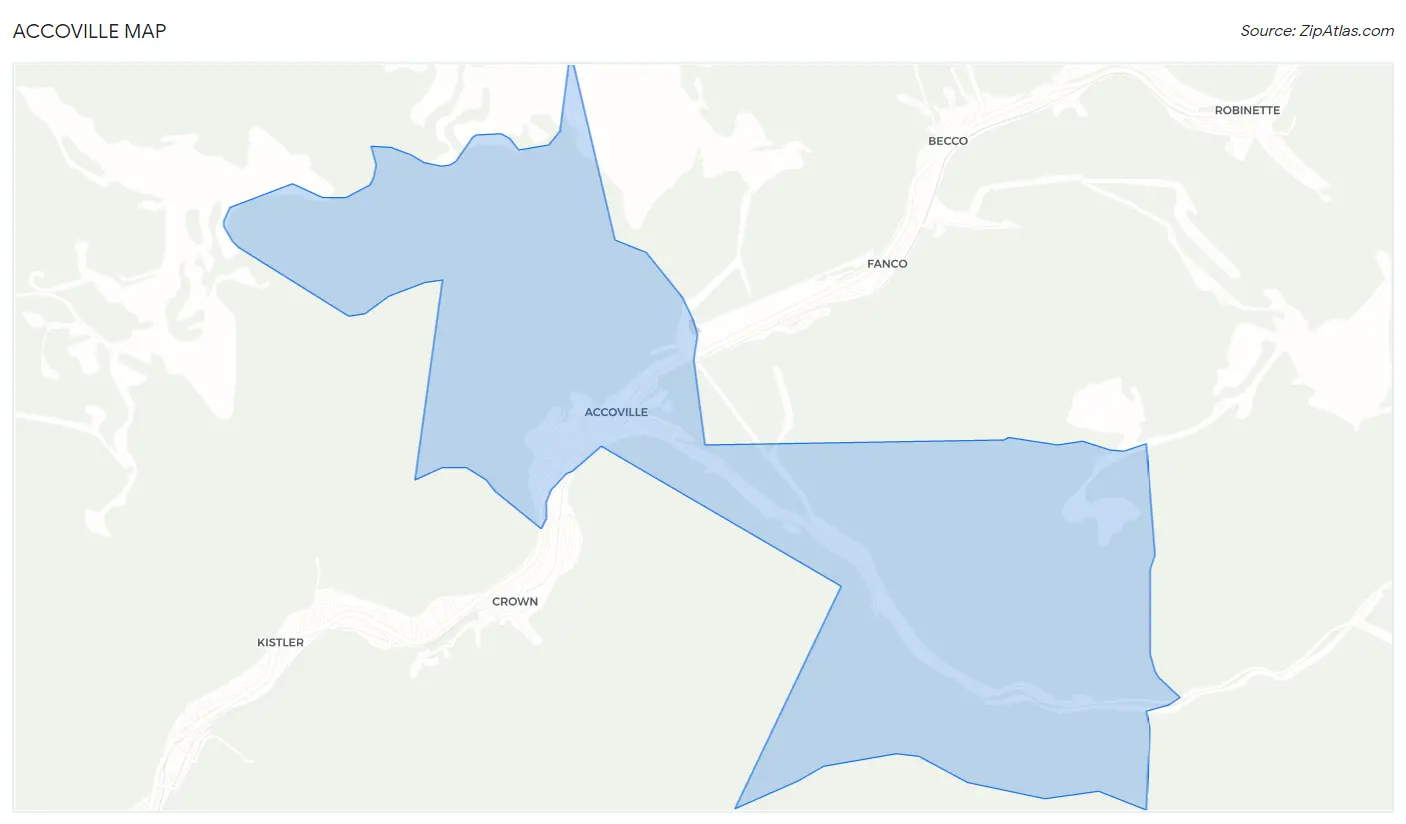
Accoville Map
Accoville Overview
$21,074
PER CAPITA INCOME
0.54
INEQUALITY / GINI INDEX
596
TOTAL POPULATION
313
MALE POPULATION
283
FEMALE POPULATION
110.60
MALES / 100 FEMALES
90.42
FEMALES / 100 MALES
34.1
MEDIAN AGE
3.3
AVG FAMILY SIZE
2.8
AVG HOUSEHOLD SIZE
124
LABOR FORCE [ PEOPLE ]
29.0%
PERCENT IN LABOR FORCE
14.5%
UNEMPLOYMENT RATE
Accoville Zip Codes
Accoville Area Codes
Income in Accoville
Income Overview in Accoville
| Characteristic | Number | Measure |
| Per Capita Income | 596 | $21,074 |
| Median Family Income | 160 | $0 |
| Mean Family Income | 160 | $69,378 |
| Median Household Income | 216 | $0 |
| Mean Household Income | 216 | $56,792 |
| Income Deficit | 160 | $0 |
| Wage / Income Gap (%) | 596 | 0.00% |
| Wage / Income Gap ($) | 596 | 100.00¢ per $1 |
| Gini / Inequality Index | 596 | 0.54 |
Earnings by Sex in Accoville
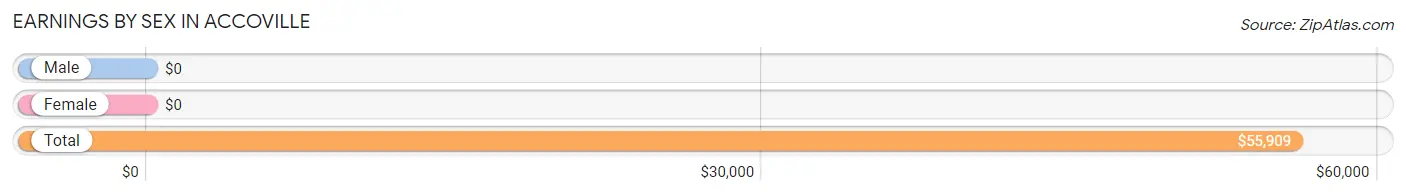
| Sex | Number | Average Earnings |
| Male | 84 (64.6%) | $0 |
| Female | 46 (35.4%) | $0 |
| Total | 130 (100.0%) | $55,909 |
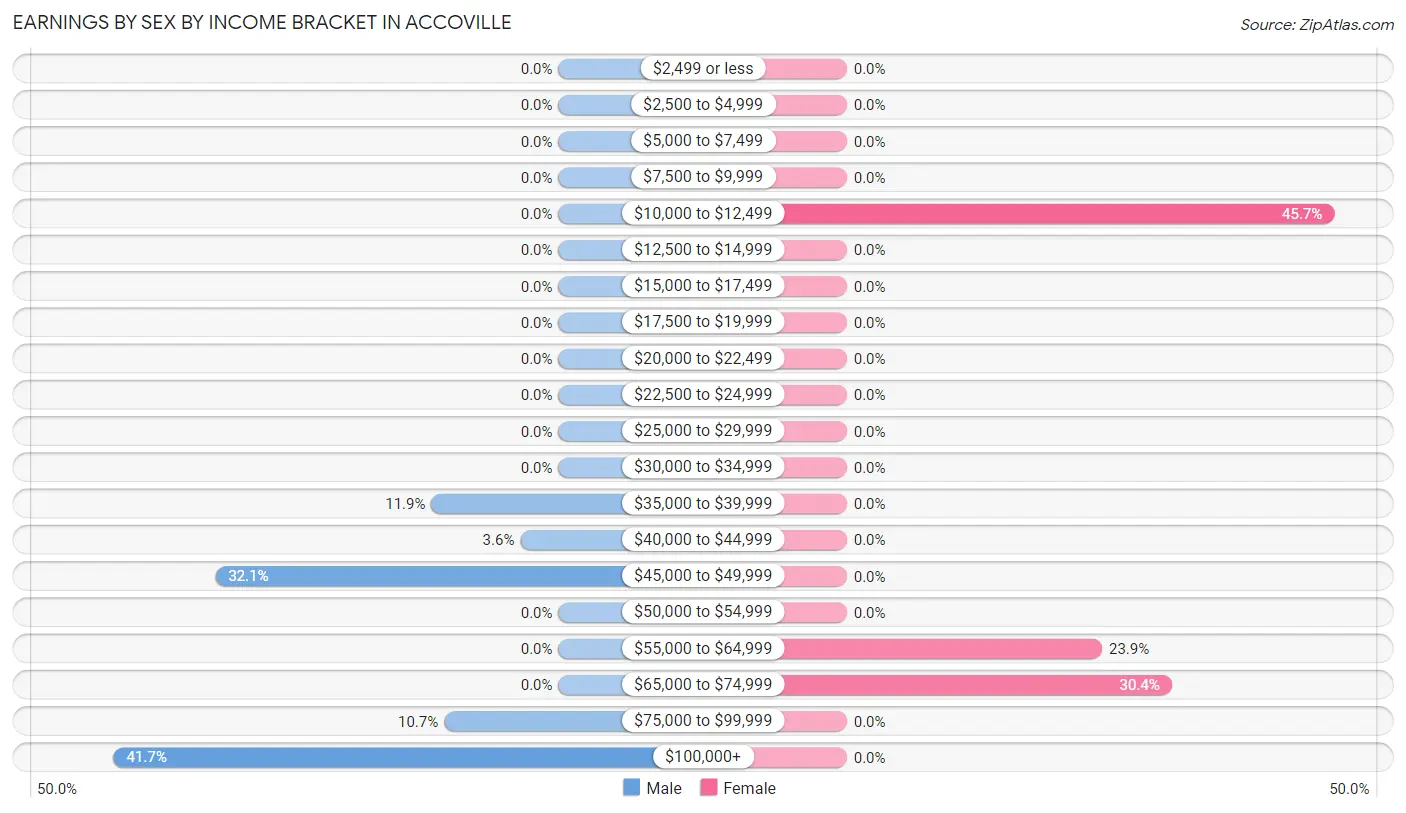
Earnings by Sex by Income Bracket in Accoville
The most common earnings brackets in Accoville are $100,000+ for men (35 | 41.7%) and $10,000 to $12,499 for women (21 | 45.7%).
| Income | Male | Female |
| $2,499 or less | 0 (0.0%) | 0 (0.0%) |
| $2,500 to $4,999 | 0 (0.0%) | 0 (0.0%) |
| $5,000 to $7,499 | 0 (0.0%) | 0 (0.0%) |
| $7,500 to $9,999 | 0 (0.0%) | 0 (0.0%) |
| $10,000 to $12,499 | 0 (0.0%) | 21 (45.7%) |
| $12,500 to $14,999 | 0 (0.0%) | 0 (0.0%) |
| $15,000 to $17,499 | 0 (0.0%) | 0 (0.0%) |
| $17,500 to $19,999 | 0 (0.0%) | 0 (0.0%) |
| $20,000 to $22,499 | 0 (0.0%) | 0 (0.0%) |
| $22,500 to $24,999 | 0 (0.0%) | 0 (0.0%) |
| $25,000 to $29,999 | 0 (0.0%) | 0 (0.0%) |
| $30,000 to $34,999 | 0 (0.0%) | 0 (0.0%) |
| $35,000 to $39,999 | 10 (11.9%) | 0 (0.0%) |
| $40,000 to $44,999 | 3 (3.6%) | 0 (0.0%) |
| $45,000 to $49,999 | 27 (32.1%) | 0 (0.0%) |
| $50,000 to $54,999 | 0 (0.0%) | 0 (0.0%) |
| $55,000 to $64,999 | 0 (0.0%) | 11 (23.9%) |
| $65,000 to $74,999 | 0 (0.0%) | 14 (30.4%) |
| $75,000 to $99,999 | 9 (10.7%) | 0 (0.0%) |
| $100,000+ | 35 (41.7%) | 0 (0.0%) |
| Total | 84 (100.0%) | 46 (100.0%) |
Earnings by Sex by Educational Attainment in Accoville
| Educational Attainment | Male Income | Female Income |
| Less than High School | - | - |
| High School Diploma | - | - |
| College or Associate's Degree | - | - |
| Bachelor's Degree | - | - |
| Graduate Degree | - | - |
| Total | - | - |
Family Income in Accoville
Family Income Brackets in Accoville
According to the Accoville family income data, there are 29 families falling into the $150,000 to $199,999 income range, which is the most common income bracket and makes up 18.1% of all families.
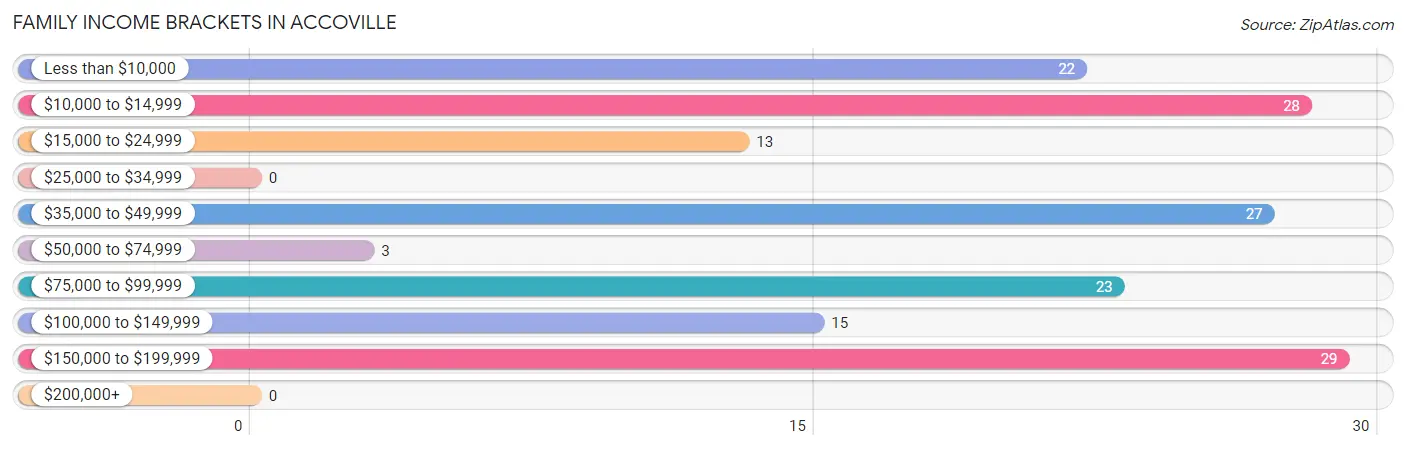
| Income Bracket | # Families | % Families |
| Less than $10,000 | 22 | 13.8% |
| $10,000 to $14,999 | 28 | 17.5% |
| $15,000 to $24,999 | 13 | 8.1% |
| $25,000 to $34,999 | 0 | 0.0% |
| $35,000 to $49,999 | 27 | 16.9% |
| $50,000 to $74,999 | 3 | 1.9% |
| $75,000 to $99,999 | 23 | 14.4% |
| $100,000 to $149,999 | 15 | 9.4% |
| $150,000 to $199,999 | 29 | 18.1% |
| $200,000+ | 0 | 0.0% |
Family Income by Famaliy Size in Accoville
3-person families (44 | 27.5%) account for the highest median family income in Accoville with $151,944 per family, while 3-person families (44 | 27.5%) have the highest median income of $50,648 per family member.
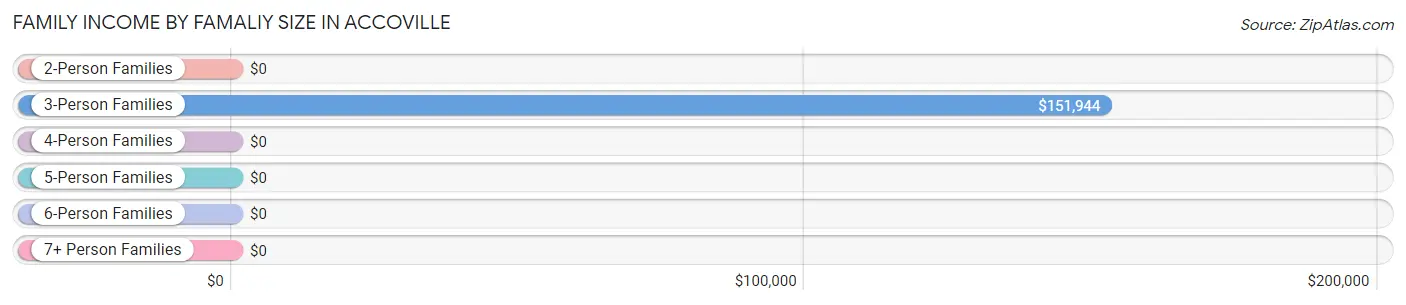
| Income Bracket | # Families | Median Income |
| 2-Person Families | 64 (40.0%) | $0 |
| 3-Person Families | 44 (27.5%) | $151,944 |
| 4-Person Families | 3 (1.9%) | $0 |
| 5-Person Families | 27 (16.9%) | $0 |
| 6-Person Families | 22 (13.8%) | $0 |
| 7+ Person Families | 0 (0.0%) | $0 |
| Total | 160 (100.0%) | $0 |
Family Income by Number of Earners in Accoville
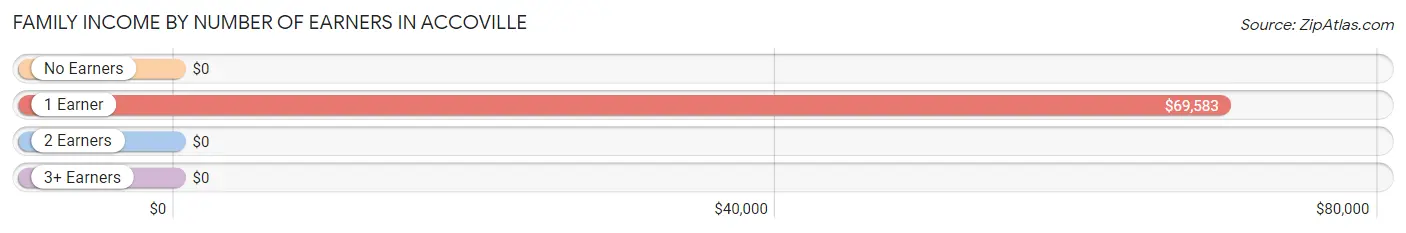
| Number of Earners | # Families | Median Income |
| No Earners | 72 (45.0%) | $0 |
| 1 Earner | 59 (36.9%) | $69,583 |
| 2 Earners | 29 (18.1%) | $0 |
| 3+ Earners | 0 (0.0%) | $0 |
| Total | 160 (100.0%) | $0 |
Household Income in Accoville
Household Income Brackets in Accoville
With 39 households falling in the category, the $10,000 to $14,999 income range is the most frequent in Accoville, accounting for 18.1% of all households.
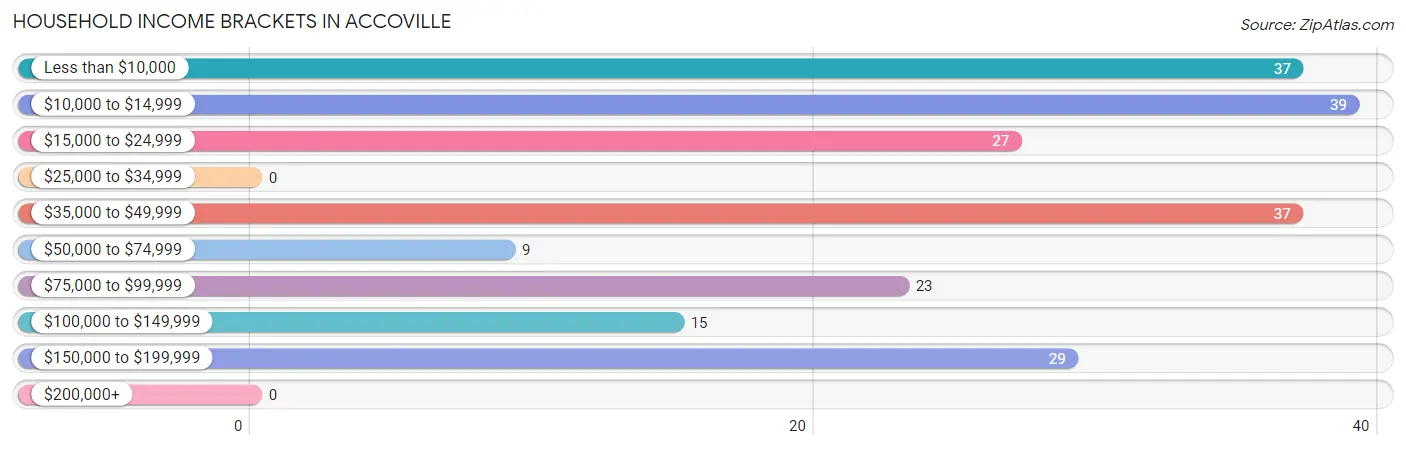
| Income Bracket | # Households | % Households |
| Less than $10,000 | 37 | 17.1% |
| $10,000 to $14,999 | 39 | 18.1% |
| $15,000 to $24,999 | 27 | 12.5% |
| $25,000 to $34,999 | 0 | 0.0% |
| $35,000 to $49,999 | 37 | 17.1% |
| $50,000 to $74,999 | 9 | 4.2% |
| $75,000 to $99,999 | 23 | 10.6% |
| $100,000 to $149,999 | 15 | 6.9% |
| $150,000 to $199,999 | 29 | 13.4% |
| $200,000+ | 0 | 0.0% |
Household Income by Householder Age in Accoville
The median household income in Accoville is $0, with the highest median household income of $16,250 found in the 65+ years age bracket for the primary householder. A total of 70 households (32.4%) fall into this category. Meanwhile, the 15 to 24 years age bracket for the primary householder has the lowest median household income of $0, with 10 households (4.6%) in this group.
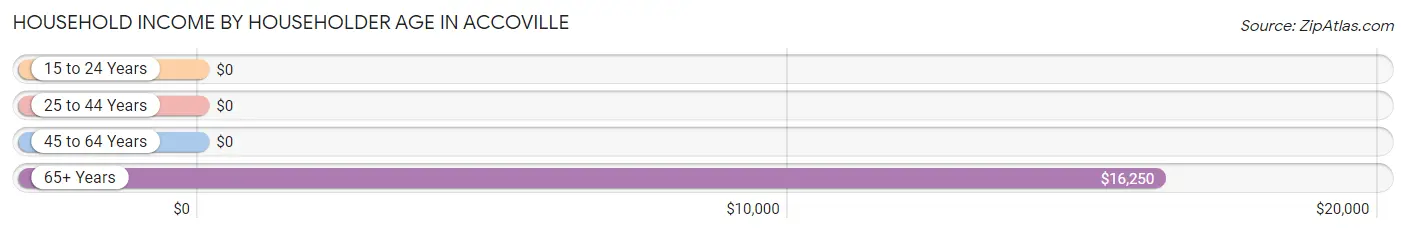
| Income Bracket | # Households | Median Income |
| 15 to 24 Years | 10 (4.6%) | $0 |
| 25 to 44 Years | 84 (38.9%) | $0 |
| 45 to 64 Years | 52 (24.1%) | $0 |
| 65+ Years | 70 (32.4%) | $16,250 |
| Total | 216 (100.0%) | $0 |
Poverty in Accoville
Income Below Poverty by Sex and Age in Accoville
With 27.5% poverty level for males and 39.9% for females among the residents of Accoville, 15 year old males and 12 to 14 year old females are the most vulnerable to poverty, with 12 males (100.0%) and 19 females (100.0%) in their respective age groups living below the poverty level.
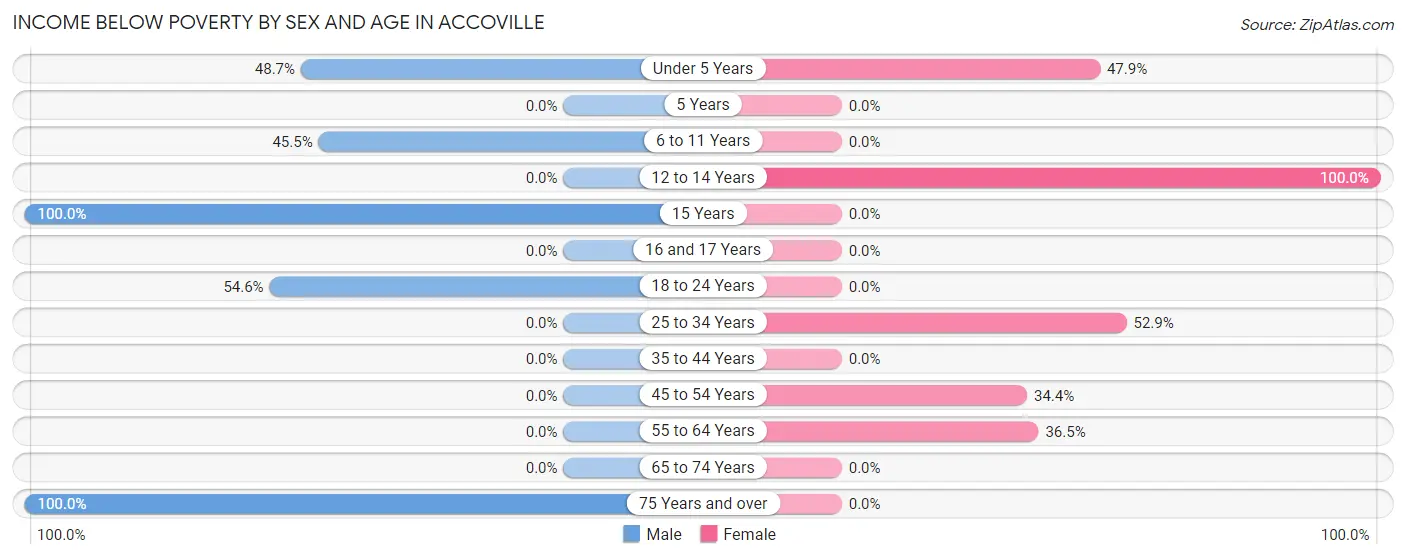
| Age Bracket | Male | Female |
| Under 5 Years | 19 (48.7%) | 23 (47.9%) |
| 5 Years | 0 (0.0%) | 0 (0.0%) |
| 6 to 11 Years | 15 (45.5%) | 0 (0.0%) |
| 12 to 14 Years | 0 (0.0%) | 19 (100.0%) |
| 15 Years | 12 (100.0%) | 0 (0.0%) |
| 16 and 17 Years | 0 (0.0%) | 0 (0.0%) |
| 18 to 24 Years | 12 (54.5%) | 0 (0.0%) |
| 25 to 34 Years | 0 (0.0%) | 37 (52.9%) |
| 35 to 44 Years | 0 (0.0%) | 0 (0.0%) |
| 45 to 54 Years | 0 (0.0%) | 11 (34.4%) |
| 55 to 64 Years | 0 (0.0%) | 23 (36.5%) |
| 65 to 74 Years | 0 (0.0%) | 0 (0.0%) |
| 75 Years and over | 28 (100.0%) | 0 (0.0%) |
| Total | 86 (27.5%) | 113 (39.9%) |
Income Above Poverty by Sex and Age in Accoville
According to the poverty statistics in Accoville, males aged 5 years and females aged 18 to 24 years are the age groups that are most secure financially, with 100.0% of males and 100.0% of females in these age groups living above the poverty line.
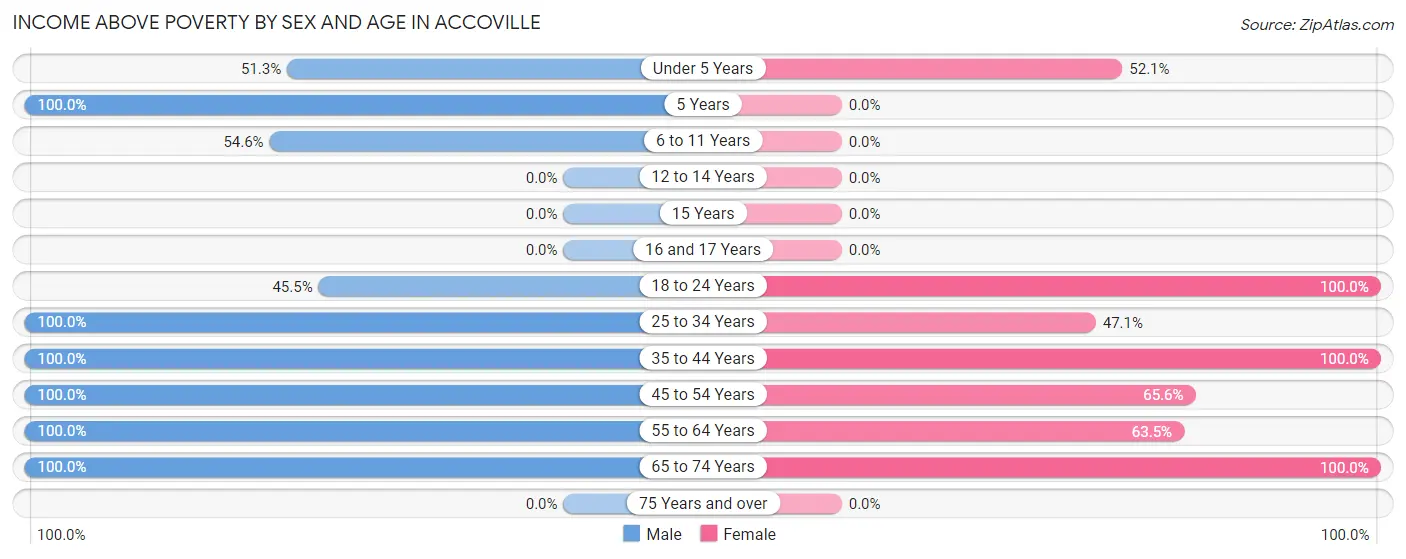
| Age Bracket | Male | Female |
| Under 5 Years | 20 (51.3%) | 25 (52.1%) |
| 5 Years | 17 (100.0%) | 0 (0.0%) |
| 6 to 11 Years | 18 (54.5%) | 0 (0.0%) |
| 12 to 14 Years | 0 (0.0%) | 0 (0.0%) |
| 15 Years | 0 (0.0%) | 0 (0.0%) |
| 16 and 17 Years | 0 (0.0%) | 0 (0.0%) |
| 18 to 24 Years | 10 (45.5%) | 15 (100.0%) |
| 25 to 34 Years | 42 (100.0%) | 33 (47.1%) |
| 35 to 44 Years | 43 (100.0%) | 21 (100.0%) |
| 45 to 54 Years | 3 (100.0%) | 21 (65.6%) |
| 55 to 64 Years | 38 (100.0%) | 40 (63.5%) |
| 65 to 74 Years | 36 (100.0%) | 15 (100.0%) |
| 75 Years and over | 0 (0.0%) | 0 (0.0%) |
| Total | 227 (72.5%) | 170 (60.1%) |
Income Below Poverty Among Married-Couple Families in Accoville
The poverty statistics for married-couple families in Accoville show that 20.3% or 28 of the total 138 families live below the poverty line. Families with no children have the highest poverty rate of 28.3%, comprising of 28 families. On the other hand, families with 1 or 2 children have the lowest poverty rate of 0.0%, which includes 0 families.
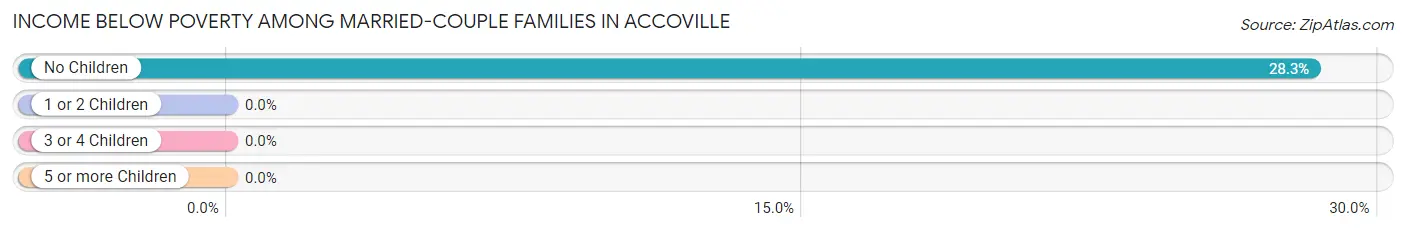
| Children | Above Poverty | Below Poverty |
| No Children | 71 (71.7%) | 28 (28.3%) |
| 1 or 2 Children | 12 (100.0%) | 0 (0.0%) |
| 3 or 4 Children | 27 (100.0%) | 0 (0.0%) |
| 5 or more Children | 0 (0.0%) | 0 (0.0%) |
| Total | 110 (79.7%) | 28 (20.3%) |
Income Below Poverty Among Single-Parent Households in Accoville
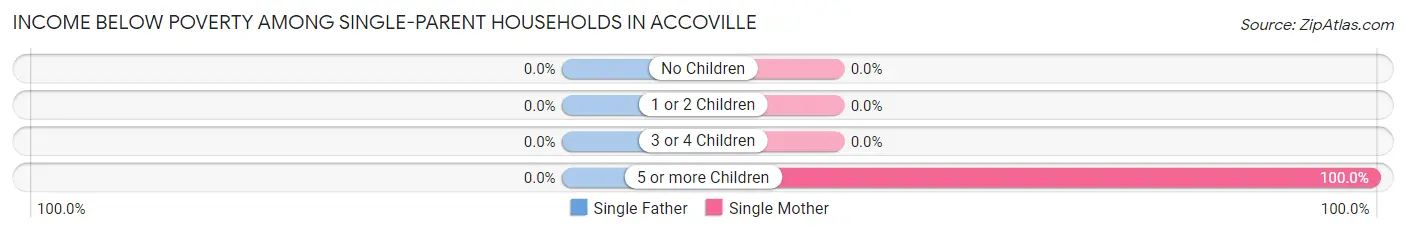
| Children | Single Father | Single Mother |
| No Children | 0 (0.0%) | 0 (0.0%) |
| 1 or 2 Children | 0 (0.0%) | 0 (0.0%) |
| 3 or 4 Children | 0 (0.0%) | 0 (0.0%) |
| 5 or more Children | 0 (0.0%) | 22 (100.0%) |
| Total | 0 (0.0%) | 22 (100.0%) |
Income Below Poverty Among Married-Couple vs Single-Parent Households in Accoville
The poverty data for Accoville shows that 28 of the married-couple family households (20.3%) and 22 of the single-parent households (100.0%) are living below the poverty level. Within the married-couple family households, those with no children have the highest poverty rate, with 28 households (28.3%) falling below the poverty line. Among the single-parent households, those with 5 or more children have the highest poverty rate, with 22 household (100.0%) living below poverty.
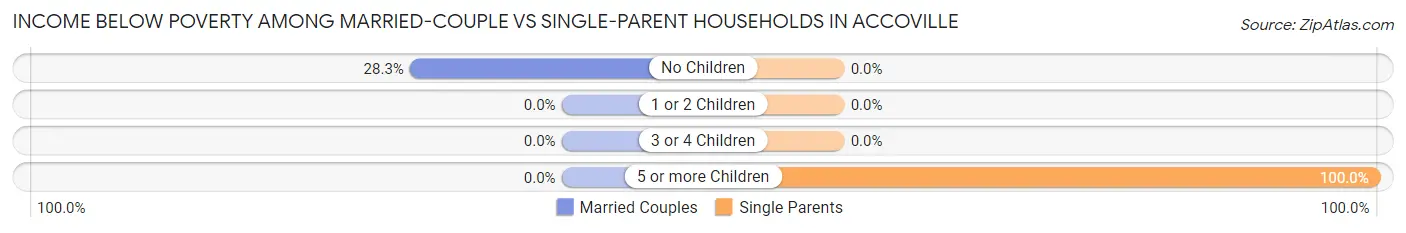
| Children | Married-Couple Families | Single-Parent Households |
| No Children | 28 (28.3%) | 0 (0.0%) |
| 1 or 2 Children | 0 (0.0%) | 0 (0.0%) |
| 3 or 4 Children | 0 (0.0%) | 0 (0.0%) |
| 5 or more Children | 0 (0.0%) | 22 (100.0%) |
| Total | 28 (20.3%) | 22 (100.0%) |
Race in Accoville
The most populous races in Accoville are , and White / Caucasian (596 | 100.0%).
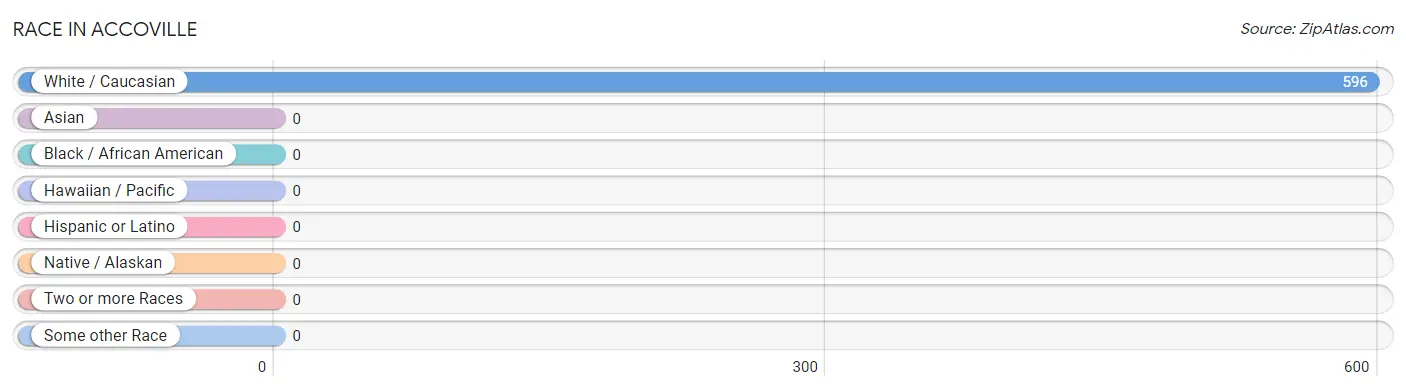
| Race | # Population | % Population |
| Asian | 0 | 0.0% |
| Black / African American | 0 | 0.0% |
| Hawaiian / Pacific | 0 | 0.0% |
| Hispanic or Latino | 0 | 0.0% |
| Native / Alaskan | 0 | 0.0% |
| White / Caucasian | 596 | 100.0% |
| Two or more Races | 0 | 0.0% |
| Some other Race | 0 | 0.0% |
| Total | 596 | 100.0% |
Ancestry in Accoville
The most populous ancestries reported in Accoville are American (56 | 9.4%), Irish (15 | 2.5%), English (12 | 2.0%), Hungarian (9 | 1.5%), and Italian (9 | 1.5%), together accounting for 17.0% of all Accoville residents.
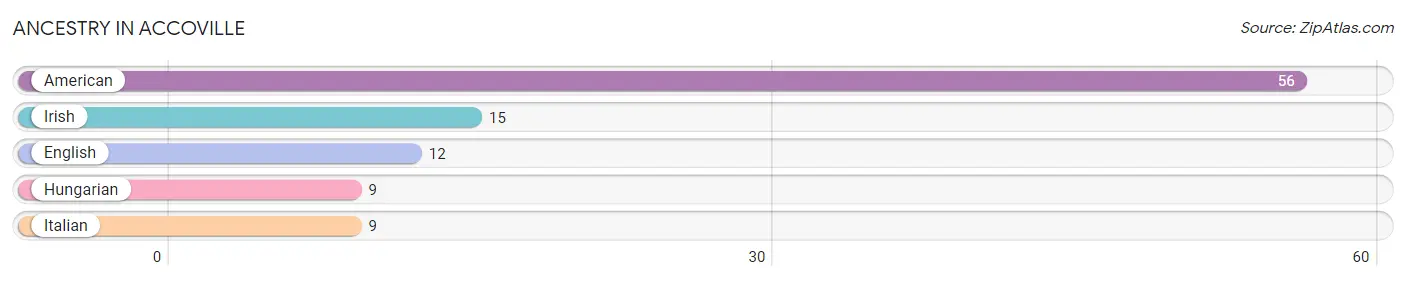
| Ancestry | # Population | % Population |
| American | 56 | 9.4% |
| English | 12 | 2.0% |
| Hungarian | 9 | 1.5% |
| Irish | 15 | 2.5% |
| Italian | 9 | 1.5% | View All 5 Rows |
Immigrants in Accoville

| Immigration Origin | # Population | % Population | View All 0 Rows |
Sex and Age in Accoville
Sex and Age in Accoville
The most populous age groups in Accoville are 5 to 9 Years (42 | 13.4%) for men and Under 5 Years (48 | 17.0%) for women.
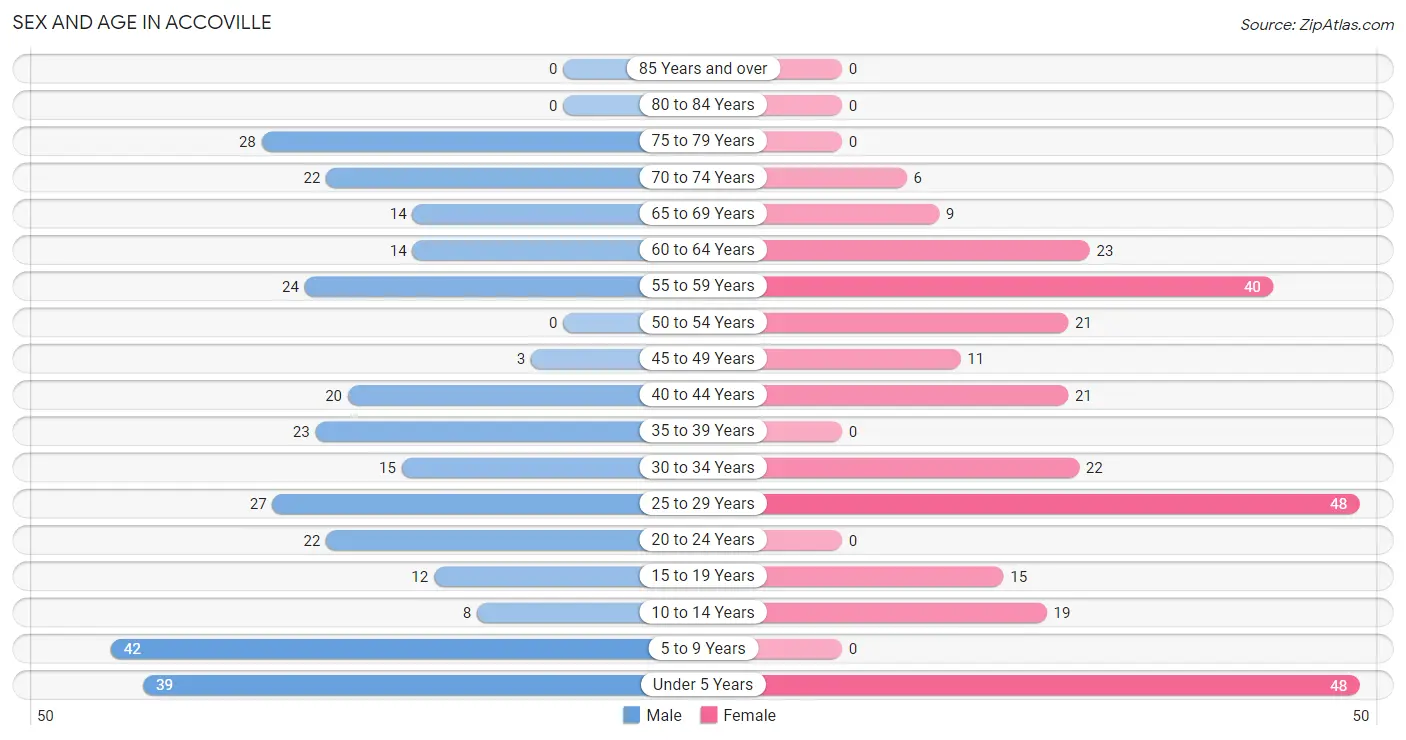
| Age Bracket | Male | Female |
| Under 5 Years | 39 (12.5%) | 48 (17.0%) |
| 5 to 9 Years | 42 (13.4%) | 0 (0.0%) |
| 10 to 14 Years | 8 (2.6%) | 19 (6.7%) |
| 15 to 19 Years | 12 (3.8%) | 15 (5.3%) |
| 20 to 24 Years | 22 (7.0%) | 0 (0.0%) |
| 25 to 29 Years | 27 (8.6%) | 48 (17.0%) |
| 30 to 34 Years | 15 (4.8%) | 22 (7.8%) |
| 35 to 39 Years | 23 (7.3%) | 0 (0.0%) |
| 40 to 44 Years | 20 (6.4%) | 21 (7.4%) |
| 45 to 49 Years | 3 (1.0%) | 11 (3.9%) |
| 50 to 54 Years | 0 (0.0%) | 21 (7.4%) |
| 55 to 59 Years | 24 (7.7%) | 40 (14.1%) |
| 60 to 64 Years | 14 (4.5%) | 23 (8.1%) |
| 65 to 69 Years | 14 (4.5%) | 9 (3.2%) |
| 70 to 74 Years | 22 (7.0%) | 6 (2.1%) |
| 75 to 79 Years | 28 (8.9%) | 0 (0.0%) |
| 80 to 84 Years | 0 (0.0%) | 0 (0.0%) |
| 85 Years and over | 0 (0.0%) | 0 (0.0%) |
| Total | 313 (100.0%) | 283 (100.0%) |
Families and Households in Accoville
Median Family Size in Accoville
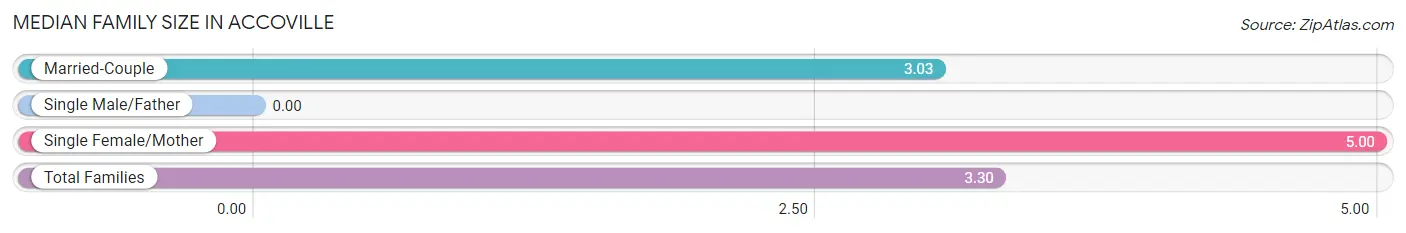
| Family Type | # Families | Family Size |
| Married-Couple | 138 (86.3%) | 3.03 |
| Single Male/Father | 0 (0.0%) | - |
| Single Female/Mother | 22 (13.8%) | 5.00 |
| Total Families | 160 (100.0%) | 3.30 |
Median Household Size in Accoville
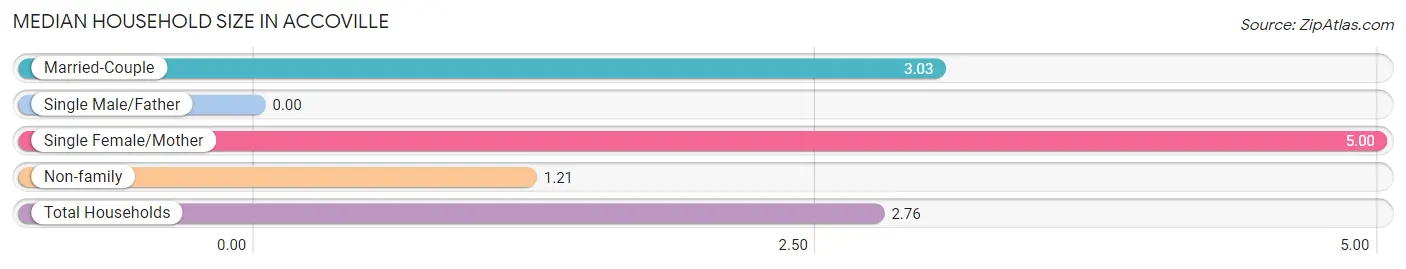
| Household Type | # Households | Household Size |
| Married-Couple | 138 (63.9%) | 3.03 |
| Single Male/Father | 0 (0.0%) | - |
| Single Female/Mother | 22 (10.2%) | 5.00 |
| Non-family | 56 (25.9%) | 1.21 |
| Total Households | 216 (100.0%) | 2.76 |
Household Size by Marriage Status in Accoville
Out of a total of 216 households in Accoville, 160 (74.1%) are family households, while 56 (25.9%) are nonfamily households. The most numerous type of family households are 2-person households, comprising 64, and the most common type of nonfamily households are 1-person households, comprising 46.
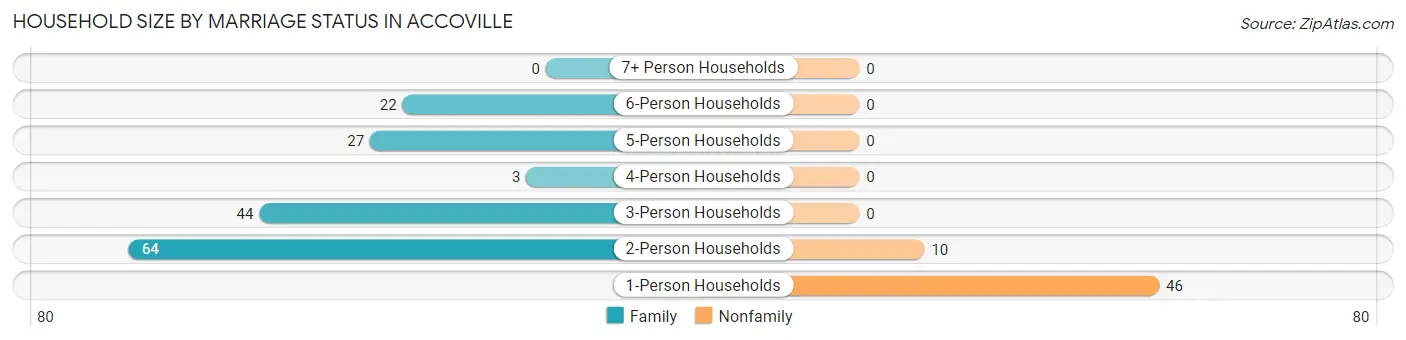
| Household Size | Family Households | Nonfamily Households |
| 1-Person Households | - | 46 (21.3%) |
| 2-Person Households | 64 (29.6%) | 10 (4.6%) |
| 3-Person Households | 44 (20.4%) | 0 (0.0%) |
| 4-Person Households | 3 (1.4%) | 0 (0.0%) |
| 5-Person Households | 27 (12.5%) | 0 (0.0%) |
| 6-Person Households | 22 (10.2%) | 0 (0.0%) |
| 7+ Person Households | 0 (0.0%) | 0 (0.0%) |
| Total | 160 (74.1%) | 56 (25.9%) |
Female Fertility in Accoville
Fertility by Age in Accoville
Average fertility rate in Accoville is 260.0 births per 1,000 women. Women in the age bracket of 20 to 34 years have the highest fertility rate with 471.0 births per 1,000 women. Women in the age bracket of 20 to 34 years acount for 100.0% of all women with births.
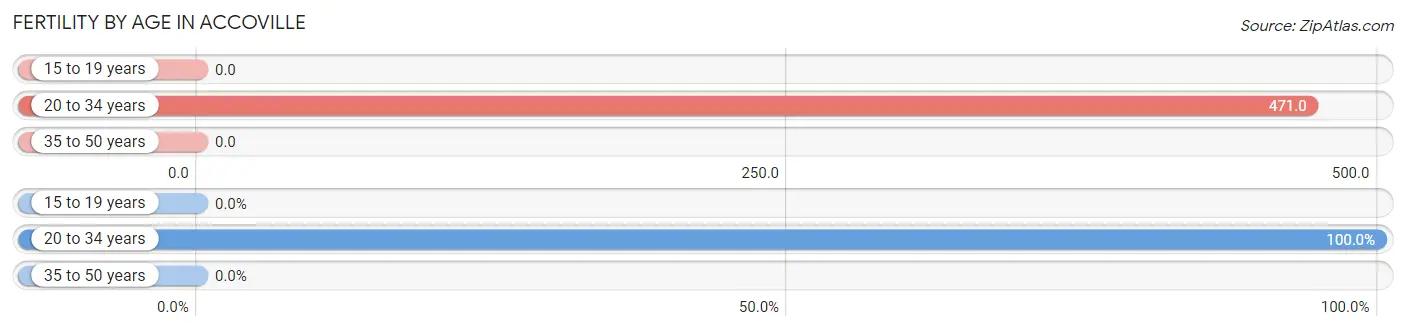
| Age Bracket | Women with Births | Births / 1,000 Women |
| 15 to 19 years | 0 (0.0%) | 0.0 |
| 20 to 34 years | 33 (100.0%) | 471.0 |
| 35 to 50 years | 0 (0.0%) | 0.0 |
| Total | 33 (100.0%) | 260.0 |
Fertility by Age by Marriage Status in Accoville
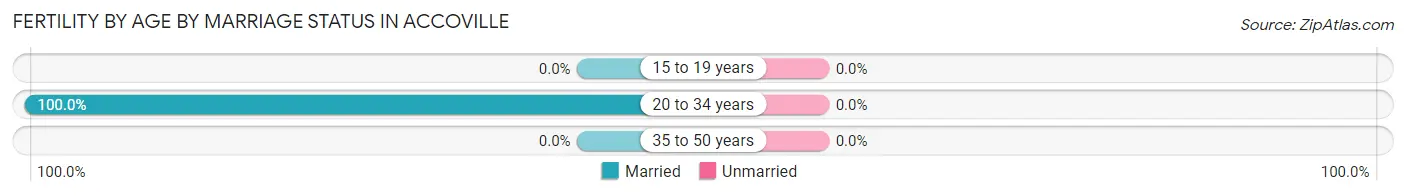
| Age Bracket | Married | Unmarried |
| 15 to 19 years | 0 (0.0%) | 0 (0.0%) |
| 20 to 34 years | 33 (100.0%) | 0 (0.0%) |
| 35 to 50 years | 0 (0.0%) | 0 (0.0%) |
| Total | 33 (100.0%) | 0 (0.0%) |
Fertility by Education in Accoville
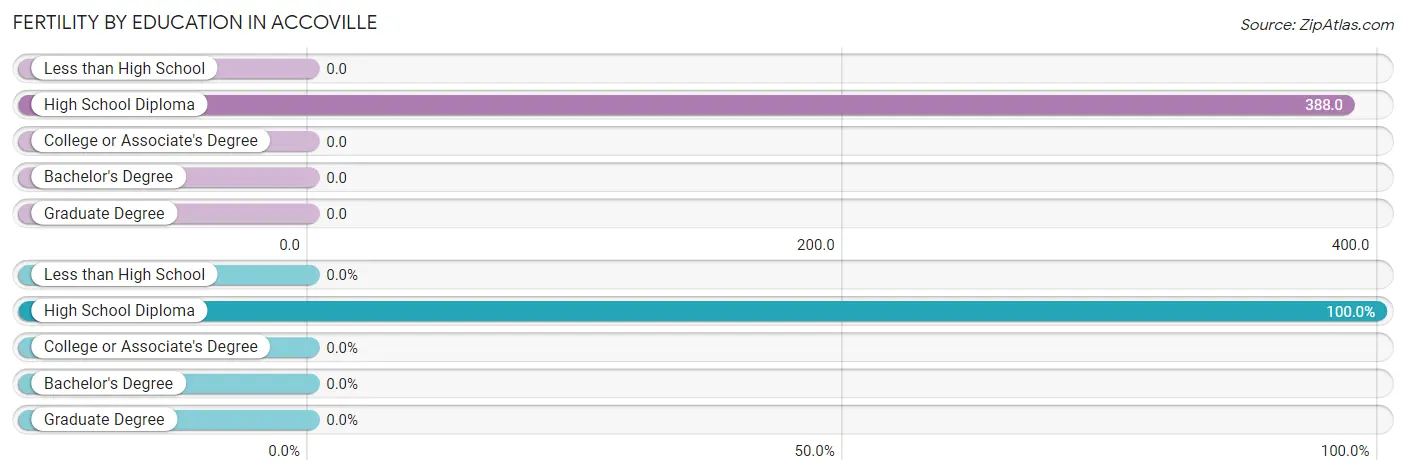
| Educational Attainment | Women with Births | Births / 1,000 Women |
| Less than High School | 0 (0.0%) | 0.0 |
| High School Diploma | 33 (100.0%) | 388.0 |
| College or Associate's Degree | 0 (0.0%) | 0.0 |
| Bachelor's Degree | 0 (0.0%) | 0.0 |
| Graduate Degree | 0 (0.0%) | 0.0 |
| Total | 33 (100.0%) | 260.0 |
Fertility by Education by Marriage Status in Accoville
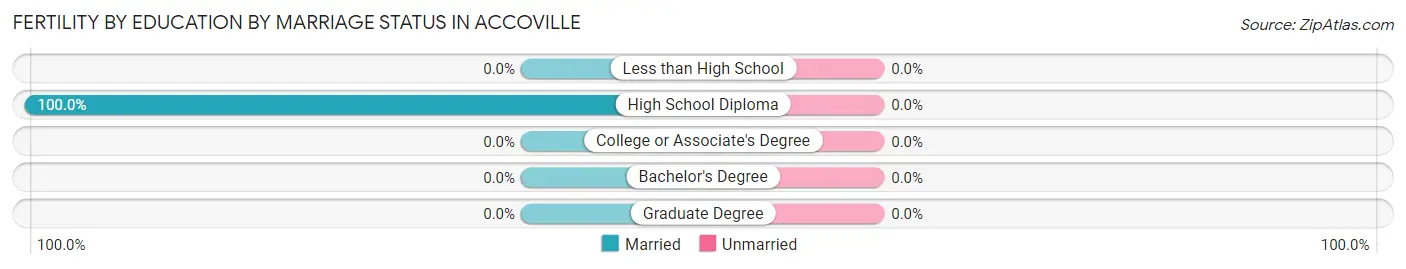
| Educational Attainment | Married | Unmarried |
| Less than High School | 0 (0.0%) | 0 (0.0%) |
| High School Diploma | 33 (100.0%) | 0 (0.0%) |
| College or Associate's Degree | 0 (0.0%) | 0 (0.0%) |
| Bachelor's Degree | 0 (0.0%) | 0 (0.0%) |
| Graduate Degree | 0 (0.0%) | 0 (0.0%) |
| Total | 33 (100.0%) | 0 (0.0%) |
Employment Characteristics in Accoville
Employment by Class of Employer in Accoville
Among the 106 employed individuals in Accoville, private company employees (85 | 80.2%), local government employees (11 | 10.4%), and state government employees (10 | 9.4%) make up the most common classes of employment.
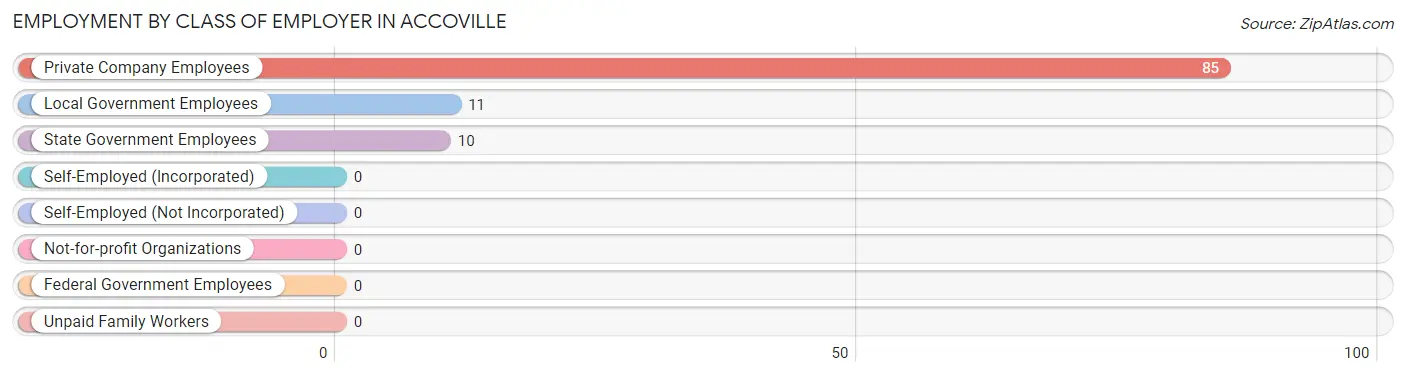
| Employer Class | # Employees | % Employees |
| Private Company Employees | 85 | 80.2% |
| Self-Employed (Incorporated) | 0 | 0.0% |
| Self-Employed (Not Incorporated) | 0 | 0.0% |
| Not-for-profit Organizations | 0 | 0.0% |
| Local Government Employees | 11 | 10.4% |
| State Government Employees | 10 | 9.4% |
| Federal Government Employees | 0 | 0.0% |
| Unpaid Family Workers | 0 | 0.0% |
| Total | 106 | 100.0% |
Employment Status by Age in Accoville
According to the labor force statistics for Accoville, out of the total population over 16 years of age (428), 29.0% or 124 individuals are in the labor force, with 14.5% or 18 of them unemployed. The age group with the highest labor force participation rate is 55 to 59 years, with 59.4% or 38 individuals in the labor force. Within the labor force, the 25 to 29 years age range has the highest percentage of unemployed individuals, with 35.7% or 15 of them being unemployed.
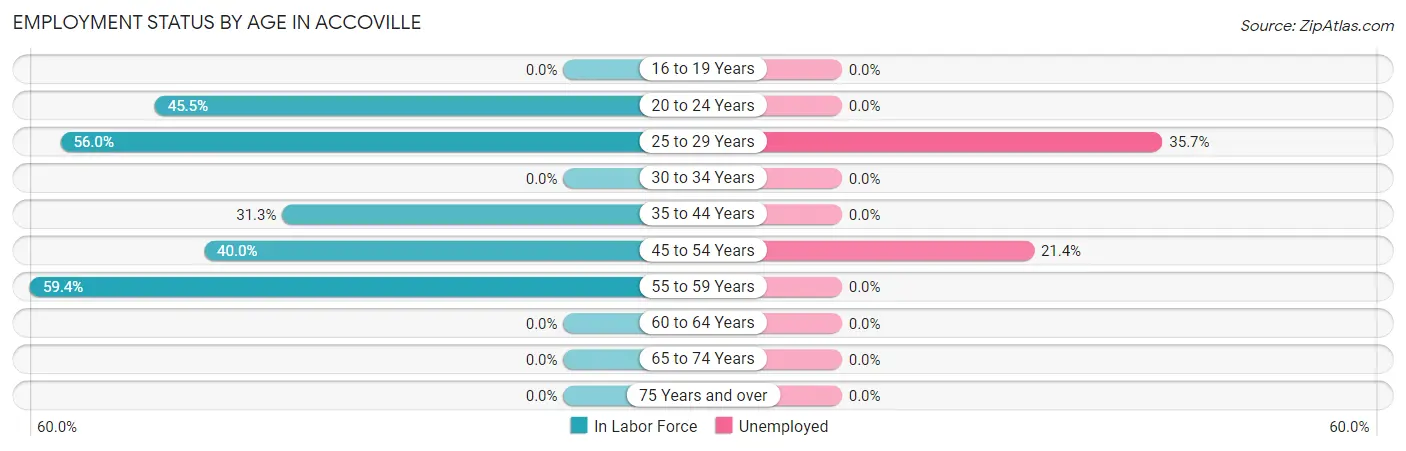
| Age Bracket | In Labor Force | Unemployed |
| 16 to 19 Years | 0 (0.0%) | 0 (0.0%) |
| 20 to 24 Years | 10 (45.5%) | 0 (0.0%) |
| 25 to 29 Years | 42 (56.0%) | 15 (35.7%) |
| 30 to 34 Years | 0 (0.0%) | 0 (0.0%) |
| 35 to 44 Years | 20 (31.3%) | 0 (0.0%) |
| 45 to 54 Years | 14 (40.0%) | 3 (21.4%) |
| 55 to 59 Years | 38 (59.4%) | 0 (0.0%) |
| 60 to 64 Years | 0 (0.0%) | 0 (0.0%) |
| 65 to 74 Years | 0 (0.0%) | 0 (0.0%) |
| 75 Years and over | 0 (0.0%) | 0 (0.0%) |
| Total | 124 (29.0%) | 18 (14.5%) |
Employment Status by Educational Attainment in Accoville
According to labor force statistics for Accoville, 36.5% of individuals (114) out of the total population between 25 and 64 years of age (312) are in the labor force, with 15.8% or 18 of them being unemployed. The group with the highest labor force participation rate are those with the educational attainment of bachelor's degree or higher, with 100.0% or 11 individuals in the labor force. Within the labor force, individuals with high school diploma education have the highest percentage of unemployment, with 19.1% or 18 of them being unemployed.
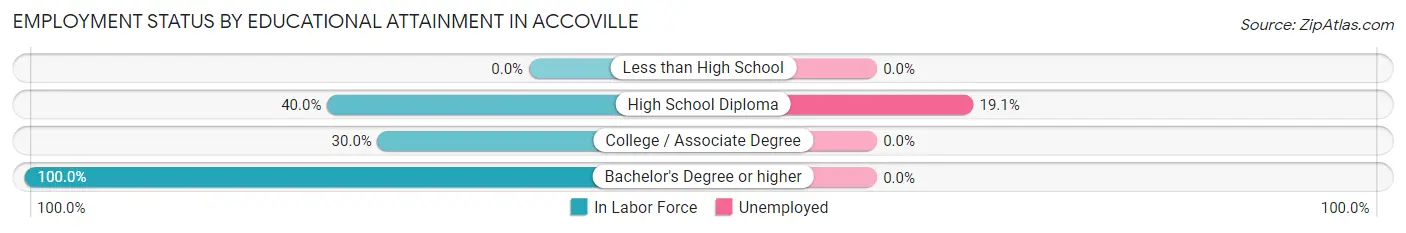
| Educational Attainment | In Labor Force | Unemployed |
| Less than High School | 0 (0.0%) | 0 (0.0%) |
| High School Diploma | 94 (40.0%) | 45 (19.1%) |
| College / Associate Degree | 9 (30.0%) | 0 (0.0%) |
| Bachelor's Degree or higher | 11 (100.0%) | 0 (0.0%) |
| Total | 114 (36.5%) | 49 (15.8%) |
Employment Occupations by Sex in Accoville
Management, Business, Science and Arts Occupations
The most common Management, Business, Science and Arts occupations in Accoville are Business & Financial (27 | 25.5%), Health Diagnosing & Treating (14 | 13.2%), Community & Social Service (11 | 10.4%), and Education Instruction & Library (11 | 10.4%).
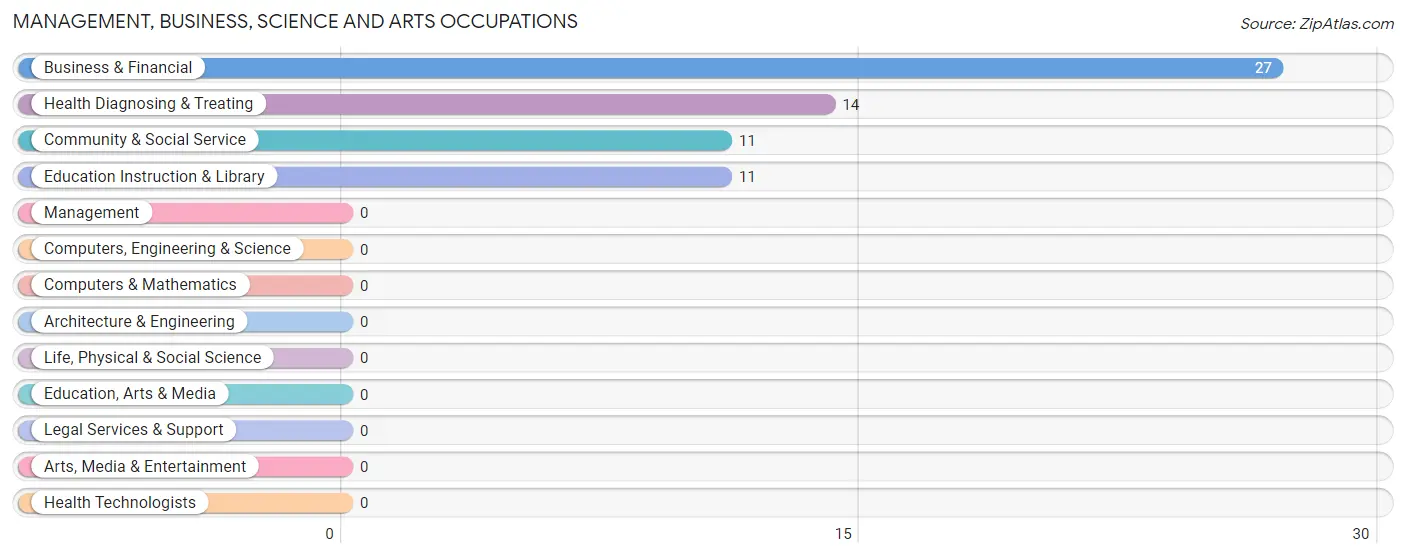
Management, Business, Science and Arts Occupations by Sex
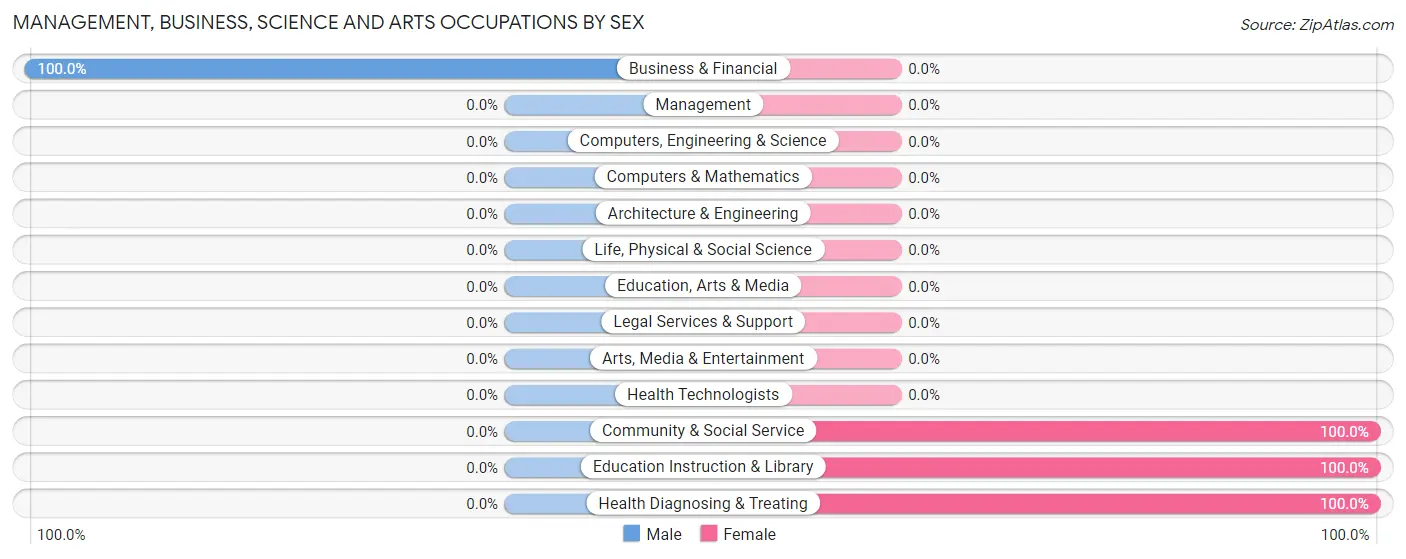
| Occupation | Male | Female |
| Management | 0 (0.0%) | 0 (0.0%) |
| Business & Financial | 27 (100.0%) | 0 (0.0%) |
| Computers, Engineering & Science | 0 (0.0%) | 0 (0.0%) |
| Computers & Mathematics | 0 (0.0%) | 0 (0.0%) |
| Architecture & Engineering | 0 (0.0%) | 0 (0.0%) |
| Life, Physical & Social Science | 0 (0.0%) | 0 (0.0%) |
| Community & Social Service | 0 (0.0%) | 11 (100.0%) |
| Education, Arts & Media | 0 (0.0%) | 0 (0.0%) |
| Legal Services & Support | 0 (0.0%) | 0 (0.0%) |
| Education Instruction & Library | 0 (0.0%) | 11 (100.0%) |
| Arts, Media & Entertainment | 0 (0.0%) | 0 (0.0%) |
| Health Diagnosing & Treating | 0 (0.0%) | 14 (100.0%) |
| Health Technologists | 0 (0.0%) | 0 (0.0%) |
| Total (Category) | 27 (51.9%) | 25 (48.1%) |
| Total (Overall) | 81 (76.4%) | 25 (23.6%) |
Services Occupations
The most common Services occupations in Accoville are Security & Protection (10 | 9.4%), and Law Enforcement (10 | 9.4%).
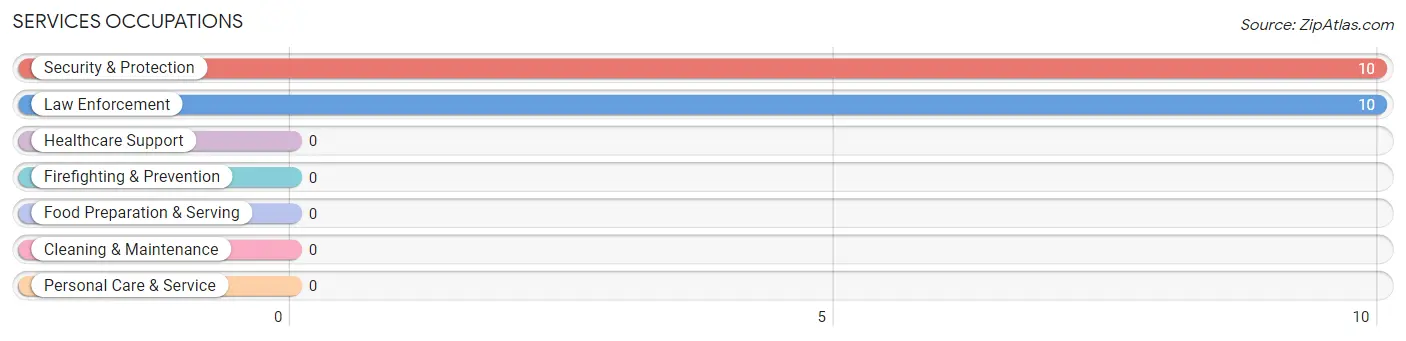
Services Occupations by Sex
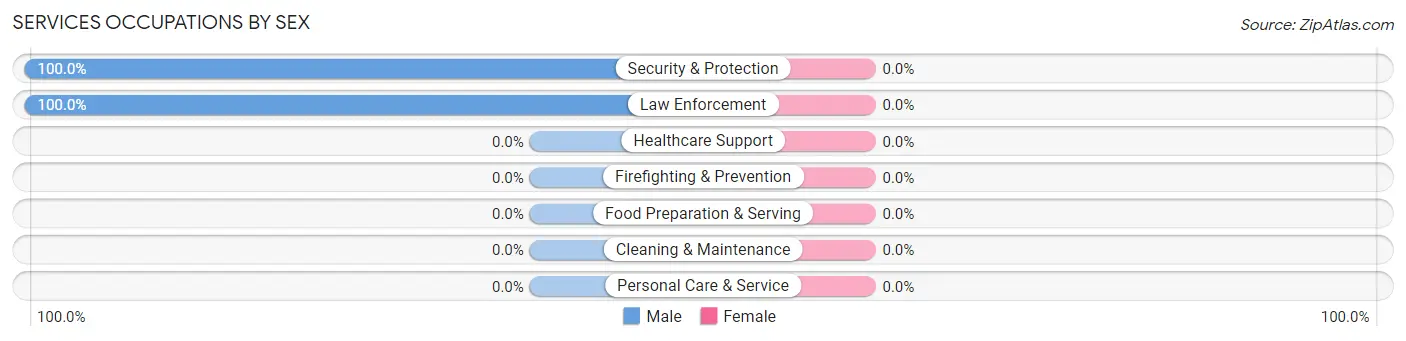
| Occupation | Male | Female |
| Healthcare Support | 0 (0.0%) | 0 (0.0%) |
| Security & Protection | 10 (100.0%) | 0 (0.0%) |
| Firefighting & Prevention | 0 (0.0%) | 0 (0.0%) |
| Law Enforcement | 10 (100.0%) | 0 (0.0%) |
| Food Preparation & Serving | 0 (0.0%) | 0 (0.0%) |
| Cleaning & Maintenance | 0 (0.0%) | 0 (0.0%) |
| Personal Care & Service | 0 (0.0%) | 0 (0.0%) |
| Total (Category) | 10 (100.0%) | 0 (0.0%) |
| Total (Overall) | 81 (76.4%) | 25 (23.6%) |
Sales and Office Occupations
The most common Sales and Office occupations in Accoville are , and Sales & Related (20 | 18.9%).
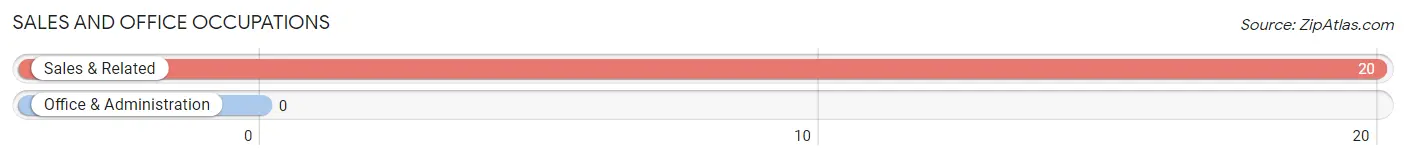
Sales and Office Occupations by Sex

| Occupation | Male | Female |
| Sales & Related | 20 (100.0%) | 0 (0.0%) |
| Office & Administration | 0 (0.0%) | 0 (0.0%) |
| Total (Category) | 20 (100.0%) | 0 (0.0%) |
| Total (Overall) | 81 (76.4%) | 25 (23.6%) |
Natural Resources, Construction and Maintenance Occupations
The most common Natural Resources, Construction and Maintenance occupations in Accoville are Construction & Extraction (15 | 14.1%), and Installation, Maintenance & Repair (9 | 8.5%).
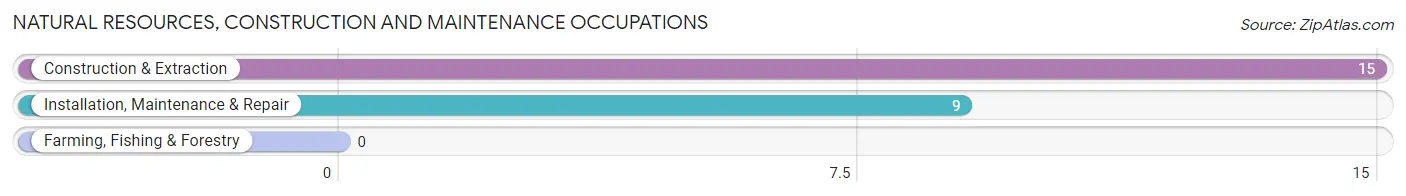
Natural Resources, Construction and Maintenance Occupations by Sex
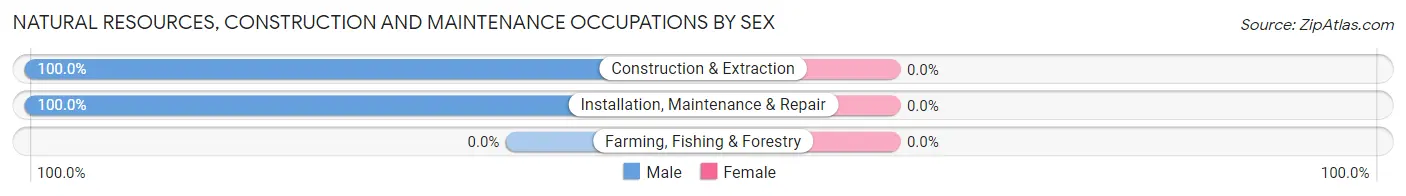
| Occupation | Male | Female |
| Farming, Fishing & Forestry | 0 (0.0%) | 0 (0.0%) |
| Construction & Extraction | 15 (100.0%) | 0 (0.0%) |
| Installation, Maintenance & Repair | 9 (100.0%) | 0 (0.0%) |
| Total (Category) | 24 (100.0%) | 0 (0.0%) |
| Total (Overall) | 81 (76.4%) | 25 (23.6%) |
Production, Transportation and Moving Occupations
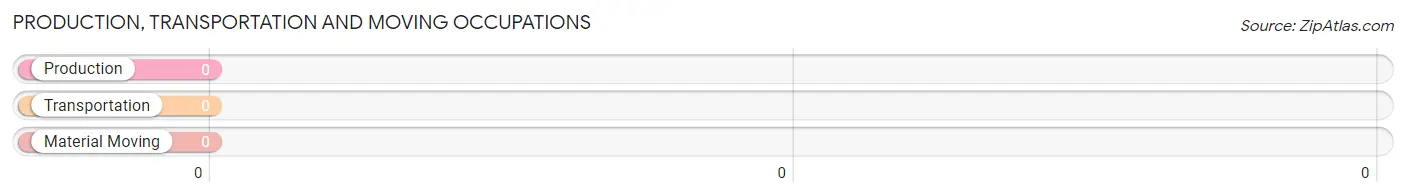
Production, Transportation and Moving Occupations by Sex
| Occupation | Male | Female |
| Production | 0 (0.0%) | 0 (0.0%) |
| Transportation | 0 (0.0%) | 0 (0.0%) |
| Material Moving | 0 (0.0%) | 0 (0.0%) |
| Total (Category) | 0 (0.0%) | 0 (0.0%) |
| Total (Overall) | 81 (76.4%) | 25 (23.6%) |
Employment Industries by Sex in Accoville
Employment Industries in Accoville
The major employment industries in Accoville include Administrative & Support (27 | 25.5%), Mining, Quarrying, & Extraction (24 | 22.6%), Health Care & Social Assistance (14 | 13.2%), Educational Services (11 | 10.4%), and Public Administration (10 | 9.4%).
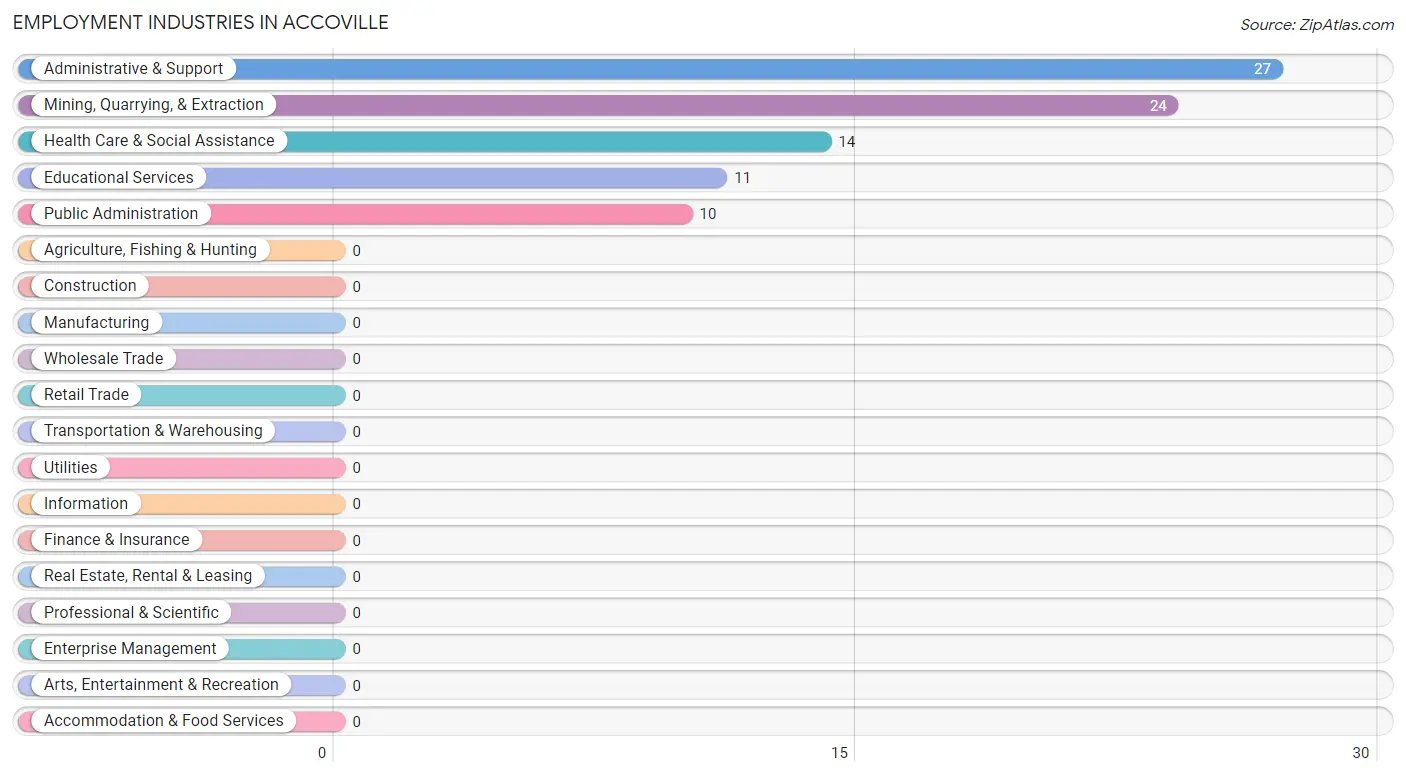
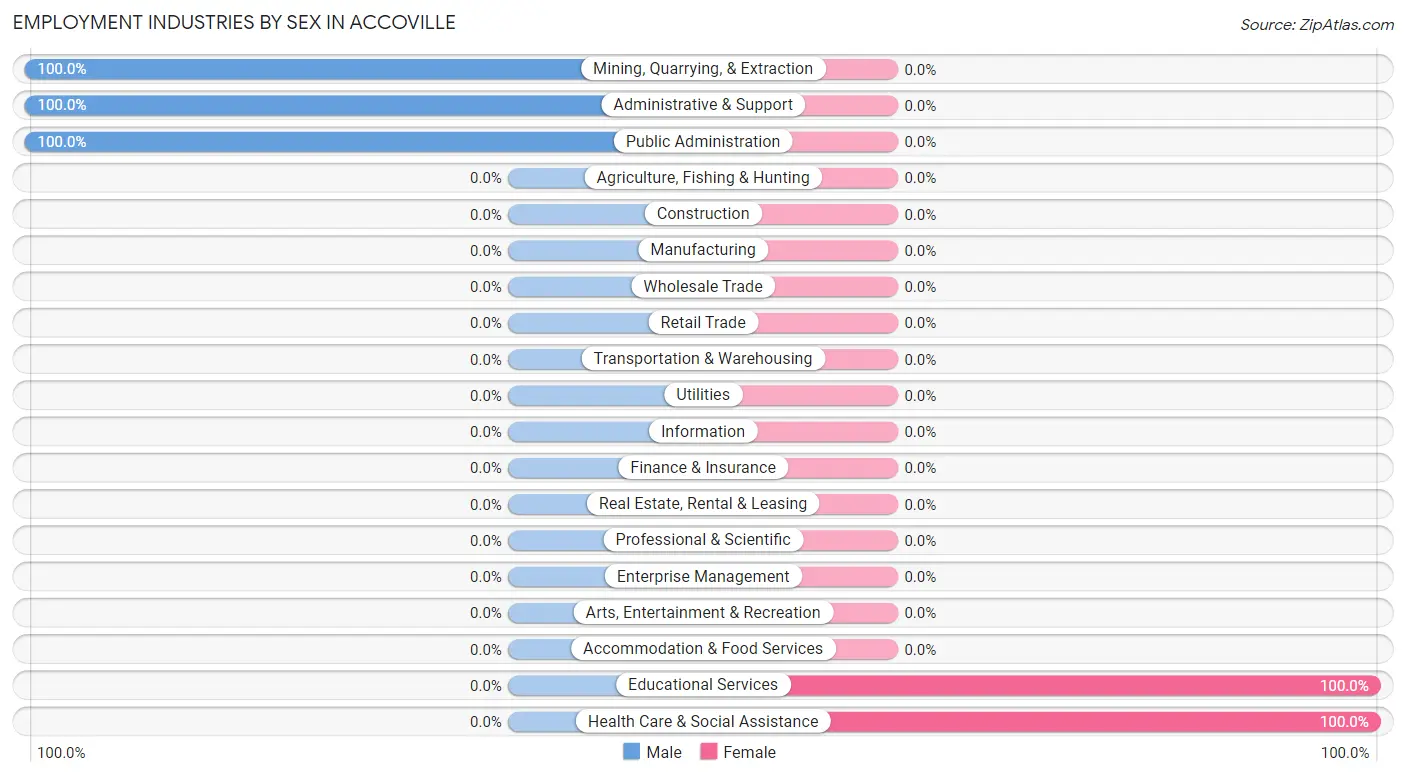
Employment Industries by Sex in Accoville
The Accoville industries that see more men than women are Mining, Quarrying, & Extraction (100.0%), Administrative & Support (100.0%), and Public Administration (100.0%), whereas the industries that tend to have a higher number of women are Educational Services (100.0%), and Health Care & Social Assistance (100.0%).
| Industry | Male | Female |
| Agriculture, Fishing & Hunting | 0 (0.0%) | 0 (0.0%) |
| Mining, Quarrying, & Extraction | 24 (100.0%) | 0 (0.0%) |
| Construction | 0 (0.0%) | 0 (0.0%) |
| Manufacturing | 0 (0.0%) | 0 (0.0%) |
| Wholesale Trade | 0 (0.0%) | 0 (0.0%) |
| Retail Trade | 0 (0.0%) | 0 (0.0%) |
| Transportation & Warehousing | 0 (0.0%) | 0 (0.0%) |
| Utilities | 0 (0.0%) | 0 (0.0%) |
| Information | 0 (0.0%) | 0 (0.0%) |
| Finance & Insurance | 0 (0.0%) | 0 (0.0%) |
| Real Estate, Rental & Leasing | 0 (0.0%) | 0 (0.0%) |
| Professional & Scientific | 0 (0.0%) | 0 (0.0%) |
| Enterprise Management | 0 (0.0%) | 0 (0.0%) |
| Administrative & Support | 27 (100.0%) | 0 (0.0%) |
| Educational Services | 0 (0.0%) | 11 (100.0%) |
| Health Care & Social Assistance | 0 (0.0%) | 14 (100.0%) |
| Arts, Entertainment & Recreation | 0 (0.0%) | 0 (0.0%) |
| Accommodation & Food Services | 0 (0.0%) | 0 (0.0%) |
| Public Administration | 10 (100.0%) | 0 (0.0%) |
| Total | 81 (76.4%) | 25 (23.6%) |
Education in Accoville
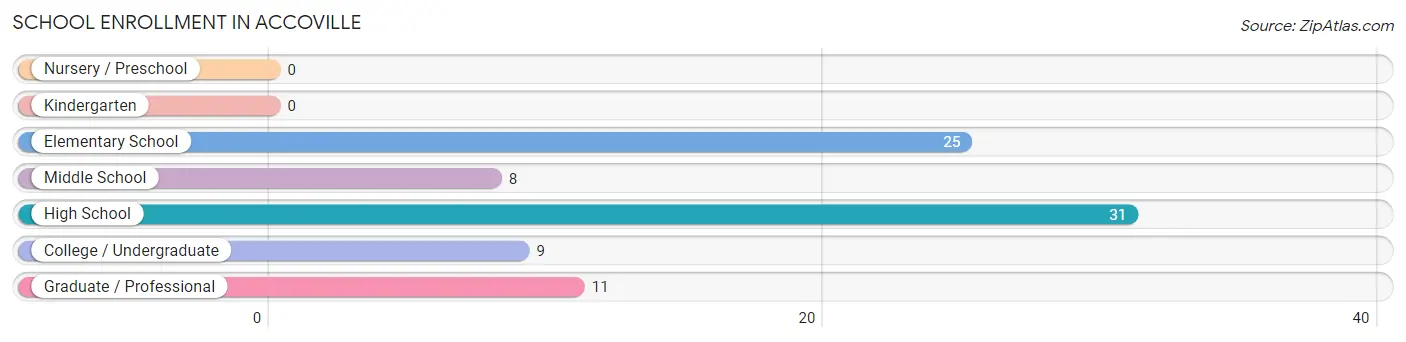
School Enrollment in Accoville
The most common levels of schooling among the 84 students in Accoville are high school (31 | 36.9%), elementary school (25 | 29.8%), and graduate / professional (11 | 13.1%).
| School Level | # Students | % Students |
| Nursery / Preschool | 0 | 0.0% |
| Kindergarten | 0 | 0.0% |
| Elementary School | 25 | 29.8% |
| Middle School | 8 | 9.5% |
| High School | 31 | 36.9% |
| College / Undergraduate | 9 | 10.7% |
| Graduate / Professional | 11 | 13.1% |
| Total | 84 | 100.0% |
School Enrollment by Age by Funding Source in Accoville
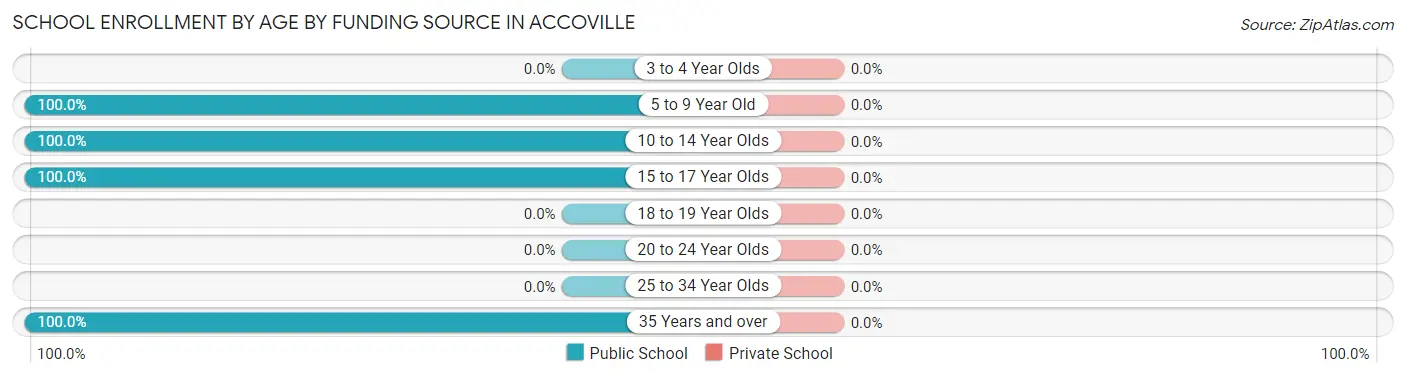
| Age Bracket | Public School | Private School |
| 3 to 4 Year Olds | 0 (0.0%) | 0 (0.0%) |
| 5 to 9 Year Old | 25 (100.0%) | 0 (0.0%) |
| 10 to 14 Year Olds | 27 (100.0%) | 0 (0.0%) |
| 15 to 17 Year Olds | 12 (100.0%) | 0 (0.0%) |
| 18 to 19 Year Olds | 0 (0.0%) | 0 (0.0%) |
| 20 to 24 Year Olds | 0 (0.0%) | 0 (0.0%) |
| 25 to 34 Year Olds | 0 (0.0%) | 0 (0.0%) |
| 35 Years and over | 20 (100.0%) | 0 (0.0%) |
| Total | 84 (100.0%) | 0 (0.0%) |
Educational Attainment by Field of Study in Accoville
Science & technology (11 | 42.3%), business (9 | 34.6%), and education (6 | 23.1%) are the most common fields of study among 26 individuals in Accoville who have obtained a bachelor's degree or higher.
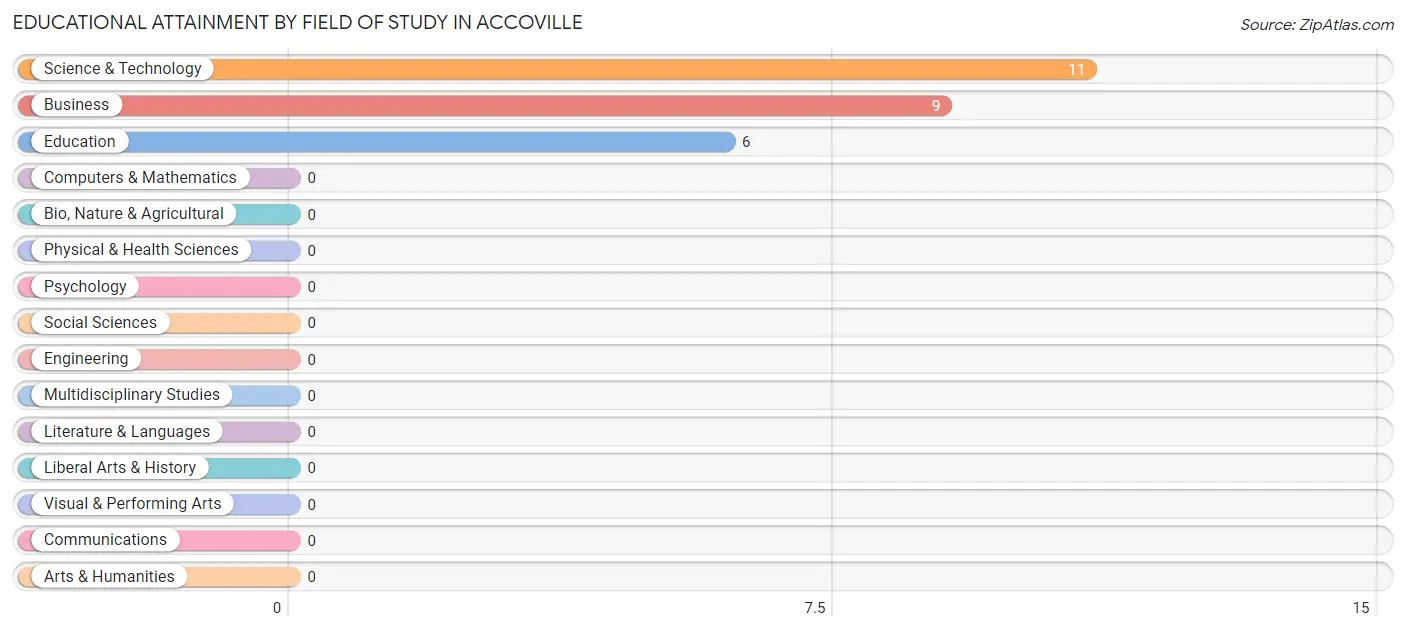
| Field of Study | # Graduates | % Graduates |
| Computers & Mathematics | 0 | 0.0% |
| Bio, Nature & Agricultural | 0 | 0.0% |
| Physical & Health Sciences | 0 | 0.0% |
| Psychology | 0 | 0.0% |
| Social Sciences | 0 | 0.0% |
| Engineering | 0 | 0.0% |
| Multidisciplinary Studies | 0 | 0.0% |
| Science & Technology | 11 | 42.3% |
| Business | 9 | 34.6% |
| Education | 6 | 23.1% |
| Literature & Languages | 0 | 0.0% |
| Liberal Arts & History | 0 | 0.0% |
| Visual & Performing Arts | 0 | 0.0% |
| Communications | 0 | 0.0% |
| Arts & Humanities | 0 | 0.0% |
| Total | 26 | 100.0% |
Transportation & Commute in Accoville
Vehicle Availability by Sex in Accoville
The most prevalent vehicle ownership categories in Accoville are males with 3 vehicles (44, accounting for 54.3%) and females with 3 vehicles (11, making up 176.0%).
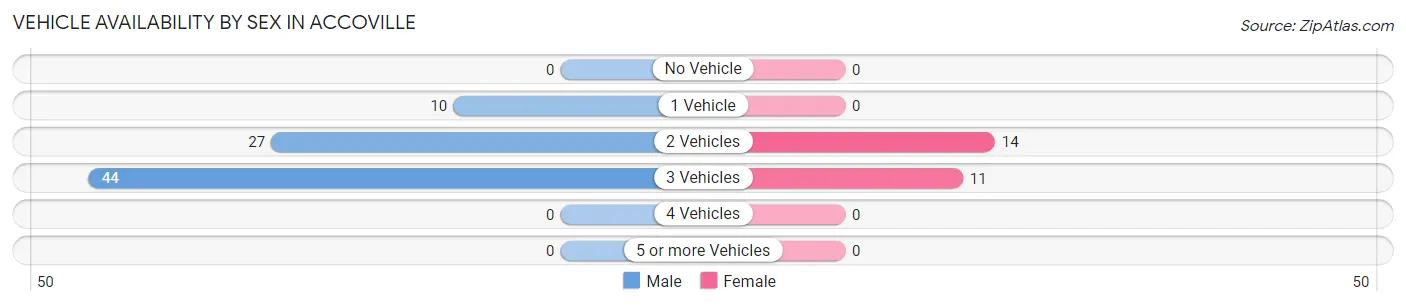
| Vehicles Available | Male | Female |
| No Vehicle | 0 (0.0%) | 0 (0.0%) |
| 1 Vehicle | 10 (12.3%) | 0 (0.0%) |
| 2 Vehicles | 27 (33.3%) | 14 (56.0%) |
| 3 Vehicles | 44 (54.3%) | 11 (44.0%) |
| 4 Vehicles | 0 (0.0%) | 0 (0.0%) |
| 5 or more Vehicles | 0 (0.0%) | 0 (0.0%) |
| Total | 81 (100.0%) | 25 (100.0%) |
Commute Time in Accoville
The most frequently occuring commute durations in Accoville are 40 to 44 minutes (27 commuters, 25.5%), 90 or more minutes (20 commuters, 18.9%), and 15 to 19 minutes (15 commuters, 14.1%).
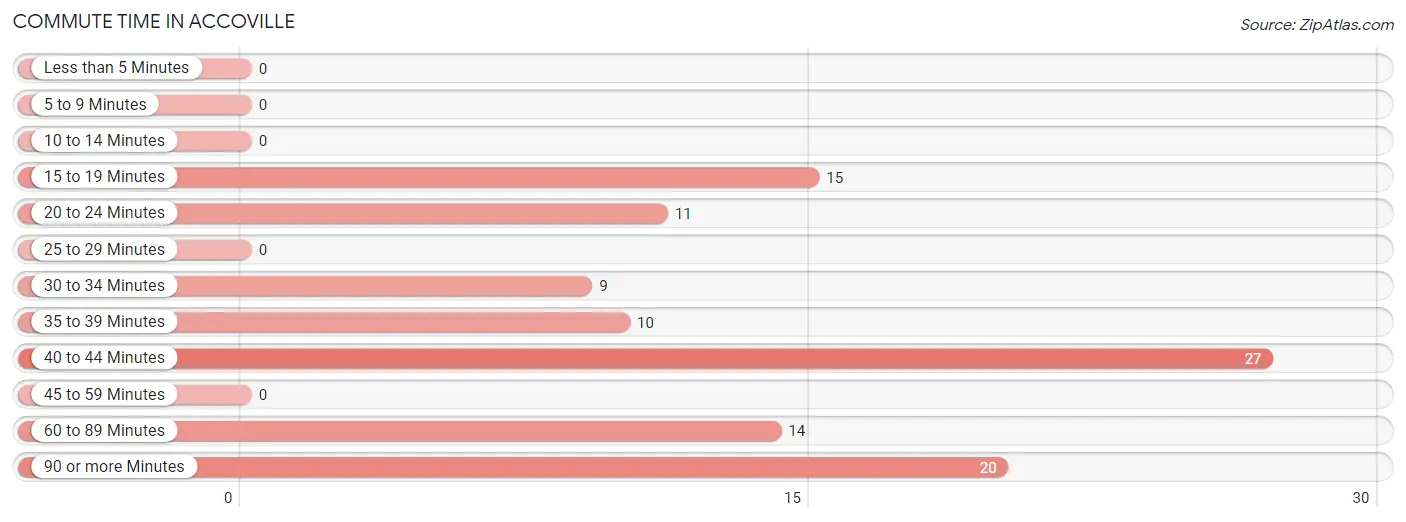
| Commute Time | # Commuters | % Commuters |
| Less than 5 Minutes | 0 | 0.0% |
| 5 to 9 Minutes | 0 | 0.0% |
| 10 to 14 Minutes | 0 | 0.0% |
| 15 to 19 Minutes | 15 | 14.1% |
| 20 to 24 Minutes | 11 | 10.4% |
| 25 to 29 Minutes | 0 | 0.0% |
| 30 to 34 Minutes | 9 | 8.5% |
| 35 to 39 Minutes | 10 | 9.4% |
| 40 to 44 Minutes | 27 | 25.5% |
| 45 to 59 Minutes | 0 | 0.0% |
| 60 to 89 Minutes | 14 | 13.2% |
| 90 or more Minutes | 20 | 18.9% |
Commute Time by Sex in Accoville
The most common commute times in Accoville are 40 to 44 minutes (27 commuters, 33.3%) for males and 60 to 89 minutes (14 commuters, 56.0%) for females.
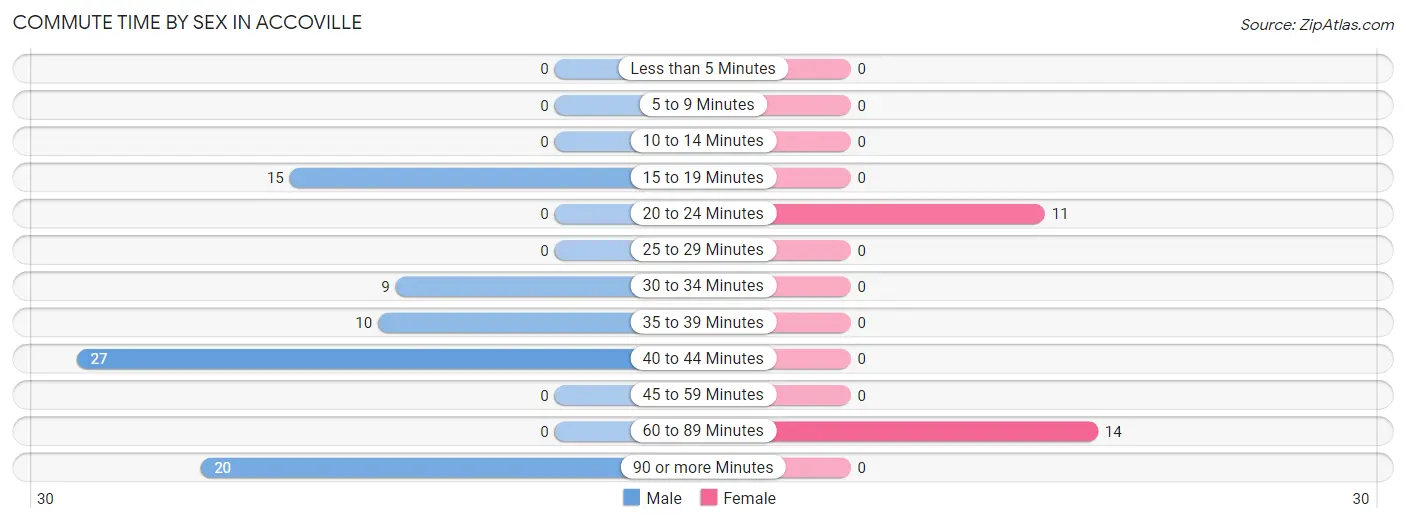
| Commute Time | Male | Female |
| Less than 5 Minutes | 0 (0.0%) | 0 (0.0%) |
| 5 to 9 Minutes | 0 (0.0%) | 0 (0.0%) |
| 10 to 14 Minutes | 0 (0.0%) | 0 (0.0%) |
| 15 to 19 Minutes | 15 (18.5%) | 0 (0.0%) |
| 20 to 24 Minutes | 0 (0.0%) | 11 (44.0%) |
| 25 to 29 Minutes | 0 (0.0%) | 0 (0.0%) |
| 30 to 34 Minutes | 9 (11.1%) | 0 (0.0%) |
| 35 to 39 Minutes | 10 (12.3%) | 0 (0.0%) |
| 40 to 44 Minutes | 27 (33.3%) | 0 (0.0%) |
| 45 to 59 Minutes | 0 (0.0%) | 0 (0.0%) |
| 60 to 89 Minutes | 0 (0.0%) | 14 (56.0%) |
| 90 or more Minutes | 20 (24.7%) | 0 (0.0%) |
Time of Departure to Work by Sex in Accoville
The most frequent times of departure to work in Accoville are 7:00 AM to 7:29 AM (29, 35.8%) for males and 6:00 AM to 6:29 AM (14, 56.0%) for females.
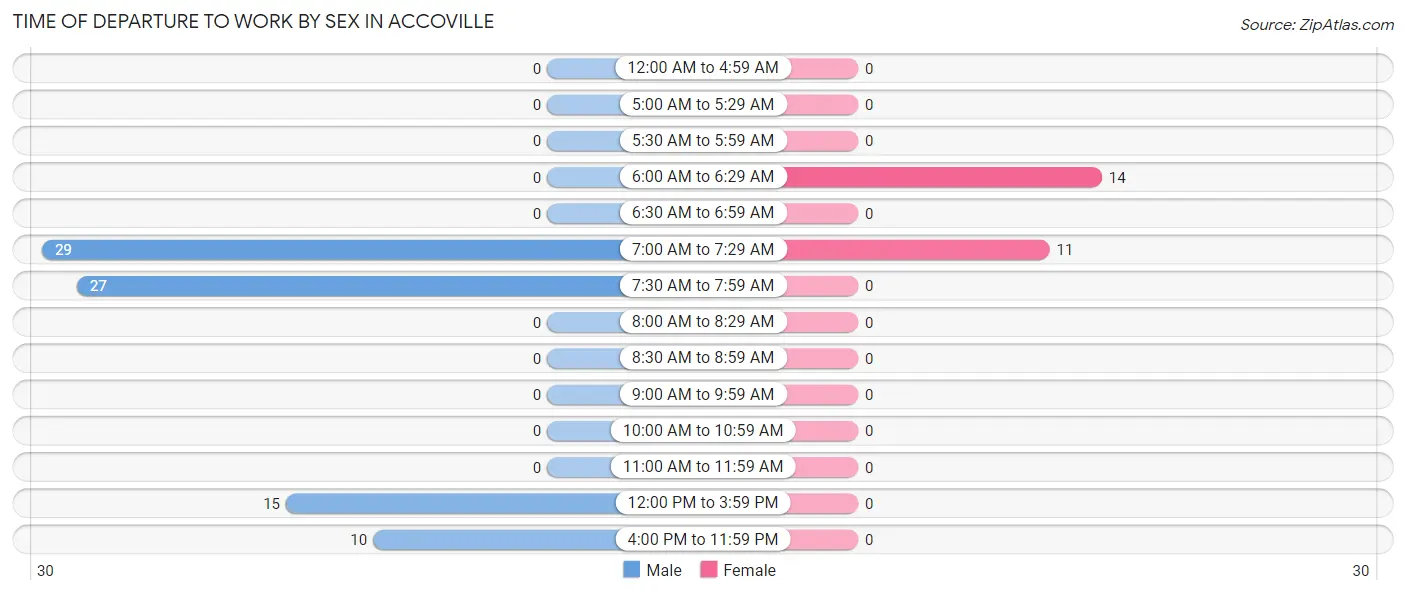
| Time of Departure | Male | Female |
| 12:00 AM to 4:59 AM | 0 (0.0%) | 0 (0.0%) |
| 5:00 AM to 5:29 AM | 0 (0.0%) | 0 (0.0%) |
| 5:30 AM to 5:59 AM | 0 (0.0%) | 0 (0.0%) |
| 6:00 AM to 6:29 AM | 0 (0.0%) | 14 (56.0%) |
| 6:30 AM to 6:59 AM | 0 (0.0%) | 0 (0.0%) |
| 7:00 AM to 7:29 AM | 29 (35.8%) | 11 (44.0%) |
| 7:30 AM to 7:59 AM | 27 (33.3%) | 0 (0.0%) |
| 8:00 AM to 8:29 AM | 0 (0.0%) | 0 (0.0%) |
| 8:30 AM to 8:59 AM | 0 (0.0%) | 0 (0.0%) |
| 9:00 AM to 9:59 AM | 0 (0.0%) | 0 (0.0%) |
| 10:00 AM to 10:59 AM | 0 (0.0%) | 0 (0.0%) |
| 11:00 AM to 11:59 AM | 0 (0.0%) | 0 (0.0%) |
| 12:00 PM to 3:59 PM | 15 (18.5%) | 0 (0.0%) |
| 4:00 PM to 11:59 PM | 10 (12.3%) | 0 (0.0%) |
| Total | 81 (100.0%) | 25 (100.0%) |
Housing Occupancy in Accoville
Occupancy by Ownership in Accoville
Of the total 216 dwellings in Accoville, owner-occupied units account for 174 (80.6%), while renter-occupied units make up 42 (19.4%).
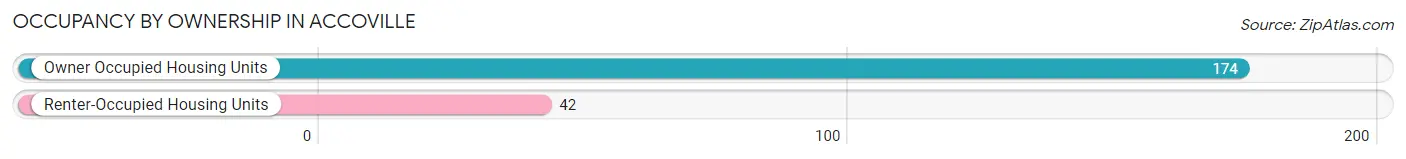
| Occupancy | # Housing Units | % Housing Units |
| Owner Occupied Housing Units | 174 | 80.6% |
| Renter-Occupied Housing Units | 42 | 19.4% |
| Total Occupied Housing Units | 216 | 100.0% |
Occupancy by Household Size in Accoville
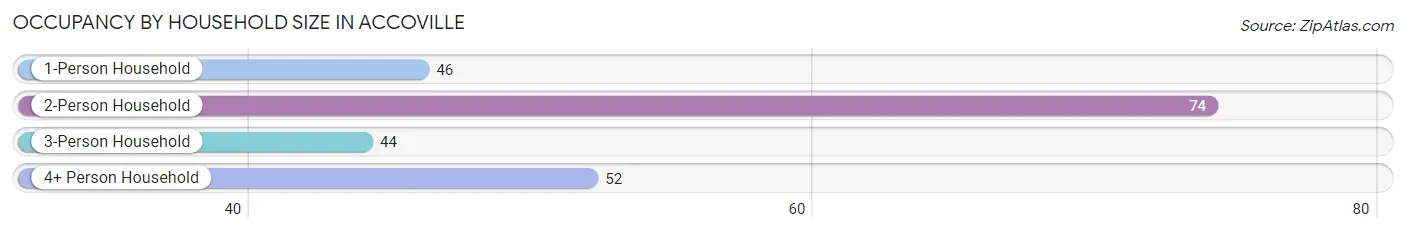
| Household Size | # Housing Units | % Housing Units |
| 1-Person Household | 46 | 21.3% |
| 2-Person Household | 74 | 34.3% |
| 3-Person Household | 44 | 20.4% |
| 4+ Person Household | 52 | 24.1% |
| Total Housing Units | 216 | 100.0% |
Occupancy by Ownership by Household Size in Accoville
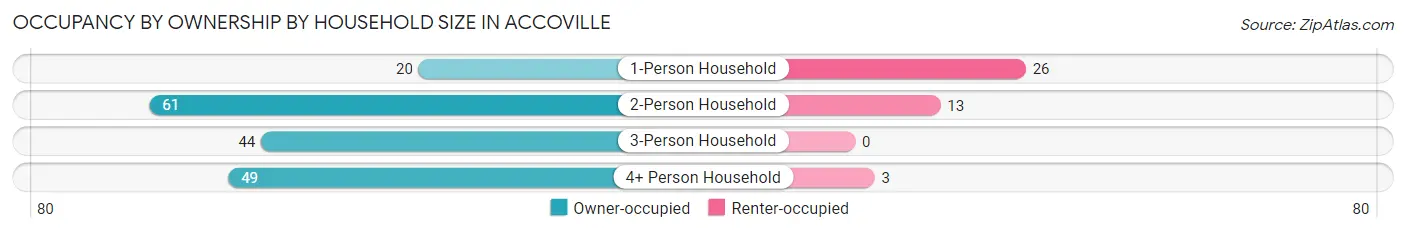
| Household Size | Owner-occupied | Renter-occupied |
| 1-Person Household | 20 (43.5%) | 26 (56.5%) |
| 2-Person Household | 61 (82.4%) | 13 (17.6%) |
| 3-Person Household | 44 (100.0%) | 0 (0.0%) |
| 4+ Person Household | 49 (94.2%) | 3 (5.8%) |
| Total Housing Units | 174 (80.6%) | 42 (19.4%) |
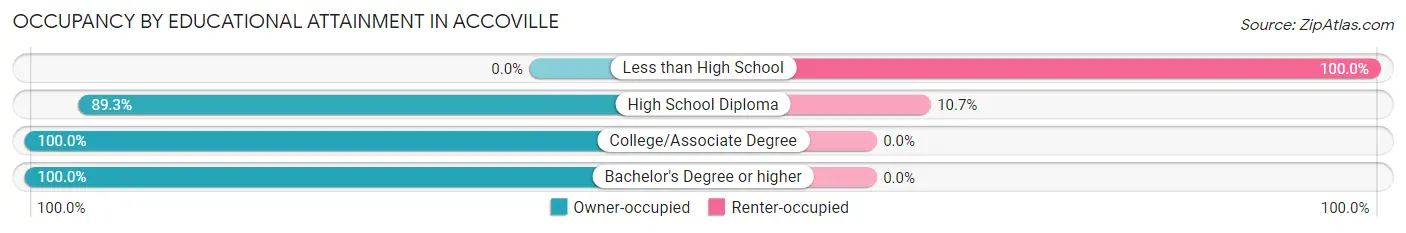
Occupancy by Educational Attainment in Accoville
| Household Size | Owner-occupied | Renter-occupied |
| Less than High School | 0 (0.0%) | 24 (100.0%) |
| High School Diploma | 150 (89.3%) | 18 (10.7%) |
| College/Associate Degree | 9 (100.0%) | 0 (0.0%) |
| Bachelor's Degree or higher | 15 (100.0%) | 0 (0.0%) |
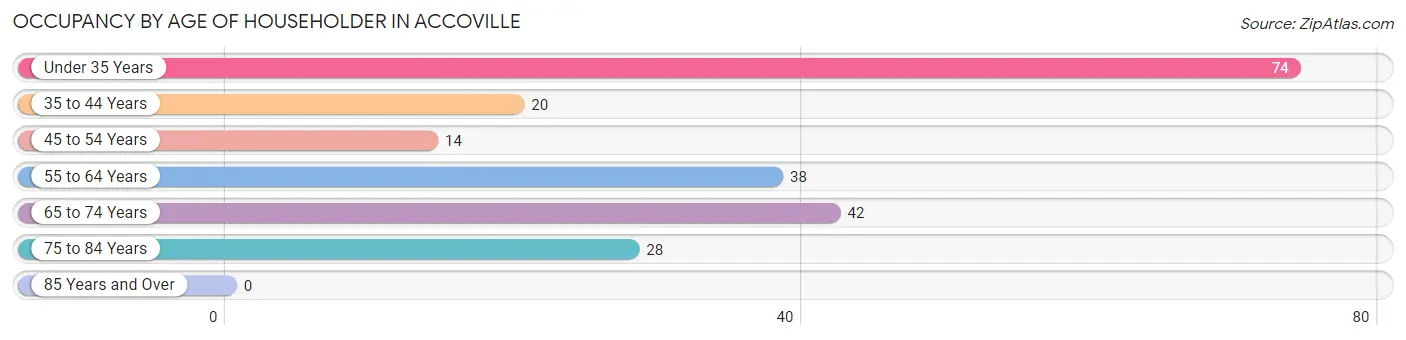
Occupancy by Age of Householder in Accoville
| Age Bracket | # Households | % Households |
| Under 35 Years | 74 | 34.3% |
| 35 to 44 Years | 20 | 9.3% |
| 45 to 54 Years | 14 | 6.5% |
| 55 to 64 Years | 38 | 17.6% |
| 65 to 74 Years | 42 | 19.4% |
| 75 to 84 Years | 28 | 13.0% |
| 85 Years and Over | 0 | 0.0% |
| Total | 216 | 100.0% |
Housing Finances in Accoville
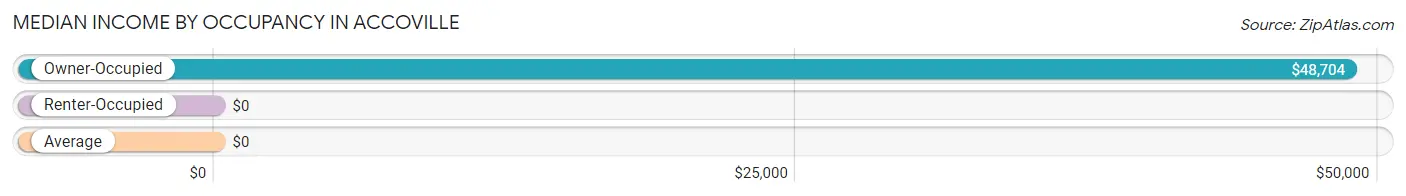
Median Income by Occupancy in Accoville
| Occupancy Type | # Households | Median Income |
| Owner-Occupied | 174 (80.6%) | $48,704 |
| Renter-Occupied | 42 (19.4%) | $0 |
| Average | 216 (100.0%) | $0 |
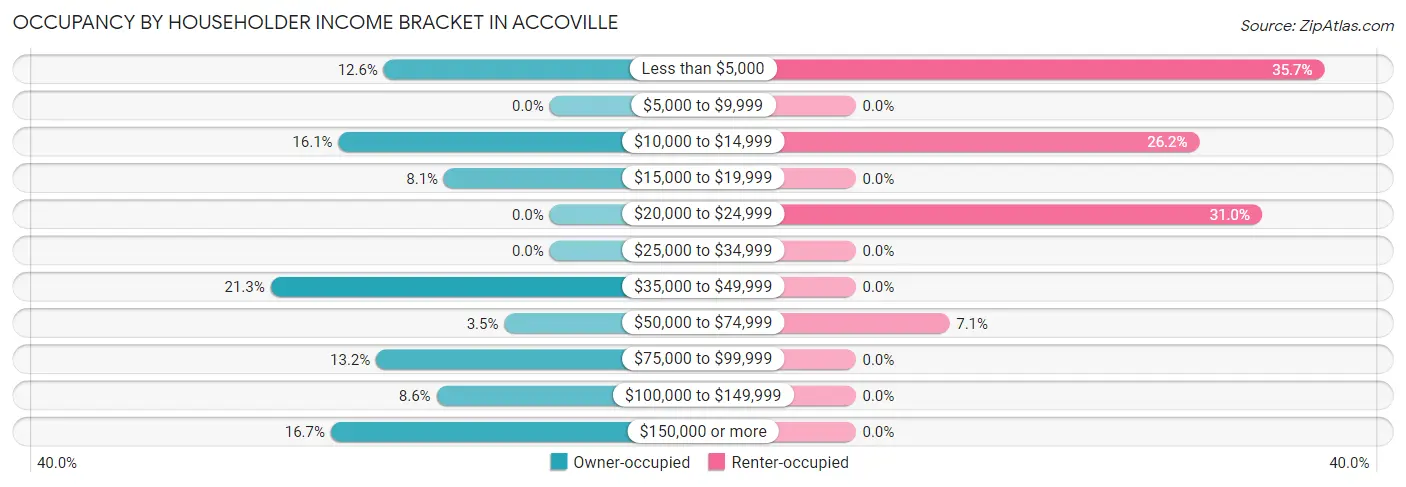
Occupancy by Householder Income Bracket in Accoville
| Income Bracket | Owner-occupied | Renter-occupied |
| Less than $5,000 | 22 (12.6%) | 15 (35.7%) |
| $5,000 to $9,999 | 0 (0.0%) | 0 (0.0%) |
| $10,000 to $14,999 | 28 (16.1%) | 11 (26.2%) |
| $15,000 to $19,999 | 14 (8.1%) | 0 (0.0%) |
| $20,000 to $24,999 | 0 (0.0%) | 13 (30.9%) |
| $25,000 to $34,999 | 0 (0.0%) | 0 (0.0%) |
| $35,000 to $49,999 | 37 (21.3%) | 0 (0.0%) |
| $50,000 to $74,999 | 6 (3.5%) | 3 (7.1%) |
| $75,000 to $99,999 | 23 (13.2%) | 0 (0.0%) |
| $100,000 to $149,999 | 15 (8.6%) | 0 (0.0%) |
| $150,000 or more | 29 (16.7%) | 0 (0.0%) |
| Total | 174 (100.0%) | 42 (100.0%) |
Monthly Housing Cost Tiers in Accoville
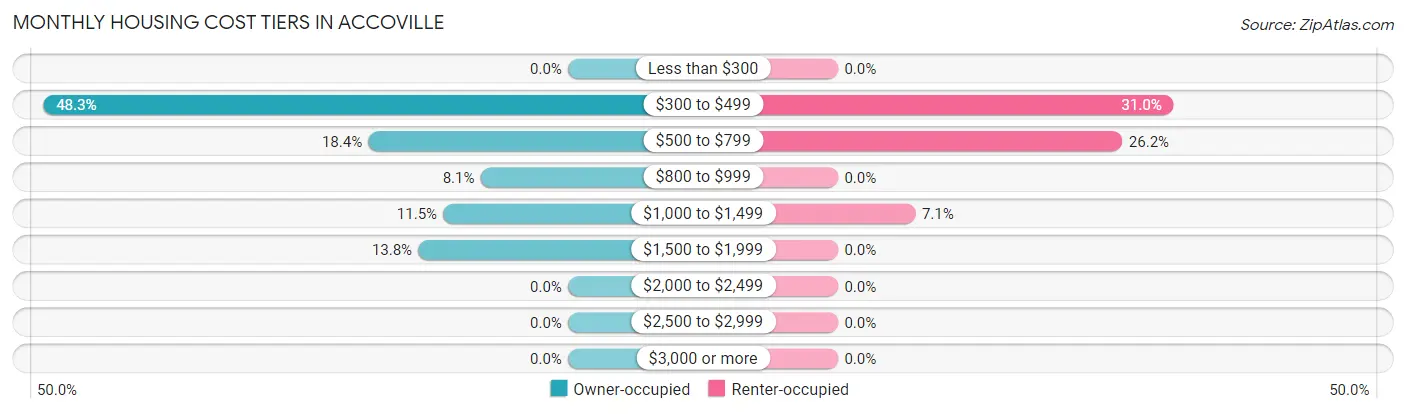
| Monthly Cost | Owner-occupied | Renter-occupied |
| Less than $300 | 0 (0.0%) | 0 (0.0%) |
| $300 to $499 | 84 (48.3%) | 13 (30.9%) |
| $500 to $799 | 32 (18.4%) | 11 (26.2%) |
| $800 to $999 | 14 (8.1%) | 0 (0.0%) |
| $1,000 to $1,499 | 20 (11.5%) | 3 (7.1%) |
| $1,500 to $1,999 | 24 (13.8%) | 0 (0.0%) |
| $2,000 to $2,499 | 0 (0.0%) | 0 (0.0%) |
| $2,500 to $2,999 | 0 (0.0%) | 0 (0.0%) |
| $3,000 or more | 0 (0.0%) | 0 (0.0%) |
| Total | 174 (100.0%) | 42 (100.0%) |
Physical Housing Characteristics in Accoville
Housing Structures in Accoville
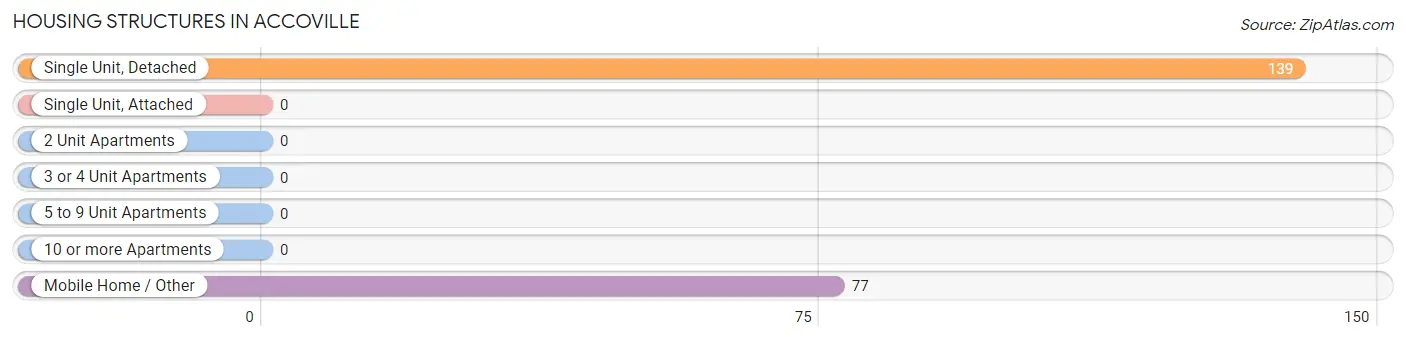
| Structure Type | # Housing Units | % Housing Units |
| Single Unit, Detached | 139 | 64.3% |
| Single Unit, Attached | 0 | 0.0% |
| 2 Unit Apartments | 0 | 0.0% |
| 3 or 4 Unit Apartments | 0 | 0.0% |
| 5 to 9 Unit Apartments | 0 | 0.0% |
| 10 or more Apartments | 0 | 0.0% |
| Mobile Home / Other | 77 | 35.6% |
| Total | 216 | 100.0% |
Housing Structures by Occupancy in Accoville
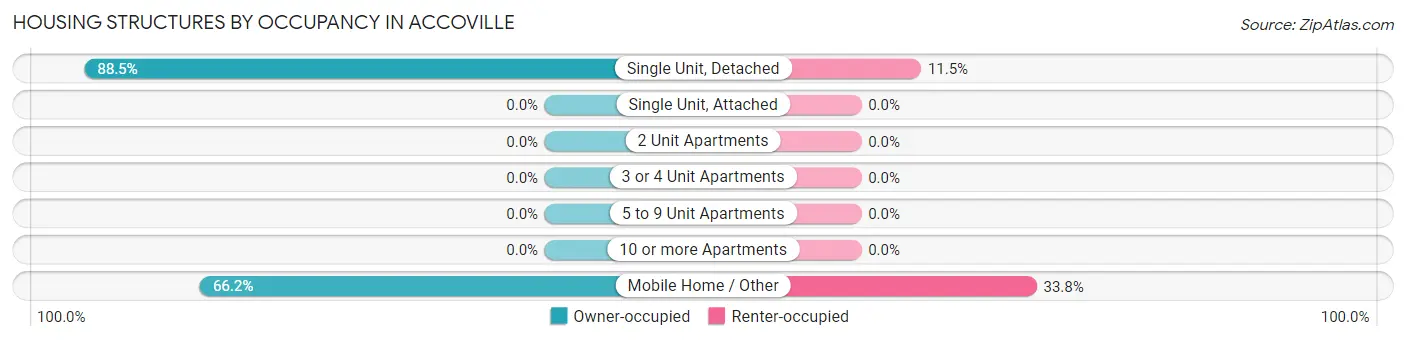
| Structure Type | Owner-occupied | Renter-occupied |
| Single Unit, Detached | 123 (88.5%) | 16 (11.5%) |
| Single Unit, Attached | 0 (0.0%) | 0 (0.0%) |
| 2 Unit Apartments | 0 (0.0%) | 0 (0.0%) |
| 3 or 4 Unit Apartments | 0 (0.0%) | 0 (0.0%) |
| 5 to 9 Unit Apartments | 0 (0.0%) | 0 (0.0%) |
| 10 or more Apartments | 0 (0.0%) | 0 (0.0%) |
| Mobile Home / Other | 51 (66.2%) | 26 (33.8%) |
| Total | 174 (80.6%) | 42 (19.4%) |
Housing Structures by Number of Rooms in Accoville
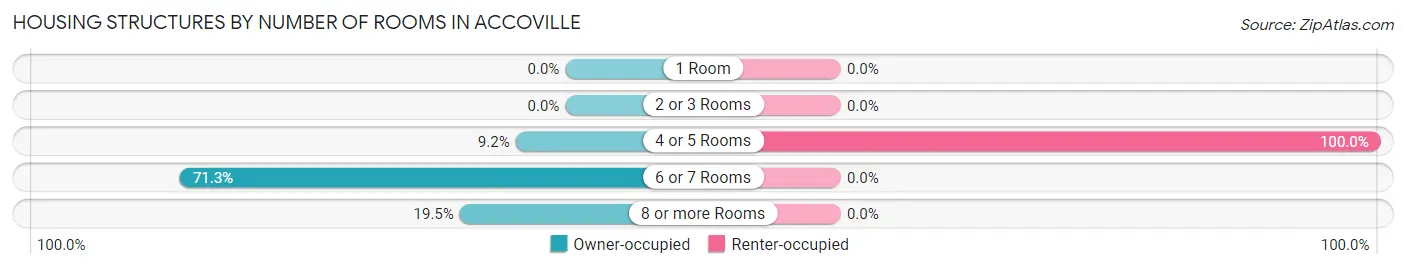
| Number of Rooms | Owner-occupied | Renter-occupied |
| 1 Room | 0 (0.0%) | 0 (0.0%) |
| 2 or 3 Rooms | 0 (0.0%) | 0 (0.0%) |
| 4 or 5 Rooms | 16 (9.2%) | 42 (100.0%) |
| 6 or 7 Rooms | 124 (71.3%) | 0 (0.0%) |
| 8 or more Rooms | 34 (19.5%) | 0 (0.0%) |
| Total | 174 (100.0%) | 42 (100.0%) |
Housing Structure by Heating Type in Accoville
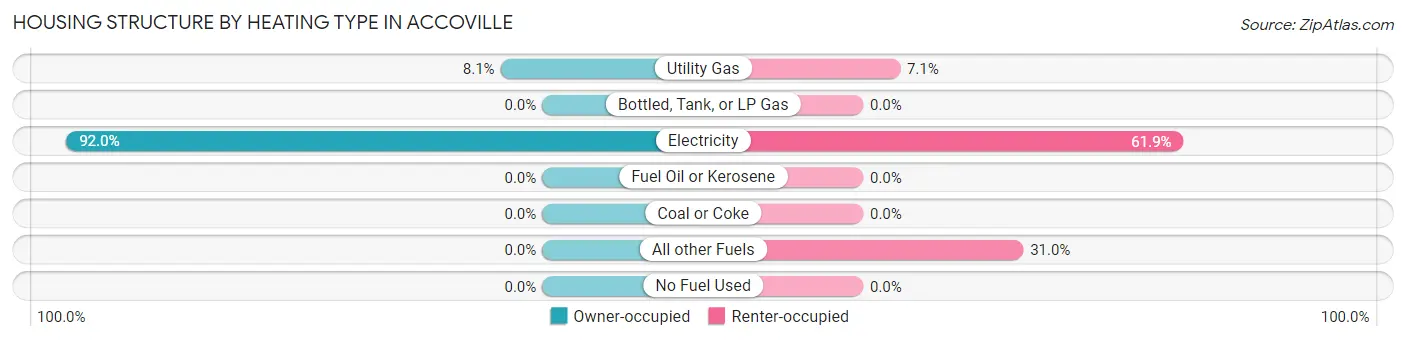
| Heating Type | Owner-occupied | Renter-occupied |
| Utility Gas | 14 (8.1%) | 3 (7.1%) |
| Bottled, Tank, or LP Gas | 0 (0.0%) | 0 (0.0%) |
| Electricity | 160 (91.9%) | 26 (61.9%) |
| Fuel Oil or Kerosene | 0 (0.0%) | 0 (0.0%) |
| Coal or Coke | 0 (0.0%) | 0 (0.0%) |
| All other Fuels | 0 (0.0%) | 13 (30.9%) |
| No Fuel Used | 0 (0.0%) | 0 (0.0%) |
| Total | 174 (100.0%) | 42 (100.0%) |
Household Vehicle Usage in Accoville
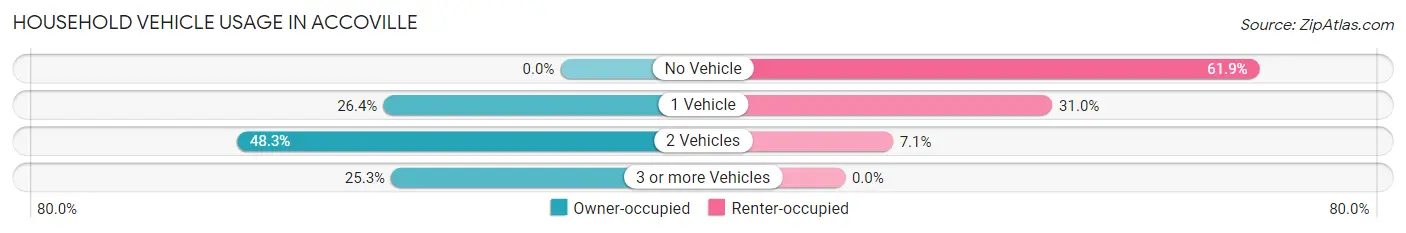
| Vehicles per Household | Owner-occupied | Renter-occupied |
| No Vehicle | 0 (0.0%) | 26 (61.9%) |
| 1 Vehicle | 46 (26.4%) | 13 (30.9%) |
| 2 Vehicles | 84 (48.3%) | 3 (7.1%) |
| 3 or more Vehicles | 44 (25.3%) | 0 (0.0%) |
| Total | 174 (100.0%) | 42 (100.0%) |
Real Estate & Mortgages in Accoville
Real Estate and Mortgage Overview in Accoville
| Characteristic | Without Mortgage | With Mortgage |
| Housing Units | 116 | 58 |
| Median Property Value | $78,100 | $150,000 |
| Median Household Income | - | - |
| Monthly Housing Costs | $438 | $0 |
| Real Estate Taxes | $346 | $0 |
Property Value by Mortgage Status in Accoville
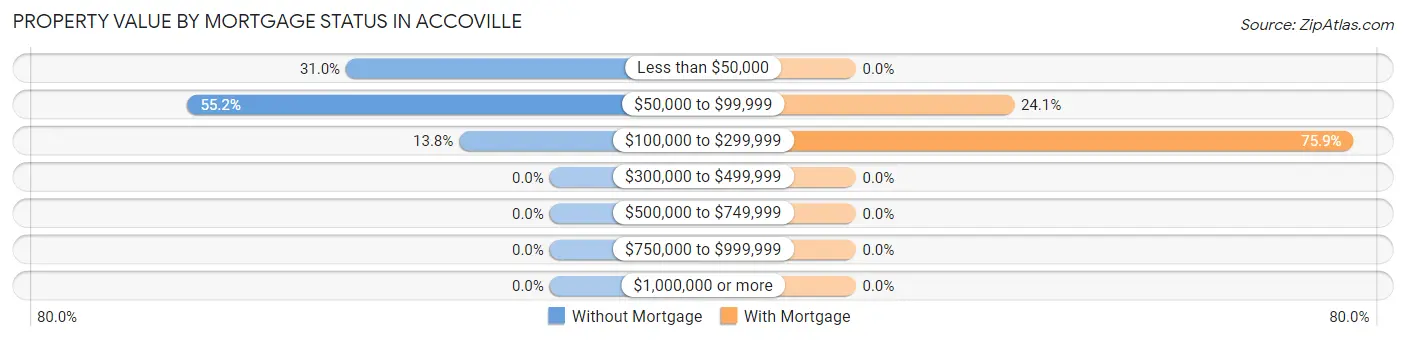
| Property Value | Without Mortgage | With Mortgage |
| Less than $50,000 | 36 (31.0%) | 0 (0.0%) |
| $50,000 to $99,999 | 64 (55.2%) | 14 (24.1%) |
| $100,000 to $299,999 | 16 (13.8%) | 44 (75.9%) |
| $300,000 to $499,999 | 0 (0.0%) | 0 (0.0%) |
| $500,000 to $749,999 | 0 (0.0%) | 0 (0.0%) |
| $750,000 to $999,999 | 0 (0.0%) | 0 (0.0%) |
| $1,000,000 or more | 0 (0.0%) | 0 (0.0%) |
| Total | 116 (100.0%) | 58 (100.0%) |
Household Income by Mortgage Status in Accoville
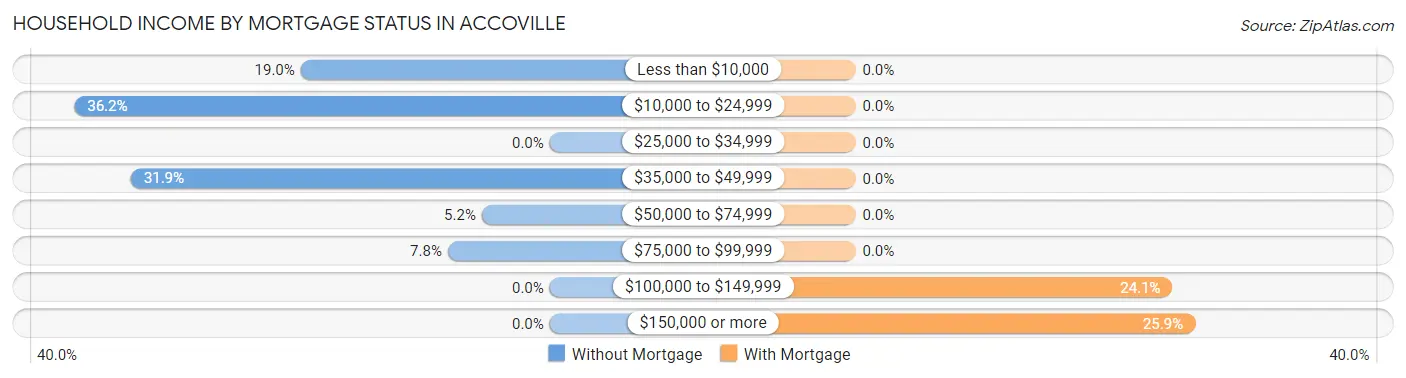
| Household Income | Without Mortgage | With Mortgage |
| Less than $10,000 | 22 (19.0%) | 0 (0.0%) |
| $10,000 to $24,999 | 42 (36.2%) | 0 (0.0%) |
| $25,000 to $34,999 | 0 (0.0%) | 0 (0.0%) |
| $35,000 to $49,999 | 37 (31.9%) | 0 (0.0%) |
| $50,000 to $74,999 | 6 (5.2%) | 0 (0.0%) |
| $75,000 to $99,999 | 9 (7.8%) | 0 (0.0%) |
| $100,000 to $149,999 | 0 (0.0%) | 14 (24.1%) |
| $150,000 or more | 0 (0.0%) | 15 (25.9%) |
| Total | 116 (100.0%) | 58 (100.0%) |
Property Value to Household Income Ratio in Accoville
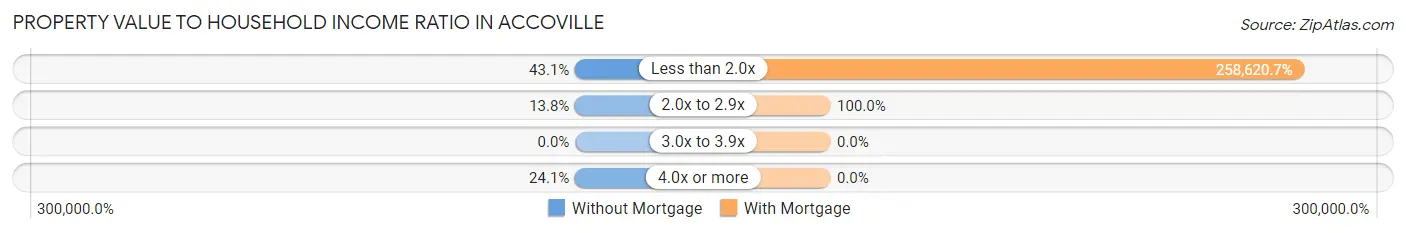
| Value-to-Income Ratio | Without Mortgage | With Mortgage |
| Less than 2.0x | 50 (43.1%) | 150,000 (258,620.7%) |
| 2.0x to 2.9x | 16 (13.8%) | 58 (100.0%) |
| 3.0x to 3.9x | 0 (0.0%) | 0 (0.0%) |
| 4.0x or more | 28 (24.1%) | 0 (0.0%) |
| Total | 116 (100.0%) | 58 (100.0%) |
Real Estate Taxes by Mortgage Status in Accoville
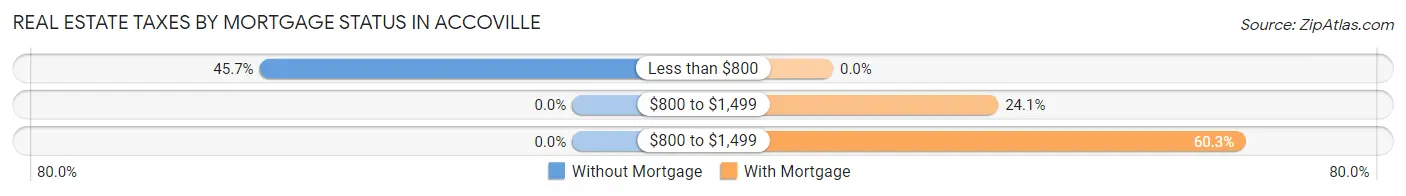
| Property Taxes | Without Mortgage | With Mortgage |
| Less than $800 | 53 (45.7%) | 0 (0.0%) |
| $800 to $1,499 | 0 (0.0%) | 14 (24.1%) |
| $800 to $1,499 | 0 (0.0%) | 35 (60.3%) |
| Total | 116 (100.0%) | 58 (100.0%) |
Health & Disability in Accoville
Health Insurance Coverage by Age in Accoville
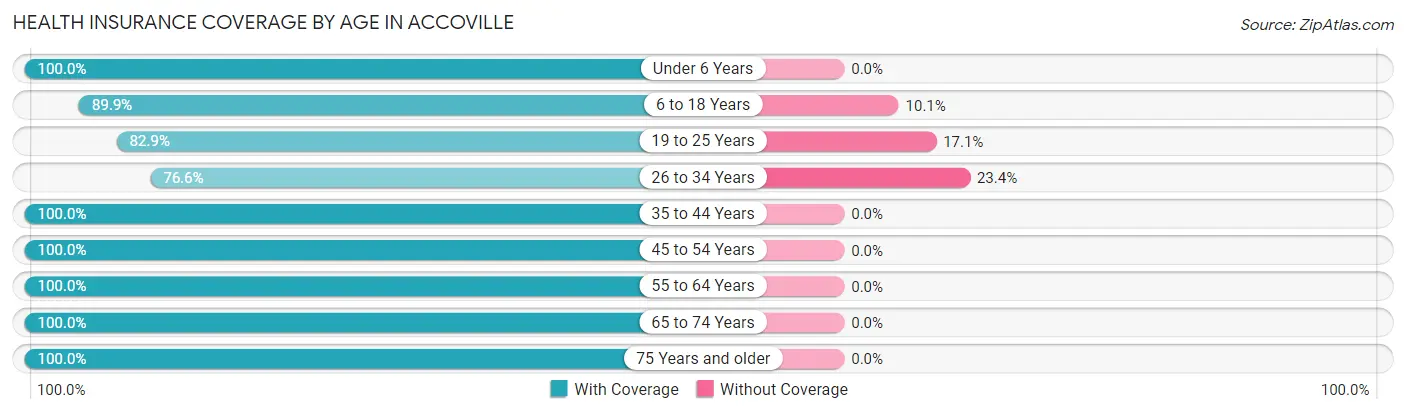
| Age Bracket | With Coverage | Without Coverage |
| Under 6 Years | 104 (100.0%) | 0 (0.0%) |
| 6 to 18 Years | 71 (89.9%) | 8 (10.1%) |
| 19 to 25 Years | 58 (82.9%) | 12 (17.1%) |
| 26 to 34 Years | 49 (76.6%) | 15 (23.4%) |
| 35 to 44 Years | 64 (100.0%) | 0 (0.0%) |
| 45 to 54 Years | 35 (100.0%) | 0 (0.0%) |
| 55 to 64 Years | 101 (100.0%) | 0 (0.0%) |
| 65 to 74 Years | 51 (100.0%) | 0 (0.0%) |
| 75 Years and older | 28 (100.0%) | 0 (0.0%) |
| Total | 561 (94.1%) | 35 (5.9%) |
Health Insurance Coverage by Citizenship Status in Accoville
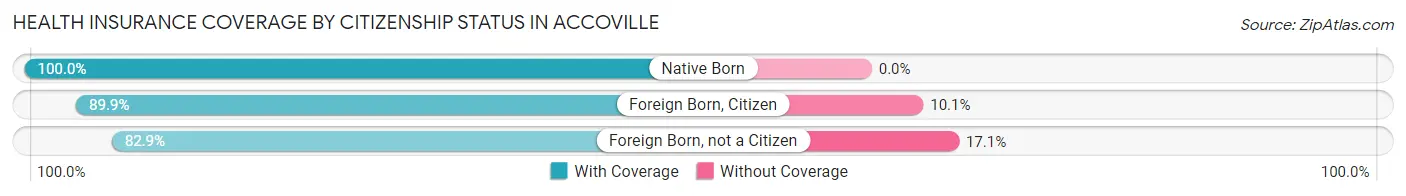
| Citizenship Status | With Coverage | Without Coverage |
| Native Born | 104 (100.0%) | 0 (0.0%) |
| Foreign Born, Citizen | 71 (89.9%) | 8 (10.1%) |
| Foreign Born, not a Citizen | 58 (82.9%) | 12 (17.1%) |
Health Insurance Coverage by Household Income in Accoville
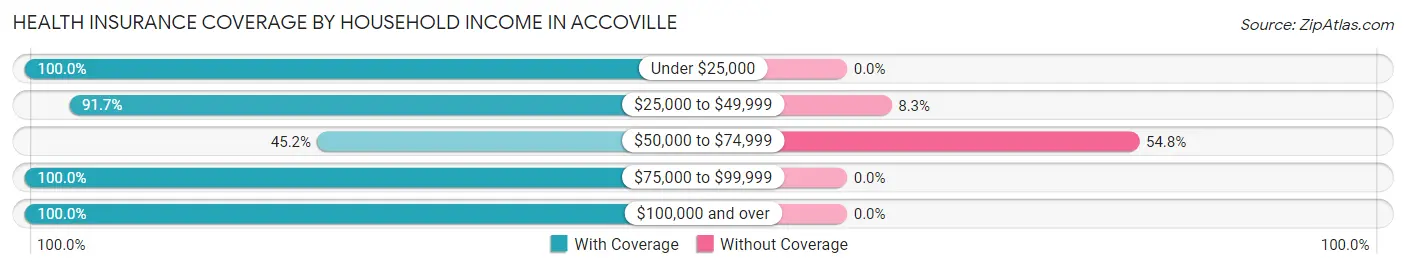
| Household Income | With Coverage | Without Coverage |
| Under $25,000 | 227 (100.0%) | 0 (0.0%) |
| $25,000 to $49,999 | 132 (91.7%) | 12 (8.3%) |
| $50,000 to $74,999 | 19 (45.2%) | 23 (54.8%) |
| $75,000 to $99,999 | 46 (100.0%) | 0 (0.0%) |
| $100,000 and over | 137 (100.0%) | 0 (0.0%) |
Public vs Private Health Insurance Coverage by Age in Accoville
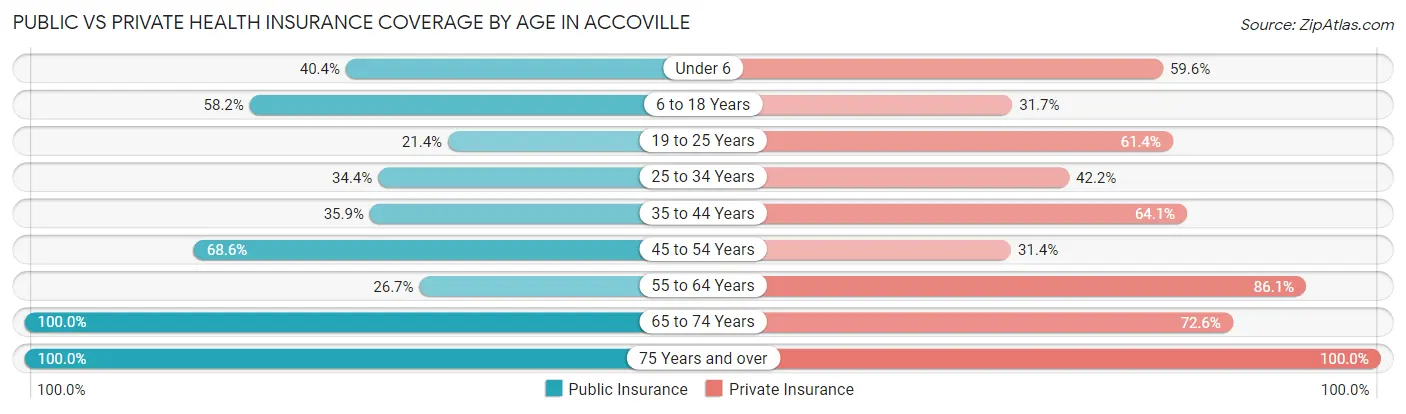
| Age Bracket | Public Insurance | Private Insurance |
| Under 6 | 42 (40.4%) | 62 (59.6%) |
| 6 to 18 Years | 46 (58.2%) | 25 (31.7%) |
| 19 to 25 Years | 15 (21.4%) | 43 (61.4%) |
| 25 to 34 Years | 22 (34.4%) | 27 (42.2%) |
| 35 to 44 Years | 23 (35.9%) | 41 (64.1%) |
| 45 to 54 Years | 24 (68.6%) | 11 (31.4%) |
| 55 to 64 Years | 27 (26.7%) | 87 (86.1%) |
| 65 to 74 Years | 51 (100.0%) | 37 (72.6%) |
| 75 Years and over | 28 (100.0%) | 28 (100.0%) |
| Total | 278 (46.6%) | 361 (60.6%) |
Disability Status by Sex by Age in Accoville
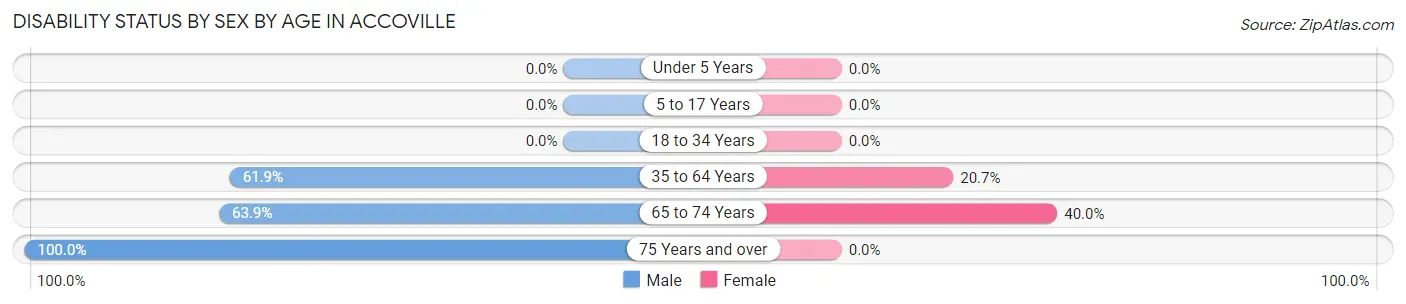
| Age Bracket | Male | Female |
| Under 5 Years | 0 (0.0%) | 0 (0.0%) |
| 5 to 17 Years | 0 (0.0%) | 0 (0.0%) |
| 18 to 34 Years | 0 (0.0%) | 0 (0.0%) |
| 35 to 64 Years | 52 (61.9%) | 24 (20.7%) |
| 65 to 74 Years | 23 (63.9%) | 6 (40.0%) |
| 75 Years and over | 28 (100.0%) | 0 (0.0%) |
Disability Class by Sex by Age in Accoville
Disability Class: Hearing Difficulty
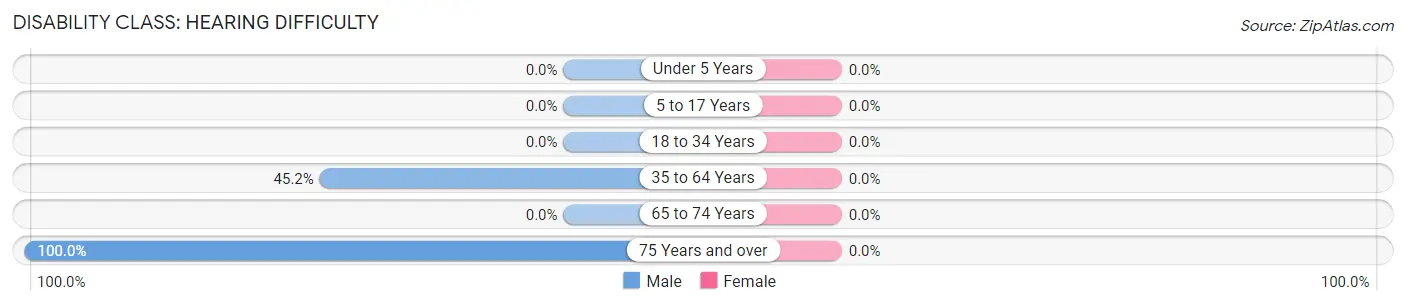
| Age Bracket | Male | Female |
| Under 5 Years | 0 (0.0%) | 0 (0.0%) |
| 5 to 17 Years | 0 (0.0%) | 0 (0.0%) |
| 18 to 34 Years | 0 (0.0%) | 0 (0.0%) |
| 35 to 64 Years | 38 (45.2%) | 0 (0.0%) |
| 65 to 74 Years | 0 (0.0%) | 0 (0.0%) |
| 75 Years and over | 28 (100.0%) | 0 (0.0%) |
Disability Class: Vision Difficulty
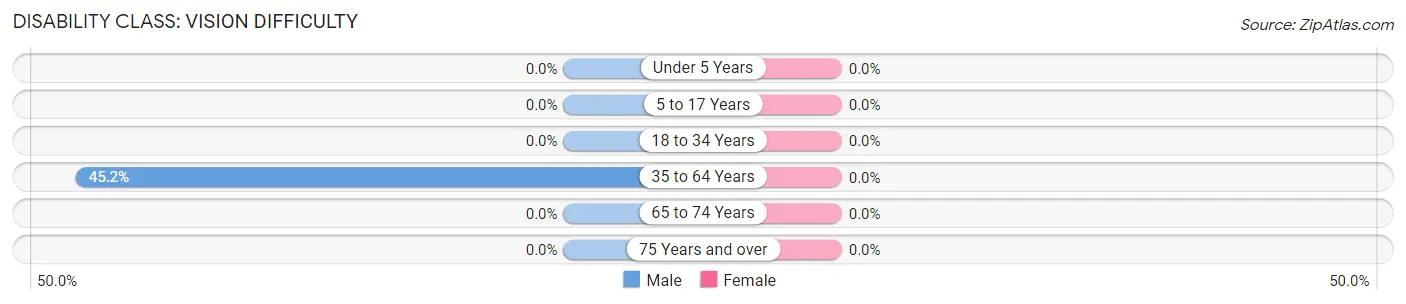
| Age Bracket | Male | Female |
| Under 5 Years | 0 (0.0%) | 0 (0.0%) |
| 5 to 17 Years | 0 (0.0%) | 0 (0.0%) |
| 18 to 34 Years | 0 (0.0%) | 0 (0.0%) |
| 35 to 64 Years | 38 (45.2%) | 0 (0.0%) |
| 65 to 74 Years | 0 (0.0%) | 0 (0.0%) |
| 75 Years and over | 0 (0.0%) | 0 (0.0%) |
Disability Class: Cognitive Difficulty
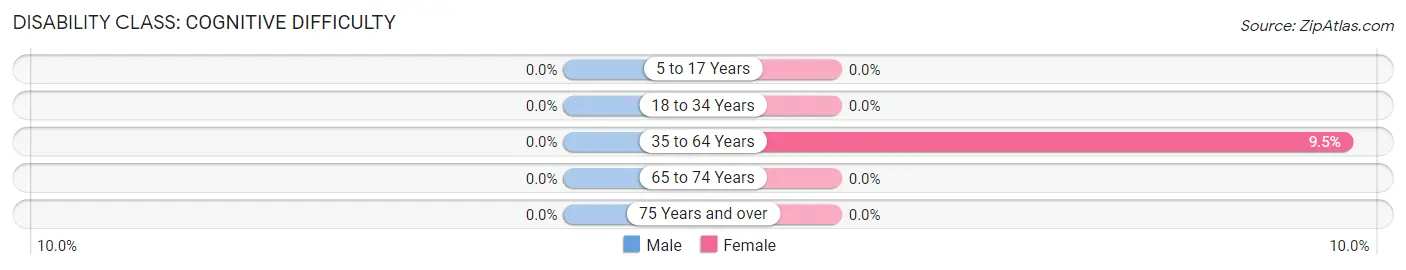
| Age Bracket | Male | Female |
| 5 to 17 Years | 0 (0.0%) | 0 (0.0%) |
| 18 to 34 Years | 0 (0.0%) | 0 (0.0%) |
| 35 to 64 Years | 0 (0.0%) | 11 (9.5%) |
| 65 to 74 Years | 0 (0.0%) | 0 (0.0%) |
| 75 Years and over | 0 (0.0%) | 0 (0.0%) |
Disability Class: Ambulatory Difficulty
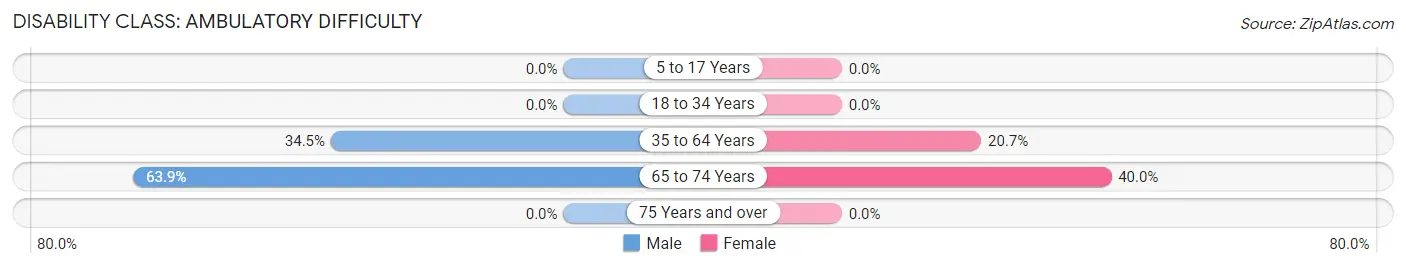
| Age Bracket | Male | Female |
| 5 to 17 Years | 0 (0.0%) | 0 (0.0%) |
| 18 to 34 Years | 0 (0.0%) | 0 (0.0%) |
| 35 to 64 Years | 29 (34.5%) | 24 (20.7%) |
| 65 to 74 Years | 23 (63.9%) | 6 (40.0%) |
| 75 Years and over | 0 (0.0%) | 0 (0.0%) |
Disability Class: Self-Care Difficulty
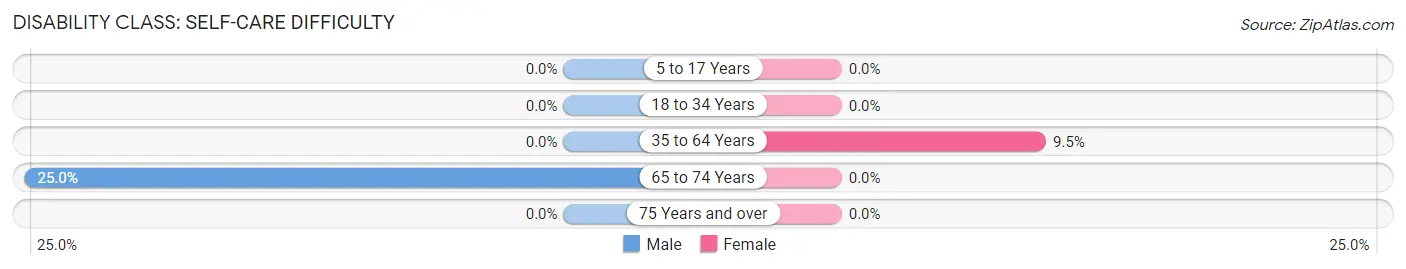
| Age Bracket | Male | Female |
| 5 to 17 Years | 0 (0.0%) | 0 (0.0%) |
| 18 to 34 Years | 0 (0.0%) | 0 (0.0%) |
| 35 to 64 Years | 0 (0.0%) | 11 (9.5%) |
| 65 to 74 Years | 9 (25.0%) | 0 (0.0%) |
| 75 Years and over | 0 (0.0%) | 0 (0.0%) |
Technology Access in Accoville
Computing Device Access in Accoville
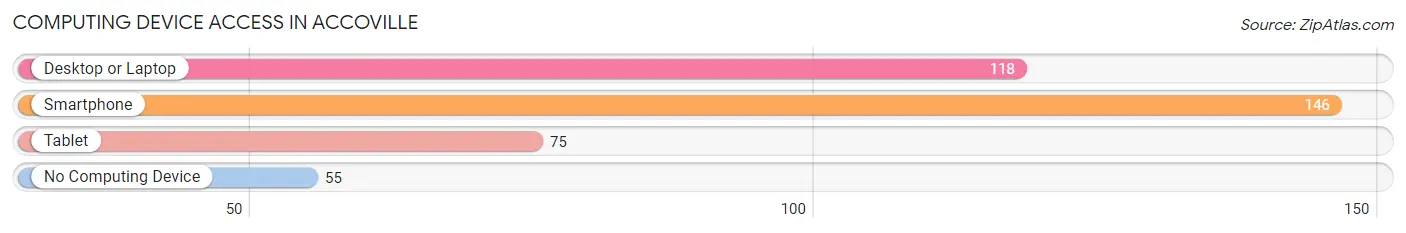
| Device Type | # Households | % Households |
| Desktop or Laptop | 118 | 54.6% |
| Smartphone | 146 | 67.6% |
| Tablet | 75 | 34.7% |
| No Computing Device | 55 | 25.5% |
| Total | 216 | 100.0% |
Internet Access in Accoville
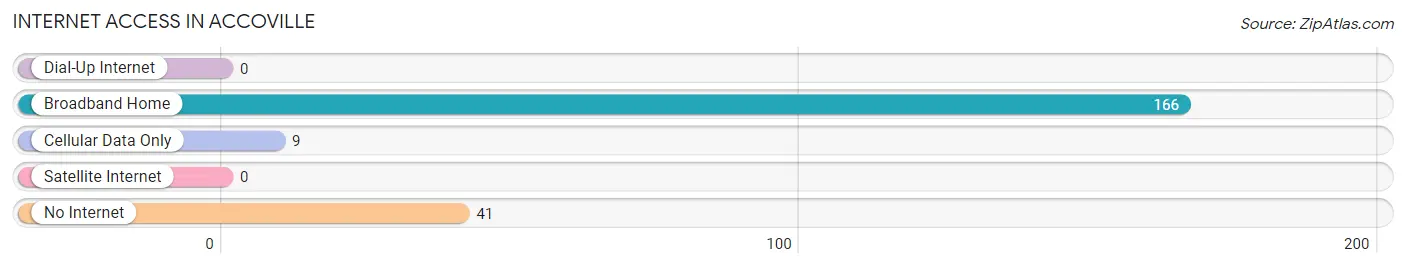
| Internet Type | # Households | % Households |
| Dial-Up Internet | 0 | 0.0% |
| Broadband Home | 166 | 76.8% |
| Cellular Data Only | 9 | 4.2% |
| Satellite Internet | 0 | 0.0% |
| No Internet | 41 | 19.0% |
| Total | 216 | 100.0% |
Accoville Summary
Accoville is a small unincorporated community located in Logan County, West Virginia. It is situated along the Guyandotte River, approximately five miles south of the county seat of Logan. The community was established in the late 19th century and has a population of approximately 500 people.
History
Accoville was founded in the late 19th century by a group of coal miners who had moved to the area from Pennsylvania. The miners were looking for work in the coal mines of the region and found employment in the nearby mines of the Guyandotte Valley. The town was named after the Acco family, who were among the first settlers in the area.
The town grew rapidly in the early 20th century, as the coal industry in the region flourished. The town was home to several coal mines, including the Acco Mine, which was one of the largest in the area. The town also had a number of stores, churches, and other businesses.
In the 1950s, the coal industry began to decline in the region, and many of the mines in the area closed. This led to a decline in the population of Accoville, as many of the miners and their families moved away in search of work. The town has since become a small, rural community, with a population of approximately 500 people.
Geography
Accoville is located in Logan County, West Virginia, approximately five miles south of the county seat of Logan. The town is situated along the Guyandotte River, and is surrounded by rolling hills and forests. The climate in the area is generally mild, with temperatures ranging from the mid-30s in the winter to the mid-80s in the summer.
Economy
The economy of Accoville is largely based on agriculture and tourism. The town is home to several farms, which produce a variety of crops, including corn, soybeans, and hay. The town also has a number of small businesses, including restaurants, stores, and other services.
Tourism is also an important part of the economy of Accoville. The town is home to several attractions, including the Acco Mine Museum, which is dedicated to the history of the coal industry in the region. The town also has a number of parks and outdoor recreation areas, which attract visitors from all over the region.
Demographics
As of the 2010 census, the population of Accoville was 498 people. The racial makeup of the town was 97.2% White, 0.6% African American, 0.2% Native American, 0.2% Asian, 0.2% from other races, and 1.8% from two or more races. The median household income in the town was $30,000, and the median family income was $35,000. The per capita income in the town was $14,000.
Conclusion
Accoville is a small, rural community located in Logan County, West Virginia. The town was founded in the late 19th century by a group of coal miners, and grew rapidly in the early 20th century as the coal industry flourished. The town has since become a small, rural community, with a population of approximately 500 people. The economy of Accoville is largely based on agriculture and tourism, and the town is home to several attractions, including the Acco Mine Museum. The population of Accoville is predominantly White, with a median household income of $30,000 and a per capita income of $14,000.
Common Questions
What is Per Capita Income in Accoville?
Per Capita income in Accoville is $21,074.
What is Inequality or Gini Index in Accoville?
Inequality or Gini Index in Accoville is 0.54.
What is the Total Population of Accoville?
Total Population of Accoville is 596.
What is the Total Male Population of Accoville?
Total Male Population of Accoville is 313.
What is the Total Female Population of Accoville?
Total Female Population of Accoville is 283.
What is the Ratio of Males per 100 Females in Accoville?
There are 110.60 Males per 100 Females in Accoville.
What is the Ratio of Females per 100 Males in Accoville?
There are 90.42 Females per 100 Males in Accoville.
What is the Median Population Age in Accoville?
Median Population Age in Accoville is 34.1 Years.
What is the Average Family Size in Accoville
Average Family Size in Accoville is 3.3 People.
What is the Average Household Size in Accoville
Average Household Size in Accoville is 2.8 People.
How Large is the Labor Force in Accoville?
There are 124 People in the Labor Forcein in Accoville.
What is the Percentage of People in the Labor Force in Accoville?
29.0% of People are in the Labor Force in Accoville.
What is the Unemployment Rate in Accoville?
Unemployment Rate in Accoville is 14.5%.