Gauley Bridge, WV Map & Demographics
Gauley Bridge Map
Gauley Bridge Overview
$16,034
PER CAPITA INCOME
$16,786
AVG HOUSEHOLD INCOME
0.61
INEQUALITY / GINI INDEX
471
TOTAL POPULATION
228
MALE POPULATION
243
FEMALE POPULATION
93.83
MALES / 100 FEMALES
106.58
FEMALES / 100 MALES
43.4
MEDIAN AGE
3.2
AVG FAMILY SIZE
2.2
AVG HOUSEHOLD SIZE
168
LABOR FORCE [ PEOPLE ]
42.2%
PERCENT IN LABOR FORCE
8.3%
UNEMPLOYMENT RATE
Gauley Bridge Zip Codes
Gauley Bridge Area Codes
Income in Gauley Bridge
Income Overview in Gauley Bridge
| Characteristic | Number | Measure |
| Per Capita Income | 471 | $16,034 |
| Median Family Income | 106 | $0 |
| Mean Family Income | 106 | $55,292 |
| Median Household Income | 212 | $16,786 |
| Mean Household Income | 212 | $34,825 |
| Income Deficit | 106 | $0 |
| Wage / Income Gap (%) | 471 | 0.00% |
| Wage / Income Gap ($) | 471 | 100.00¢ per $1 |
| Gini / Inequality Index | 471 | 0.61 |
Earnings by Sex in Gauley Bridge
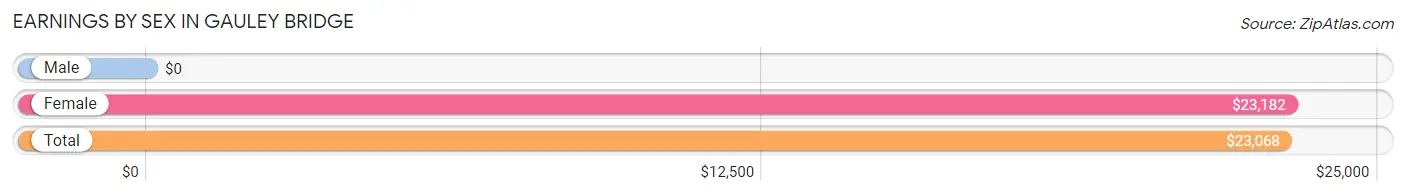
| Sex | Number | Average Earnings |
| Male | 98 (58.3%) | $0 |
| Female | 70 (41.7%) | $23,182 |
| Total | 168 (100.0%) | $23,068 |
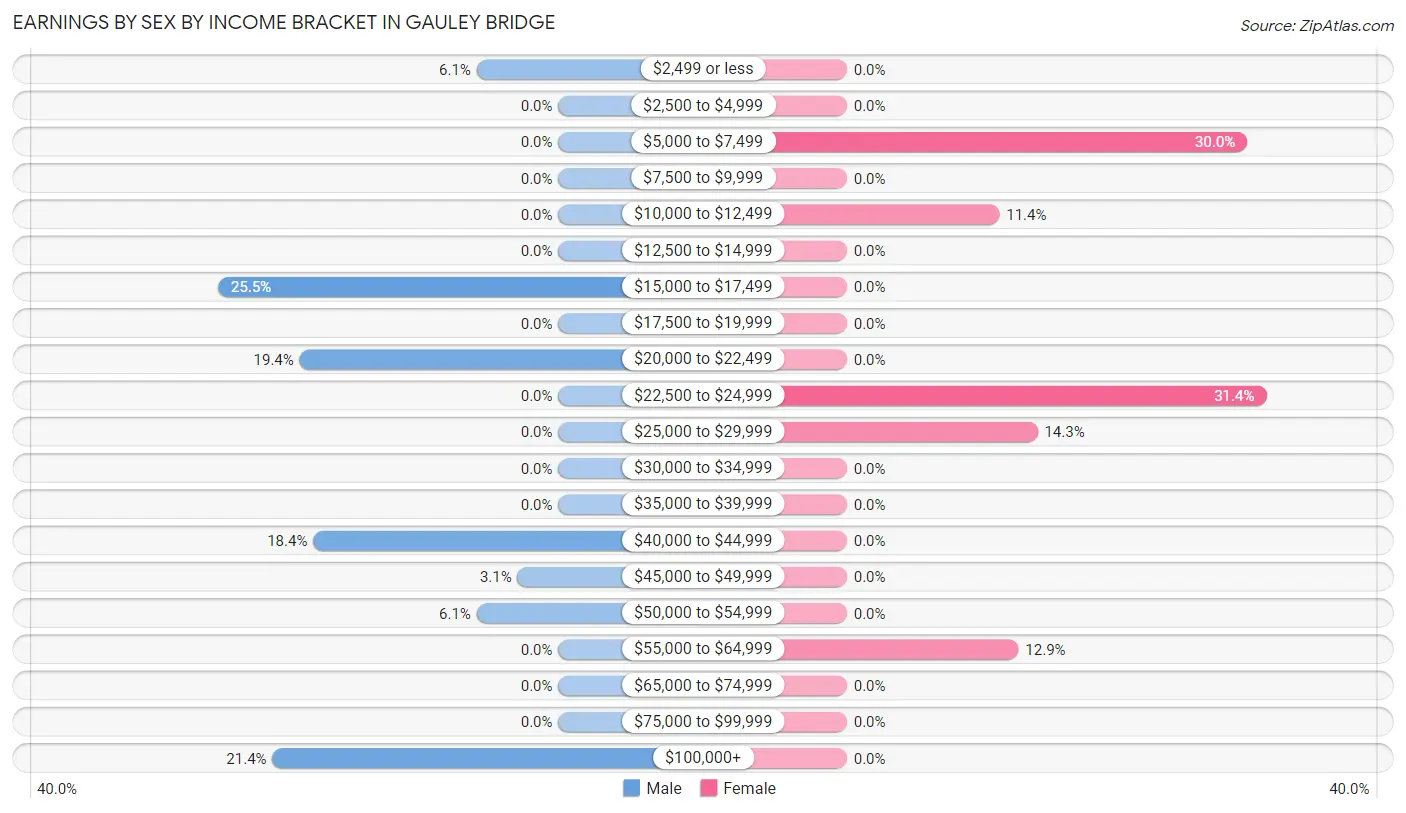
Earnings by Sex by Income Bracket in Gauley Bridge
The most common earnings brackets in Gauley Bridge are $15,000 to $17,499 for men (25 | 25.5%) and $22,500 to $24,999 for women (22 | 31.4%).
| Income | Male | Female |
| $2,499 or less | 6 (6.1%) | 0 (0.0%) |
| $2,500 to $4,999 | 0 (0.0%) | 0 (0.0%) |
| $5,000 to $7,499 | 0 (0.0%) | 21 (30.0%) |
| $7,500 to $9,999 | 0 (0.0%) | 0 (0.0%) |
| $10,000 to $12,499 | 0 (0.0%) | 8 (11.4%) |
| $12,500 to $14,999 | 0 (0.0%) | 0 (0.0%) |
| $15,000 to $17,499 | 25 (25.5%) | 0 (0.0%) |
| $17,500 to $19,999 | 0 (0.0%) | 0 (0.0%) |
| $20,000 to $22,499 | 19 (19.4%) | 0 (0.0%) |
| $22,500 to $24,999 | 0 (0.0%) | 22 (31.4%) |
| $25,000 to $29,999 | 0 (0.0%) | 10 (14.3%) |
| $30,000 to $34,999 | 0 (0.0%) | 0 (0.0%) |
| $35,000 to $39,999 | 0 (0.0%) | 0 (0.0%) |
| $40,000 to $44,999 | 18 (18.4%) | 0 (0.0%) |
| $45,000 to $49,999 | 3 (3.1%) | 0 (0.0%) |
| $50,000 to $54,999 | 6 (6.1%) | 0 (0.0%) |
| $55,000 to $64,999 | 0 (0.0%) | 9 (12.9%) |
| $65,000 to $74,999 | 0 (0.0%) | 0 (0.0%) |
| $75,000 to $99,999 | 0 (0.0%) | 0 (0.0%) |
| $100,000+ | 21 (21.4%) | 0 (0.0%) |
| Total | 98 (100.0%) | 70 (100.0%) |
Earnings by Sex by Educational Attainment in Gauley Bridge
| Educational Attainment | Male Income | Female Income |
| Less than High School | - | - |
| High School Diploma | - | - |
| College or Associate's Degree | - | - |
| Bachelor's Degree | - | - |
| Graduate Degree | - | - |
| Total | - | - |
Family Income in Gauley Bridge
Family Income Brackets in Gauley Bridge
According to the Gauley Bridge family income data, there are 34 families falling into the $15,000 to $24,999 income range, which is the most common income bracket and makes up 32.1% of all families.
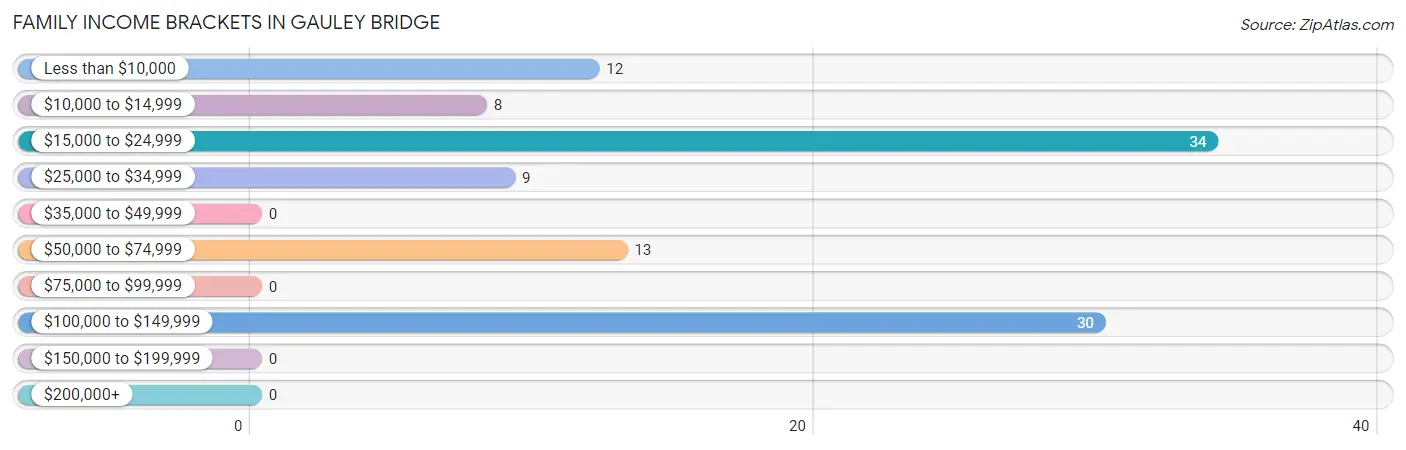
| Income Bracket | # Families | % Families |
| Less than $10,000 | 12 | 11.3% |
| $10,000 to $14,999 | 8 | 7.5% |
| $15,000 to $24,999 | 34 | 32.1% |
| $25,000 to $34,999 | 9 | 8.5% |
| $35,000 to $49,999 | 0 | 0.0% |
| $50,000 to $74,999 | 13 | 12.3% |
| $75,000 to $99,999 | 0 | 0.0% |
| $100,000 to $149,999 | 30 | 28.3% |
| $150,000 to $199,999 | 0 | 0.0% |
| $200,000+ | 0 | 0.0% |
Family Income by Famaliy Size in Gauley Bridge
2-person families (41 | 38.7%) account for the highest median family income in Gauley Bridge with $16,771 per family, while 2-person families (41 | 38.7%) have the highest median income of $8,386 per family member.
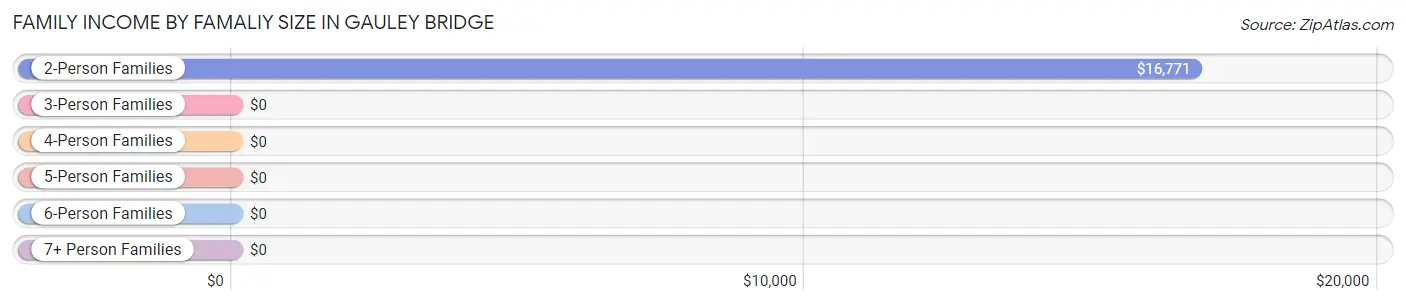
| Income Bracket | # Families | Median Income |
| 2-Person Families | 41 (38.7%) | $16,771 |
| 3-Person Families | 35 (33.0%) | $0 |
| 4-Person Families | 22 (20.7%) | $0 |
| 5-Person Families | 8 (7.5%) | $0 |
| 6-Person Families | 0 (0.0%) | $0 |
| 7+ Person Families | 0 (0.0%) | $0 |
| Total | 106 (100.0%) | $0 |
Family Income by Number of Earners in Gauley Bridge
| Number of Earners | # Families | Median Income |
| No Earners | 20 (18.9%) | $0 |
| 1 Earner | 38 (35.8%) | $0 |
| 2 Earners | 26 (24.5%) | $0 |
| 3+ Earners | 22 (20.7%) | $0 |
| Total | 106 (100.0%) | $0 |
Household Income in Gauley Bridge
Household Income Brackets in Gauley Bridge
With 61 households falling in the category, the less than $10,000 income range is the most frequent in Gauley Bridge, accounting for 28.8% of all households.
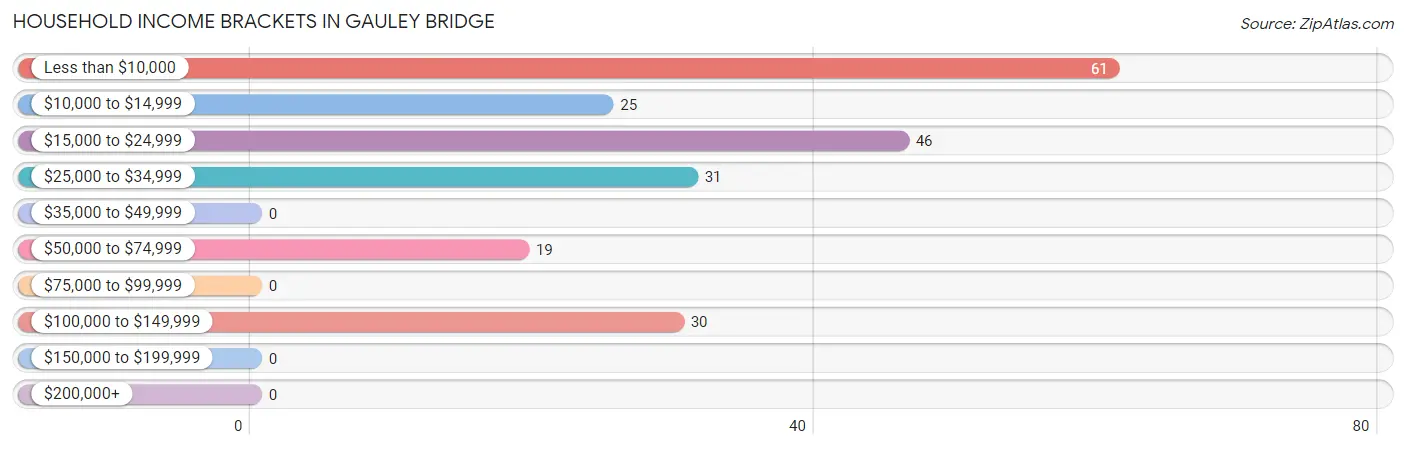
| Income Bracket | # Households | % Households |
| Less than $10,000 | 61 | 28.8% |
| $10,000 to $14,999 | 25 | 11.8% |
| $15,000 to $24,999 | 46 | 21.7% |
| $25,000 to $34,999 | 31 | 14.6% |
| $35,000 to $49,999 | 0 | 0.0% |
| $50,000 to $74,999 | 19 | 9.0% |
| $75,000 to $99,999 | 0 | 0.0% |
| $100,000 to $149,999 | 30 | 14.2% |
| $150,000 to $199,999 | 0 | 0.0% |
| $200,000+ | 0 | 0.0% |
Household Income by Householder Age in Gauley Bridge
The median household income in Gauley Bridge is $16,786, with the highest median household income of $17,750 found in the 65+ years age bracket for the primary householder. A total of 74 households (34.9%) fall into this category.
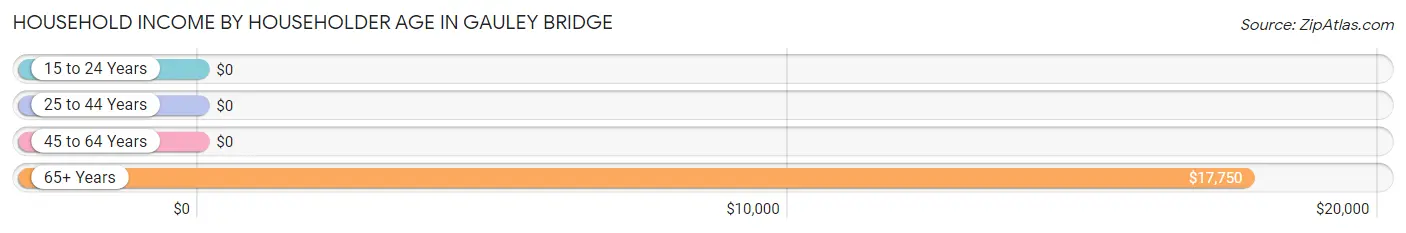
| Income Bracket | # Households | Median Income |
| 15 to 24 Years | 0 (0.0%) | $0 |
| 25 to 44 Years | 75 (35.4%) | $0 |
| 45 to 64 Years | 63 (29.7%) | $0 |
| 65+ Years | 74 (34.9%) | $17,750 |
| Total | 212 (100.0%) | $16,786 |
Poverty in Gauley Bridge
Income Below Poverty by Sex and Age in Gauley Bridge
With 30.4% poverty level for males and 58.0% for females among the residents of Gauley Bridge, under 5 year old males and 6 to 11 year old females are the most vulnerable to poverty, with 20 males (100.0%) and 12 females (100.0%) in their respective age groups living below the poverty level.
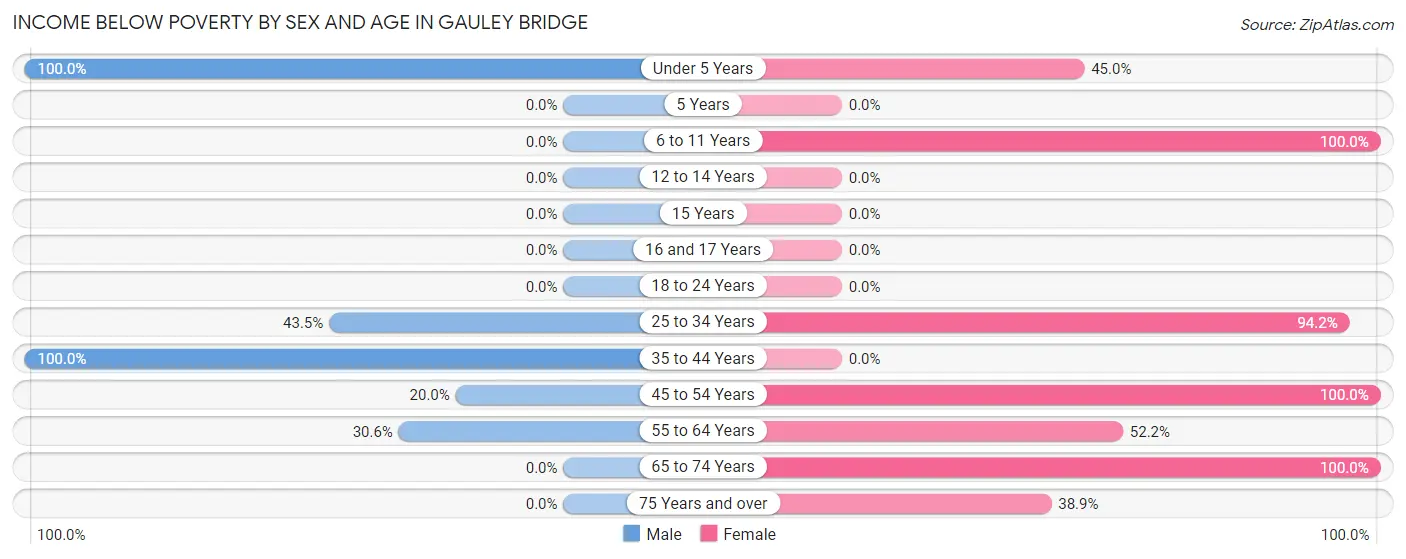
| Age Bracket | Male | Female |
| Under 5 Years | 20 (100.0%) | 9 (45.0%) |
| 5 Years | 0 (0.0%) | 0 (0.0%) |
| 6 to 11 Years | 0 (0.0%) | 12 (100.0%) |
| 12 to 14 Years | 0 (0.0%) | 0 (0.0%) |
| 15 Years | 0 (0.0%) | 0 (0.0%) |
| 16 and 17 Years | 0 (0.0%) | 0 (0.0%) |
| 18 to 24 Years | 0 (0.0%) | 0 (0.0%) |
| 25 to 34 Years | 20 (43.5%) | 49 (94.2%) |
| 35 to 44 Years | 6 (100.0%) | 0 (0.0%) |
| 45 to 54 Years | 10 (20.0%) | 23 (100.0%) |
| 55 to 64 Years | 11 (30.6%) | 12 (52.2%) |
| 65 to 74 Years | 0 (0.0%) | 29 (100.0%) |
| 75 Years and over | 0 (0.0%) | 7 (38.9%) |
| Total | 67 (30.4%) | 141 (58.0%) |
Income Above Poverty by Sex and Age in Gauley Bridge
According to the poverty statistics in Gauley Bridge, males aged 16 and 17 years and females aged 15 years are the age groups that are most secure financially, with 100.0% of males and 100.0% of females in these age groups living above the poverty line.
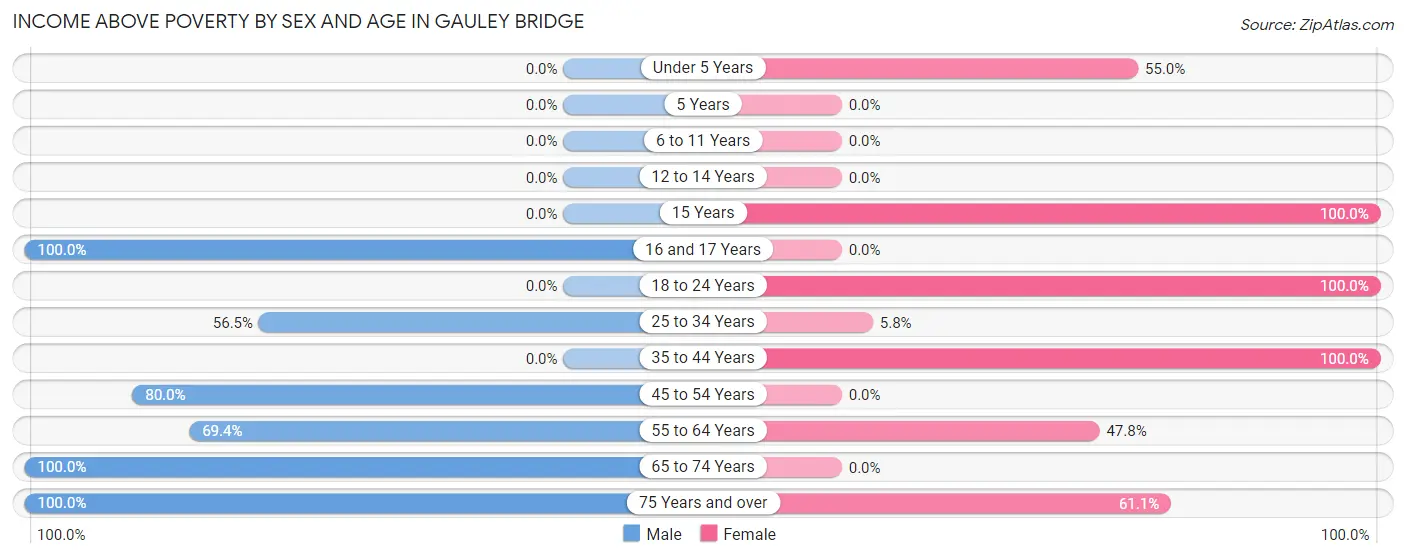
| Age Bracket | Male | Female |
| Under 5 Years | 0 (0.0%) | 11 (55.0%) |
| 5 Years | 0 (0.0%) | 0 (0.0%) |
| 6 to 11 Years | 0 (0.0%) | 0 (0.0%) |
| 12 to 14 Years | 0 (0.0%) | 0 (0.0%) |
| 15 Years | 0 (0.0%) | 13 (100.0%) |
| 16 and 17 Years | 35 (100.0%) | 0 (0.0%) |
| 18 to 24 Years | 0 (0.0%) | 21 (100.0%) |
| 25 to 34 Years | 26 (56.5%) | 3 (5.8%) |
| 35 to 44 Years | 0 (0.0%) | 32 (100.0%) |
| 45 to 54 Years | 40 (80.0%) | 0 (0.0%) |
| 55 to 64 Years | 25 (69.4%) | 11 (47.8%) |
| 65 to 74 Years | 19 (100.0%) | 0 (0.0%) |
| 75 Years and over | 8 (100.0%) | 11 (61.1%) |
| Total | 153 (69.6%) | 102 (42.0%) |
Income Below Poverty Among Married-Couple Families in Gauley Bridge
The poverty statistics for married-couple families in Gauley Bridge show that 44.2% or 34 of the total 77 families live below the poverty line. Families with no children have the highest poverty rate of 100.0%, comprising of 12 families. On the other hand, families with 1 or 2 children have the lowest poverty rate of 24.6%, which includes 14 families.
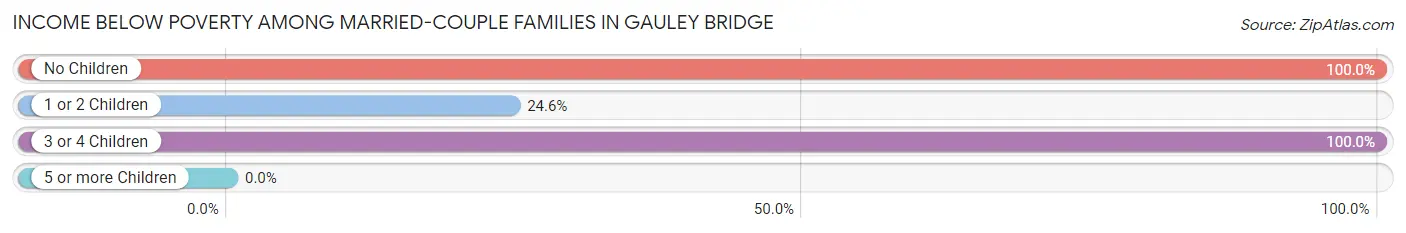
| Children | Above Poverty | Below Poverty |
| No Children | 0 (0.0%) | 12 (100.0%) |
| 1 or 2 Children | 43 (75.4%) | 14 (24.6%) |
| 3 or 4 Children | 0 (0.0%) | 8 (100.0%) |
| 5 or more Children | 0 (0.0%) | 0 (0.0%) |
| Total | 43 (55.8%) | 34 (44.2%) |
Income Below Poverty Among Single-Parent Households in Gauley Bridge
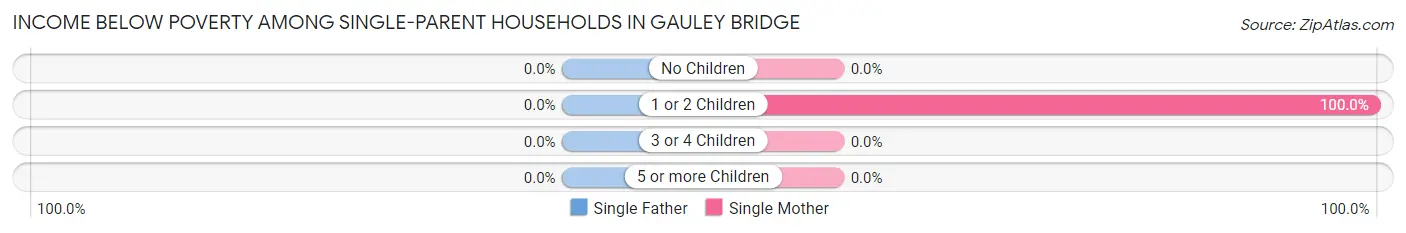
| Children | Single Father | Single Mother |
| No Children | 0 (0.0%) | 0 (0.0%) |
| 1 or 2 Children | 0 (0.0%) | 12 (100.0%) |
| 3 or 4 Children | 0 (0.0%) | 0 (0.0%) |
| 5 or more Children | 0 (0.0%) | 0 (0.0%) |
| Total | 0 (0.0%) | 12 (100.0%) |
Income Below Poverty Among Married-Couple vs Single-Parent Households in Gauley Bridge
The poverty data for Gauley Bridge shows that 34 of the married-couple family households (44.2%) and 12 of the single-parent households (41.4%) are living below the poverty level. Within the married-couple family households, those with no children have the highest poverty rate, with 12 households (100.0%) falling below the poverty line. Among the single-parent households, those with 1 or 2 children have the highest poverty rate, with 12 household (100.0%) living below poverty.
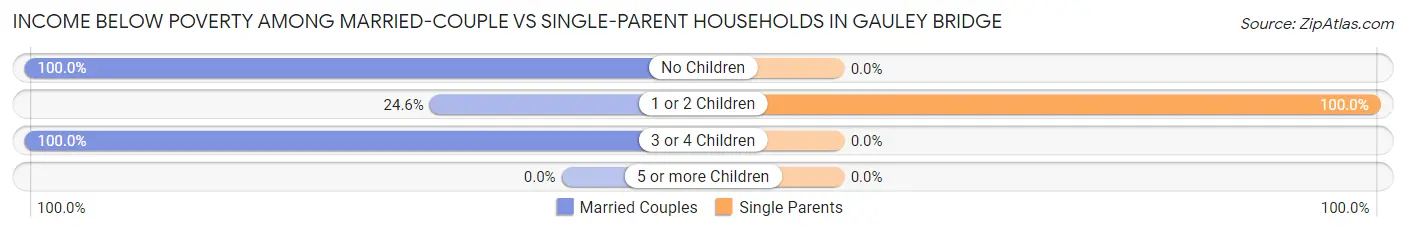
| Children | Married-Couple Families | Single-Parent Households |
| No Children | 12 (100.0%) | 0 (0.0%) |
| 1 or 2 Children | 14 (24.6%) | 12 (100.0%) |
| 3 or 4 Children | 8 (100.0%) | 0 (0.0%) |
| 5 or more Children | 0 (0.0%) | 0 (0.0%) |
| Total | 34 (44.2%) | 12 (41.4%) |
Race in Gauley Bridge
The most populous races in Gauley Bridge are , and White / Caucasian (471 | 100.0%).
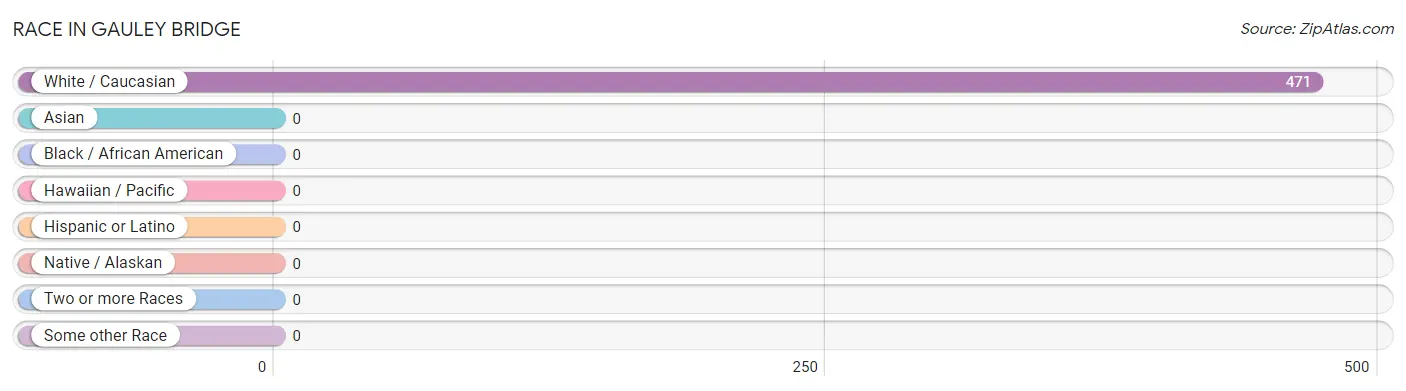
| Race | # Population | % Population |
| Asian | 0 | 0.0% |
| Black / African American | 0 | 0.0% |
| Hawaiian / Pacific | 0 | 0.0% |
| Hispanic or Latino | 0 | 0.0% |
| Native / Alaskan | 0 | 0.0% |
| White / Caucasian | 471 | 100.0% |
| Two or more Races | 0 | 0.0% |
| Some other Race | 0 | 0.0% |
| Total | 471 | 100.0% |
Ancestry in Gauley Bridge
The most populous ancestries reported in Gauley Bridge are Irish (194 | 41.2%), French (92 | 19.5%), German (87 | 18.5%), English (57 | 12.1%), and Scottish (16 | 3.4%), together accounting for 94.7% of all Gauley Bridge residents.
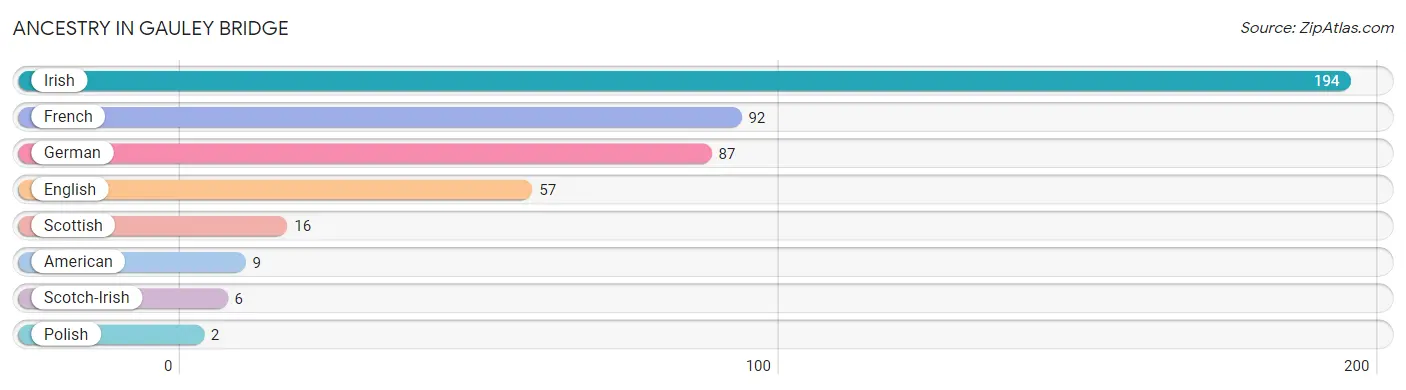
| Ancestry | # Population | % Population |
| American | 9 | 1.9% |
| English | 57 | 12.1% |
| French | 92 | 19.5% |
| German | 87 | 18.5% |
| Irish | 194 | 41.2% |
| Polish | 2 | 0.4% |
| Scotch-Irish | 6 | 1.3% |
| Scottish | 16 | 3.4% | View All 8 Rows |
Immigrants in Gauley Bridge

| Immigration Origin | # Population | % Population | View All 0 Rows |
Sex and Age in Gauley Bridge
Sex and Age in Gauley Bridge
The most populous age groups in Gauley Bridge are 25 to 29 Years (40 | 17.5%) for men and 15 to 19 Years (34 | 14.0%) for women.
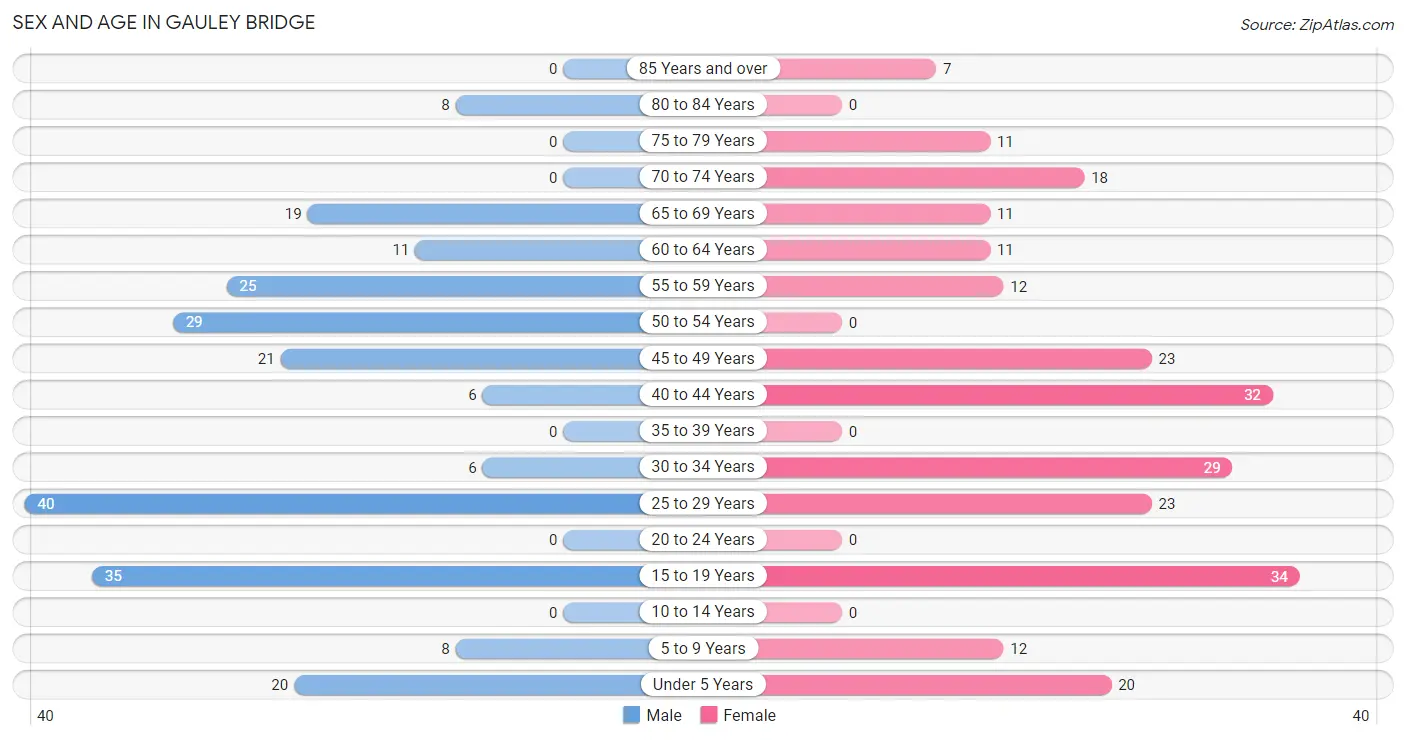
| Age Bracket | Male | Female |
| Under 5 Years | 20 (8.8%) | 20 (8.2%) |
| 5 to 9 Years | 8 (3.5%) | 12 (4.9%) |
| 10 to 14 Years | 0 (0.0%) | 0 (0.0%) |
| 15 to 19 Years | 35 (15.3%) | 34 (14.0%) |
| 20 to 24 Years | 0 (0.0%) | 0 (0.0%) |
| 25 to 29 Years | 40 (17.5%) | 23 (9.5%) |
| 30 to 34 Years | 6 (2.6%) | 29 (11.9%) |
| 35 to 39 Years | 0 (0.0%) | 0 (0.0%) |
| 40 to 44 Years | 6 (2.6%) | 32 (13.2%) |
| 45 to 49 Years | 21 (9.2%) | 23 (9.5%) |
| 50 to 54 Years | 29 (12.7%) | 0 (0.0%) |
| 55 to 59 Years | 25 (11.0%) | 12 (4.9%) |
| 60 to 64 Years | 11 (4.8%) | 11 (4.5%) |
| 65 to 69 Years | 19 (8.3%) | 11 (4.5%) |
| 70 to 74 Years | 0 (0.0%) | 18 (7.4%) |
| 75 to 79 Years | 0 (0.0%) | 11 (4.5%) |
| 80 to 84 Years | 8 (3.5%) | 0 (0.0%) |
| 85 Years and over | 0 (0.0%) | 7 (2.9%) |
| Total | 228 (100.0%) | 243 (100.0%) |
Families and Households in Gauley Bridge
Median Family Size in Gauley Bridge
The median family size in Gauley Bridge is 3.19 persons per family, with married-couple families (77 | 72.6%) accounting for the largest median family size of 3.44 persons per family. On the other hand, single female/mother families (12 | 11.3%) represent the smallest median family size with 2.00 persons per family.
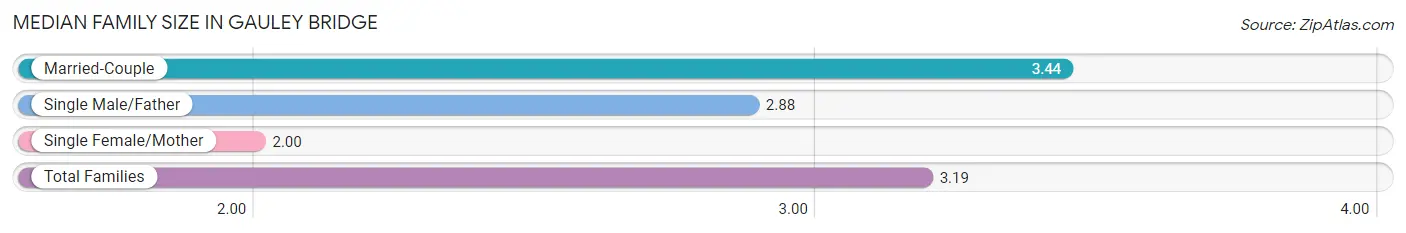
| Family Type | # Families | Family Size |
| Married-Couple | 77 (72.6%) | 3.44 |
| Single Male/Father | 17 (16.0%) | 2.88 |
| Single Female/Mother | 12 (11.3%) | 2.00 |
| Total Families | 106 (100.0%) | 3.19 |
Median Household Size in Gauley Bridge
The median household size in Gauley Bridge is 2.22 persons per household, with married-couple households (77 | 36.3%) accounting for the largest median household size of 3.44 persons per household. non-family households (106 | 50.0%) represent the smallest median household size with 1.25 persons per household.
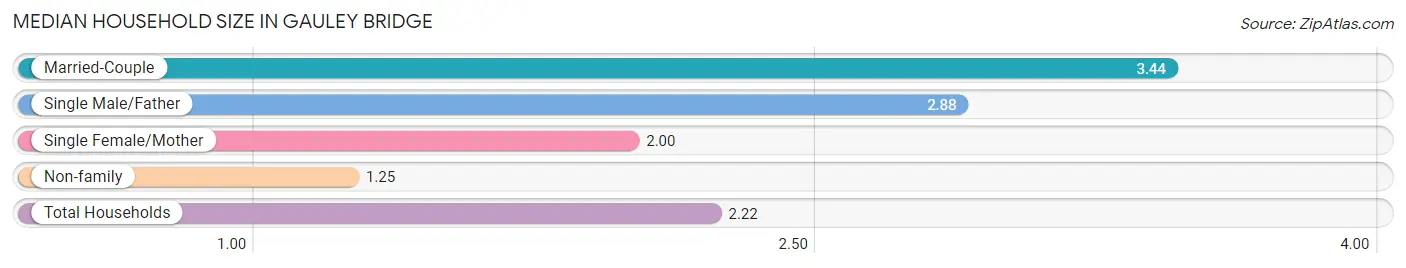
| Household Type | # Households | Household Size |
| Married-Couple | 77 (36.3%) | 3.44 |
| Single Male/Father | 17 (8.0%) | 2.88 |
| Single Female/Mother | 12 (5.7%) | 2.00 |
| Non-family | 106 (50.0%) | 1.25 |
| Total Households | 212 (100.0%) | 2.22 |
Household Size by Marriage Status in Gauley Bridge
Out of a total of 212 households in Gauley Bridge, 106 (50.0%) are family households, while 106 (50.0%) are nonfamily households. The most numerous type of family households are 2-person households, comprising 41, and the most common type of nonfamily households are 1-person households, comprising 100.
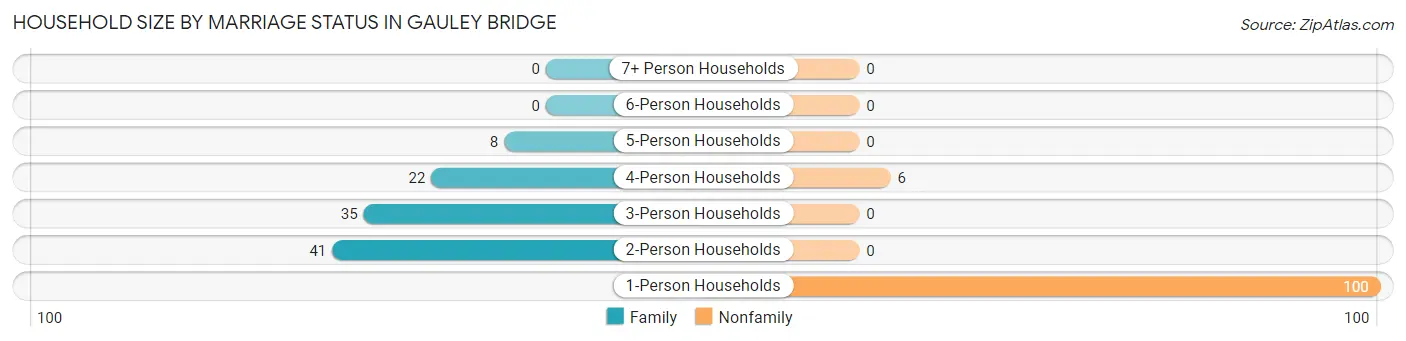
| Household Size | Family Households | Nonfamily Households |
| 1-Person Households | - | 100 (47.2%) |
| 2-Person Households | 41 (19.3%) | 0 (0.0%) |
| 3-Person Households | 35 (16.5%) | 0 (0.0%) |
| 4-Person Households | 22 (10.4%) | 6 (2.8%) |
| 5-Person Households | 8 (3.8%) | 0 (0.0%) |
| 6-Person Households | 0 (0.0%) | 0 (0.0%) |
| 7+ Person Households | 0 (0.0%) | 0 (0.0%) |
| Total | 106 (50.0%) | 106 (50.0%) |
Female Fertility in Gauley Bridge
Fertility by Age in Gauley Bridge
| Age Bracket | Women with Births | Births / 1,000 Women |
| 15 to 19 years | 0 (0.0%) | 0.0 |
| 20 to 34 years | 0 (0.0%) | 0.0 |
| 35 to 50 years | 0 (0.0%) | 0.0 |
| Total | 0 (0.0%) | 0.0 |
Fertility by Age by Marriage Status in Gauley Bridge
| Age Bracket | Married | Unmarried |
| 15 to 19 years | 0 (0.0%) | 0 (0.0%) |
| 20 to 34 years | 0 (0.0%) | 0 (0.0%) |
| 35 to 50 years | 0 (0.0%) | 0 (0.0%) |
| Total | 0 (0.0%) | 0 (0.0%) |
Fertility by Education in Gauley Bridge
| Educational Attainment | Women with Births | Births / 1,000 Women |
| Less than High School | 0 (0.0%) | 0.0 |
| High School Diploma | 0 (0.0%) | 0.0 |
| College or Associate's Degree | 0 (0.0%) | 0.0 |
| Bachelor's Degree | 0 (0.0%) | 0.0 |
| Graduate Degree | 0 (0.0%) | 0.0 |
| Total | 0 (0.0%) | 0.0 |
Fertility by Education by Marriage Status in Gauley Bridge
| Educational Attainment | Married | Unmarried |
| Less than High School | 0 (0.0%) | 0 (0.0%) |
| High School Diploma | 0 (0.0%) | 0 (0.0%) |
| College or Associate's Degree | 0 (0.0%) | 0 (0.0%) |
| Bachelor's Degree | 0 (0.0%) | 0 (0.0%) |
| Graduate Degree | 0 (0.0%) | 0 (0.0%) |
| Total | 0 (0.0%) | 0 (0.0%) |
Employment Characteristics in Gauley Bridge
Employment by Class of Employer in Gauley Bridge
Among the 154 employed individuals in Gauley Bridge, private company employees (151 | 98.1%), and state government employees (3 | 1.9%) make up the most common classes of employment.
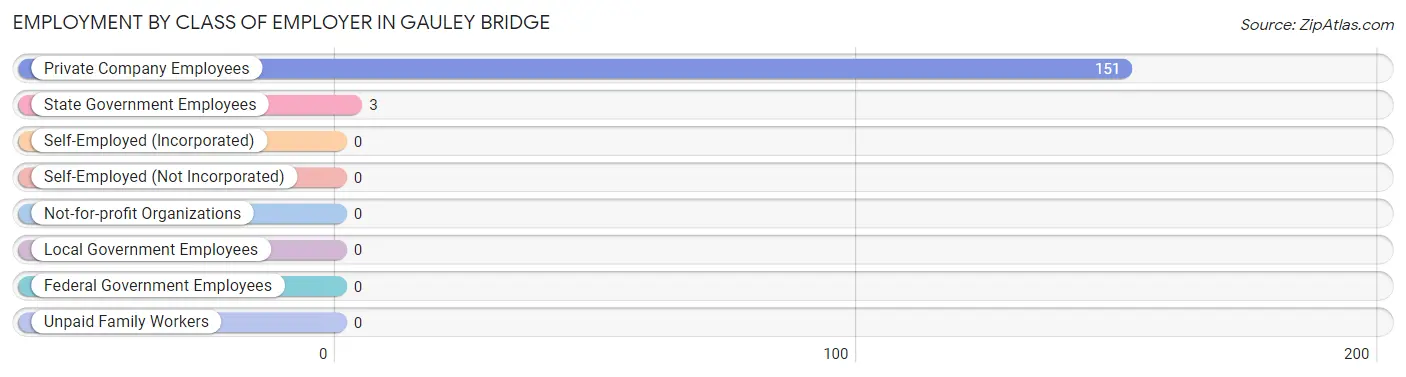
| Employer Class | # Employees | % Employees |
| Private Company Employees | 151 | 98.1% |
| Self-Employed (Incorporated) | 0 | 0.0% |
| Self-Employed (Not Incorporated) | 0 | 0.0% |
| Not-for-profit Organizations | 0 | 0.0% |
| Local Government Employees | 0 | 0.0% |
| State Government Employees | 3 | 1.9% |
| Federal Government Employees | 0 | 0.0% |
| Unpaid Family Workers | 0 | 0.0% |
| Total | 154 | 100.0% |
Employment Status by Age in Gauley Bridge
According to the labor force statistics for Gauley Bridge, out of the total population over 16 years of age (398), 42.2% or 168 individuals are in the labor force, with 8.3% or 14 of them unemployed. The age group with the highest labor force participation rate is 35 to 44 years, with 84.2% or 32 individuals in the labor force. Within the labor force, the 45 to 54 years age range has the highest percentage of unemployed individuals, with 25.9% or 14 of them being unemployed.
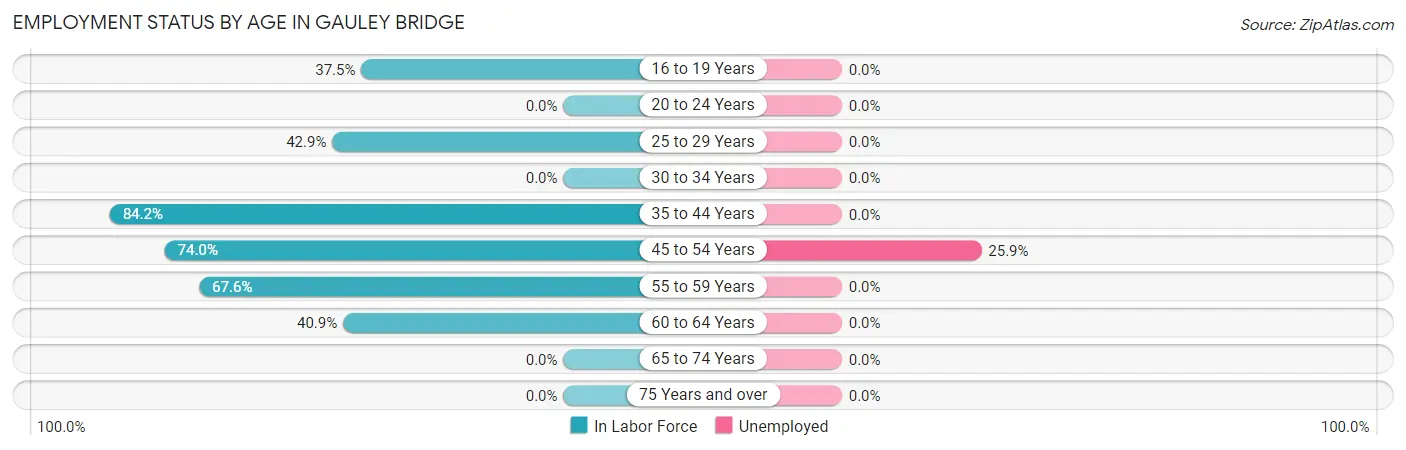
| Age Bracket | In Labor Force | Unemployed |
| 16 to 19 Years | 21 (37.5%) | 0 (0.0%) |
| 20 to 24 Years | 0 (0.0%) | 0 (0.0%) |
| 25 to 29 Years | 27 (42.9%) | 0 (0.0%) |
| 30 to 34 Years | 0 (0.0%) | 0 (0.0%) |
| 35 to 44 Years | 32 (84.2%) | 0 (0.0%) |
| 45 to 54 Years | 54 (74.0%) | 14 (25.9%) |
| 55 to 59 Years | 25 (67.6%) | 0 (0.0%) |
| 60 to 64 Years | 9 (40.9%) | 0 (0.0%) |
| 65 to 74 Years | 0 (0.0%) | 0 (0.0%) |
| 75 Years and over | 0 (0.0%) | 0 (0.0%) |
| Total | 168 (42.2%) | 14 (8.3%) |
Employment Status by Educational Attainment in Gauley Bridge
According to labor force statistics for Gauley Bridge, 54.9% of individuals (147) out of the total population between 25 and 64 years of age (268) are in the labor force, with 9.5% or 14 of them being unemployed. The group with the highest labor force participation rate are those with the educational attainment of bachelor's degree or higher, with 82.4% or 28 individuals in the labor force. Within the labor force, individuals with less than high school education have the highest percentage of unemployment, with 70.0% or 14 of them being unemployed.
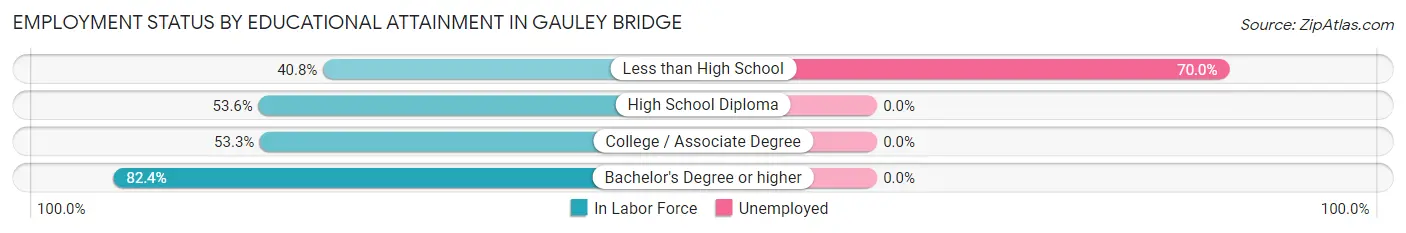
| Educational Attainment | In Labor Force | Unemployed |
| Less than High School | 20 (40.8%) | 34 (70.0%) |
| High School Diploma | 75 (53.6%) | 0 (0.0%) |
| College / Associate Degree | 24 (53.3%) | 0 (0.0%) |
| Bachelor's Degree or higher | 28 (82.4%) | 0 (0.0%) |
| Total | 147 (54.9%) | 25 (9.5%) |
Employment Occupations by Sex in Gauley Bridge
Management, Business, Science and Arts Occupations
The most common Management, Business, Science and Arts occupations in Gauley Bridge are Health Diagnosing & Treating (9 | 5.8%), and Health Technologists (9 | 5.8%).
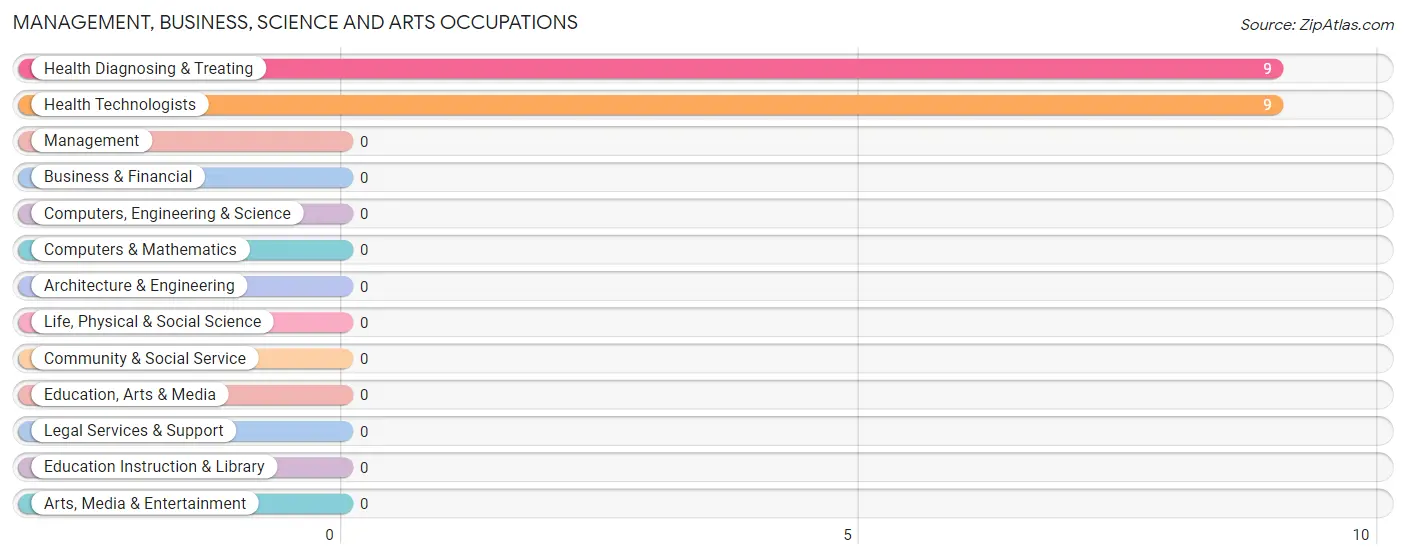
Management, Business, Science and Arts Occupations by Sex
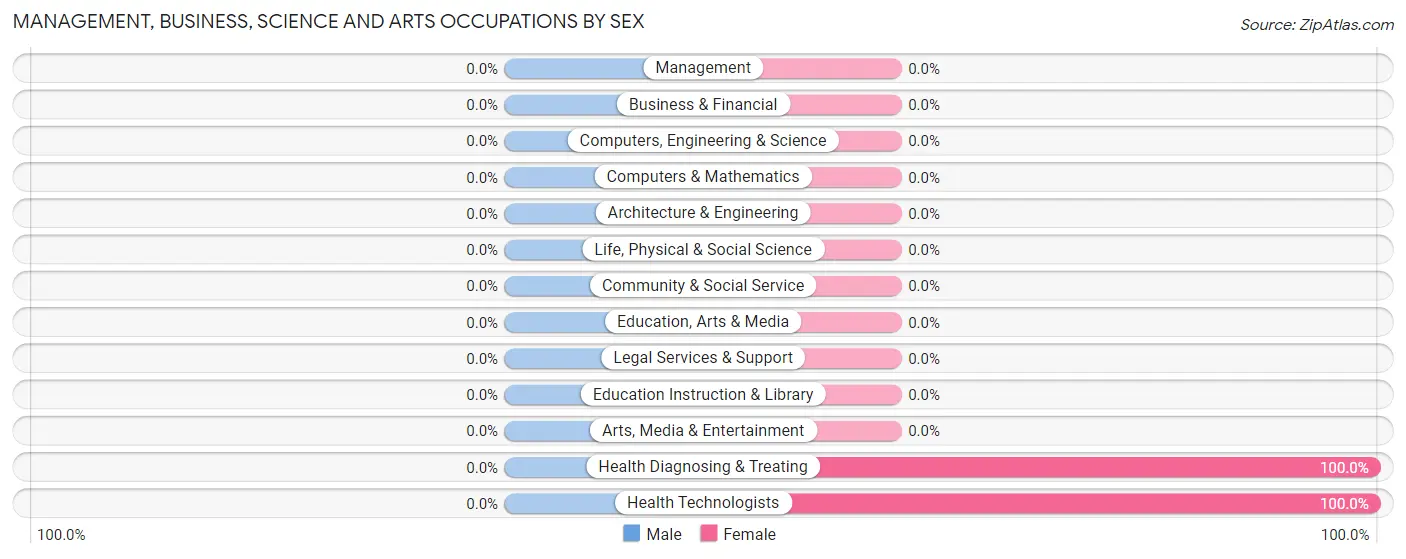
| Occupation | Male | Female |
| Management | 0 (0.0%) | 0 (0.0%) |
| Business & Financial | 0 (0.0%) | 0 (0.0%) |
| Computers, Engineering & Science | 0 (0.0%) | 0 (0.0%) |
| Computers & Mathematics | 0 (0.0%) | 0 (0.0%) |
| Architecture & Engineering | 0 (0.0%) | 0 (0.0%) |
| Life, Physical & Social Science | 0 (0.0%) | 0 (0.0%) |
| Community & Social Service | 0 (0.0%) | 0 (0.0%) |
| Education, Arts & Media | 0 (0.0%) | 0 (0.0%) |
| Legal Services & Support | 0 (0.0%) | 0 (0.0%) |
| Education Instruction & Library | 0 (0.0%) | 0 (0.0%) |
| Arts, Media & Entertainment | 0 (0.0%) | 0 (0.0%) |
| Health Diagnosing & Treating | 0 (0.0%) | 9 (100.0%) |
| Health Technologists | 0 (0.0%) | 9 (100.0%) |
| Total (Category) | 0 (0.0%) | 9 (100.0%) |
| Total (Overall) | 92 (59.7%) | 62 (40.3%) |
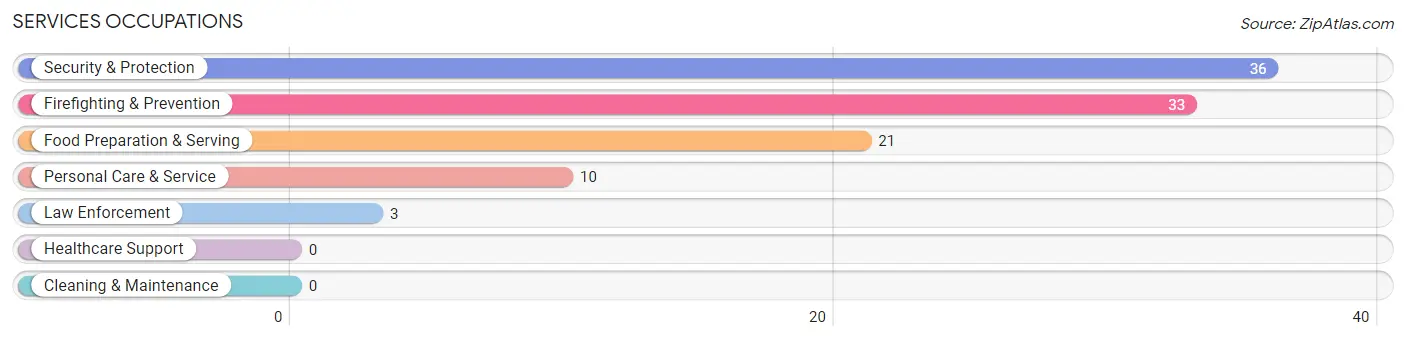
Services Occupations
The most common Services occupations in Gauley Bridge are Security & Protection (36 | 23.4%), Firefighting & Prevention (33 | 21.4%), Food Preparation & Serving (21 | 13.6%), Personal Care & Service (10 | 6.5%), and Law Enforcement (3 | 1.9%).
Services Occupations by Sex
Within the Services occupations in Gauley Bridge, the most male-oriented occupations are Security & Protection (100.0%), Firefighting & Prevention (100.0%), and Law Enforcement (100.0%), while the most female-oriented occupations are Food Preparation & Serving (100.0%), and Personal Care & Service (100.0%).
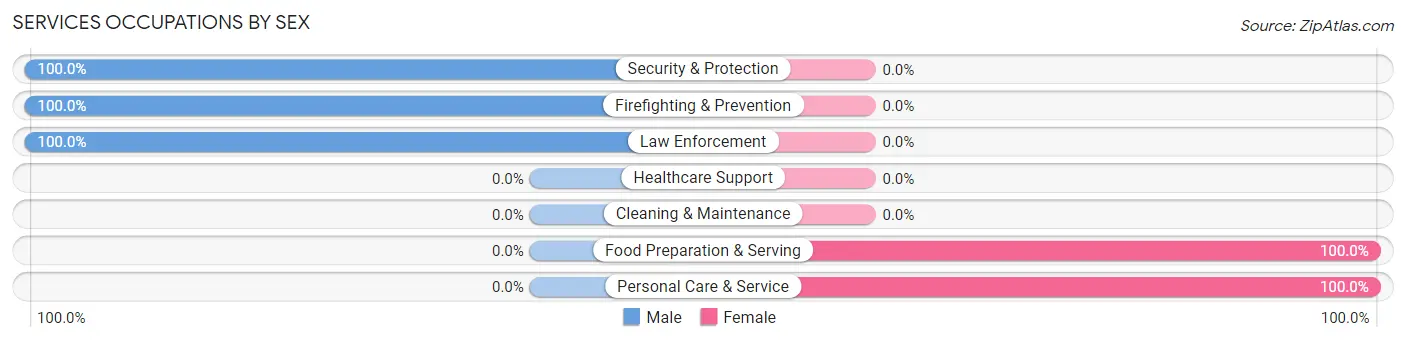
| Occupation | Male | Female |
| Healthcare Support | 0 (0.0%) | 0 (0.0%) |
| Security & Protection | 36 (100.0%) | 0 (0.0%) |
| Firefighting & Prevention | 33 (100.0%) | 0 (0.0%) |
| Law Enforcement | 3 (100.0%) | 0 (0.0%) |
| Food Preparation & Serving | 0 (0.0%) | 21 (100.0%) |
| Cleaning & Maintenance | 0 (0.0%) | 0 (0.0%) |
| Personal Care & Service | 0 (0.0%) | 10 (100.0%) |
| Total (Category) | 36 (53.7%) | 31 (46.3%) |
| Total (Overall) | 92 (59.7%) | 62 (40.3%) |
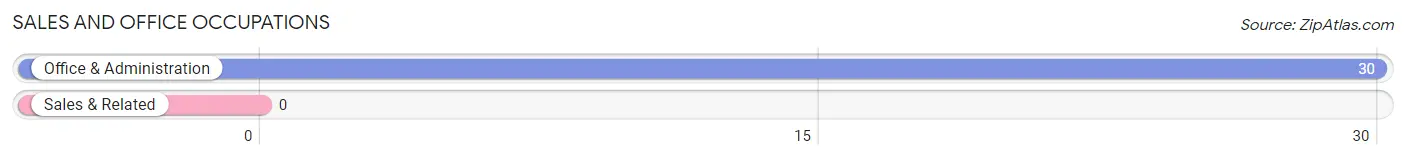
Sales and Office Occupations
The most common Sales and Office occupations in Gauley Bridge are , and Office & Administration (30 | 19.5%).
Sales and Office Occupations by Sex
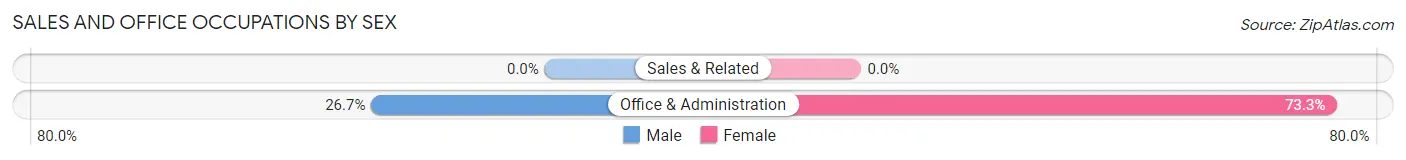
| Occupation | Male | Female |
| Sales & Related | 0 (0.0%) | 0 (0.0%) |
| Office & Administration | 8 (26.7%) | 22 (73.3%) |
| Total (Category) | 8 (26.7%) | 22 (73.3%) |
| Total (Overall) | 92 (59.7%) | 62 (40.3%) |
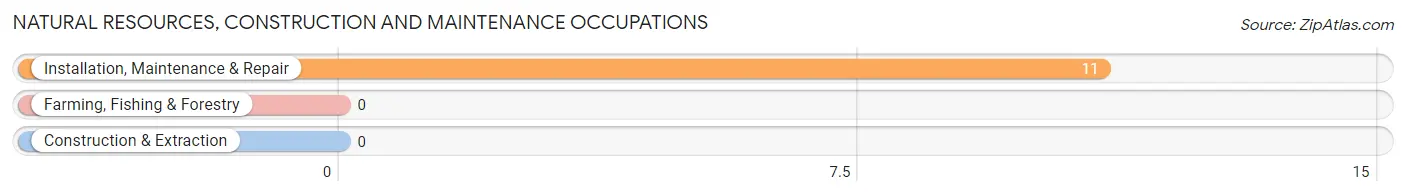
Natural Resources, Construction and Maintenance Occupations
The most common Natural Resources, Construction and Maintenance occupations in Gauley Bridge are , and Installation, Maintenance & Repair (11 | 7.1%).
Natural Resources, Construction and Maintenance Occupations by Sex
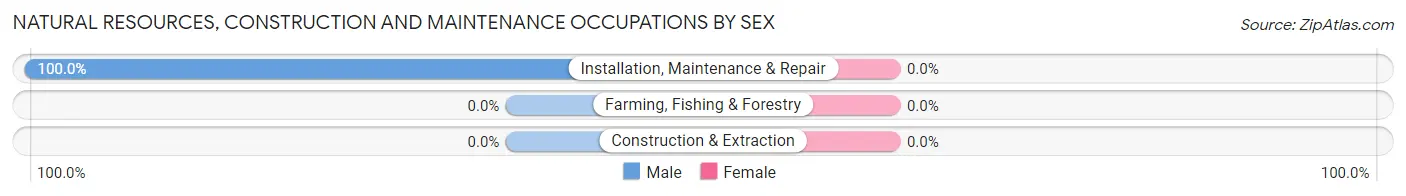
| Occupation | Male | Female |
| Farming, Fishing & Forestry | 0 (0.0%) | 0 (0.0%) |
| Construction & Extraction | 0 (0.0%) | 0 (0.0%) |
| Installation, Maintenance & Repair | 11 (100.0%) | 0 (0.0%) |
| Total (Category) | 11 (100.0%) | 0 (0.0%) |
| Total (Overall) | 92 (59.7%) | 62 (40.3%) |
Production, Transportation and Moving Occupations
The most common Production, Transportation and Moving occupations in Gauley Bridge are Production (31 | 20.1%), and Material Moving (6 | 3.9%).
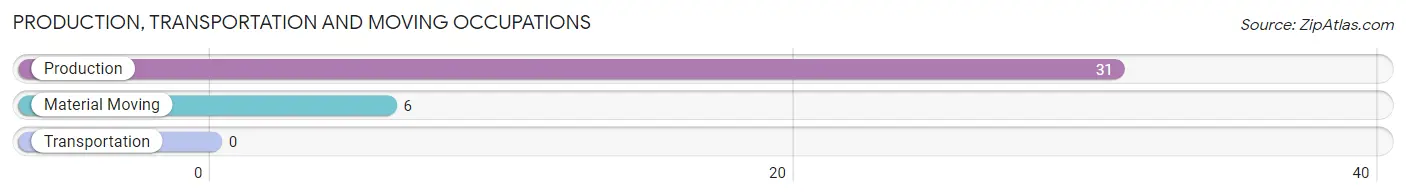
Production, Transportation and Moving Occupations by Sex
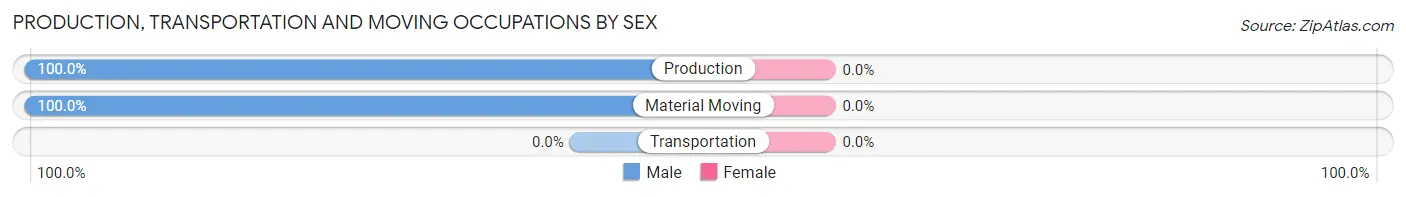
| Occupation | Male | Female |
| Production | 31 (100.0%) | 0 (0.0%) |
| Transportation | 0 (0.0%) | 0 (0.0%) |
| Material Moving | 6 (100.0%) | 0 (0.0%) |
| Total (Category) | 37 (100.0%) | 0 (0.0%) |
| Total (Overall) | 92 (59.7%) | 62 (40.3%) |
Employment Industries by Sex in Gauley Bridge
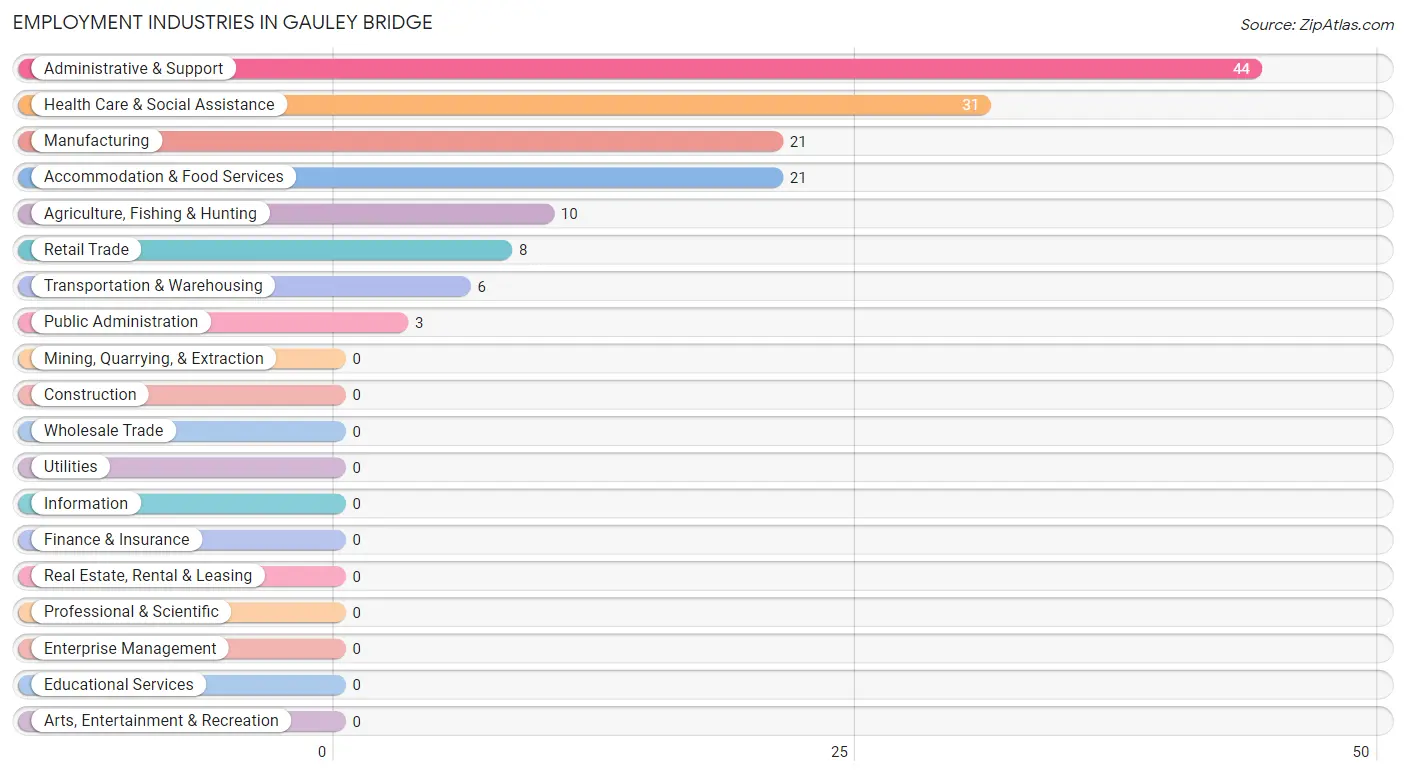
Employment Industries in Gauley Bridge
The major employment industries in Gauley Bridge include Administrative & Support (44 | 28.6%), Health Care & Social Assistance (31 | 20.1%), Manufacturing (21 | 13.6%), Accommodation & Food Services (21 | 13.6%), and Agriculture, Fishing & Hunting (10 | 6.5%).
Employment Industries by Sex in Gauley Bridge
The Gauley Bridge industries that see more men than women are Agriculture, Fishing & Hunting (100.0%), Manufacturing (100.0%), and Retail Trade (100.0%), whereas the industries that tend to have a higher number of women are Health Care & Social Assistance (100.0%), and Accommodation & Food Services (100.0%).
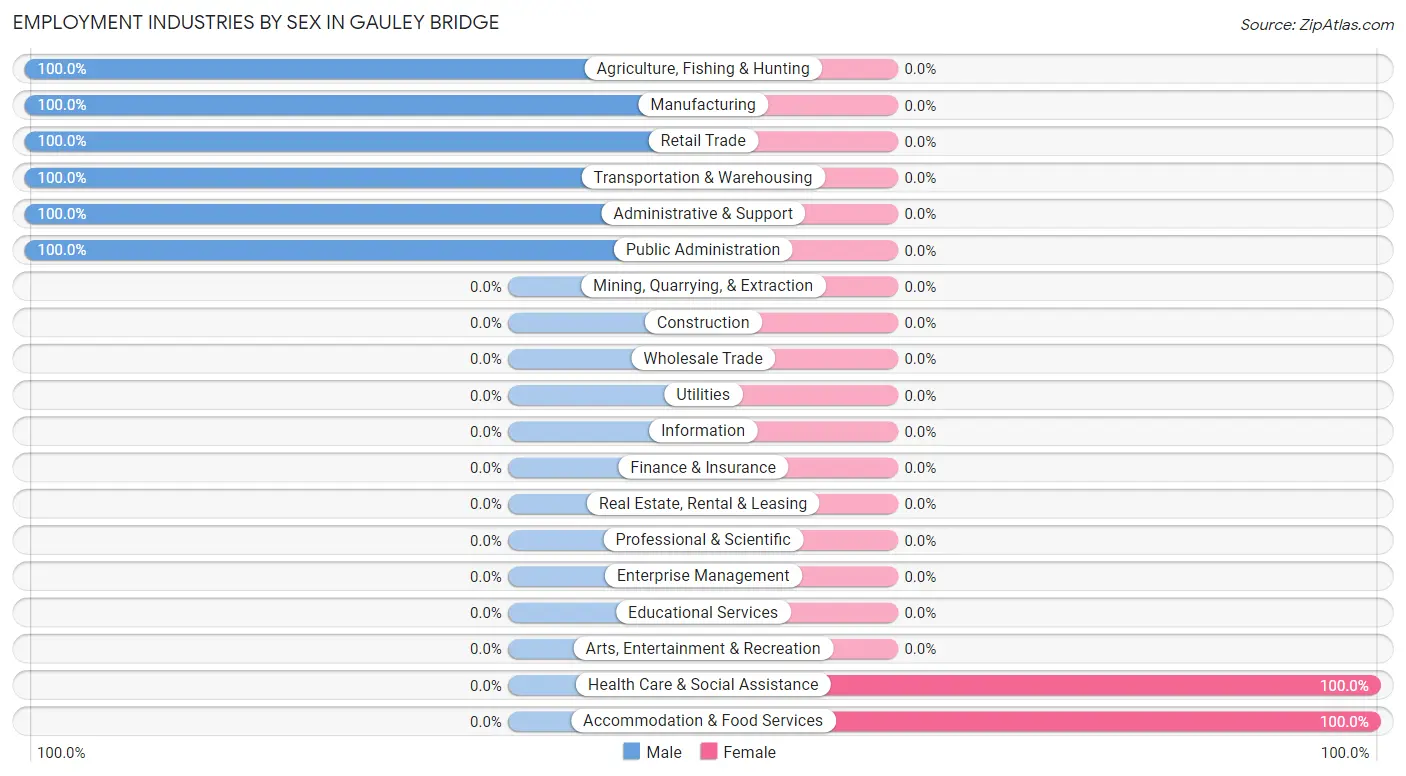
| Industry | Male | Female |
| Agriculture, Fishing & Hunting | 10 (100.0%) | 0 (0.0%) |
| Mining, Quarrying, & Extraction | 0 (0.0%) | 0 (0.0%) |
| Construction | 0 (0.0%) | 0 (0.0%) |
| Manufacturing | 21 (100.0%) | 0 (0.0%) |
| Wholesale Trade | 0 (0.0%) | 0 (0.0%) |
| Retail Trade | 8 (100.0%) | 0 (0.0%) |
| Transportation & Warehousing | 6 (100.0%) | 0 (0.0%) |
| Utilities | 0 (0.0%) | 0 (0.0%) |
| Information | 0 (0.0%) | 0 (0.0%) |
| Finance & Insurance | 0 (0.0%) | 0 (0.0%) |
| Real Estate, Rental & Leasing | 0 (0.0%) | 0 (0.0%) |
| Professional & Scientific | 0 (0.0%) | 0 (0.0%) |
| Enterprise Management | 0 (0.0%) | 0 (0.0%) |
| Administrative & Support | 44 (100.0%) | 0 (0.0%) |
| Educational Services | 0 (0.0%) | 0 (0.0%) |
| Health Care & Social Assistance | 0 (0.0%) | 31 (100.0%) |
| Arts, Entertainment & Recreation | 0 (0.0%) | 0 (0.0%) |
| Accommodation & Food Services | 0 (0.0%) | 21 (100.0%) |
| Public Administration | 3 (100.0%) | 0 (0.0%) |
| Total | 92 (59.7%) | 62 (40.3%) |
Education in Gauley Bridge
School Enrollment in Gauley Bridge
The most common levels of schooling among the 84 students in Gauley Bridge are high school (48 | 57.1%), nursery / preschool (16 | 19.1%), and kindergarten (12 | 14.3%).
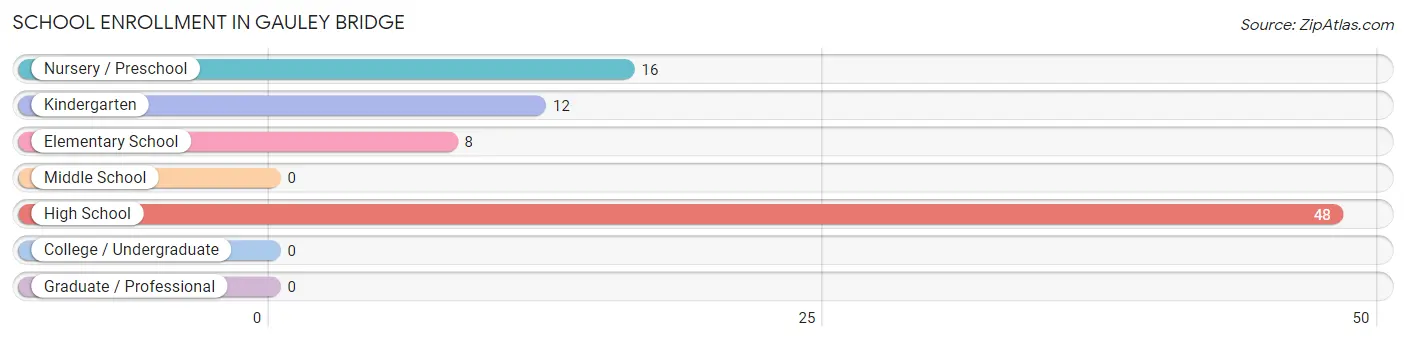
| School Level | # Students | % Students |
| Nursery / Preschool | 16 | 19.1% |
| Kindergarten | 12 | 14.3% |
| Elementary School | 8 | 9.5% |
| Middle School | 0 | 0.0% |
| High School | 48 | 57.1% |
| College / Undergraduate | 0 | 0.0% |
| Graduate / Professional | 0 | 0.0% |
| Total | 84 | 100.0% |
School Enrollment by Age by Funding Source in Gauley Bridge
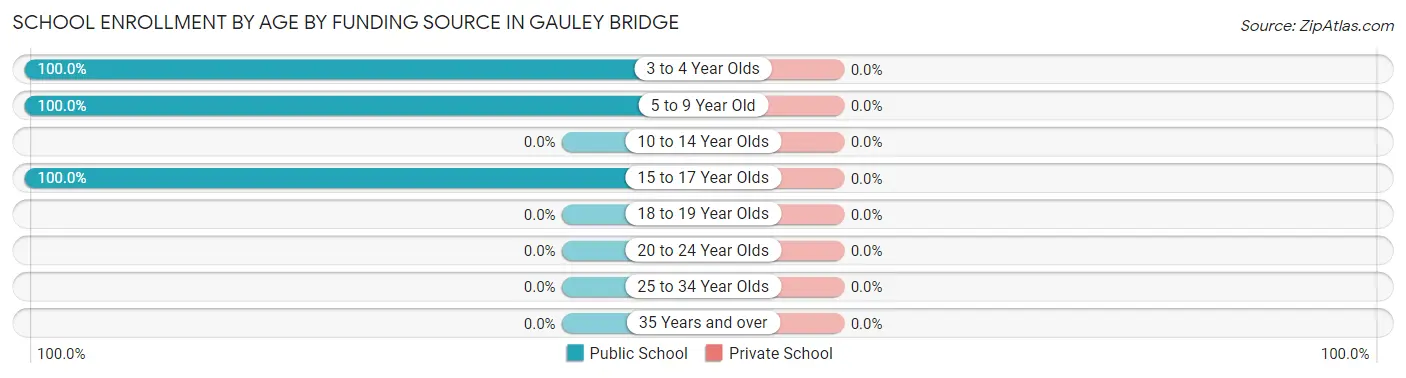
| Age Bracket | Public School | Private School |
| 3 to 4 Year Olds | 16 (100.0%) | 0 (0.0%) |
| 5 to 9 Year Old | 20 (100.0%) | 0 (0.0%) |
| 10 to 14 Year Olds | 0 (0.0%) | 0 (0.0%) |
| 15 to 17 Year Olds | 48 (100.0%) | 0 (0.0%) |
| 18 to 19 Year Olds | 0 (0.0%) | 0 (0.0%) |
| 20 to 24 Year Olds | 0 (0.0%) | 0 (0.0%) |
| 25 to 34 Year Olds | 0 (0.0%) | 0 (0.0%) |
| 35 Years and over | 0 (0.0%) | 0 (0.0%) |
| Total | 84 (100.0%) | 0 (0.0%) |
Educational Attainment by Field of Study in Gauley Bridge
Education (18 | 34.6%), engineering (11 | 21.1%), science & technology (9 | 17.3%), business (8 | 15.4%), and arts & humanities (6 | 11.5%) are the most common fields of study among 52 individuals in Gauley Bridge who have obtained a bachelor's degree or higher.
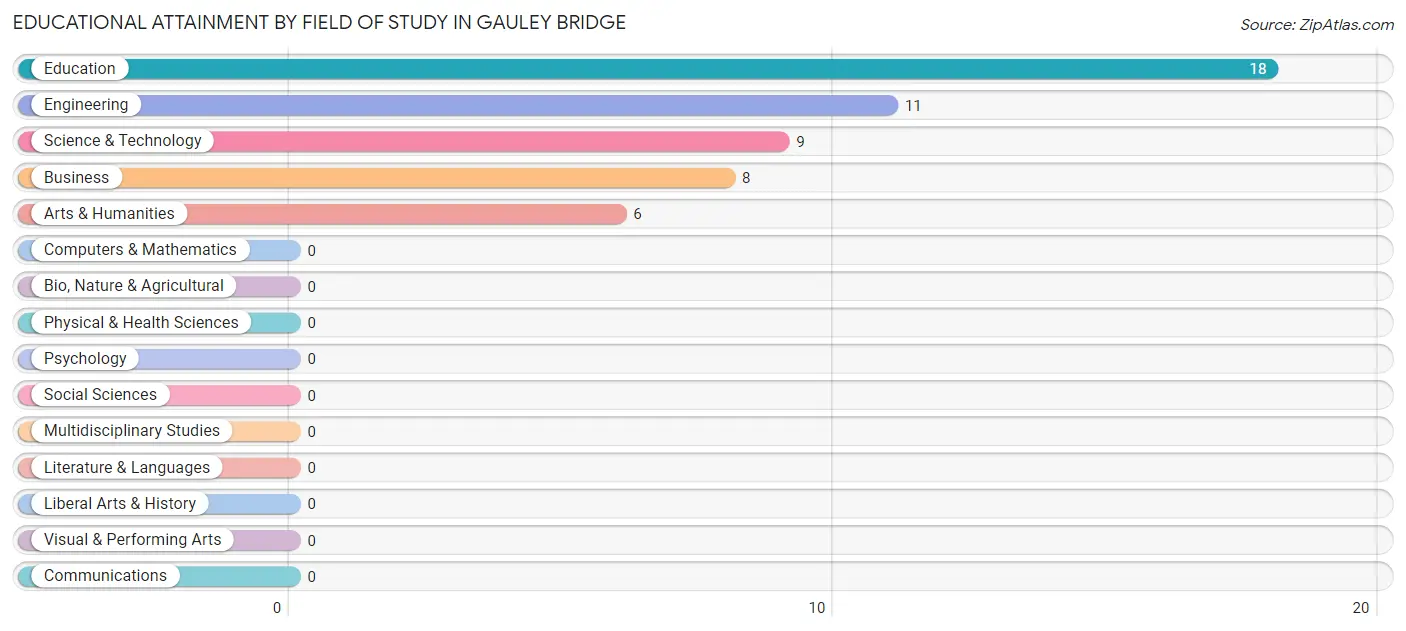
| Field of Study | # Graduates | % Graduates |
| Computers & Mathematics | 0 | 0.0% |
| Bio, Nature & Agricultural | 0 | 0.0% |
| Physical & Health Sciences | 0 | 0.0% |
| Psychology | 0 | 0.0% |
| Social Sciences | 0 | 0.0% |
| Engineering | 11 | 21.1% |
| Multidisciplinary Studies | 0 | 0.0% |
| Science & Technology | 9 | 17.3% |
| Business | 8 | 15.4% |
| Education | 18 | 34.6% |
| Literature & Languages | 0 | 0.0% |
| Liberal Arts & History | 0 | 0.0% |
| Visual & Performing Arts | 0 | 0.0% |
| Communications | 0 | 0.0% |
| Arts & Humanities | 6 | 11.5% |
| Total | 52 | 100.0% |
Transportation & Commute in Gauley Bridge
Vehicle Availability by Sex in Gauley Bridge
The most prevalent vehicle ownership categories in Gauley Bridge are males with 1 vehicle (36, accounting for 39.1%) and females with 1 vehicle (0, making up 58.1%).
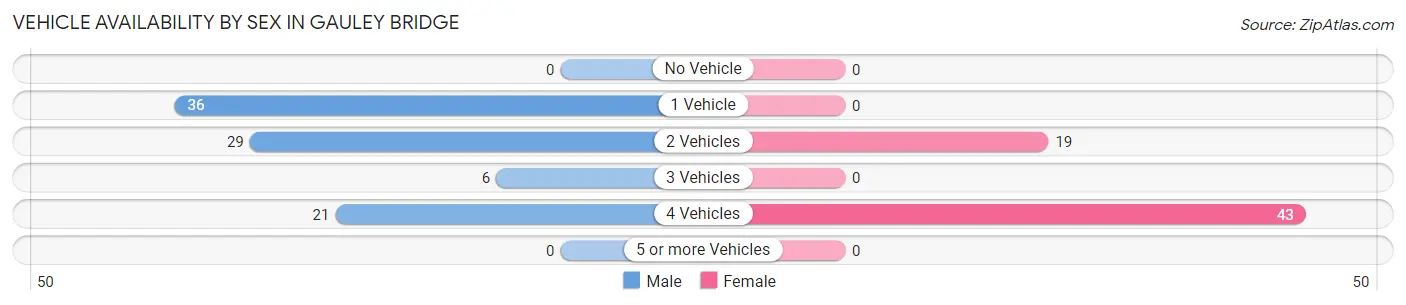
| Vehicles Available | Male | Female |
| No Vehicle | 0 (0.0%) | 0 (0.0%) |
| 1 Vehicle | 36 (39.1%) | 0 (0.0%) |
| 2 Vehicles | 29 (31.5%) | 19 (30.6%) |
| 3 Vehicles | 6 (6.5%) | 0 (0.0%) |
| 4 Vehicles | 21 (22.8%) | 43 (69.4%) |
| 5 or more Vehicles | 0 (0.0%) | 0 (0.0%) |
| Total | 92 (100.0%) | 62 (100.0%) |
Commute Time in Gauley Bridge
The most frequently occuring commute durations in Gauley Bridge are 20 to 24 minutes (34 commuters, 22.1%), 60 to 89 minutes (31 commuters, 20.1%), and 30 to 34 minutes (29 commuters, 18.8%).
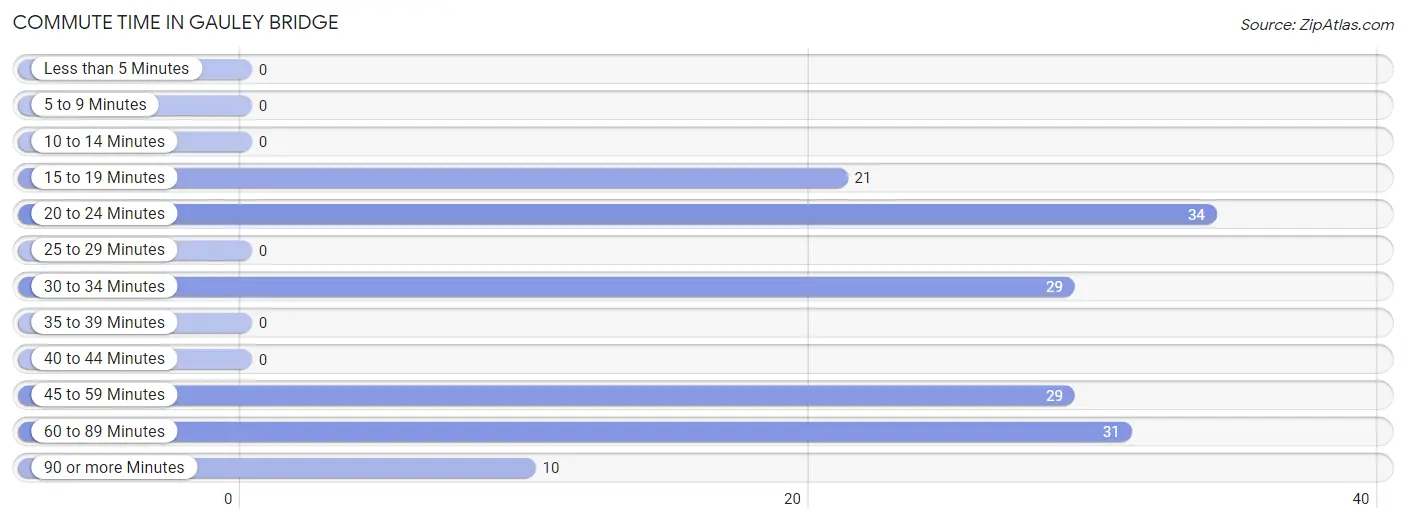
| Commute Time | # Commuters | % Commuters |
| Less than 5 Minutes | 0 | 0.0% |
| 5 to 9 Minutes | 0 | 0.0% |
| 10 to 14 Minutes | 0 | 0.0% |
| 15 to 19 Minutes | 21 | 13.6% |
| 20 to 24 Minutes | 34 | 22.1% |
| 25 to 29 Minutes | 0 | 0.0% |
| 30 to 34 Minutes | 29 | 18.8% |
| 35 to 39 Minutes | 0 | 0.0% |
| 40 to 44 Minutes | 0 | 0.0% |
| 45 to 59 Minutes | 29 | 18.8% |
| 60 to 89 Minutes | 31 | 20.1% |
| 90 or more Minutes | 10 | 6.5% |
Commute Time by Sex in Gauley Bridge
The most common commute times in Gauley Bridge are 60 to 89 minutes (31 commuters, 33.7%) for males and 20 to 24 minutes (31 commuters, 50.0%) for females.
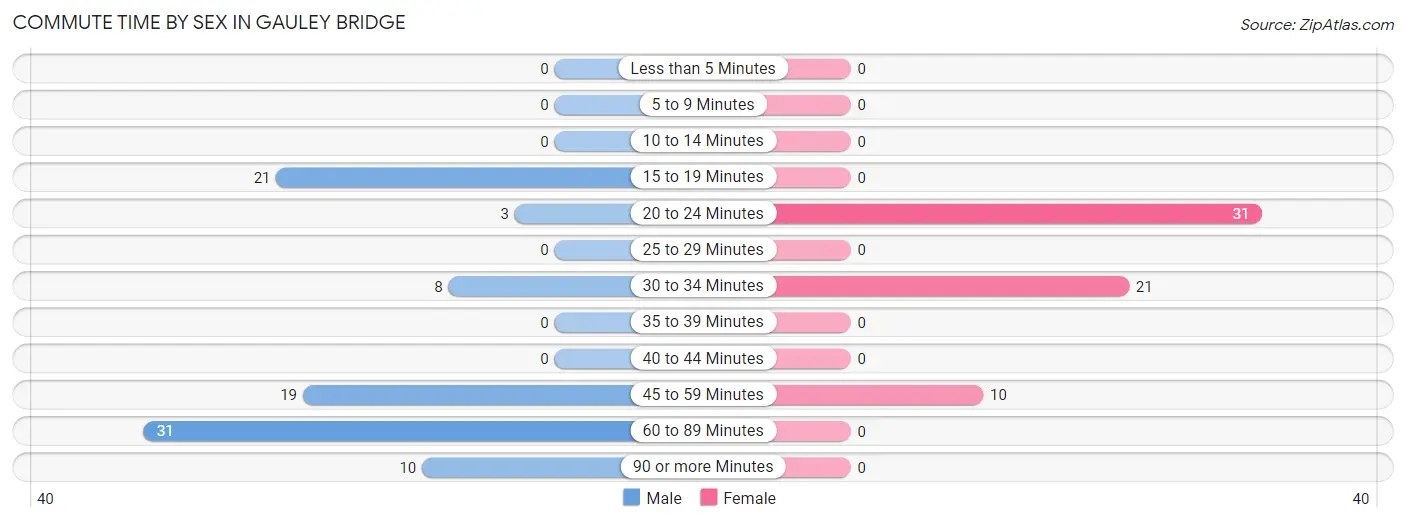
| Commute Time | Male | Female |
| Less than 5 Minutes | 0 (0.0%) | 0 (0.0%) |
| 5 to 9 Minutes | 0 (0.0%) | 0 (0.0%) |
| 10 to 14 Minutes | 0 (0.0%) | 0 (0.0%) |
| 15 to 19 Minutes | 21 (22.8%) | 0 (0.0%) |
| 20 to 24 Minutes | 3 (3.3%) | 31 (50.0%) |
| 25 to 29 Minutes | 0 (0.0%) | 0 (0.0%) |
| 30 to 34 Minutes | 8 (8.7%) | 21 (33.9%) |
| 35 to 39 Minutes | 0 (0.0%) | 0 (0.0%) |
| 40 to 44 Minutes | 0 (0.0%) | 0 (0.0%) |
| 45 to 59 Minutes | 19 (20.6%) | 10 (16.1%) |
| 60 to 89 Minutes | 31 (33.7%) | 0 (0.0%) |
| 90 or more Minutes | 10 (10.9%) | 0 (0.0%) |
Time of Departure to Work by Sex in Gauley Bridge
The most frequent times of departure to work in Gauley Bridge are 7:00 AM to 7:29 AM (40, 43.5%) for males and 8:00 AM to 8:29 AM (32, 51.6%) for females.
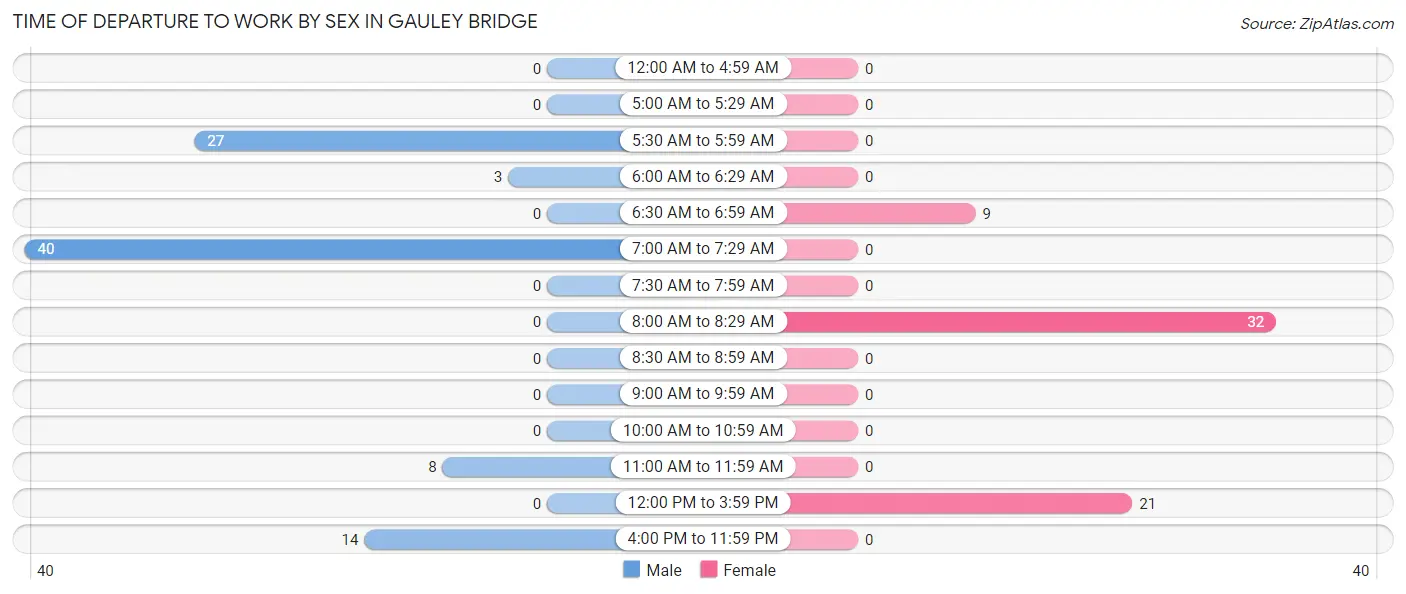
| Time of Departure | Male | Female |
| 12:00 AM to 4:59 AM | 0 (0.0%) | 0 (0.0%) |
| 5:00 AM to 5:29 AM | 0 (0.0%) | 0 (0.0%) |
| 5:30 AM to 5:59 AM | 27 (29.3%) | 0 (0.0%) |
| 6:00 AM to 6:29 AM | 3 (3.3%) | 0 (0.0%) |
| 6:30 AM to 6:59 AM | 0 (0.0%) | 9 (14.5%) |
| 7:00 AM to 7:29 AM | 40 (43.5%) | 0 (0.0%) |
| 7:30 AM to 7:59 AM | 0 (0.0%) | 0 (0.0%) |
| 8:00 AM to 8:29 AM | 0 (0.0%) | 32 (51.6%) |
| 8:30 AM to 8:59 AM | 0 (0.0%) | 0 (0.0%) |
| 9:00 AM to 9:59 AM | 0 (0.0%) | 0 (0.0%) |
| 10:00 AM to 10:59 AM | 0 (0.0%) | 0 (0.0%) |
| 11:00 AM to 11:59 AM | 8 (8.7%) | 0 (0.0%) |
| 12:00 PM to 3:59 PM | 0 (0.0%) | 21 (33.9%) |
| 4:00 PM to 11:59 PM | 14 (15.2%) | 0 (0.0%) |
| Total | 92 (100.0%) | 62 (100.0%) |
Housing Occupancy in Gauley Bridge
Occupancy by Ownership in Gauley Bridge
Of the total 212 dwellings in Gauley Bridge, owner-occupied units account for 105 (49.5%), while renter-occupied units make up 107 (50.5%).
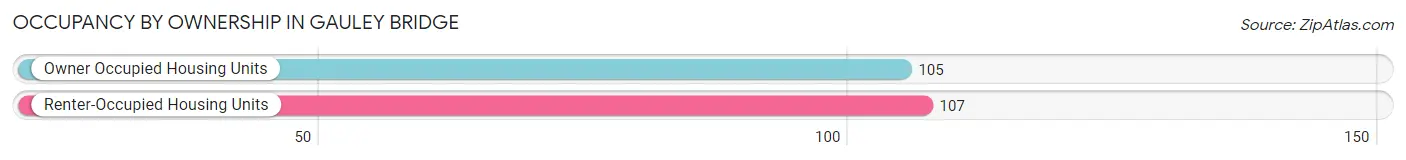
| Occupancy | # Housing Units | % Housing Units |
| Owner Occupied Housing Units | 105 | 49.5% |
| Renter-Occupied Housing Units | 107 | 50.5% |
| Total Occupied Housing Units | 212 | 100.0% |
Occupancy by Household Size in Gauley Bridge
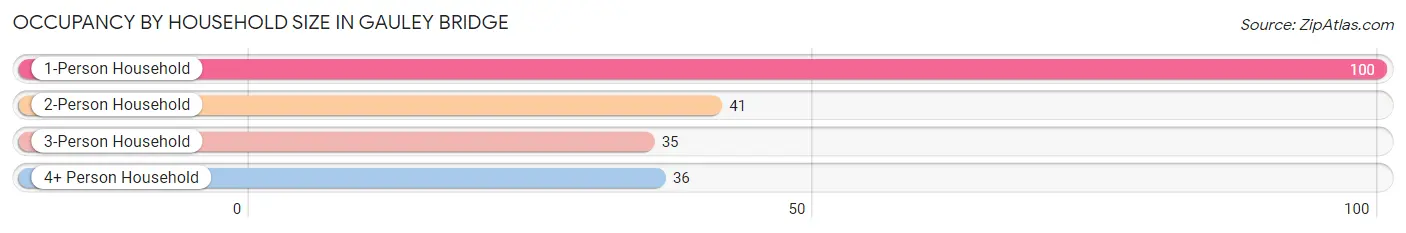
| Household Size | # Housing Units | % Housing Units |
| 1-Person Household | 100 | 47.2% |
| 2-Person Household | 41 | 19.3% |
| 3-Person Household | 35 | 16.5% |
| 4+ Person Household | 36 | 17.0% |
| Total Housing Units | 212 | 100.0% |
Occupancy by Ownership by Household Size in Gauley Bridge
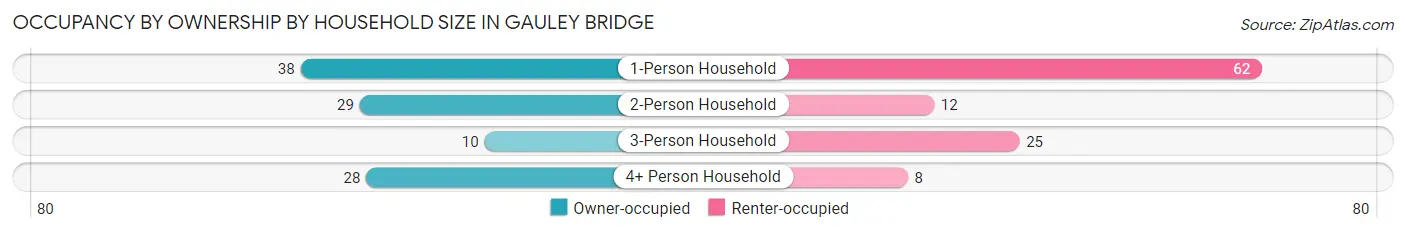
| Household Size | Owner-occupied | Renter-occupied |
| 1-Person Household | 38 (38.0%) | 62 (62.0%) |
| 2-Person Household | 29 (70.7%) | 12 (29.3%) |
| 3-Person Household | 10 (28.6%) | 25 (71.4%) |
| 4+ Person Household | 28 (77.8%) | 8 (22.2%) |
| Total Housing Units | 105 (49.5%) | 107 (50.5%) |
Occupancy by Educational Attainment in Gauley Bridge
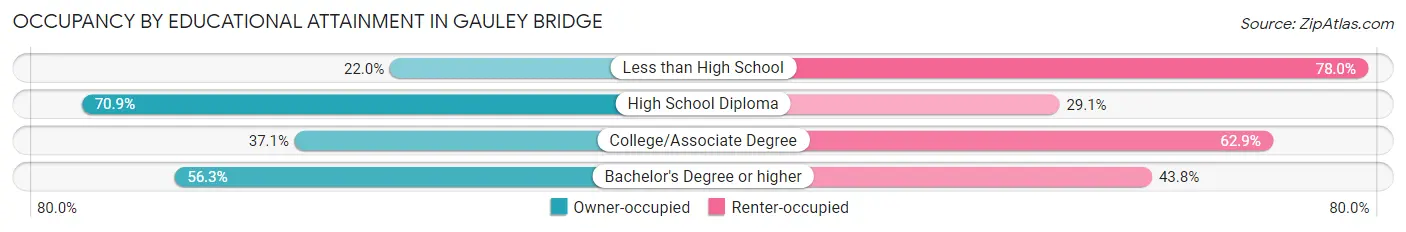
| Household Size | Owner-occupied | Renter-occupied |
| Less than High School | 13 (22.0%) | 46 (78.0%) |
| High School Diploma | 61 (70.9%) | 25 (29.1%) |
| College/Associate Degree | 13 (37.1%) | 22 (62.9%) |
| Bachelor's Degree or higher | 18 (56.2%) | 14 (43.8%) |
Occupancy by Age of Householder in Gauley Bridge
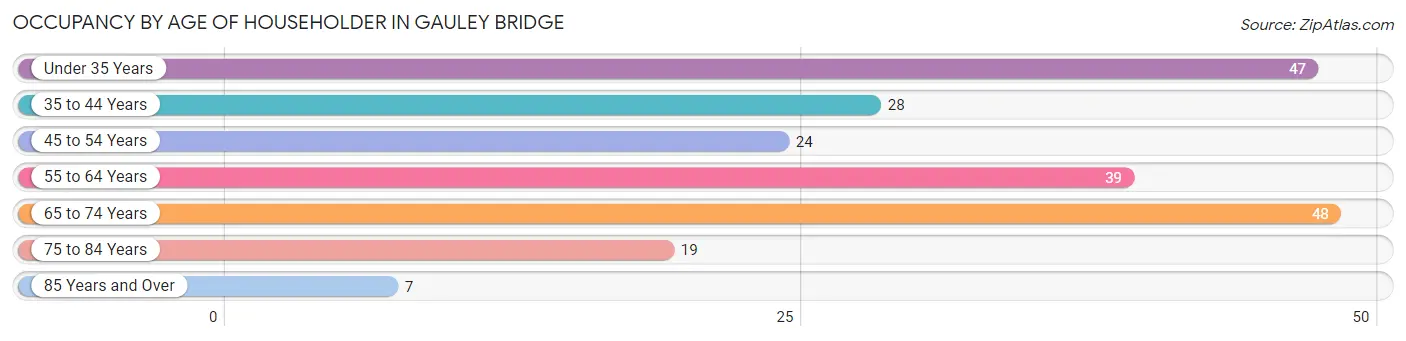
| Age Bracket | # Households | % Households |
| Under 35 Years | 47 | 22.2% |
| 35 to 44 Years | 28 | 13.2% |
| 45 to 54 Years | 24 | 11.3% |
| 55 to 64 Years | 39 | 18.4% |
| 65 to 74 Years | 48 | 22.6% |
| 75 to 84 Years | 19 | 9.0% |
| 85 Years and Over | 7 | 3.3% |
| Total | 212 | 100.0% |
Housing Finances in Gauley Bridge
Median Income by Occupancy in Gauley Bridge
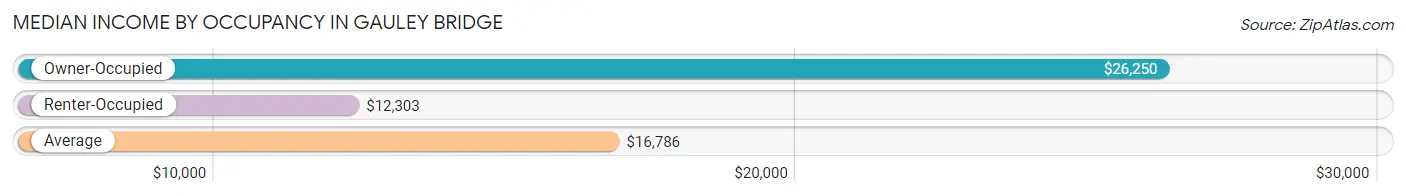
| Occupancy Type | # Households | Median Income |
| Owner-Occupied | 105 (49.5%) | $26,250 |
| Renter-Occupied | 107 (50.5%) | $12,303 |
| Average | 212 (100.0%) | $16,786 |
Occupancy by Householder Income Bracket in Gauley Bridge
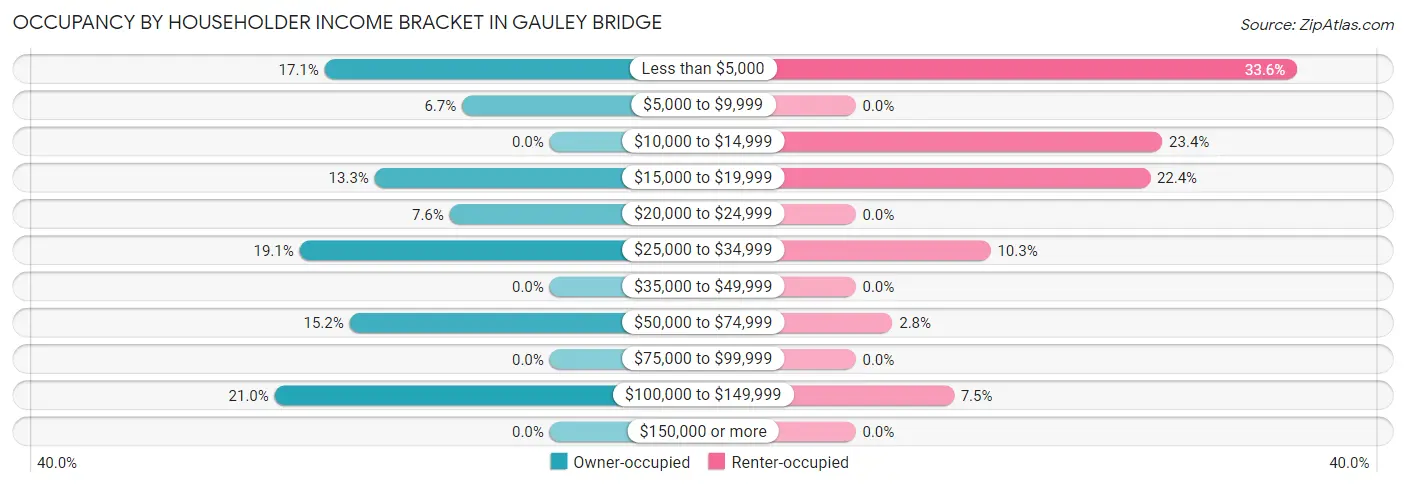
| Income Bracket | Owner-occupied | Renter-occupied |
| Less than $5,000 | 18 (17.1%) | 36 (33.6%) |
| $5,000 to $9,999 | 7 (6.7%) | 0 (0.0%) |
| $10,000 to $14,999 | 0 (0.0%) | 25 (23.4%) |
| $15,000 to $19,999 | 14 (13.3%) | 24 (22.4%) |
| $20,000 to $24,999 | 8 (7.6%) | 0 (0.0%) |
| $25,000 to $34,999 | 20 (19.1%) | 11 (10.3%) |
| $35,000 to $49,999 | 0 (0.0%) | 0 (0.0%) |
| $50,000 to $74,999 | 16 (15.2%) | 3 (2.8%) |
| $75,000 to $99,999 | 0 (0.0%) | 0 (0.0%) |
| $100,000 to $149,999 | 22 (20.9%) | 8 (7.5%) |
| $150,000 or more | 0 (0.0%) | 0 (0.0%) |
| Total | 105 (100.0%) | 107 (100.0%) |
Monthly Housing Cost Tiers in Gauley Bridge
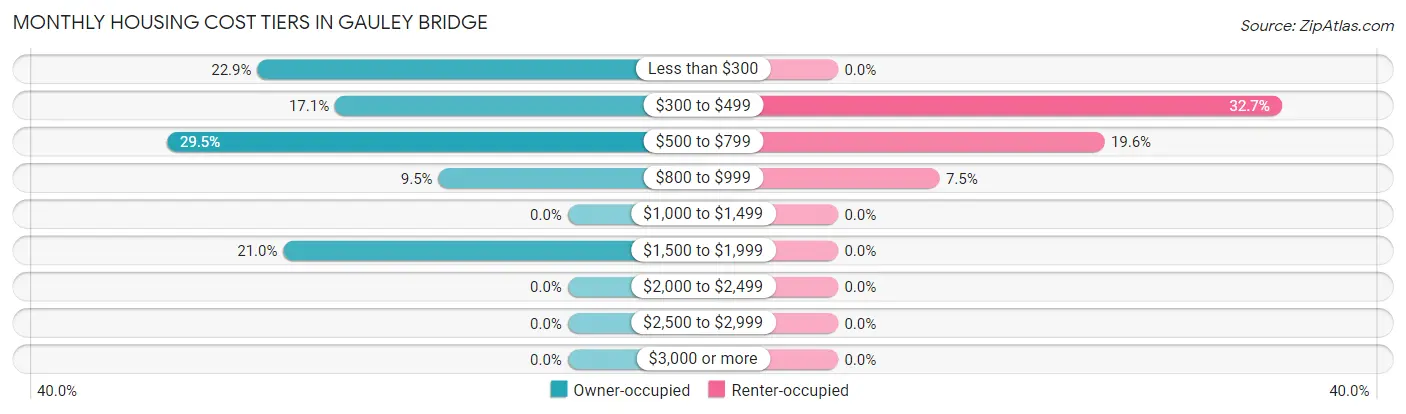
| Monthly Cost | Owner-occupied | Renter-occupied |
| Less than $300 | 24 (22.9%) | 0 (0.0%) |
| $300 to $499 | 18 (17.1%) | 35 (32.7%) |
| $500 to $799 | 31 (29.5%) | 21 (19.6%) |
| $800 to $999 | 10 (9.5%) | 8 (7.5%) |
| $1,000 to $1,499 | 0 (0.0%) | 0 (0.0%) |
| $1,500 to $1,999 | 22 (20.9%) | 0 (0.0%) |
| $2,000 to $2,499 | 0 (0.0%) | 0 (0.0%) |
| $2,500 to $2,999 | 0 (0.0%) | 0 (0.0%) |
| $3,000 or more | 0 (0.0%) | 0 (0.0%) |
| Total | 105 (100.0%) | 107 (100.0%) |
Physical Housing Characteristics in Gauley Bridge
Housing Structures in Gauley Bridge
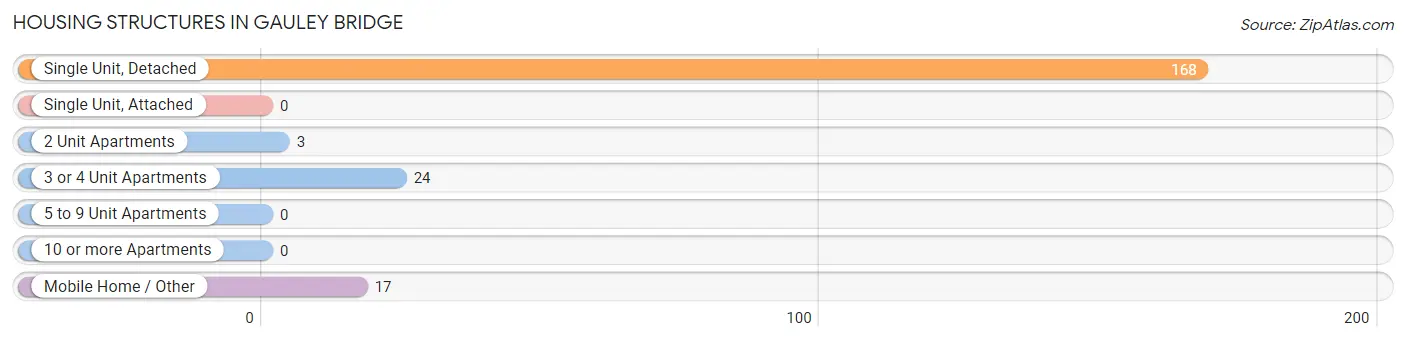
| Structure Type | # Housing Units | % Housing Units |
| Single Unit, Detached | 168 | 79.2% |
| Single Unit, Attached | 0 | 0.0% |
| 2 Unit Apartments | 3 | 1.4% |
| 3 or 4 Unit Apartments | 24 | 11.3% |
| 5 to 9 Unit Apartments | 0 | 0.0% |
| 10 or more Apartments | 0 | 0.0% |
| Mobile Home / Other | 17 | 8.0% |
| Total | 212 | 100.0% |
Housing Structures by Occupancy in Gauley Bridge
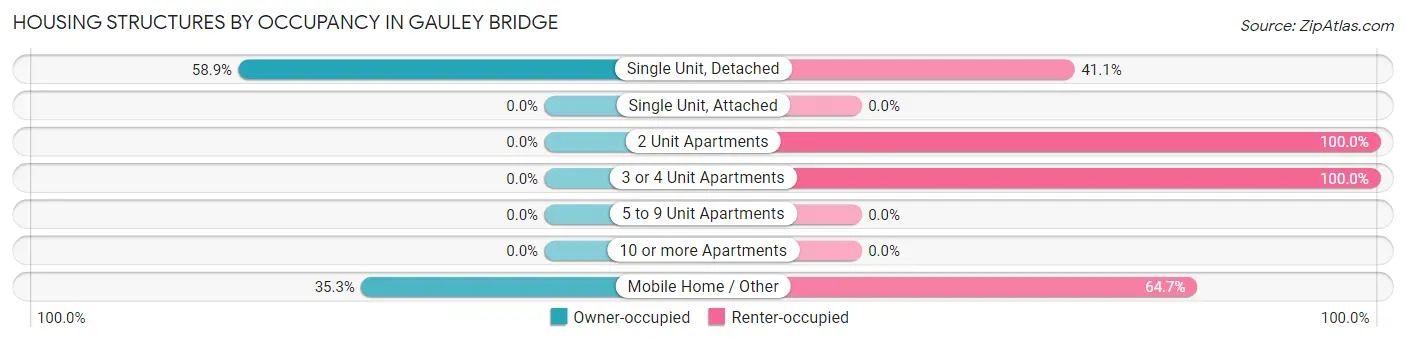
| Structure Type | Owner-occupied | Renter-occupied |
| Single Unit, Detached | 99 (58.9%) | 69 (41.1%) |
| Single Unit, Attached | 0 (0.0%) | 0 (0.0%) |
| 2 Unit Apartments | 0 (0.0%) | 3 (100.0%) |
| 3 or 4 Unit Apartments | 0 (0.0%) | 24 (100.0%) |
| 5 to 9 Unit Apartments | 0 (0.0%) | 0 (0.0%) |
| 10 or more Apartments | 0 (0.0%) | 0 (0.0%) |
| Mobile Home / Other | 6 (35.3%) | 11 (64.7%) |
| Total | 105 (49.5%) | 107 (50.5%) |
Housing Structures by Number of Rooms in Gauley Bridge
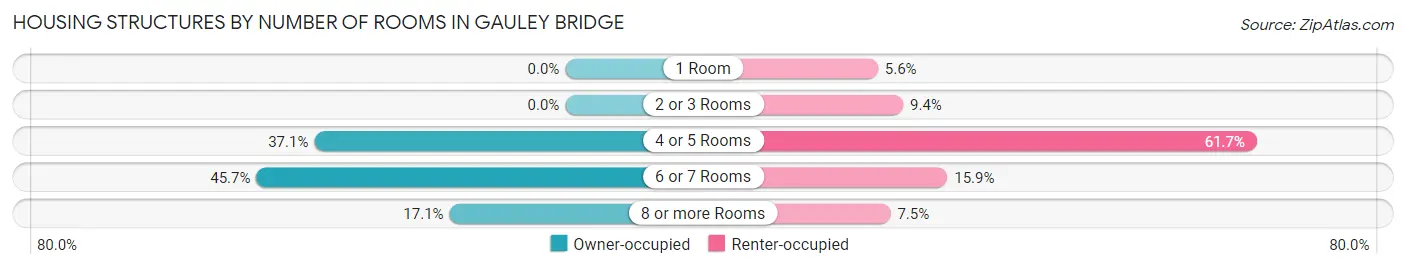
| Number of Rooms | Owner-occupied | Renter-occupied |
| 1 Room | 0 (0.0%) | 6 (5.6%) |
| 2 or 3 Rooms | 0 (0.0%) | 10 (9.3%) |
| 4 or 5 Rooms | 39 (37.1%) | 66 (61.7%) |
| 6 or 7 Rooms | 48 (45.7%) | 17 (15.9%) |
| 8 or more Rooms | 18 (17.1%) | 8 (7.5%) |
| Total | 105 (100.0%) | 107 (100.0%) |
Housing Structure by Heating Type in Gauley Bridge
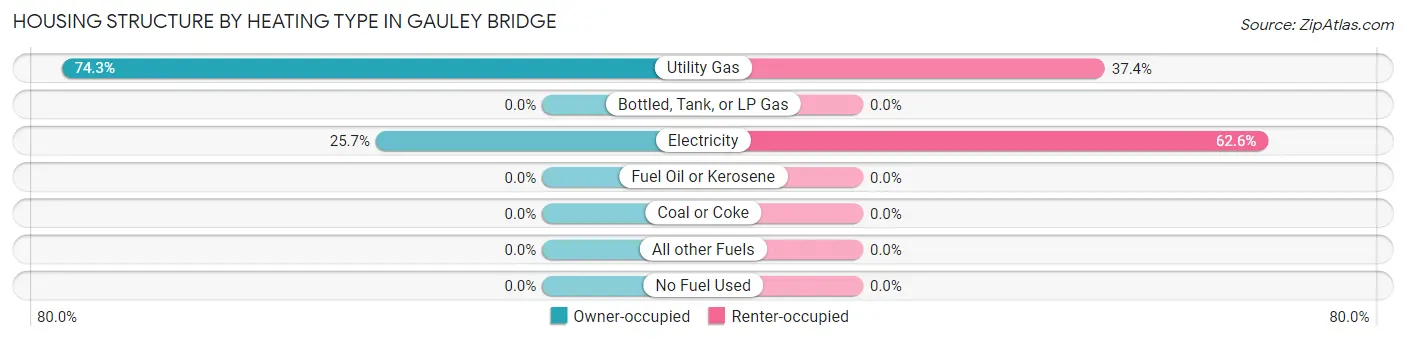
| Heating Type | Owner-occupied | Renter-occupied |
| Utility Gas | 78 (74.3%) | 40 (37.4%) |
| Bottled, Tank, or LP Gas | 0 (0.0%) | 0 (0.0%) |
| Electricity | 27 (25.7%) | 67 (62.6%) |
| Fuel Oil or Kerosene | 0 (0.0%) | 0 (0.0%) |
| Coal or Coke | 0 (0.0%) | 0 (0.0%) |
| All other Fuels | 0 (0.0%) | 0 (0.0%) |
| No Fuel Used | 0 (0.0%) | 0 (0.0%) |
| Total | 105 (100.0%) | 107 (100.0%) |
Household Vehicle Usage in Gauley Bridge
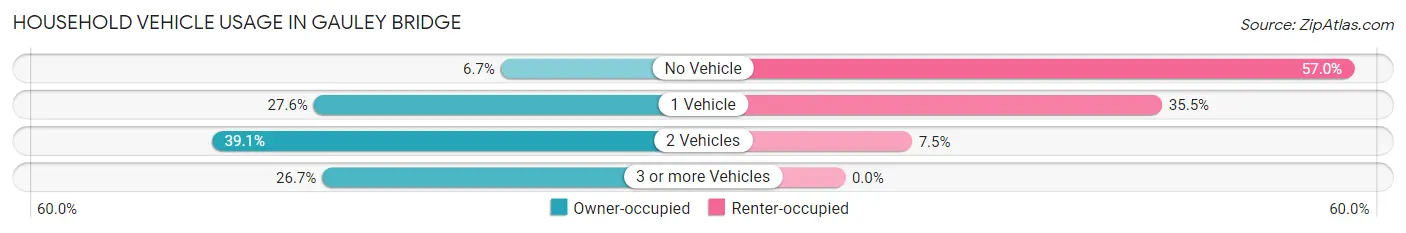
| Vehicles per Household | Owner-occupied | Renter-occupied |
| No Vehicle | 7 (6.7%) | 61 (57.0%) |
| 1 Vehicle | 29 (27.6%) | 38 (35.5%) |
| 2 Vehicles | 41 (39.1%) | 8 (7.5%) |
| 3 or more Vehicles | 28 (26.7%) | 0 (0.0%) |
| Total | 105 (100.0%) | 107 (100.0%) |
Real Estate & Mortgages in Gauley Bridge
Real Estate and Mortgage Overview in Gauley Bridge
| Characteristic | Without Mortgage | With Mortgage |
| Housing Units | 50 | 55 |
| Median Property Value | $58,300 | $77,400 |
| Median Household Income | $25,227 | $0 |
| Monthly Housing Costs | $306 | $0 |
| Real Estate Taxes | $423 | $0 |
Property Value by Mortgage Status in Gauley Bridge
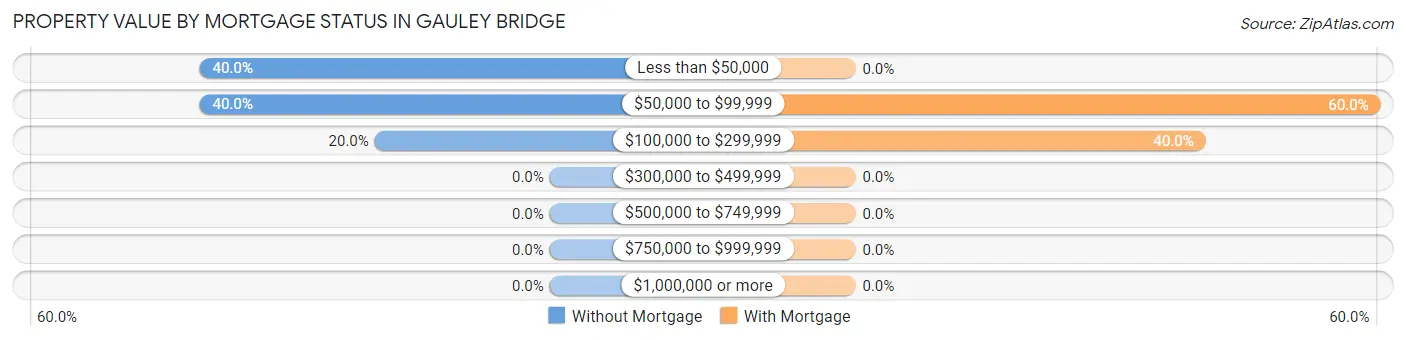
| Property Value | Without Mortgage | With Mortgage |
| Less than $50,000 | 20 (40.0%) | 0 (0.0%) |
| $50,000 to $99,999 | 20 (40.0%) | 33 (60.0%) |
| $100,000 to $299,999 | 10 (20.0%) | 22 (40.0%) |
| $300,000 to $499,999 | 0 (0.0%) | 0 (0.0%) |
| $500,000 to $749,999 | 0 (0.0%) | 0 (0.0%) |
| $750,000 to $999,999 | 0 (0.0%) | 0 (0.0%) |
| $1,000,000 or more | 0 (0.0%) | 0 (0.0%) |
| Total | 50 (100.0%) | 55 (100.0%) |
Household Income by Mortgage Status in Gauley Bridge
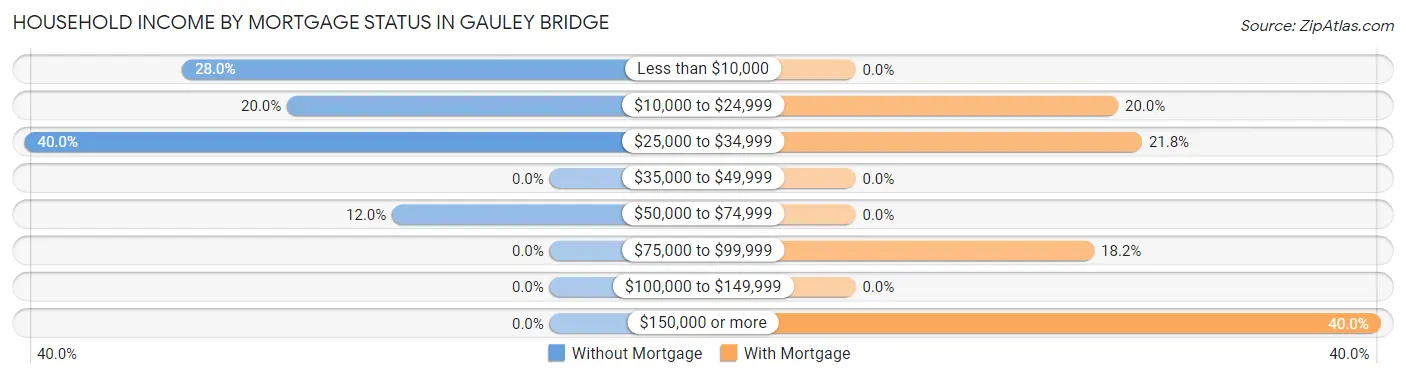
| Household Income | Without Mortgage | With Mortgage |
| Less than $10,000 | 14 (28.0%) | 0 (0.0%) |
| $10,000 to $24,999 | 10 (20.0%) | 11 (20.0%) |
| $25,000 to $34,999 | 20 (40.0%) | 12 (21.8%) |
| $35,000 to $49,999 | 0 (0.0%) | 0 (0.0%) |
| $50,000 to $74,999 | 6 (12.0%) | 0 (0.0%) |
| $75,000 to $99,999 | 0 (0.0%) | 10 (18.2%) |
| $100,000 to $149,999 | 0 (0.0%) | 0 (0.0%) |
| $150,000 or more | 0 (0.0%) | 22 (40.0%) |
| Total | 50 (100.0%) | 55 (100.0%) |
Property Value to Household Income Ratio in Gauley Bridge
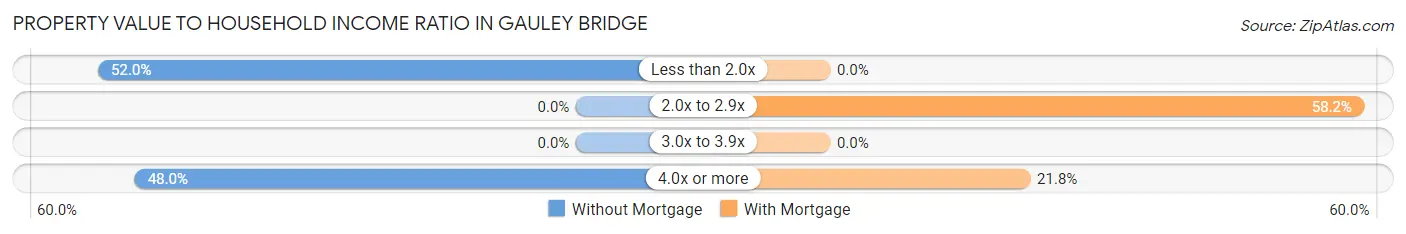
| Value-to-Income Ratio | Without Mortgage | With Mortgage |
| Less than 2.0x | 26 (52.0%) | 0 (0.0%) |
| 2.0x to 2.9x | 0 (0.0%) | 32 (58.2%) |
| 3.0x to 3.9x | 0 (0.0%) | 0 (0.0%) |
| 4.0x or more | 24 (48.0%) | 12 (21.8%) |
| Total | 50 (100.0%) | 55 (100.0%) |
Real Estate Taxes by Mortgage Status in Gauley Bridge
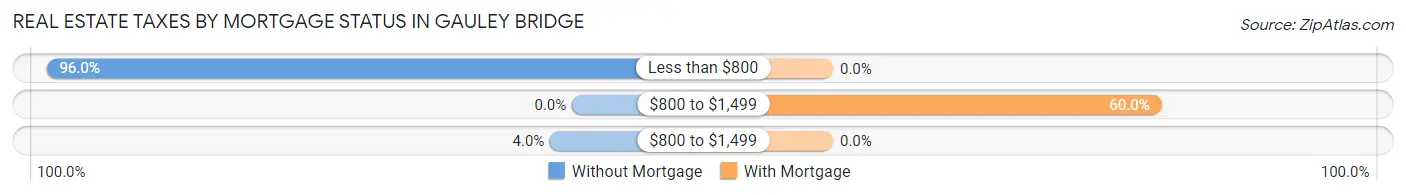
| Property Taxes | Without Mortgage | With Mortgage |
| Less than $800 | 48 (96.0%) | 0 (0.0%) |
| $800 to $1,499 | 0 (0.0%) | 33 (60.0%) |
| $800 to $1,499 | 2 (4.0%) | 0 (0.0%) |
| Total | 50 (100.0%) | 55 (100.0%) |
Health & Disability in Gauley Bridge
Health Insurance Coverage by Age in Gauley Bridge
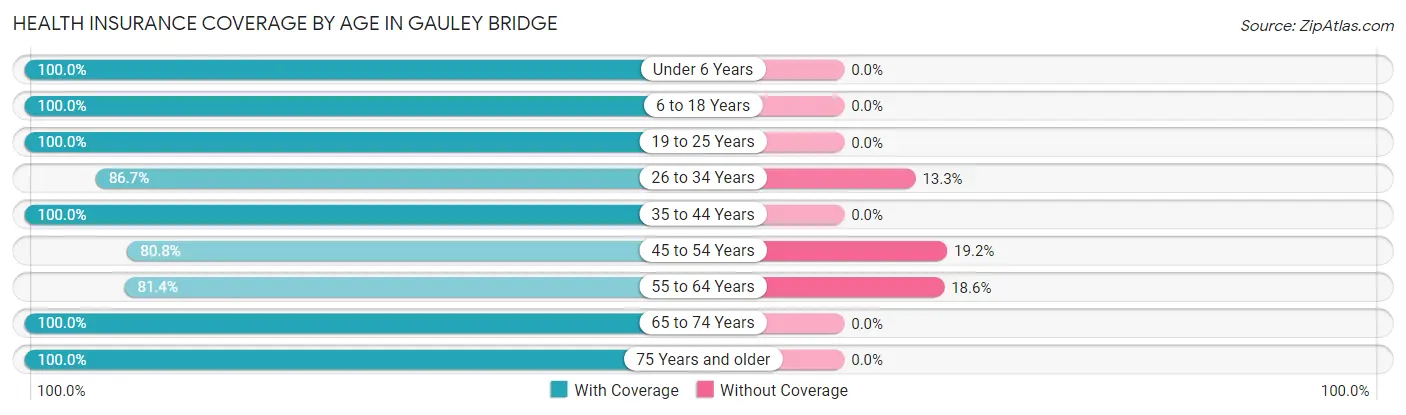
| Age Bracket | With Coverage | Without Coverage |
| Under 6 Years | 40 (100.0%) | 0 (0.0%) |
| 6 to 18 Years | 68 (100.0%) | 0 (0.0%) |
| 19 to 25 Years | 21 (100.0%) | 0 (0.0%) |
| 26 to 34 Years | 85 (86.7%) | 13 (13.3%) |
| 35 to 44 Years | 38 (100.0%) | 0 (0.0%) |
| 45 to 54 Years | 59 (80.8%) | 14 (19.2%) |
| 55 to 64 Years | 48 (81.4%) | 11 (18.6%) |
| 65 to 74 Years | 48 (100.0%) | 0 (0.0%) |
| 75 Years and older | 26 (100.0%) | 0 (0.0%) |
| Total | 433 (91.9%) | 38 (8.1%) |
Health Insurance Coverage by Citizenship Status in Gauley Bridge
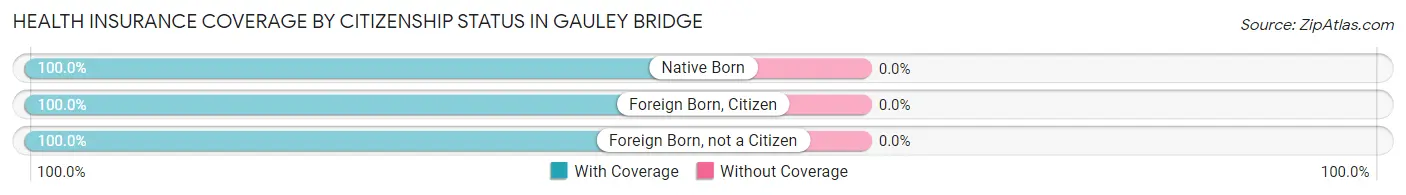
| Citizenship Status | With Coverage | Without Coverage |
| Native Born | 40 (100.0%) | 0 (0.0%) |
| Foreign Born, Citizen | 68 (100.0%) | 0 (0.0%) |
| Foreign Born, not a Citizen | 21 (100.0%) | 0 (0.0%) |
Health Insurance Coverage by Household Income in Gauley Bridge
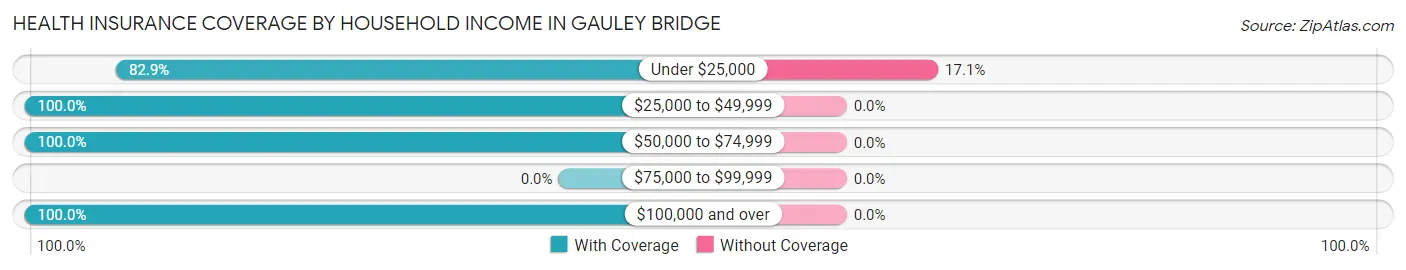
| Household Income | With Coverage | Without Coverage |
| Under $25,000 | 184 (82.9%) | 38 (17.1%) |
| $25,000 to $49,999 | 50 (100.0%) | 0 (0.0%) |
| $50,000 to $74,999 | 70 (100.0%) | 0 (0.0%) |
| $75,000 to $99,999 | 0 (0.0%) | 0 (0.0%) |
| $100,000 and over | 129 (100.0%) | 0 (0.0%) |
Public vs Private Health Insurance Coverage by Age in Gauley Bridge
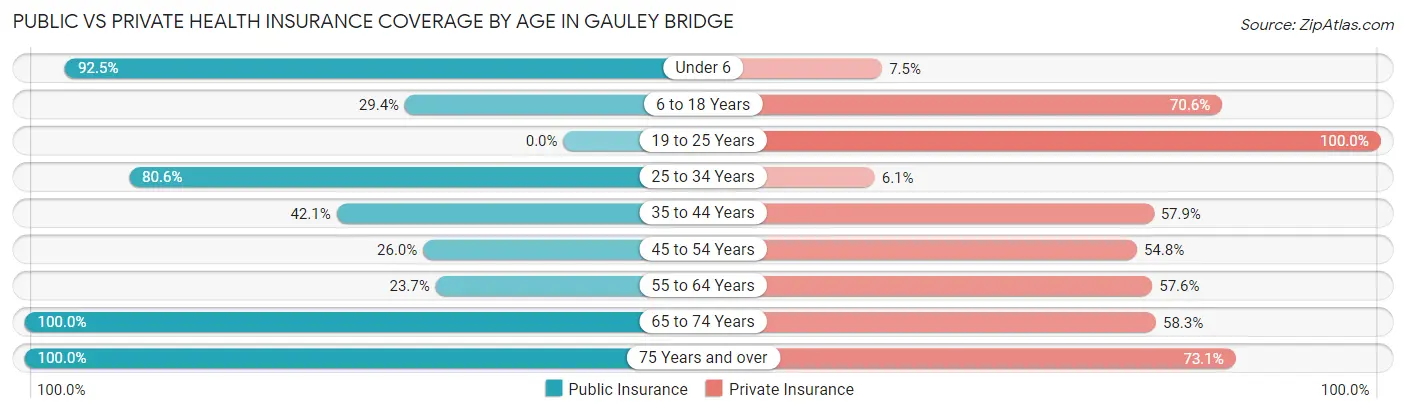
| Age Bracket | Public Insurance | Private Insurance |
| Under 6 | 37 (92.5%) | 3 (7.5%) |
| 6 to 18 Years | 20 (29.4%) | 48 (70.6%) |
| 19 to 25 Years | 0 (0.0%) | 21 (100.0%) |
| 25 to 34 Years | 79 (80.6%) | 6 (6.1%) |
| 35 to 44 Years | 16 (42.1%) | 22 (57.9%) |
| 45 to 54 Years | 19 (26.0%) | 40 (54.8%) |
| 55 to 64 Years | 14 (23.7%) | 34 (57.6%) |
| 65 to 74 Years | 48 (100.0%) | 28 (58.3%) |
| 75 Years and over | 26 (100.0%) | 19 (73.1%) |
| Total | 259 (55.0%) | 221 (46.9%) |
Disability Status by Sex by Age in Gauley Bridge
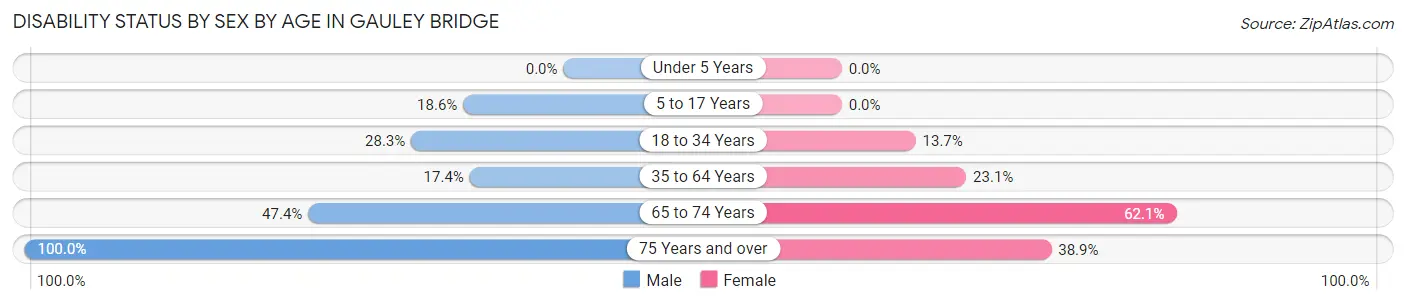
| Age Bracket | Male | Female |
| Under 5 Years | 0 (0.0%) | 0 (0.0%) |
| 5 to 17 Years | 8 (18.6%) | 0 (0.0%) |
| 18 to 34 Years | 13 (28.3%) | 10 (13.7%) |
| 35 to 64 Years | 16 (17.4%) | 18 (23.1%) |
| 65 to 74 Years | 9 (47.4%) | 18 (62.1%) |
| 75 Years and over | 8 (100.0%) | 7 (38.9%) |
Disability Class by Sex by Age in Gauley Bridge
Disability Class: Hearing Difficulty
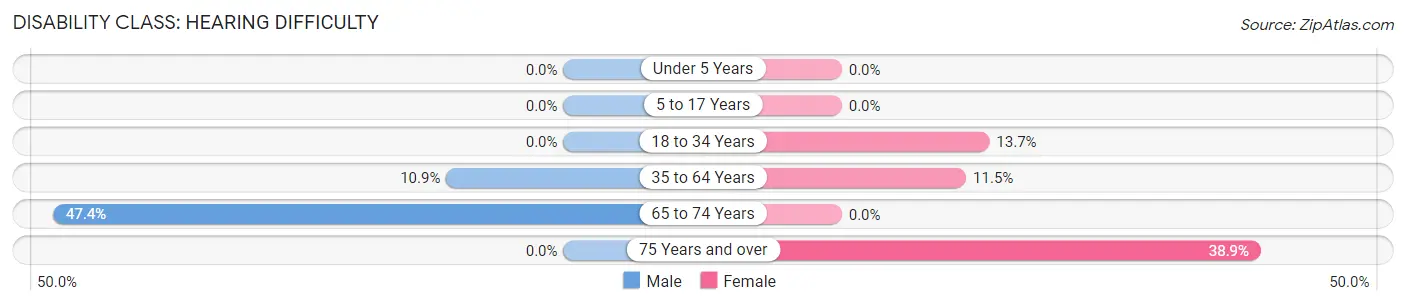
| Age Bracket | Male | Female |
| Under 5 Years | 0 (0.0%) | 0 (0.0%) |
| 5 to 17 Years | 0 (0.0%) | 0 (0.0%) |
| 18 to 34 Years | 0 (0.0%) | 10 (13.7%) |
| 35 to 64 Years | 10 (10.9%) | 9 (11.5%) |
| 65 to 74 Years | 9 (47.4%) | 0 (0.0%) |
| 75 Years and over | 0 (0.0%) | 7 (38.9%) |
Disability Class: Vision Difficulty
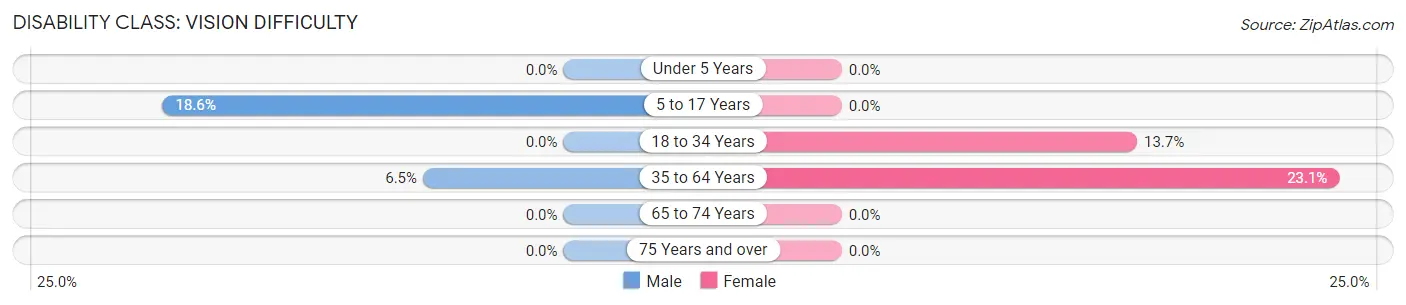
| Age Bracket | Male | Female |
| Under 5 Years | 0 (0.0%) | 0 (0.0%) |
| 5 to 17 Years | 8 (18.6%) | 0 (0.0%) |
| 18 to 34 Years | 0 (0.0%) | 10 (13.7%) |
| 35 to 64 Years | 6 (6.5%) | 18 (23.1%) |
| 65 to 74 Years | 0 (0.0%) | 0 (0.0%) |
| 75 Years and over | 0 (0.0%) | 0 (0.0%) |
Disability Class: Cognitive Difficulty
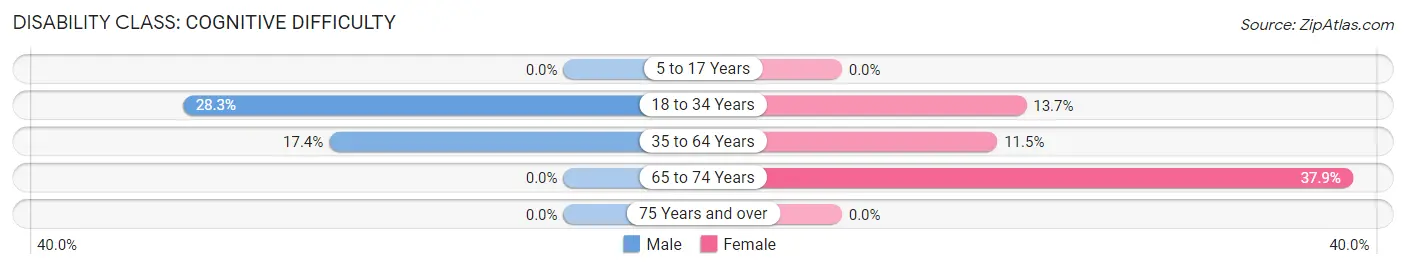
| Age Bracket | Male | Female |
| 5 to 17 Years | 0 (0.0%) | 0 (0.0%) |
| 18 to 34 Years | 13 (28.3%) | 10 (13.7%) |
| 35 to 64 Years | 16 (17.4%) | 9 (11.5%) |
| 65 to 74 Years | 0 (0.0%) | 11 (37.9%) |
| 75 Years and over | 0 (0.0%) | 0 (0.0%) |
Disability Class: Ambulatory Difficulty
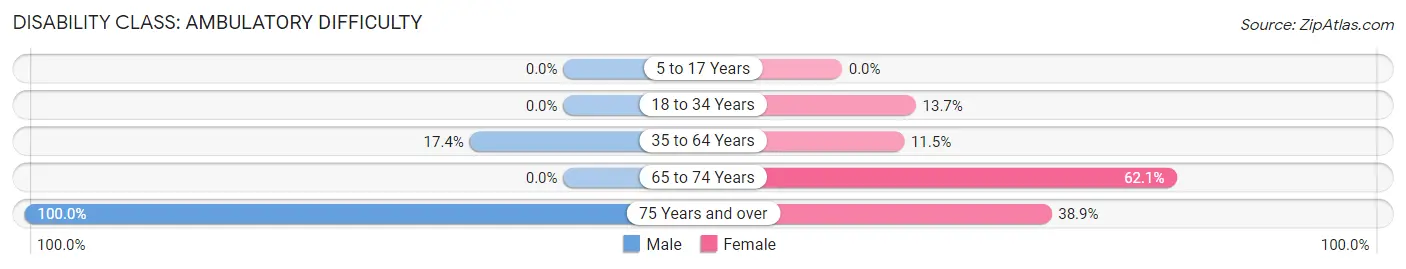
| Age Bracket | Male | Female |
| 5 to 17 Years | 0 (0.0%) | 0 (0.0%) |
| 18 to 34 Years | 0 (0.0%) | 10 (13.7%) |
| 35 to 64 Years | 16 (17.4%) | 9 (11.5%) |
| 65 to 74 Years | 0 (0.0%) | 18 (62.1%) |
| 75 Years and over | 8 (100.0%) | 7 (38.9%) |
Disability Class: Self-Care Difficulty
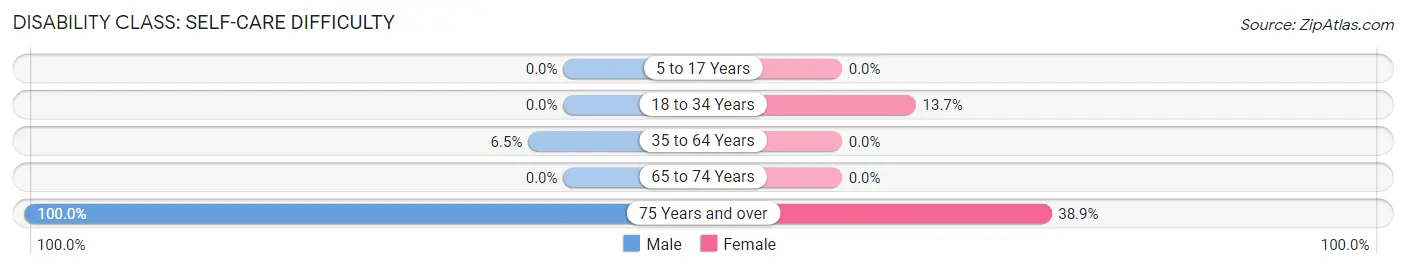
| Age Bracket | Male | Female |
| 5 to 17 Years | 0 (0.0%) | 0 (0.0%) |
| 18 to 34 Years | 0 (0.0%) | 10 (13.7%) |
| 35 to 64 Years | 6 (6.5%) | 0 (0.0%) |
| 65 to 74 Years | 0 (0.0%) | 0 (0.0%) |
| 75 Years and over | 8 (100.0%) | 7 (38.9%) |
Technology Access in Gauley Bridge
Computing Device Access in Gauley Bridge
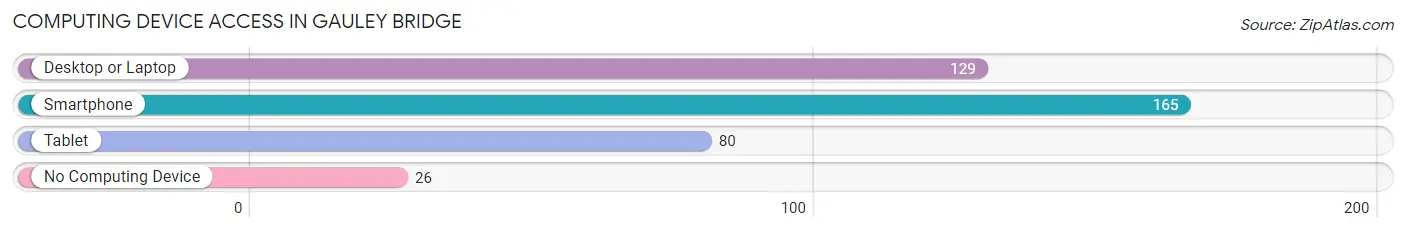
| Device Type | # Households | % Households |
| Desktop or Laptop | 129 | 60.9% |
| Smartphone | 165 | 77.8% |
| Tablet | 80 | 37.7% |
| No Computing Device | 26 | 12.3% |
| Total | 212 | 100.0% |
Internet Access in Gauley Bridge
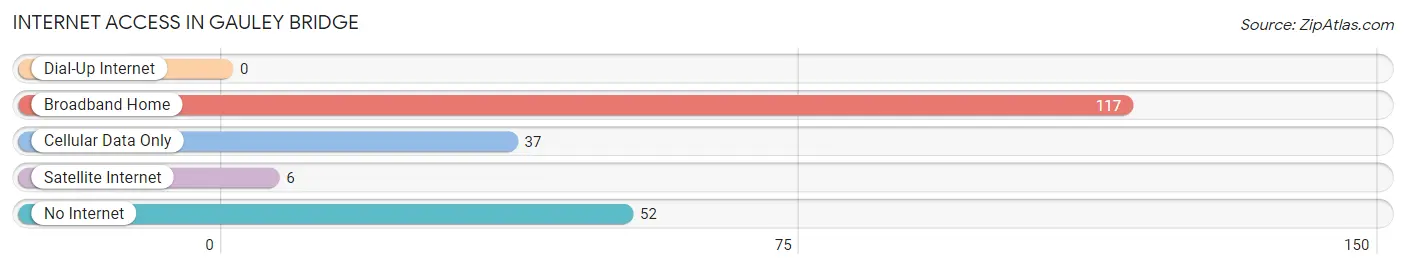
| Internet Type | # Households | % Households |
| Dial-Up Internet | 0 | 0.0% |
| Broadband Home | 117 | 55.2% |
| Cellular Data Only | 37 | 17.4% |
| Satellite Internet | 6 | 2.8% |
| No Internet | 52 | 24.5% |
| Total | 212 | 100.0% |
Gauley Bridge Summary
Gauley Bridge is a small town located in Fayette County, West Virginia. It is situated on the banks of the Gauley River, and is the county seat of Fayette County. The town was founded in 1817 and is named after the bridge that crosses the Gauley River. The population of Gauley Bridge was 1,611 as of the 2010 census.
Geography
Gauley Bridge is located at 38°14'17"N 81°2'17"W (38.238, -81.038). According to the United States Census Bureau, the town has a total area of 0.7 square miles (1.8 km2), all of it land.
Gauley Bridge is located in the Appalachian Mountains, and is surrounded by the Gauley River and the New River. The town is situated at the confluence of the two rivers, and is the only town in the United States located at the confluence of two rivers.
Economy
Gauley Bridge is a small town with a limited economy. The town is home to several small businesses, including a grocery store, a hardware store, a gas station, and a few restaurants. The town also has a few small manufacturing companies, including a furniture factory and a paper mill.
The town is also home to a few tourist attractions, including the Gauley River National Recreation Area, which offers whitewater rafting, fishing, and camping. The town also has a few historic sites, including the Gauley Bridge Covered Bridge, which was built in 1837 and is the oldest covered bridge in West Virginia.
Demographics
As of the 2010 census, the population of Gauley Bridge was 1,611. The racial makeup of the town was 97.2% White, 0.9% African American, 0.2% Native American, 0.2% Asian, 0.2% from other races, and 1.3% from two or more races. Hispanic or Latino of any race were 0.7% of the population.
The median income for a household in Gauley Bridge was $30,938, and the median income for a family was $37,500. The per capita income for the town was $15,945. About 16.2% of families and 19.2% of the population were below the poverty line, including 25.2% of those under age 18 and 11.2% of those age 65 or over.
Conclusion
Gauley Bridge is a small town located in Fayette County, West Virginia. It is situated on the banks of the Gauley River, and is the county seat of Fayette County. The town was founded in 1817 and is named after the bridge that crosses the Gauley River. The population of Gauley Bridge was 1,611 as of the 2010 census. The town is home to several small businesses, including a grocery store, a hardware store, a gas station, and a few restaurants. The town also has a few tourist attractions, including the Gauley River National Recreation Area, which offers whitewater rafting, fishing, and camping. The median income for a household in Gauley Bridge was $30,938, and the median income for a family was $37,500. The per capita income for the town was $15,945. About 16.2% of families and 19.2% of the population were below the poverty line, including 25.2% of those under age 18 and 11.2% of those age 65 or over.
Common Questions
What is Per Capita Income in Gauley Bridge?
Per Capita income in Gauley Bridge is $16,034.
What is the Median Household income in Gauley Bridge?
Median Household Income in Gauley Bridge is $16,786.
What is Inequality or Gini Index in Gauley Bridge?
Inequality or Gini Index in Gauley Bridge is 0.61.
What is the Total Population of Gauley Bridge?
Total Population of Gauley Bridge is 471.
What is the Total Male Population of Gauley Bridge?
Total Male Population of Gauley Bridge is 228.
What is the Total Female Population of Gauley Bridge?
Total Female Population of Gauley Bridge is 243.
What is the Ratio of Males per 100 Females in Gauley Bridge?
There are 93.83 Males per 100 Females in Gauley Bridge.
What is the Ratio of Females per 100 Males in Gauley Bridge?
There are 106.58 Females per 100 Males in Gauley Bridge.
What is the Median Population Age in Gauley Bridge?
Median Population Age in Gauley Bridge is 43.4 Years.
What is the Average Family Size in Gauley Bridge
Average Family Size in Gauley Bridge is 3.2 People.
What is the Average Household Size in Gauley Bridge
Average Household Size in Gauley Bridge is 2.2 People.
How Large is the Labor Force in Gauley Bridge?
There are 168 People in the Labor Forcein in Gauley Bridge.
What is the Percentage of People in the Labor Force in Gauley Bridge?
42.2% of People are in the Labor Force in Gauley Bridge.
What is the Unemployment Rate in Gauley Bridge?
Unemployment Rate in Gauley Bridge is 8.3%.