Wardensville, WV Map & Demographics
Wardensville Map
Wardensville Overview
$22,361
PER CAPITA INCOME
$45,357
AVG FAMILY INCOME
$39,688
AVG HOUSEHOLD INCOME
46.0%
WAGE / INCOME GAP [ % ]
54.0¢/ $1
WAGE / INCOME GAP [ $ ]
0.41
INEQUALITY / GINI INDEX
379
TOTAL POPULATION
172
MALE POPULATION
207
FEMALE POPULATION
83.09
MALES / 100 FEMALES
120.35
FEMALES / 100 MALES
41.6
MEDIAN AGE
2.9
AVG FAMILY SIZE
2.1
AVG HOUSEHOLD SIZE
162
LABOR FORCE [ PEOPLE ]
49.4%
PERCENT IN LABOR FORCE
9.3%
UNEMPLOYMENT RATE
Wardensville Zip Codes
Income in Wardensville
Income Overview in Wardensville
Per Capita Income in Wardensville is $22,361, while median incomes of families and households are $45,357 and $39,688 respectively.
| Characteristic | Number | Measure |
| Per Capita Income | 379 | $22,361 |
| Median Family Income | 88 | $45,357 |
| Mean Family Income | 88 | $62,755 |
| Median Household Income | 164 | $39,688 |
| Mean Household Income | 164 | $48,555 |
| Income Deficit | 88 | $0 |
| Wage / Income Gap (%) | 379 | 46.01% |
| Wage / Income Gap ($) | 379 | 53.99¢ per $1 |
| Gini / Inequality Index | 379 | 0.41 |
Earnings by Sex in Wardensville
Average Earnings in Wardensville are $30,000, $40,625 for men and $21,932 for women, a difference of 46.0%.
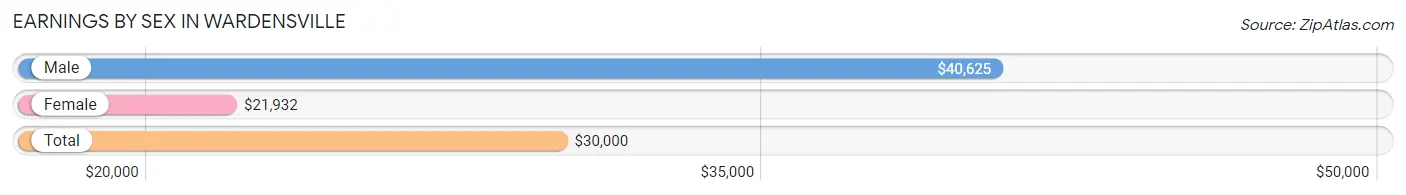
| Sex | Number | Average Earnings |
| Male | 51 (33.1%) | $40,625 |
| Female | 103 (66.9%) | $21,932 |
| Total | 154 (100.0%) | $30,000 |
Earnings by Sex by Income Bracket in Wardensville
The most common earnings brackets in Wardensville are $65,000 to $74,999 for men (9 | 17.6%) and $10,000 to $12,499 for women (13 | 12.6%).
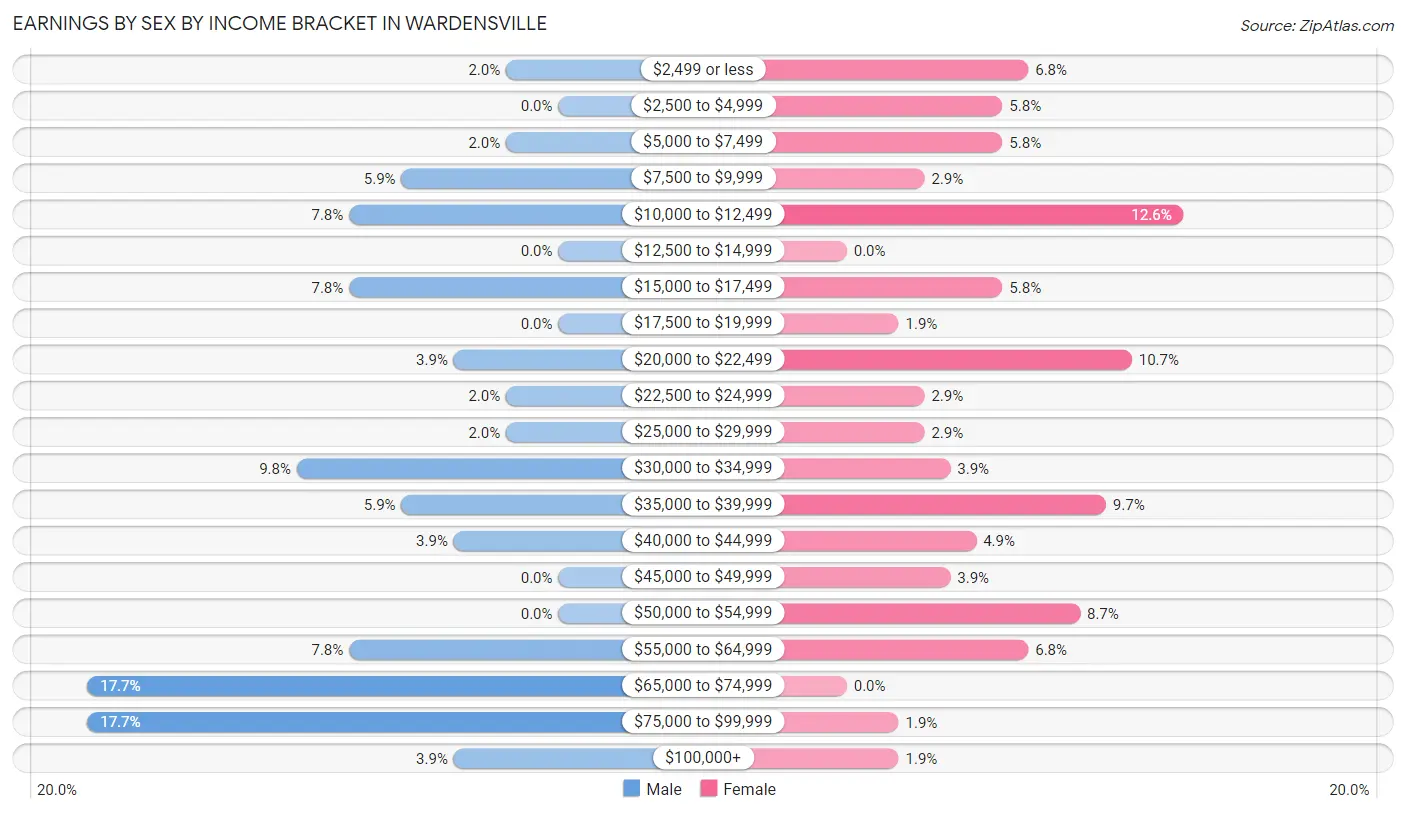
| Income | Male | Female |
| $2,499 or less | 1 (2.0%) | 7 (6.8%) |
| $2,500 to $4,999 | 0 (0.0%) | 6 (5.8%) |
| $5,000 to $7,499 | 1 (2.0%) | 6 (5.8%) |
| $7,500 to $9,999 | 3 (5.9%) | 3 (2.9%) |
| $10,000 to $12,499 | 4 (7.8%) | 13 (12.6%) |
| $12,500 to $14,999 | 0 (0.0%) | 0 (0.0%) |
| $15,000 to $17,499 | 4 (7.8%) | 6 (5.8%) |
| $17,500 to $19,999 | 0 (0.0%) | 2 (1.9%) |
| $20,000 to $22,499 | 2 (3.9%) | 11 (10.7%) |
| $22,500 to $24,999 | 1 (2.0%) | 3 (2.9%) |
| $25,000 to $29,999 | 1 (2.0%) | 3 (2.9%) |
| $30,000 to $34,999 | 5 (9.8%) | 4 (3.9%) |
| $35,000 to $39,999 | 3 (5.9%) | 10 (9.7%) |
| $40,000 to $44,999 | 2 (3.9%) | 5 (4.9%) |
| $45,000 to $49,999 | 0 (0.0%) | 4 (3.9%) |
| $50,000 to $54,999 | 0 (0.0%) | 9 (8.7%) |
| $55,000 to $64,999 | 4 (7.8%) | 7 (6.8%) |
| $65,000 to $74,999 | 9 (17.6%) | 0 (0.0%) |
| $75,000 to $99,999 | 9 (17.6%) | 2 (1.9%) |
| $100,000+ | 2 (3.9%) | 2 (1.9%) |
| Total | 51 (100.0%) | 103 (100.0%) |
Earnings by Sex by Educational Attainment in Wardensville
Average earnings in Wardensville are $63,750 for men and $32,500 for women, a difference of 49.0%. Men with an educational attainment of high school diploma enjoy the highest average annual earnings of $81,250, while those with bachelor's degree education earn the least with $53,750. Women with an educational attainment of high school diploma earn the most with the average annual earnings of $35,750, while those with high school diploma education have the smallest earnings of $35,750.
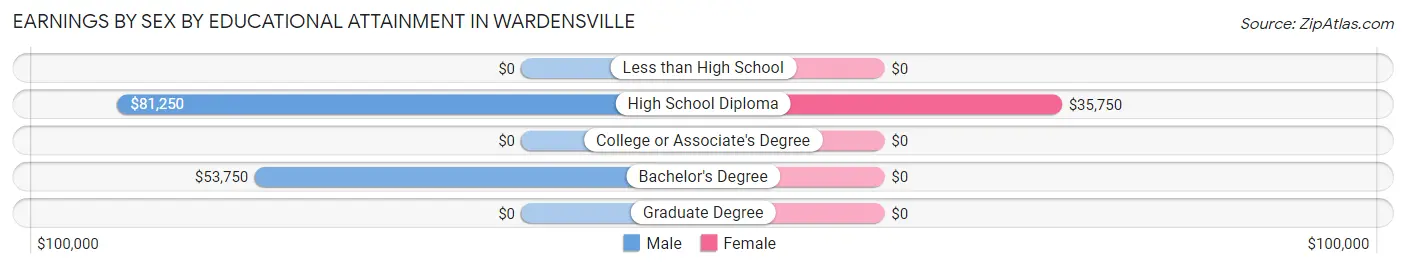
| Educational Attainment | Male Income | Female Income |
| Less than High School | - | - |
| High School Diploma | $81,250 | $35,750 |
| College or Associate's Degree | - | - |
| Bachelor's Degree | $53,750 | $0 |
| Graduate Degree | - | - |
| Total | $63,750 | $32,500 |
Family Income in Wardensville
Family Income Brackets in Wardensville
According to the Wardensville family income data, there are 41 families falling into the $35,000 to $49,999 income range, which is the most common income bracket and makes up 46.6% of all families.
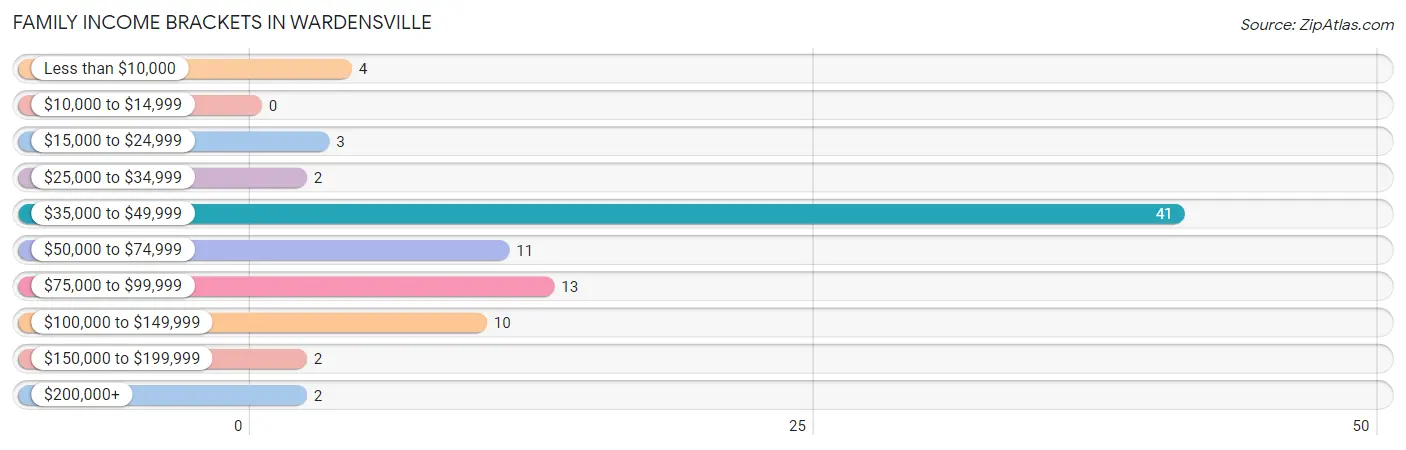
| Income Bracket | # Families | % Families |
| Less than $10,000 | 4 | 4.5% |
| $10,000 to $14,999 | 0 | 0.0% |
| $15,000 to $24,999 | 3 | 3.4% |
| $25,000 to $34,999 | 2 | 2.3% |
| $35,000 to $49,999 | 41 | 46.6% |
| $50,000 to $74,999 | 11 | 12.5% |
| $75,000 to $99,999 | 13 | 14.8% |
| $100,000 to $149,999 | 10 | 11.4% |
| $150,000 to $199,999 | 2 | 2.3% |
| $200,000+ | 2 | 2.3% |
Family Income by Famaliy Size in Wardensville
4-person families (20 | 22.7%) account for the highest median family income in Wardensville with $82,083 per family, while 2-person families (61 | 69.3%) have the highest median income of $22,074 per family member.
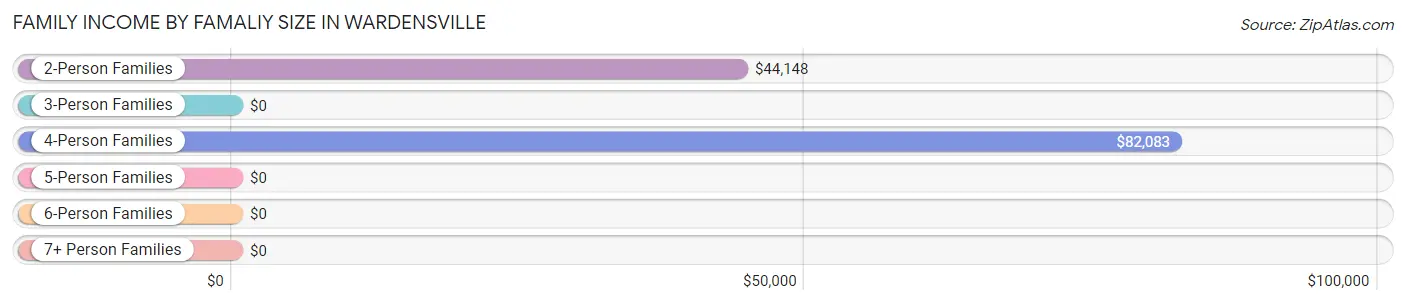
| Income Bracket | # Families | Median Income |
| 2-Person Families | 61 (69.3%) | $44,148 |
| 3-Person Families | 6 (6.8%) | $0 |
| 4-Person Families | 20 (22.7%) | $82,083 |
| 5-Person Families | 0 (0.0%) | $0 |
| 6-Person Families | 1 (1.1%) | $0 |
| 7+ Person Families | 0 (0.0%) | $0 |
| Total | 88 (100.0%) | $45,357 |
Family Income by Number of Earners in Wardensville
The median family income in Wardensville is $45,357, with families comprising 3+ earners (9) having the highest median family income of $127,188, while families with 1 earner (26) have the lowest median family income of $38,750, accounting for 10.2% and 29.5% of families, respectively.
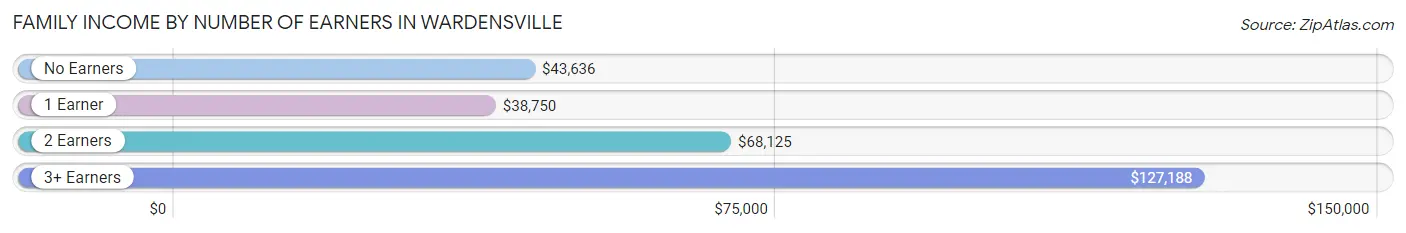
| Number of Earners | # Families | Median Income |
| No Earners | 28 (31.8%) | $43,636 |
| 1 Earner | 26 (29.5%) | $38,750 |
| 2 Earners | 25 (28.4%) | $68,125 |
| 3+ Earners | 9 (10.2%) | $127,188 |
| Total | 88 (100.0%) | $45,357 |
Household Income in Wardensville
Household Income Brackets in Wardensville
With 46 households falling in the category, the $35,000 to $49,999 income range is the most frequent in Wardensville, accounting for 28.1% of all households. In contrast, only 2 households (1.2%) fall into the $200,000+ income bracket, making it the least populous group.
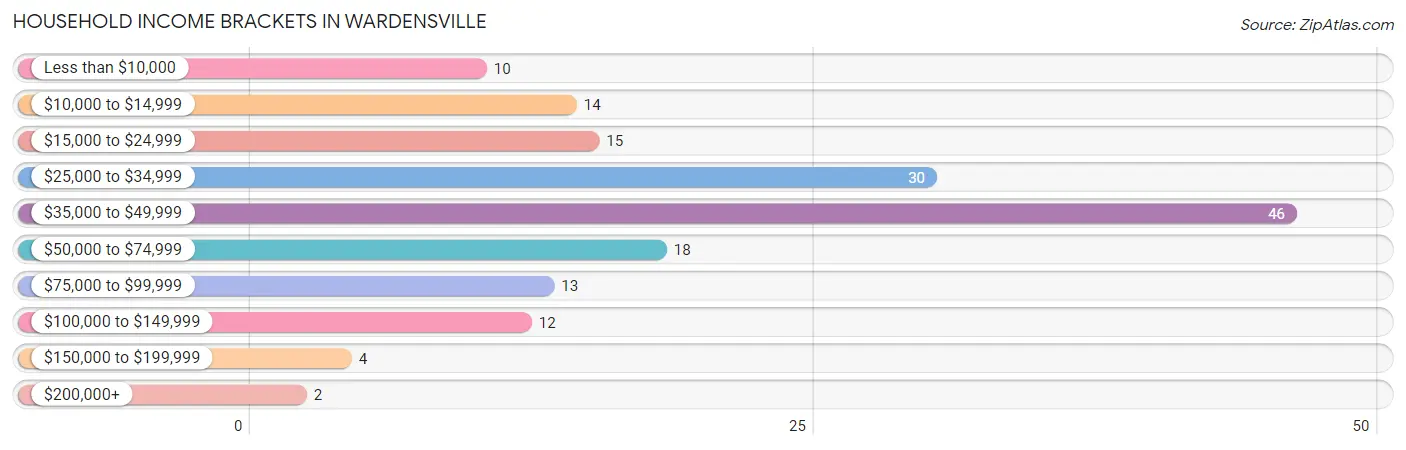
| Income Bracket | # Households | % Households |
| Less than $10,000 | 10 | 6.1% |
| $10,000 to $14,999 | 14 | 8.5% |
| $15,000 to $24,999 | 15 | 9.1% |
| $25,000 to $34,999 | 30 | 18.3% |
| $35,000 to $49,999 | 46 | 28.0% |
| $50,000 to $74,999 | 18 | 11.0% |
| $75,000 to $99,999 | 13 | 7.9% |
| $100,000 to $149,999 | 12 | 7.3% |
| $150,000 to $199,999 | 4 | 2.4% |
| $200,000+ | 2 | 1.2% |
Household Income by Householder Age in Wardensville
The median household income in Wardensville is $39,688, with the highest median household income of $47,500 found in the 25 to 44 years age bracket for the primary householder. A total of 44 households (26.8%) fall into this category. Meanwhile, the 15 to 24 years age bracket for the primary householder has the lowest median household income of $0, with 12 households (7.3%) in this group.
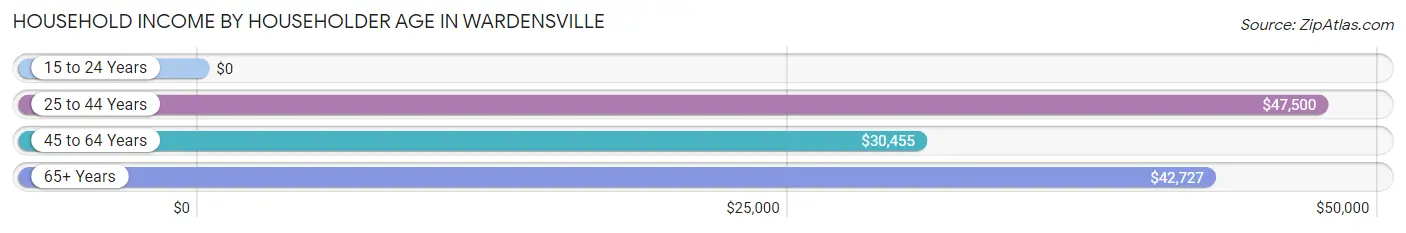
| Income Bracket | # Households | Median Income |
| 15 to 24 Years | 12 (7.3%) | $0 |
| 25 to 44 Years | 44 (26.8%) | $47,500 |
| 45 to 64 Years | 56 (34.2%) | $30,455 |
| 65+ Years | 52 (31.7%) | $42,727 |
| Total | 164 (100.0%) | $39,688 |
Poverty in Wardensville
Income Below Poverty by Sex and Age in Wardensville
With 26.0% poverty level for males and 21.3% for females among the residents of Wardensville, 5 year old males and 35 to 44 year old females are the most vulnerable to poverty, with 1 males (100.0%) and 20 females (47.6%) in their respective age groups living below the poverty level.
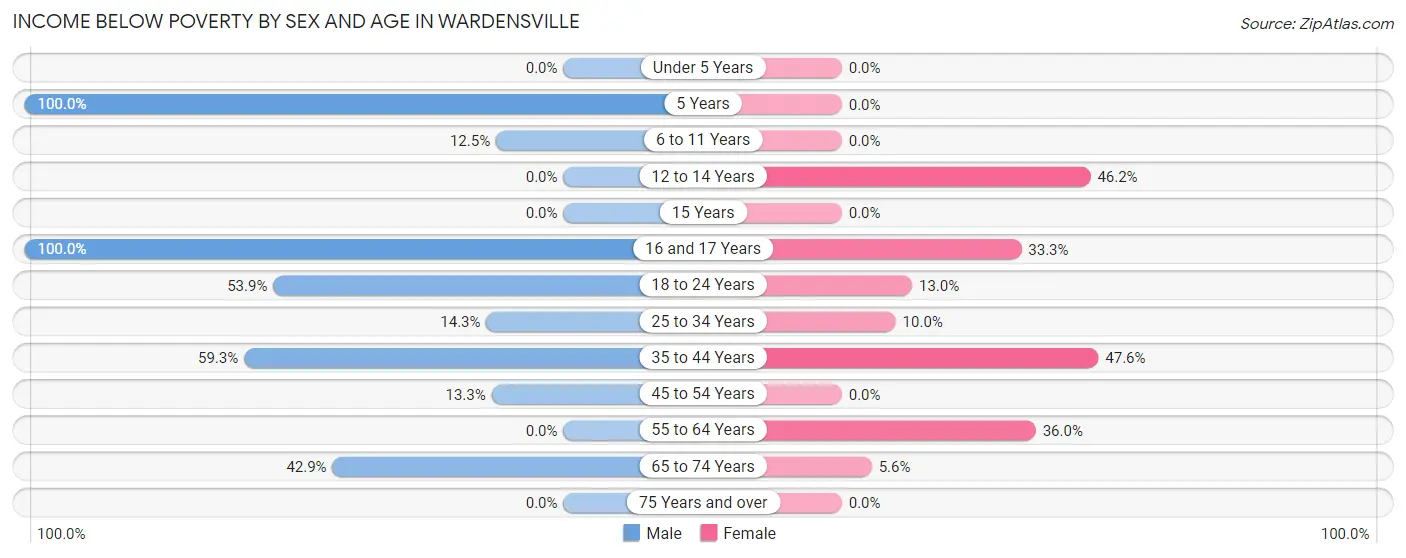
| Age Bracket | Male | Female |
| Under 5 Years | 0 (0.0%) | 0 (0.0%) |
| 5 Years | 1 (100.0%) | 0 (0.0%) |
| 6 to 11 Years | 1 (12.5%) | 0 (0.0%) |
| 12 to 14 Years | 0 (0.0%) | 6 (46.2%) |
| 15 Years | 0 (0.0%) | 0 (0.0%) |
| 16 and 17 Years | 12 (100.0%) | 4 (33.3%) |
| 18 to 24 Years | 7 (53.8%) | 3 (13.0%) |
| 25 to 34 Years | 2 (14.3%) | 1 (10.0%) |
| 35 to 44 Years | 16 (59.3%) | 20 (47.6%) |
| 45 to 54 Years | 2 (13.3%) | 0 (0.0%) |
| 55 to 64 Years | 0 (0.0%) | 9 (36.0%) |
| 65 to 74 Years | 3 (42.9%) | 1 (5.6%) |
| 75 Years and over | 0 (0.0%) | 0 (0.0%) |
| Total | 44 (26.0%) | 44 (21.3%) |
Income Above Poverty by Sex and Age in Wardensville
According to the poverty statistics in Wardensville, males aged under 5 years and females aged 6 to 11 years are the age groups that are most secure financially, with 100.0% of males and 100.0% of females in these age groups living above the poverty line.
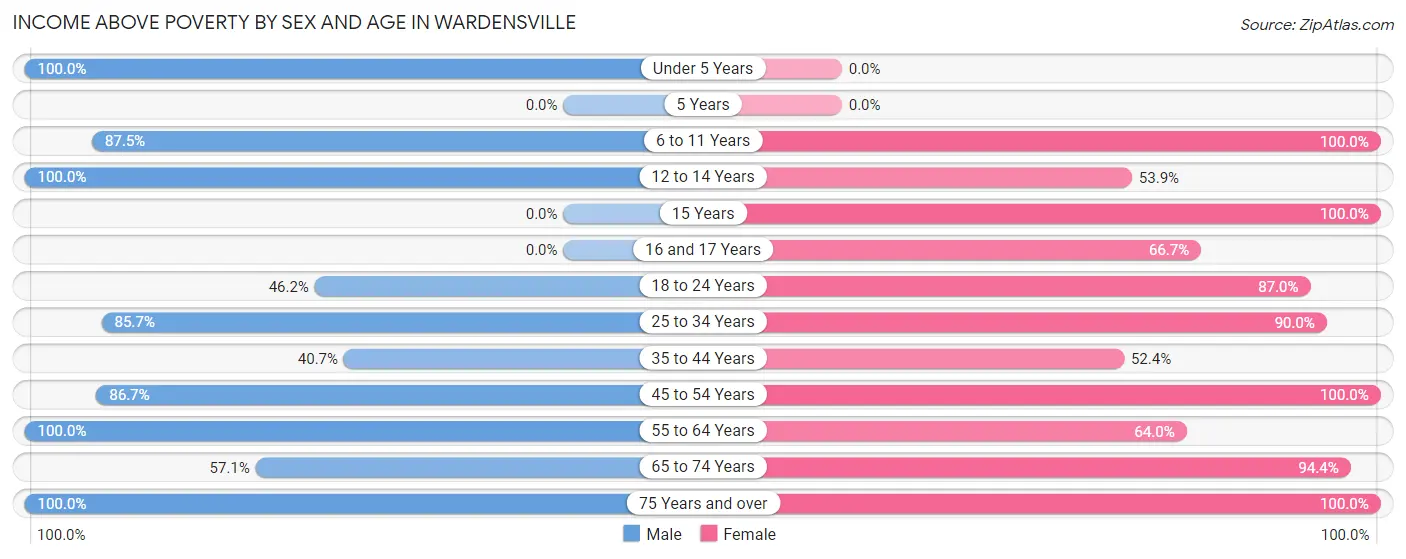
| Age Bracket | Male | Female |
| Under 5 Years | 14 (100.0%) | 0 (0.0%) |
| 5 Years | 0 (0.0%) | 0 (0.0%) |
| 6 to 11 Years | 7 (87.5%) | 10 (100.0%) |
| 12 to 14 Years | 1 (100.0%) | 7 (53.8%) |
| 15 Years | 0 (0.0%) | 1 (100.0%) |
| 16 and 17 Years | 0 (0.0%) | 8 (66.7%) |
| 18 to 24 Years | 6 (46.2%) | 20 (87.0%) |
| 25 to 34 Years | 12 (85.7%) | 9 (90.0%) |
| 35 to 44 Years | 11 (40.7%) | 22 (52.4%) |
| 45 to 54 Years | 13 (86.7%) | 20 (100.0%) |
| 55 to 64 Years | 25 (100.0%) | 16 (64.0%) |
| 65 to 74 Years | 4 (57.1%) | 17 (94.4%) |
| 75 Years and over | 32 (100.0%) | 33 (100.0%) |
| Total | 125 (74.0%) | 163 (78.7%) |
Income Below Poverty Among Married-Couple Families in Wardensville
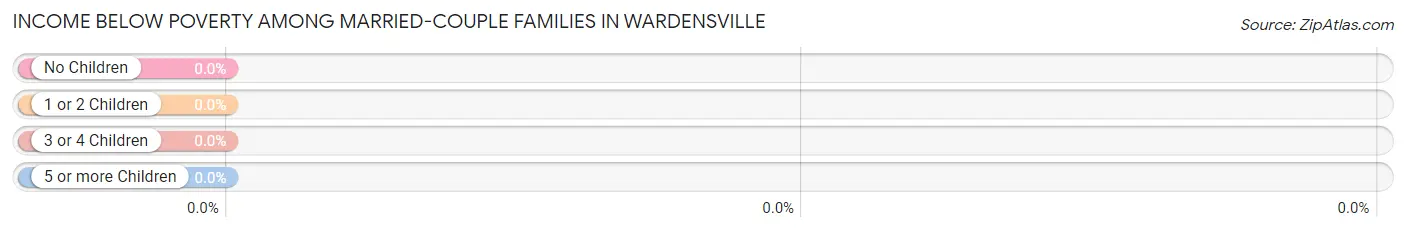
| Children | Above Poverty | Below Poverty |
| No Children | 40 (100.0%) | 0 (0.0%) |
| 1 or 2 Children | 13 (100.0%) | 0 (0.0%) |
| 3 or 4 Children | 0 (0.0%) | 0 (0.0%) |
| 5 or more Children | 0 (0.0%) | 0 (0.0%) |
| Total | 53 (100.0%) | 0 (0.0%) |
Income Below Poverty Among Single-Parent Households in Wardensville
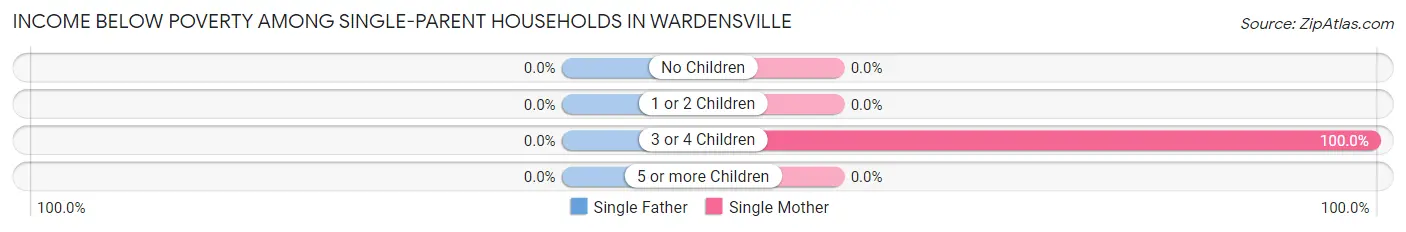
| Children | Single Father | Single Mother |
| No Children | 0 (0.0%) | 0 (0.0%) |
| 1 or 2 Children | 0 (0.0%) | 0 (0.0%) |
| 3 or 4 Children | 0 (0.0%) | 5 (100.0%) |
| 5 or more Children | 0 (0.0%) | 0 (0.0%) |
| Total | 0 (0.0%) | 5 (18.5%) |
Income Below Poverty Among Married-Couple vs Single-Parent Households in Wardensville
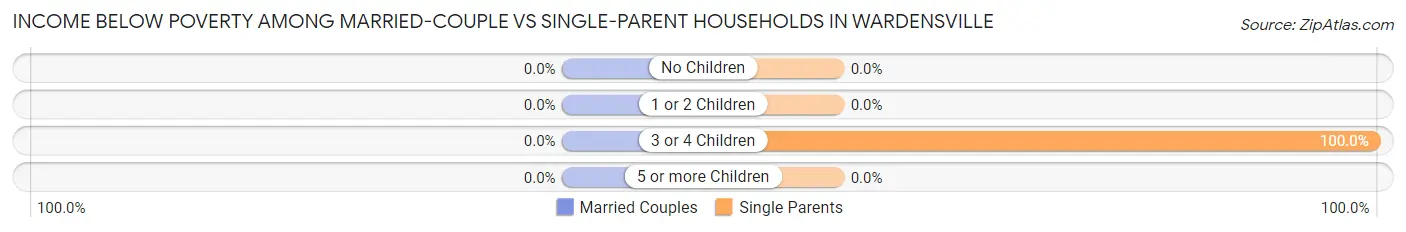
| Children | Married-Couple Families | Single-Parent Households |
| No Children | 0 (0.0%) | 0 (0.0%) |
| 1 or 2 Children | 0 (0.0%) | 0 (0.0%) |
| 3 or 4 Children | 0 (0.0%) | 5 (100.0%) |
| 5 or more Children | 0 (0.0%) | 0 (0.0%) |
| Total | 0 (0.0%) | 5 (14.3%) |
Race in Wardensville
The most populous races in Wardensville are White / Caucasian (368 | 97.1%), Hispanic or Latino (10 | 2.6%), and Two or more Races (5 | 1.3%).
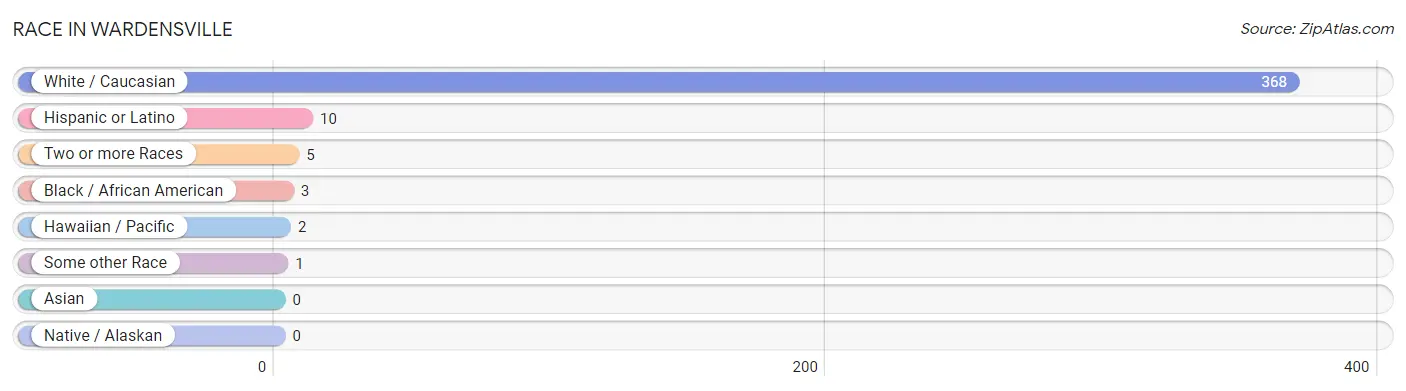
| Race | # Population | % Population |
| Asian | 0 | 0.0% |
| Black / African American | 3 | 0.8% |
| Hawaiian / Pacific | 2 | 0.5% |
| Hispanic or Latino | 10 | 2.6% |
| Native / Alaskan | 0 | 0.0% |
| White / Caucasian | 368 | 97.1% |
| Two or more Races | 5 | 1.3% |
| Some other Race | 1 | 0.3% |
| Total | 379 | 100.0% |
Ancestry in Wardensville
The most populous ancestries reported in Wardensville are German (102 | 26.9%), Irish (85 | 22.4%), English (28 | 7.4%), American (23 | 6.1%), and French (16 | 4.2%), together accounting for 67.0% of all Wardensville residents.
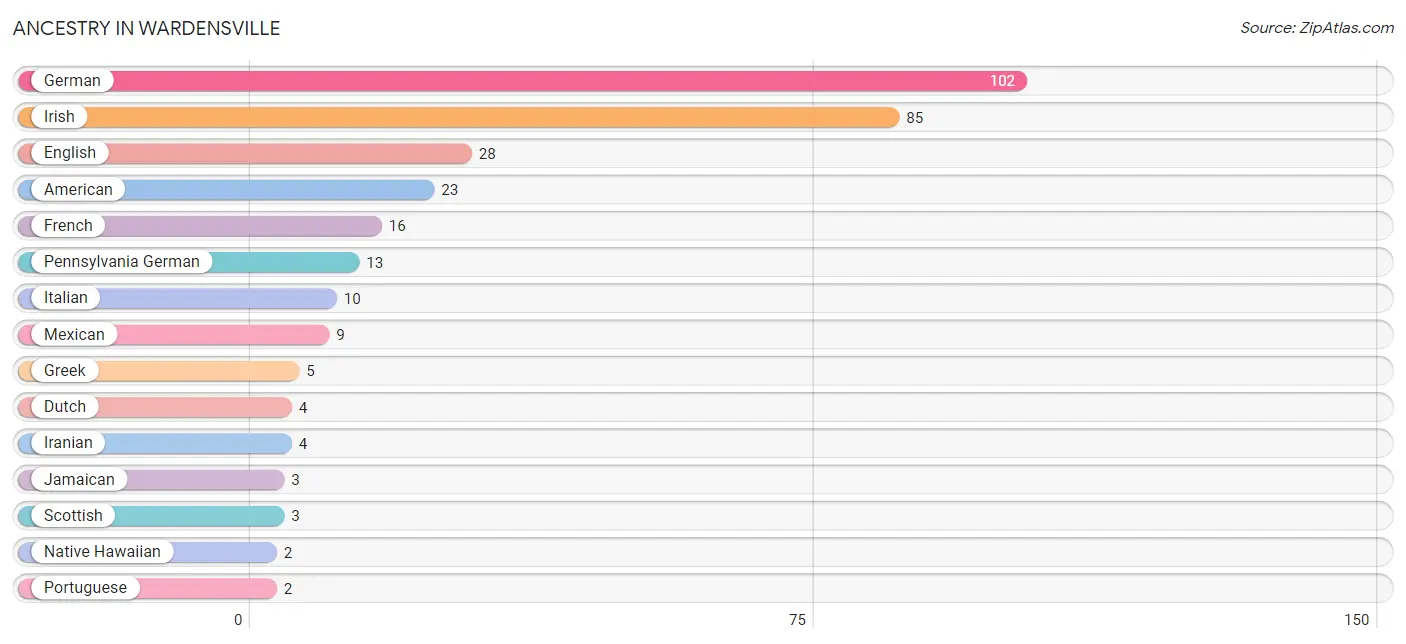
| Ancestry | # Population | % Population |
| American | 23 | 6.1% |
| Central American | 1 | 0.3% |
| Dutch | 4 | 1.1% |
| English | 28 | 7.4% |
| French | 16 | 4.2% |
| German | 102 | 26.9% |
| Greek | 5 | 1.3% |
| Iranian | 4 | 1.1% |
| Irish | 85 | 22.4% |
| Italian | 10 | 2.6% |
| Jamaican | 3 | 0.8% |
| Mexican | 9 | 2.4% |
| Native Hawaiian | 2 | 0.5% |
| Pennsylvania German | 13 | 3.4% |
| Portuguese | 2 | 0.5% |
| Salvadoran | 1 | 0.3% |
| Scotch-Irish | 1 | 0.3% |
| Scottish | 3 | 0.8% |
| Swiss | 2 | 0.5% | View All 19 Rows |
Immigrants in Wardensville
The most numerous immigrant groups reported in Wardensville came from Europe (1 | 0.3%), Netherlands (1 | 0.3%), and Western Europe (1 | 0.3%), together accounting for 0.8% of all Wardensville residents.
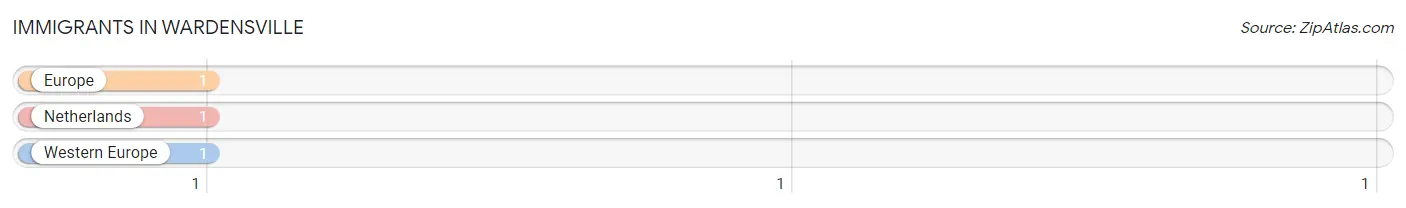
| Immigration Origin | # Population | % Population |
| Europe | 1 | 0.3% |
| Netherlands | 1 | 0.3% |
| Western Europe | 1 | 0.3% | View All 3 Rows |
Sex and Age in Wardensville
Sex and Age in Wardensville
The most populous age groups in Wardensville are 80 to 84 Years (22 | 12.8%) for men and 15 to 19 Years (25 | 12.1%) for women.
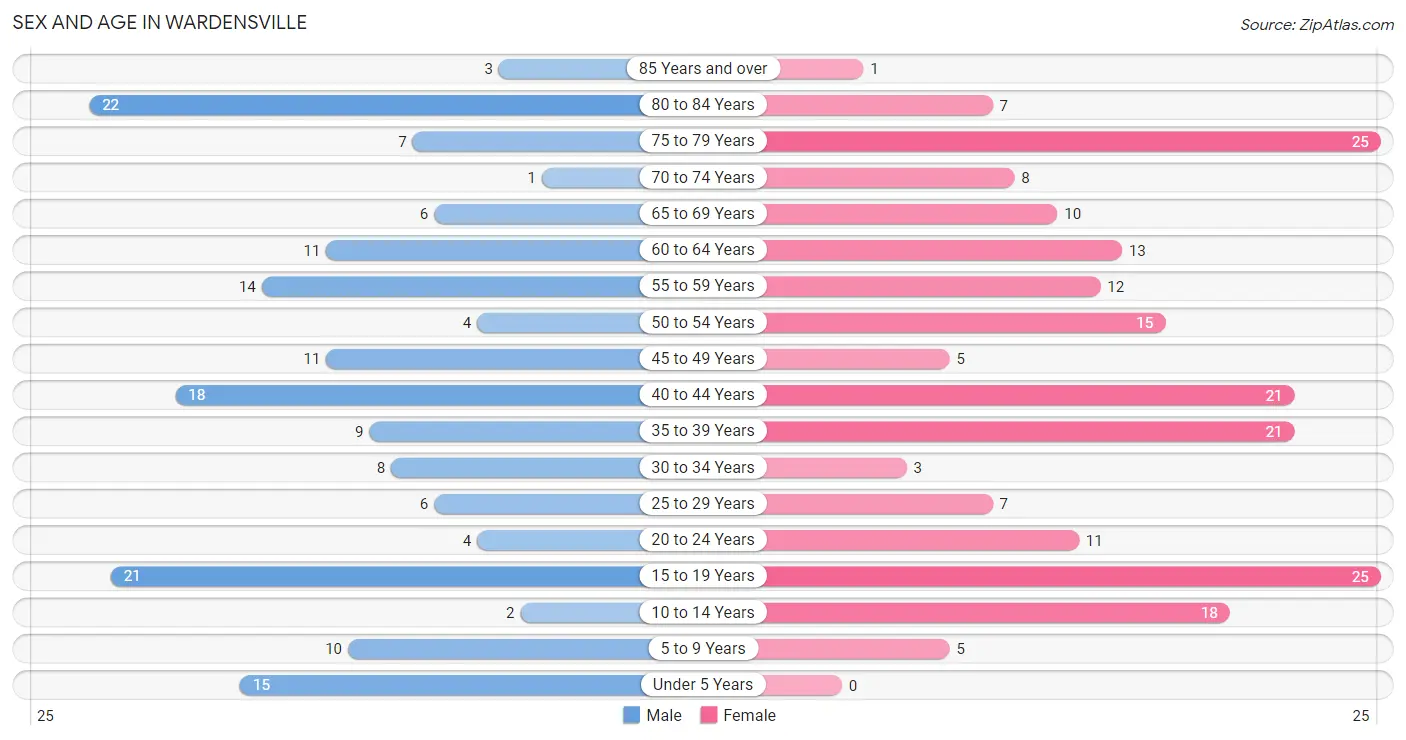
| Age Bracket | Male | Female |
| Under 5 Years | 15 (8.7%) | 0 (0.0%) |
| 5 to 9 Years | 10 (5.8%) | 5 (2.4%) |
| 10 to 14 Years | 2 (1.2%) | 18 (8.7%) |
| 15 to 19 Years | 21 (12.2%) | 25 (12.1%) |
| 20 to 24 Years | 4 (2.3%) | 11 (5.3%) |
| 25 to 29 Years | 6 (3.5%) | 7 (3.4%) |
| 30 to 34 Years | 8 (4.6%) | 3 (1.5%) |
| 35 to 39 Years | 9 (5.2%) | 21 (10.1%) |
| 40 to 44 Years | 18 (10.5%) | 21 (10.1%) |
| 45 to 49 Years | 11 (6.4%) | 5 (2.4%) |
| 50 to 54 Years | 4 (2.3%) | 15 (7.2%) |
| 55 to 59 Years | 14 (8.1%) | 12 (5.8%) |
| 60 to 64 Years | 11 (6.4%) | 13 (6.3%) |
| 65 to 69 Years | 6 (3.5%) | 10 (4.8%) |
| 70 to 74 Years | 1 (0.6%) | 8 (3.9%) |
| 75 to 79 Years | 7 (4.1%) | 25 (12.1%) |
| 80 to 84 Years | 22 (12.8%) | 7 (3.4%) |
| 85 Years and over | 3 (1.7%) | 1 (0.5%) |
| Total | 172 (100.0%) | 207 (100.0%) |
Families and Households in Wardensville
Median Family Size in Wardensville
The median family size in Wardensville is 2.91 persons per family, with single female/mother families (27 | 30.7%) accounting for the largest median family size of 3.22 persons per family. On the other hand, single male/father families (8 | 9.1%) represent the smallest median family size with 2.50 persons per family.
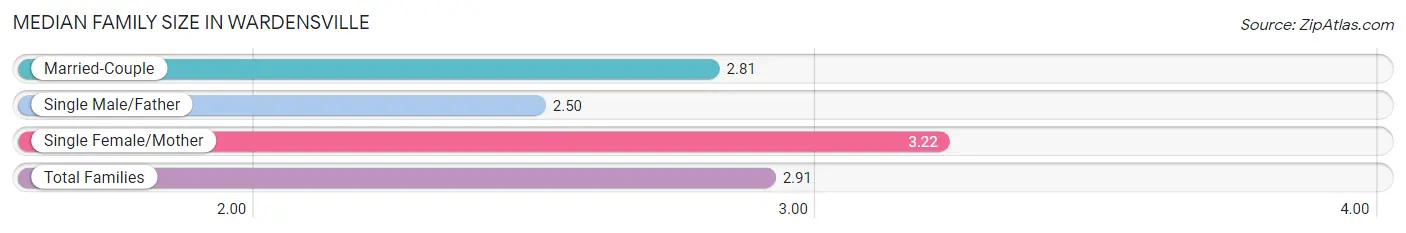
| Family Type | # Families | Family Size |
| Married-Couple | 53 (60.2%) | 2.81 |
| Single Male/Father | 8 (9.1%) | 2.50 |
| Single Female/Mother | 27 (30.7%) | 3.22 |
| Total Families | 88 (100.0%) | 2.91 |
Median Household Size in Wardensville
The median household size in Wardensville is 2.14 persons per household, with single female/mother households (27 | 16.5%) accounting for the largest median household size of 3.37 persons per household. non-family households (76 | 46.3%) represent the smallest median household size with 1.07 persons per household.
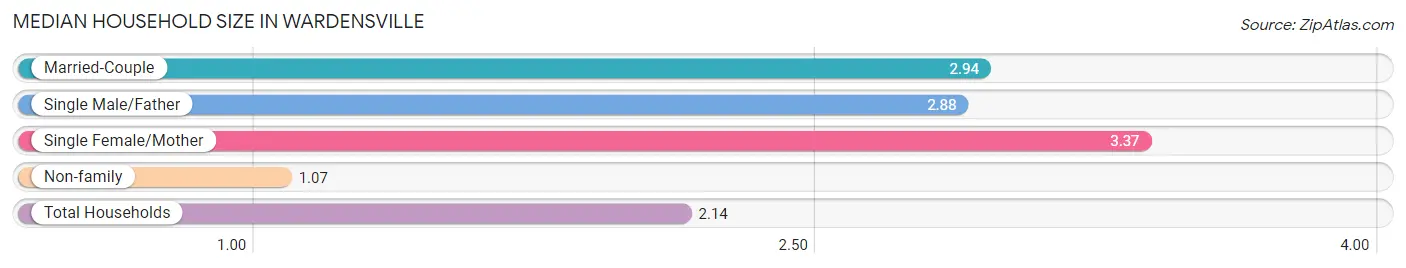
| Household Type | # Households | Household Size |
| Married-Couple | 53 (32.3%) | 2.94 |
| Single Male/Father | 8 (4.9%) | 2.88 |
| Single Female/Mother | 27 (16.5%) | 3.37 |
| Non-family | 76 (46.3%) | 1.07 |
| Total Households | 164 (100.0%) | 2.14 |
Household Size by Marriage Status in Wardensville
Out of a total of 164 households in Wardensville, 88 (53.7%) are family households, while 76 (46.3%) are nonfamily households. The most numerous type of family households are 2-person households, comprising 58, and the most common type of nonfamily households are 1-person households, comprising 73.
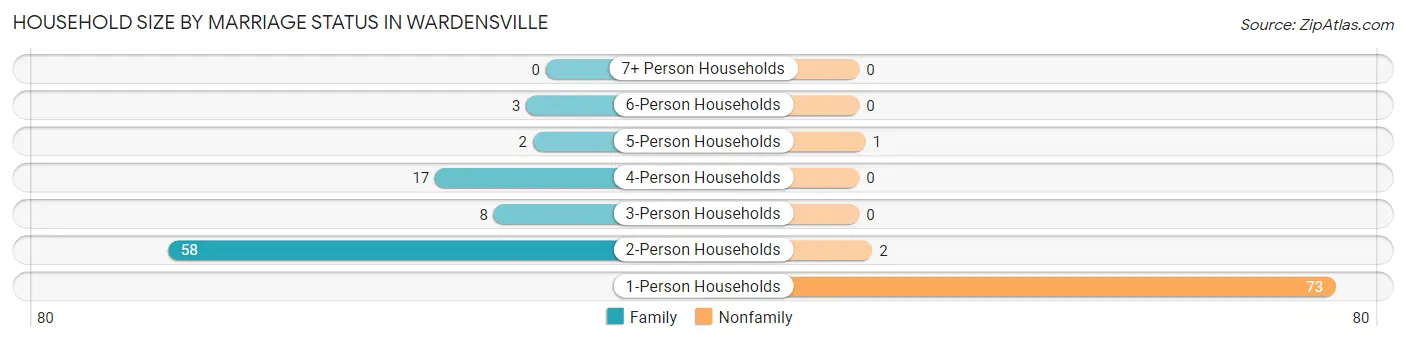
| Household Size | Family Households | Nonfamily Households |
| 1-Person Households | - | 73 (44.5%) |
| 2-Person Households | 58 (35.4%) | 2 (1.2%) |
| 3-Person Households | 8 (4.9%) | 0 (0.0%) |
| 4-Person Households | 17 (10.4%) | 0 (0.0%) |
| 5-Person Households | 2 (1.2%) | 1 (0.6%) |
| 6-Person Households | 3 (1.8%) | 0 (0.0%) |
| 7+ Person Households | 0 (0.0%) | 0 (0.0%) |
| Total | 88 (53.7%) | 76 (46.3%) |
Female Fertility in Wardensville
Fertility by Age in Wardensville
Average fertility rate in Wardensville is 11.0 births per 1,000 women. Women in the age bracket of 20 to 34 years have the highest fertility rate with 48.0 births per 1,000 women. Women in the age bracket of 20 to 34 years acount for 100.0% of all women with births.
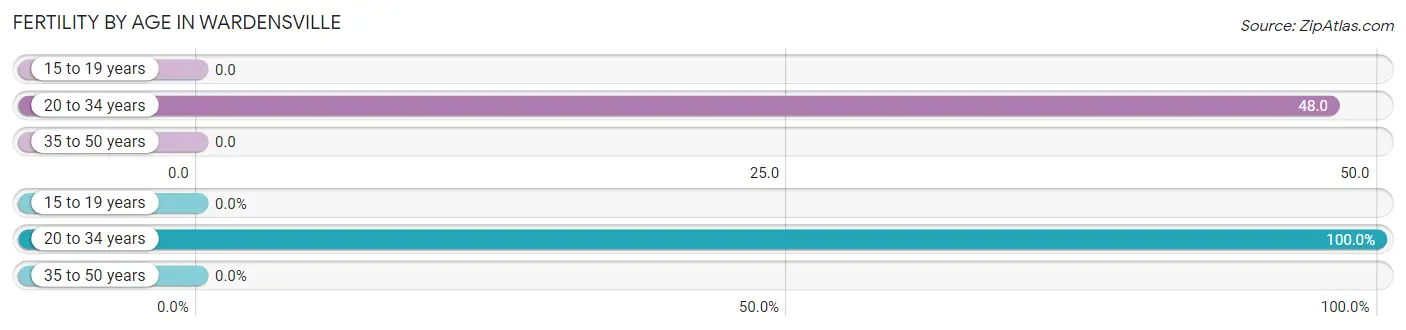
| Age Bracket | Women with Births | Births / 1,000 Women |
| 15 to 19 years | 0 (0.0%) | 0.0 |
| 20 to 34 years | 1 (100.0%) | 48.0 |
| 35 to 50 years | 0 (0.0%) | 0.0 |
| Total | 1 (100.0%) | 11.0 |
Fertility by Age by Marriage Status in Wardensville
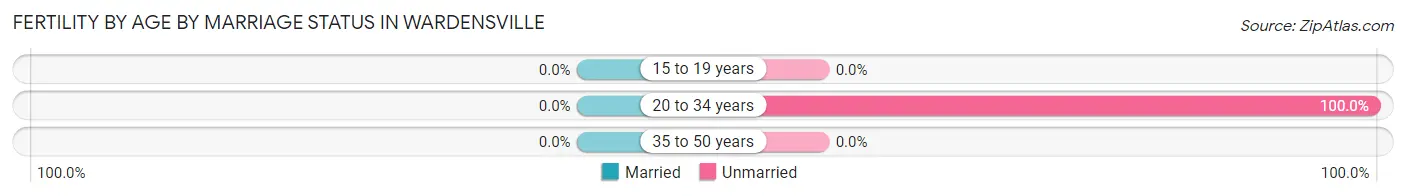
| Age Bracket | Married | Unmarried |
| 15 to 19 years | 0 (0.0%) | 0 (0.0%) |
| 20 to 34 years | 0 (0.0%) | 1 (100.0%) |
| 35 to 50 years | 0 (0.0%) | 0 (0.0%) |
| Total | 0 (0.0%) | 1 (100.0%) |
Fertility by Education in Wardensville
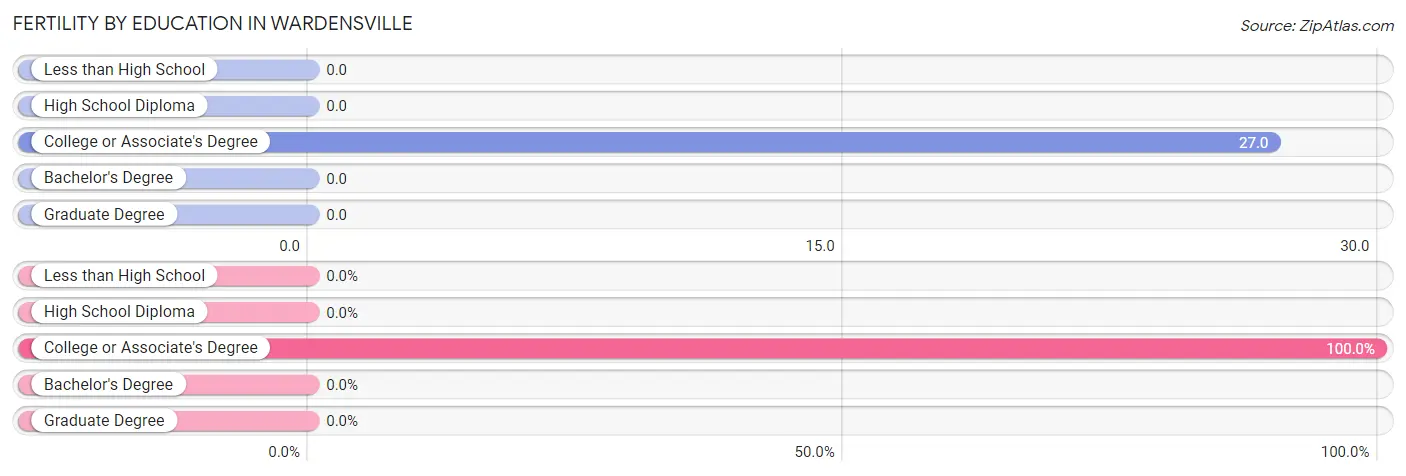
| Educational Attainment | Women with Births | Births / 1,000 Women |
| Less than High School | 0 (0.0%) | 0.0 |
| High School Diploma | 0 (0.0%) | 0.0 |
| College or Associate's Degree | 1 (100.0%) | 27.0 |
| Bachelor's Degree | 0 (0.0%) | 0.0 |
| Graduate Degree | 0 (0.0%) | 0.0 |
| Total | 1 (100.0%) | 11.0 |
Fertility by Education by Marriage Status in Wardensville
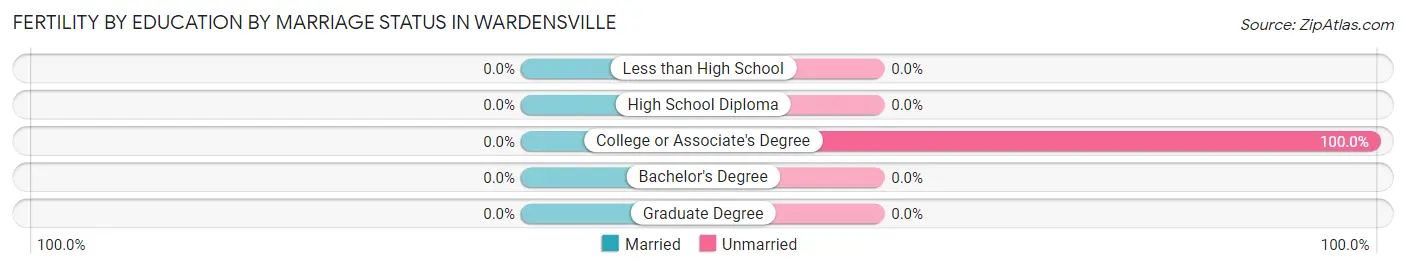
| Educational Attainment | Married | Unmarried |
| Less than High School | 0 (0.0%) | 0 (0.0%) |
| High School Diploma | 0 (0.0%) | 0 (0.0%) |
| College or Associate's Degree | 0 (0.0%) | 1 (100.0%) |
| Bachelor's Degree | 0 (0.0%) | 0 (0.0%) |
| Graduate Degree | 0 (0.0%) | 0 (0.0%) |
| Total | 0 (0.0%) | 1 (100.0%) |
Employment Characteristics in Wardensville
Employment by Class of Employer in Wardensville
Among the 140 employed individuals in Wardensville, private company employees (106 | 75.7%), local government employees (13 | 9.3%), and state government employees (11 | 7.9%) make up the most common classes of employment.
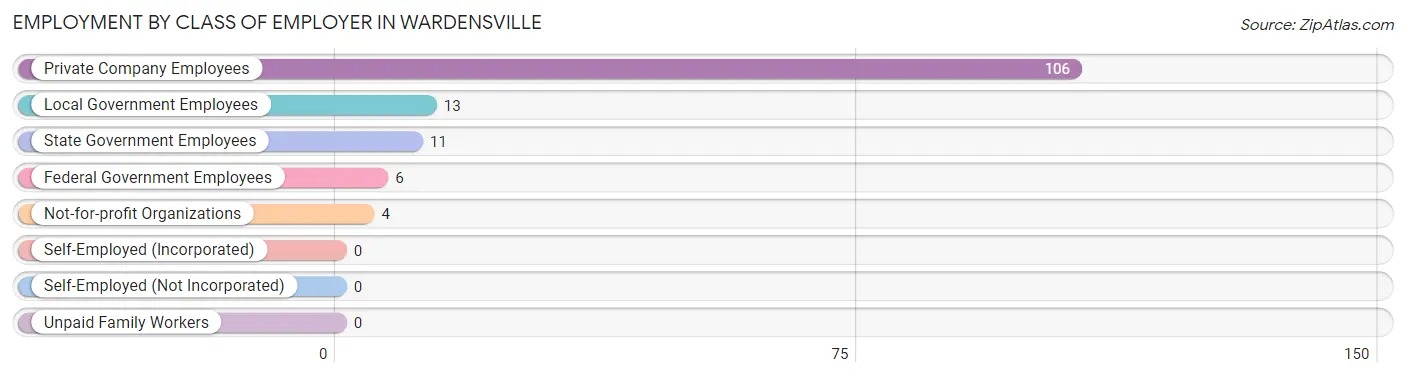
| Employer Class | # Employees | % Employees |
| Private Company Employees | 106 | 75.7% |
| Self-Employed (Incorporated) | 0 | 0.0% |
| Self-Employed (Not Incorporated) | 0 | 0.0% |
| Not-for-profit Organizations | 4 | 2.9% |
| Local Government Employees | 13 | 9.3% |
| State Government Employees | 11 | 7.9% |
| Federal Government Employees | 6 | 4.3% |
| Unpaid Family Workers | 0 | 0.0% |
| Total | 140 | 100.0% |
Employment Status by Age in Wardensville
According to the labor force statistics for Wardensville, out of the total population over 16 years of age (328), 49.4% or 162 individuals are in the labor force, with 9.3% or 15 of them unemployed. The age group with the highest labor force participation rate is 25 to 29 years, with 100.0% or 13 individuals in the labor force. Within the labor force, the 45 to 54 years age range has the highest percentage of unemployed individuals, with 24.2% or 8 of them being unemployed.
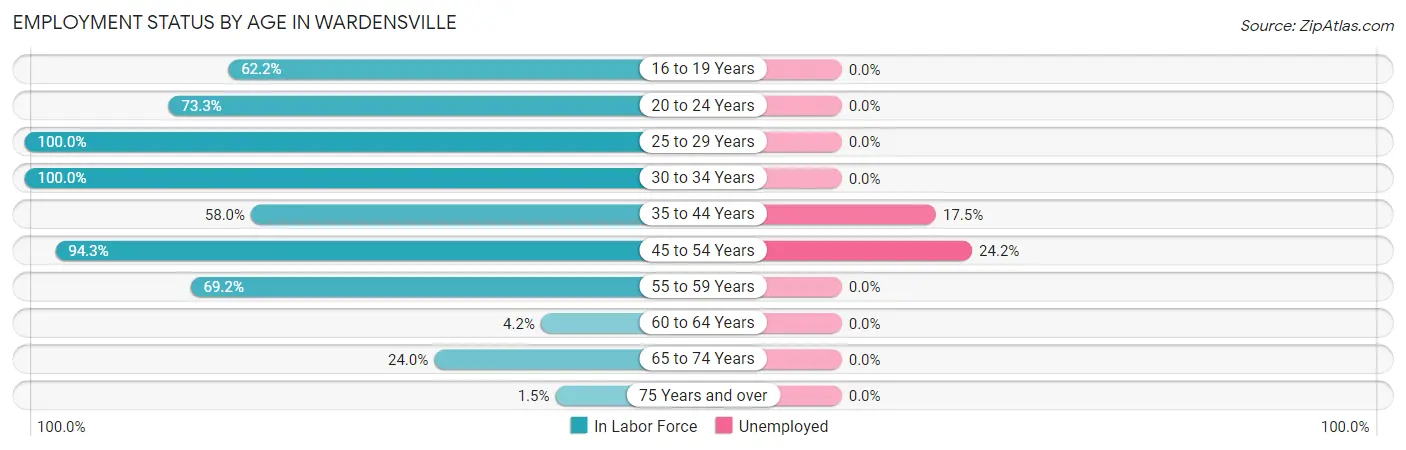
| Age Bracket | In Labor Force | Unemployed |
| 16 to 19 Years | 28 (62.2%) | 0 (0.0%) |
| 20 to 24 Years | 11 (73.3%) | 0 (0.0%) |
| 25 to 29 Years | 13 (100.0%) | 0 (0.0%) |
| 30 to 34 Years | 11 (100.0%) | 0 (0.0%) |
| 35 to 44 Years | 40 (58.0%) | 7 (17.5%) |
| 45 to 54 Years | 33 (94.3%) | 8 (24.2%) |
| 55 to 59 Years | 18 (69.2%) | 0 (0.0%) |
| 60 to 64 Years | 1 (4.2%) | 0 (0.0%) |
| 65 to 74 Years | 6 (24.0%) | 0 (0.0%) |
| 75 Years and over | 1 (1.5%) | 0 (0.0%) |
| Total | 162 (49.4%) | 15 (9.3%) |
Employment Status by Educational Attainment in Wardensville
According to labor force statistics for Wardensville, 65.2% of individuals (116) out of the total population between 25 and 64 years of age (178) are in the labor force, with 12.9% or 15 of them being unemployed. The group with the highest labor force participation rate are those with the educational attainment of bachelor's degree or higher, with 100.0% or 22 individuals in the labor force. Within the labor force, individuals with less than high school education have the highest percentage of unemployment, with 41.2% or 7 of them being unemployed.
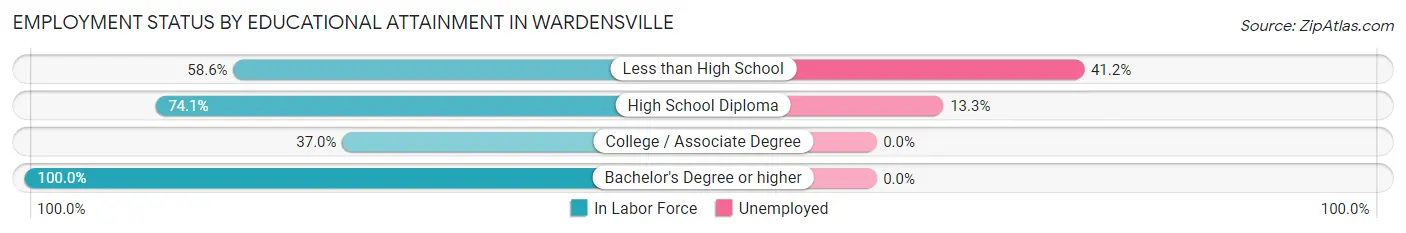
| Educational Attainment | In Labor Force | Unemployed |
| Less than High School | 17 (58.6%) | 12 (41.2%) |
| High School Diploma | 60 (74.1%) | 11 (13.3%) |
| College / Associate Degree | 17 (37.0%) | 0 (0.0%) |
| Bachelor's Degree or higher | 22 (100.0%) | 0 (0.0%) |
| Total | 116 (65.2%) | 23 (12.9%) |
Employment Occupations by Sex in Wardensville
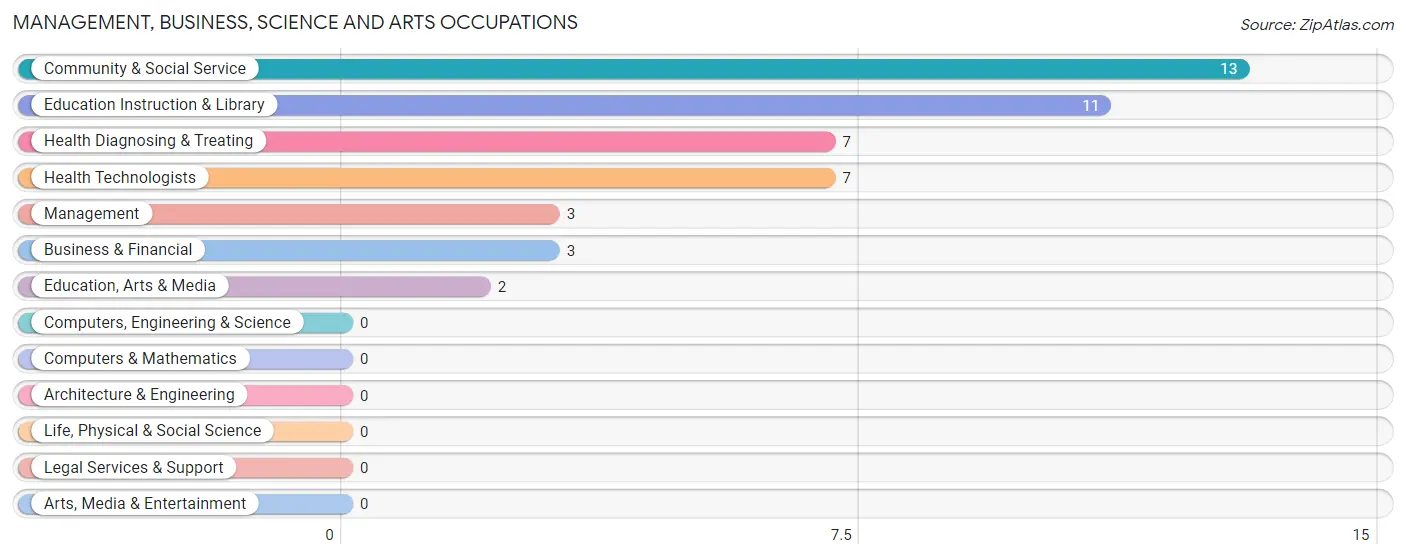
Management, Business, Science and Arts Occupations
The most common Management, Business, Science and Arts occupations in Wardensville are Community & Social Service (13 | 8.8%), Education Instruction & Library (11 | 7.5%), Health Diagnosing & Treating (7 | 4.8%), Health Technologists (7 | 4.8%), and Management (3 | 2.0%).
Management, Business, Science and Arts Occupations by Sex
Within the Management, Business, Science and Arts occupations in Wardensville, the most male-oriented occupations are Management (100.0%), Education, Arts & Media (100.0%), and Community & Social Service (30.8%), while the most female-oriented occupations are Business & Financial (100.0%), Health Diagnosing & Treating (100.0%), and Health Technologists (100.0%).
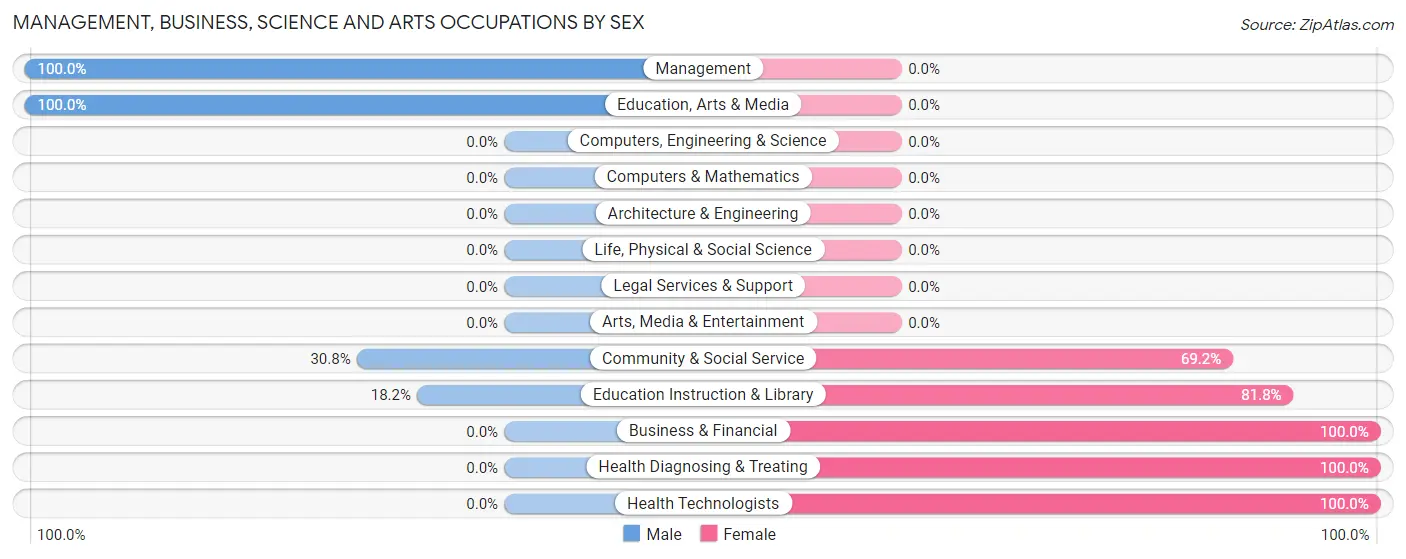
| Occupation | Male | Female |
| Management | 3 (100.0%) | 0 (0.0%) |
| Business & Financial | 0 (0.0%) | 3 (100.0%) |
| Computers, Engineering & Science | 0 (0.0%) | 0 (0.0%) |
| Computers & Mathematics | 0 (0.0%) | 0 (0.0%) |
| Architecture & Engineering | 0 (0.0%) | 0 (0.0%) |
| Life, Physical & Social Science | 0 (0.0%) | 0 (0.0%) |
| Community & Social Service | 4 (30.8%) | 9 (69.2%) |
| Education, Arts & Media | 2 (100.0%) | 0 (0.0%) |
| Legal Services & Support | 0 (0.0%) | 0 (0.0%) |
| Education Instruction & Library | 2 (18.2%) | 9 (81.8%) |
| Arts, Media & Entertainment | 0 (0.0%) | 0 (0.0%) |
| Health Diagnosing & Treating | 0 (0.0%) | 7 (100.0%) |
| Health Technologists | 0 (0.0%) | 7 (100.0%) |
| Total (Category) | 7 (26.9%) | 19 (73.1%) |
| Total (Overall) | 46 (31.3%) | 101 (68.7%) |
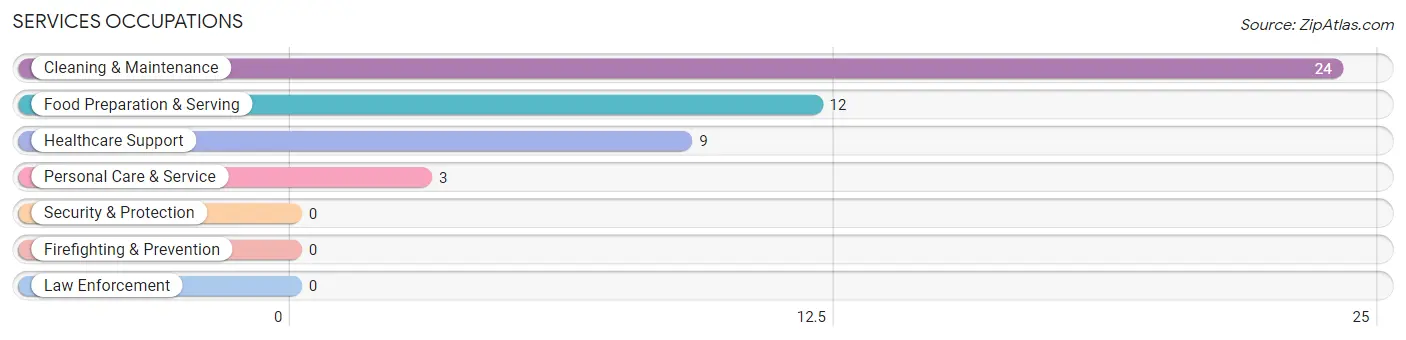
Services Occupations
The most common Services occupations in Wardensville are Cleaning & Maintenance (24 | 16.3%), Food Preparation & Serving (12 | 8.2%), Healthcare Support (9 | 6.1%), and Personal Care & Service (3 | 2.0%).
Services Occupations by Sex
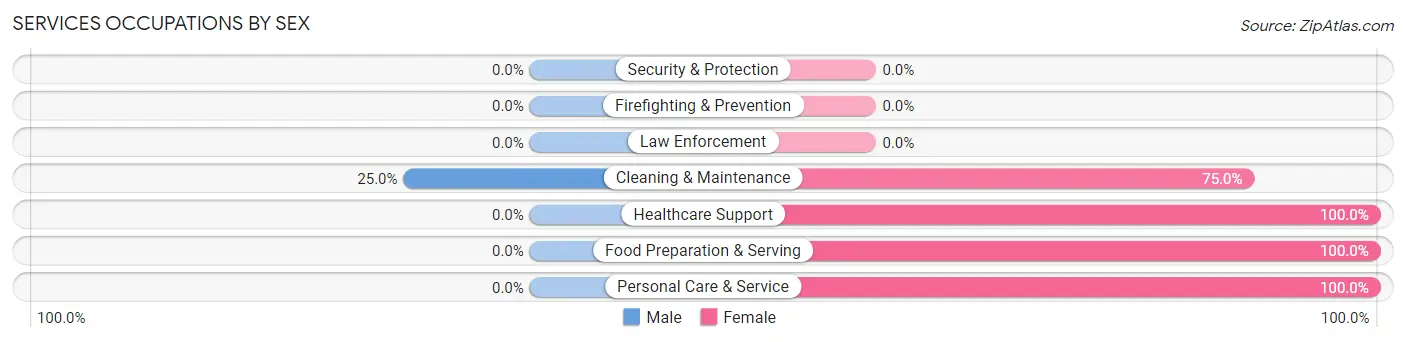
| Occupation | Male | Female |
| Healthcare Support | 0 (0.0%) | 9 (100.0%) |
| Security & Protection | 0 (0.0%) | 0 (0.0%) |
| Firefighting & Prevention | 0 (0.0%) | 0 (0.0%) |
| Law Enforcement | 0 (0.0%) | 0 (0.0%) |
| Food Preparation & Serving | 0 (0.0%) | 12 (100.0%) |
| Cleaning & Maintenance | 6 (25.0%) | 18 (75.0%) |
| Personal Care & Service | 0 (0.0%) | 3 (100.0%) |
| Total (Category) | 6 (12.5%) | 42 (87.5%) |
| Total (Overall) | 46 (31.3%) | 101 (68.7%) |
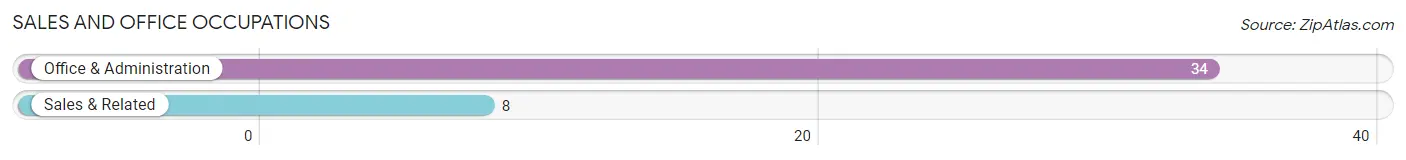
Sales and Office Occupations
The most common Sales and Office occupations in Wardensville are Office & Administration (34 | 23.1%), and Sales & Related (8 | 5.4%).
Sales and Office Occupations by Sex
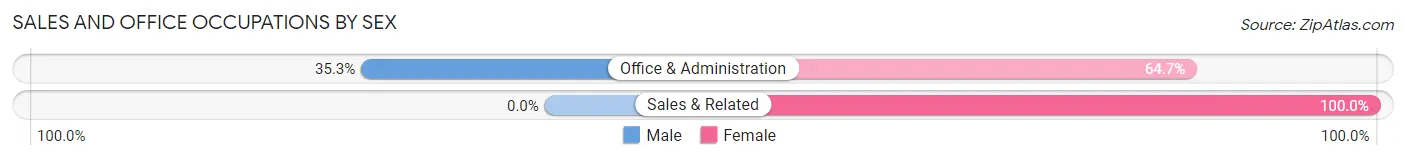
| Occupation | Male | Female |
| Sales & Related | 0 (0.0%) | 8 (100.0%) |
| Office & Administration | 12 (35.3%) | 22 (64.7%) |
| Total (Category) | 12 (28.6%) | 30 (71.4%) |
| Total (Overall) | 46 (31.3%) | 101 (68.7%) |
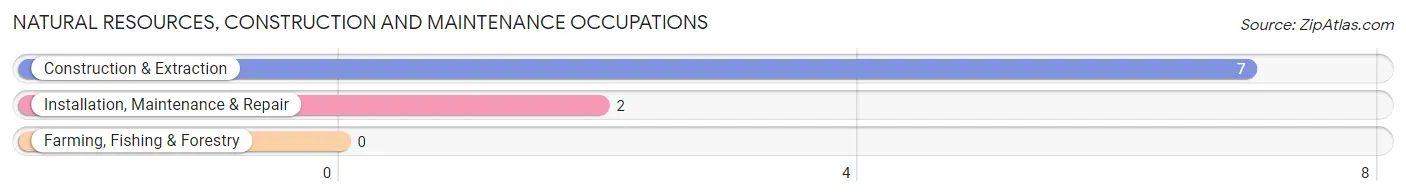
Natural Resources, Construction and Maintenance Occupations
The most common Natural Resources, Construction and Maintenance occupations in Wardensville are Construction & Extraction (7 | 4.8%), and Installation, Maintenance & Repair (2 | 1.4%).
Natural Resources, Construction and Maintenance Occupations by Sex
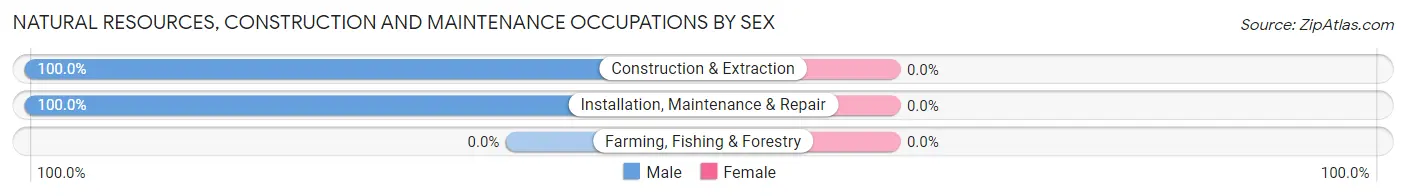
| Occupation | Male | Female |
| Farming, Fishing & Forestry | 0 (0.0%) | 0 (0.0%) |
| Construction & Extraction | 7 (100.0%) | 0 (0.0%) |
| Installation, Maintenance & Repair | 2 (100.0%) | 0 (0.0%) |
| Total (Category) | 9 (100.0%) | 0 (0.0%) |
| Total (Overall) | 46 (31.3%) | 101 (68.7%) |
Production, Transportation and Moving Occupations
The most common Production, Transportation and Moving occupations in Wardensville are Material Moving (13 | 8.8%), and Production (9 | 6.1%).
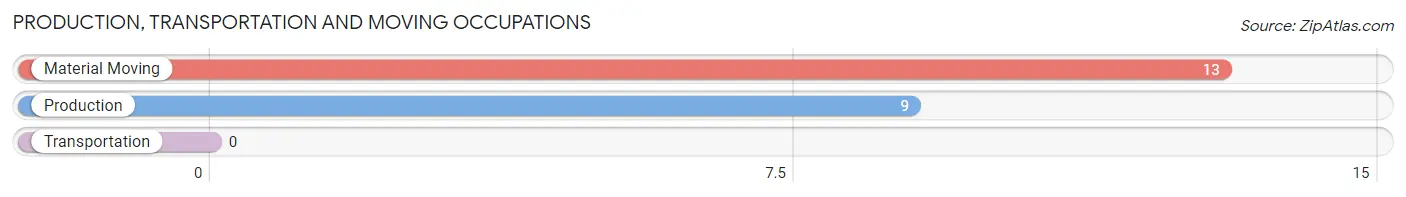
Production, Transportation and Moving Occupations by Sex
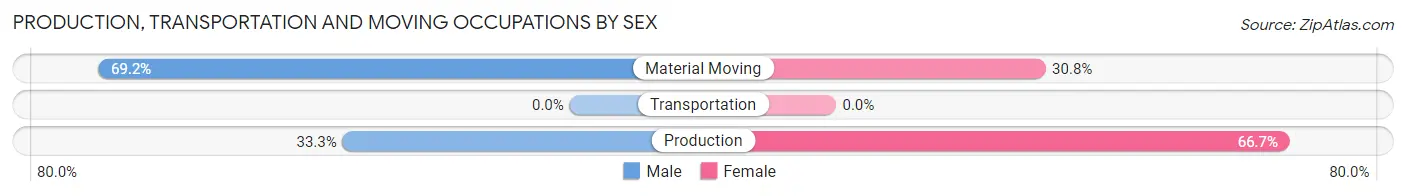
| Occupation | Male | Female |
| Production | 3 (33.3%) | 6 (66.7%) |
| Transportation | 0 (0.0%) | 0 (0.0%) |
| Material Moving | 9 (69.2%) | 4 (30.8%) |
| Total (Category) | 12 (54.5%) | 10 (45.5%) |
| Total (Overall) | 46 (31.3%) | 101 (68.7%) |
Employment Industries by Sex in Wardensville
Employment Industries in Wardensville
The major employment industries in Wardensville include Accommodation & Food Services (25 | 17.0%), Health Care & Social Assistance (23 | 15.7%), Educational Services (21 | 14.3%), Manufacturing (16 | 10.9%), and Retail Trade (16 | 10.9%).
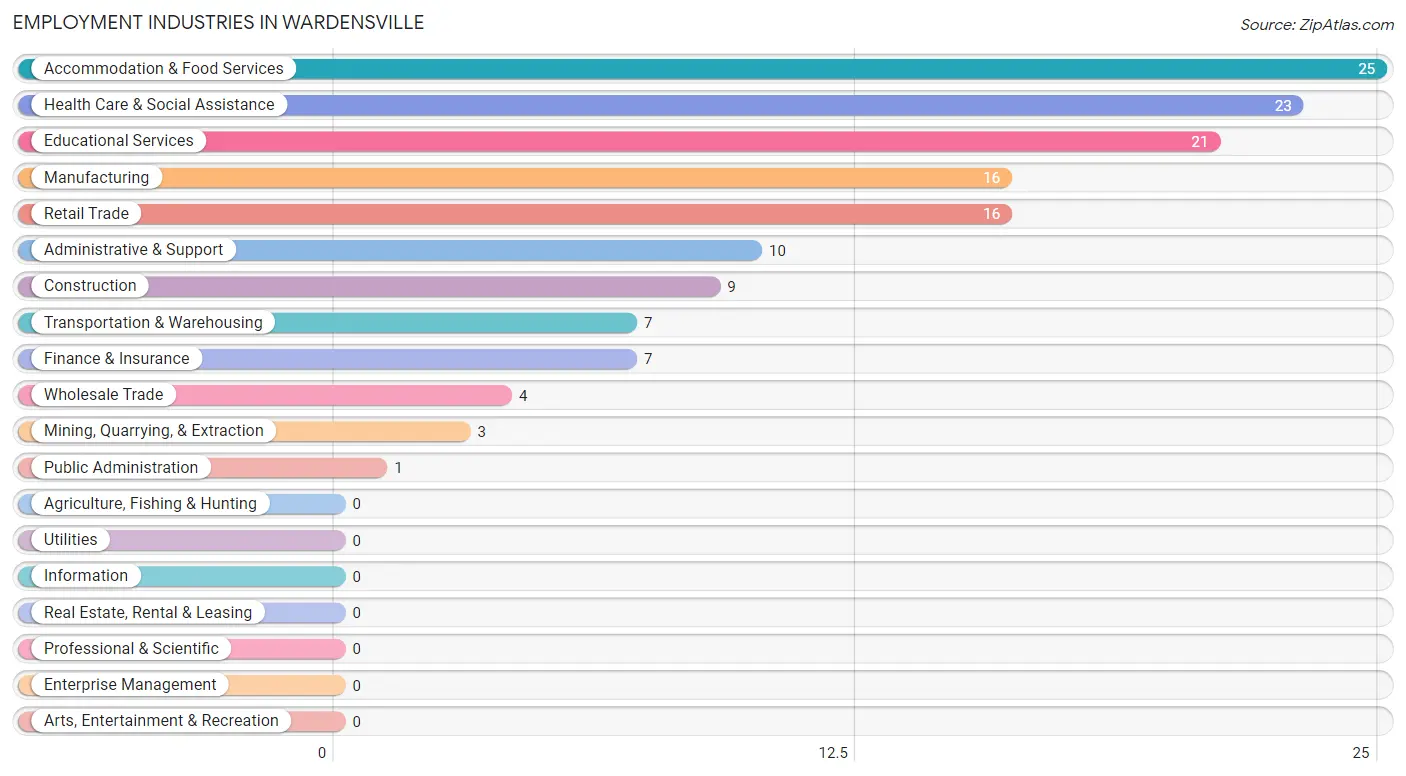
Employment Industries by Sex in Wardensville
The Wardensville industries that see more men than women are Construction (100.0%), Transportation & Warehousing (100.0%), and Finance & Insurance (85.7%), whereas the industries that tend to have a higher number of women are Wholesale Trade (100.0%), Public Administration (100.0%), and Accommodation & Food Services (96.0%).
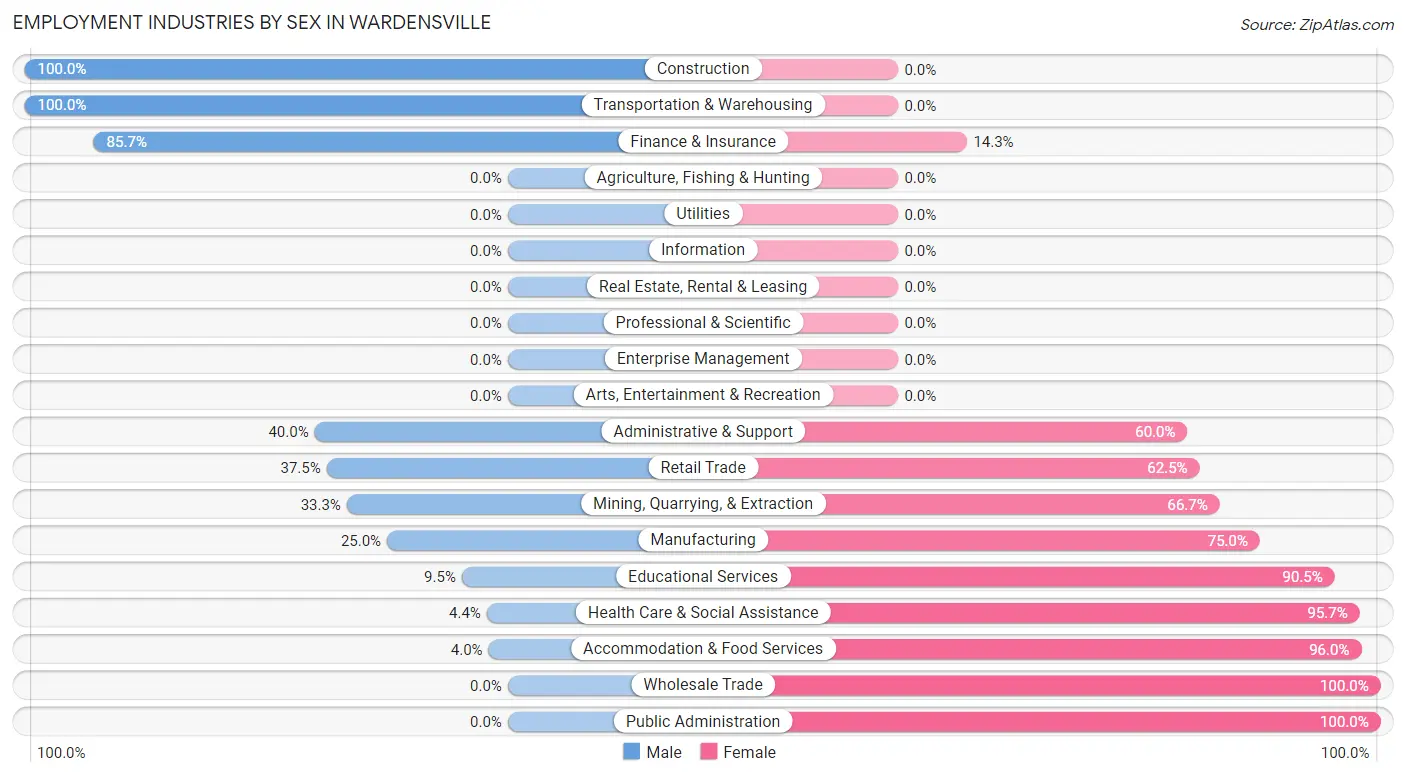
| Industry | Male | Female |
| Agriculture, Fishing & Hunting | 0 (0.0%) | 0 (0.0%) |
| Mining, Quarrying, & Extraction | 1 (33.3%) | 2 (66.7%) |
| Construction | 9 (100.0%) | 0 (0.0%) |
| Manufacturing | 4 (25.0%) | 12 (75.0%) |
| Wholesale Trade | 0 (0.0%) | 4 (100.0%) |
| Retail Trade | 6 (37.5%) | 10 (62.5%) |
| Transportation & Warehousing | 7 (100.0%) | 0 (0.0%) |
| Utilities | 0 (0.0%) | 0 (0.0%) |
| Information | 0 (0.0%) | 0 (0.0%) |
| Finance & Insurance | 6 (85.7%) | 1 (14.3%) |
| Real Estate, Rental & Leasing | 0 (0.0%) | 0 (0.0%) |
| Professional & Scientific | 0 (0.0%) | 0 (0.0%) |
| Enterprise Management | 0 (0.0%) | 0 (0.0%) |
| Administrative & Support | 4 (40.0%) | 6 (60.0%) |
| Educational Services | 2 (9.5%) | 19 (90.5%) |
| Health Care & Social Assistance | 1 (4.3%) | 22 (95.7%) |
| Arts, Entertainment & Recreation | 0 (0.0%) | 0 (0.0%) |
| Accommodation & Food Services | 1 (4.0%) | 24 (96.0%) |
| Public Administration | 0 (0.0%) | 1 (100.0%) |
| Total | 46 (31.3%) | 101 (68.7%) |
Education in Wardensville
School Enrollment in Wardensville
The most common levels of schooling among the 72 students in Wardensville are high school (22 | 30.6%), middle school (20 | 27.8%), and college / undergraduate (16 | 22.2%).
| School Level | # Students | % Students |
| Nursery / Preschool | 0 | 0.0% |
| Kindergarten | 0 | 0.0% |
| Elementary School | 14 | 19.4% |
| Middle School | 20 | 27.8% |
| High School | 22 | 30.6% |
| College / Undergraduate | 16 | 22.2% |
| Graduate / Professional | 0 | 0.0% |
| Total | 72 | 100.0% |
School Enrollment by Age by Funding Source in Wardensville
Out of a total of 72 students who are enrolled in schools in Wardensville, 7 (9.7%) attend a private institution, while the remaining 65 (90.3%) are enrolled in public schools. The age group of 18 to 19 year olds has the highest likelihood of being enrolled in private schools, with 7 (70.0% in the age bracket) enrolled. Conversely, the age group of 5 to 9 year old has the lowest likelihood of being enrolled in a private school, with 14 (100.0% in the age bracket) attending a public institution.
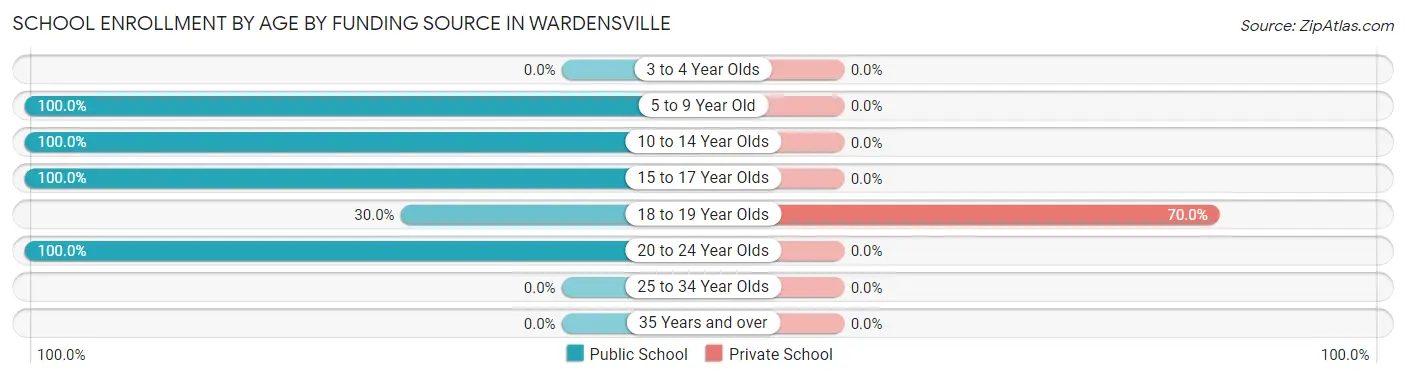
| Age Bracket | Public School | Private School |
| 3 to 4 Year Olds | 0 (0.0%) | 0 (0.0%) |
| 5 to 9 Year Old | 14 (100.0%) | 0 (0.0%) |
| 10 to 14 Year Olds | 20 (100.0%) | 0 (0.0%) |
| 15 to 17 Year Olds | 22 (100.0%) | 0 (0.0%) |
| 18 to 19 Year Olds | 3 (30.0%) | 7 (70.0%) |
| 20 to 24 Year Olds | 6 (100.0%) | 0 (0.0%) |
| 25 to 34 Year Olds | 0 (0.0%) | 0 (0.0%) |
| 35 Years and over | 0 (0.0%) | 0 (0.0%) |
| Total | 65 (90.3%) | 7 (9.7%) |
Educational Attainment by Field of Study in Wardensville
Education (11 | 36.7%), bio, nature & agricultural (6 | 20.0%), arts & humanities (4 | 13.3%), liberal arts & history (3 | 10.0%), and science & technology (2 | 6.7%) are the most common fields of study among 30 individuals in Wardensville who have obtained a bachelor's degree or higher.
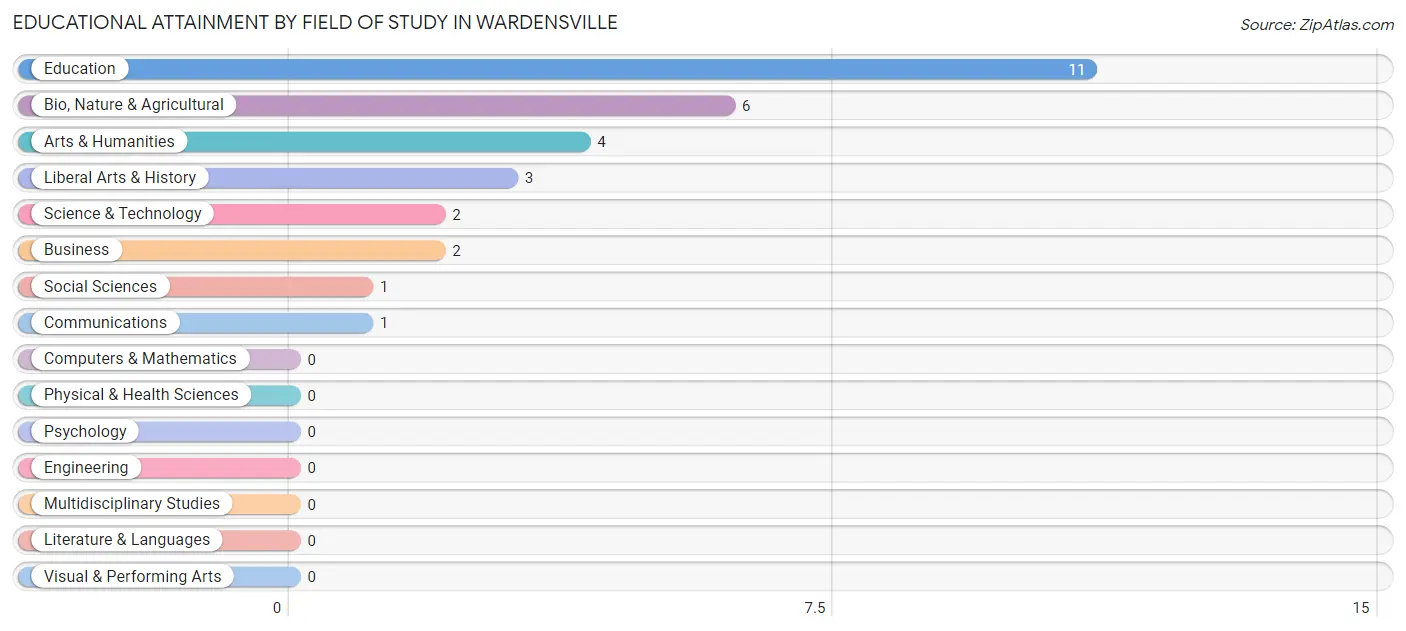
| Field of Study | # Graduates | % Graduates |
| Computers & Mathematics | 0 | 0.0% |
| Bio, Nature & Agricultural | 6 | 20.0% |
| Physical & Health Sciences | 0 | 0.0% |
| Psychology | 0 | 0.0% |
| Social Sciences | 1 | 3.3% |
| Engineering | 0 | 0.0% |
| Multidisciplinary Studies | 0 | 0.0% |
| Science & Technology | 2 | 6.7% |
| Business | 2 | 6.7% |
| Education | 11 | 36.7% |
| Literature & Languages | 0 | 0.0% |
| Liberal Arts & History | 3 | 10.0% |
| Visual & Performing Arts | 0 | 0.0% |
| Communications | 1 | 3.3% |
| Arts & Humanities | 4 | 13.3% |
| Total | 30 | 100.0% |
Transportation & Commute in Wardensville
Vehicle Availability by Sex in Wardensville
The most prevalent vehicle ownership categories in Wardensville are males with 2 vehicles (23, accounting for 51.1%) and females with 2 vehicles (39, making up 24.2%).
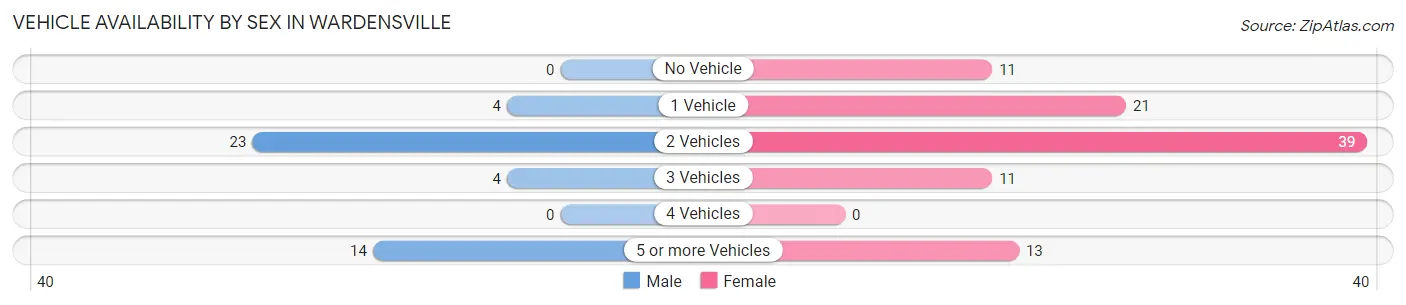
| Vehicles Available | Male | Female |
| No Vehicle | 0 (0.0%) | 11 (11.6%) |
| 1 Vehicle | 4 (8.9%) | 21 (22.1%) |
| 2 Vehicles | 23 (51.1%) | 39 (41.0%) |
| 3 Vehicles | 4 (8.9%) | 11 (11.6%) |
| 4 Vehicles | 0 (0.0%) | 0 (0.0%) |
| 5 or more Vehicles | 14 (31.1%) | 13 (13.7%) |
| Total | 45 (100.0%) | 95 (100.0%) |
Commute Time in Wardensville
The most frequently occuring commute durations in Wardensville are 45 to 59 minutes (29 commuters, 20.9%), 15 to 19 minutes (28 commuters, 20.1%), and 60 to 89 minutes (27 commuters, 19.4%).
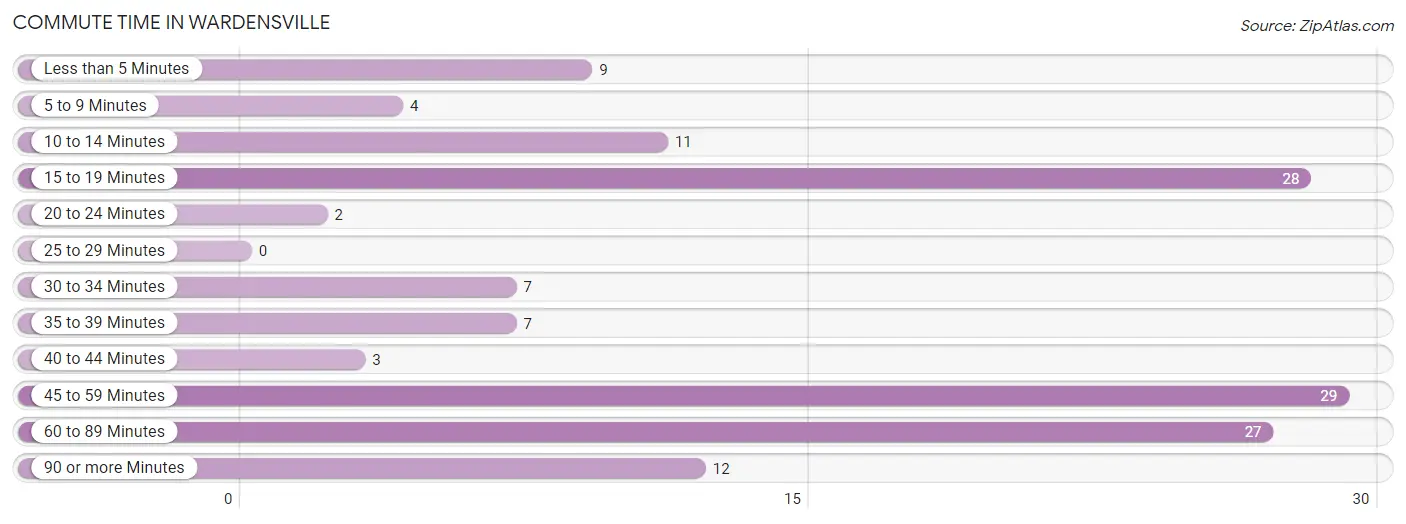
| Commute Time | # Commuters | % Commuters |
| Less than 5 Minutes | 9 | 6.5% |
| 5 to 9 Minutes | 4 | 2.9% |
| 10 to 14 Minutes | 11 | 7.9% |
| 15 to 19 Minutes | 28 | 20.1% |
| 20 to 24 Minutes | 2 | 1.4% |
| 25 to 29 Minutes | 0 | 0.0% |
| 30 to 34 Minutes | 7 | 5.0% |
| 35 to 39 Minutes | 7 | 5.0% |
| 40 to 44 Minutes | 3 | 2.2% |
| 45 to 59 Minutes | 29 | 20.9% |
| 60 to 89 Minutes | 27 | 19.4% |
| 90 or more Minutes | 12 | 8.6% |
Commute Time by Sex in Wardensville
The most common commute times in Wardensville are 60 to 89 minutes (21 commuters, 47.7%) for males and 15 to 19 minutes (24 commuters, 25.3%) for females.
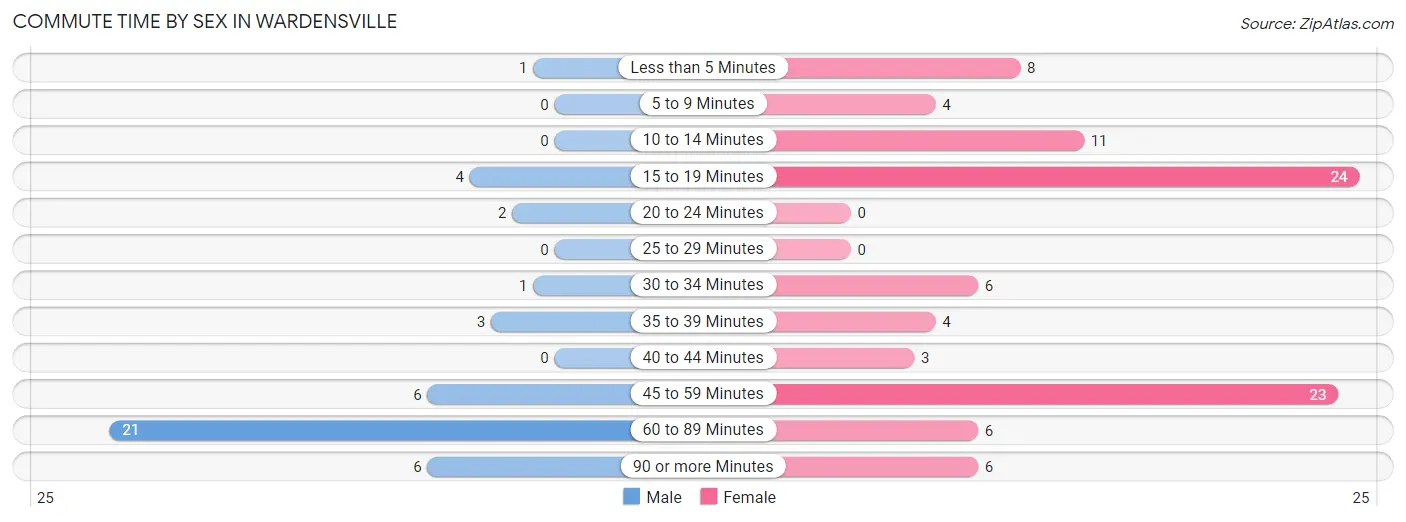
| Commute Time | Male | Female |
| Less than 5 Minutes | 1 (2.3%) | 8 (8.4%) |
| 5 to 9 Minutes | 0 (0.0%) | 4 (4.2%) |
| 10 to 14 Minutes | 0 (0.0%) | 11 (11.6%) |
| 15 to 19 Minutes | 4 (9.1%) | 24 (25.3%) |
| 20 to 24 Minutes | 2 (4.5%) | 0 (0.0%) |
| 25 to 29 Minutes | 0 (0.0%) | 0 (0.0%) |
| 30 to 34 Minutes | 1 (2.3%) | 6 (6.3%) |
| 35 to 39 Minutes | 3 (6.8%) | 4 (4.2%) |
| 40 to 44 Minutes | 0 (0.0%) | 3 (3.2%) |
| 45 to 59 Minutes | 6 (13.6%) | 23 (24.2%) |
| 60 to 89 Minutes | 21 (47.7%) | 6 (6.3%) |
| 90 or more Minutes | 6 (13.6%) | 6 (6.3%) |
Time of Departure to Work by Sex in Wardensville
The most frequent times of departure to work in Wardensville are 6:00 AM to 6:29 AM (15, 34.1%) for males and 5:30 AM to 5:59 AM (14, 14.7%) for females.
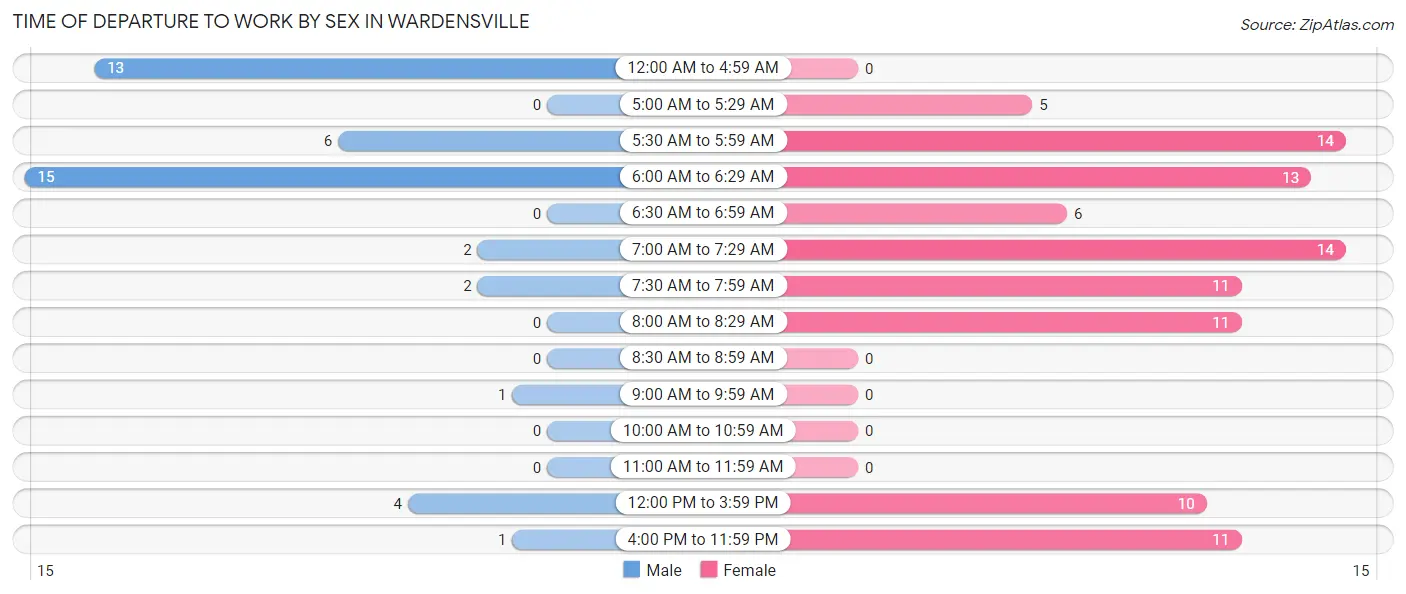
| Time of Departure | Male | Female |
| 12:00 AM to 4:59 AM | 13 (29.5%) | 0 (0.0%) |
| 5:00 AM to 5:29 AM | 0 (0.0%) | 5 (5.3%) |
| 5:30 AM to 5:59 AM | 6 (13.6%) | 14 (14.7%) |
| 6:00 AM to 6:29 AM | 15 (34.1%) | 13 (13.7%) |
| 6:30 AM to 6:59 AM | 0 (0.0%) | 6 (6.3%) |
| 7:00 AM to 7:29 AM | 2 (4.5%) | 14 (14.7%) |
| 7:30 AM to 7:59 AM | 2 (4.5%) | 11 (11.6%) |
| 8:00 AM to 8:29 AM | 0 (0.0%) | 11 (11.6%) |
| 8:30 AM to 8:59 AM | 0 (0.0%) | 0 (0.0%) |
| 9:00 AM to 9:59 AM | 1 (2.3%) | 0 (0.0%) |
| 10:00 AM to 10:59 AM | 0 (0.0%) | 0 (0.0%) |
| 11:00 AM to 11:59 AM | 0 (0.0%) | 0 (0.0%) |
| 12:00 PM to 3:59 PM | 4 (9.1%) | 10 (10.5%) |
| 4:00 PM to 11:59 PM | 1 (2.3%) | 11 (11.6%) |
| Total | 44 (100.0%) | 95 (100.0%) |
Housing Occupancy in Wardensville
Occupancy by Ownership in Wardensville
Of the total 164 dwellings in Wardensville, owner-occupied units account for 99 (60.4%), while renter-occupied units make up 65 (39.6%).

| Occupancy | # Housing Units | % Housing Units |
| Owner Occupied Housing Units | 99 | 60.4% |
| Renter-Occupied Housing Units | 65 | 39.6% |
| Total Occupied Housing Units | 164 | 100.0% |
Occupancy by Household Size in Wardensville
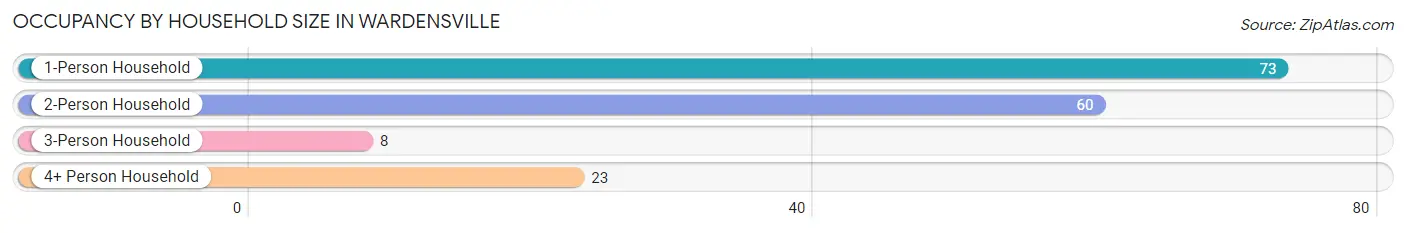
| Household Size | # Housing Units | % Housing Units |
| 1-Person Household | 73 | 44.5% |
| 2-Person Household | 60 | 36.6% |
| 3-Person Household | 8 | 4.9% |
| 4+ Person Household | 23 | 14.0% |
| Total Housing Units | 164 | 100.0% |
Occupancy by Ownership by Household Size in Wardensville
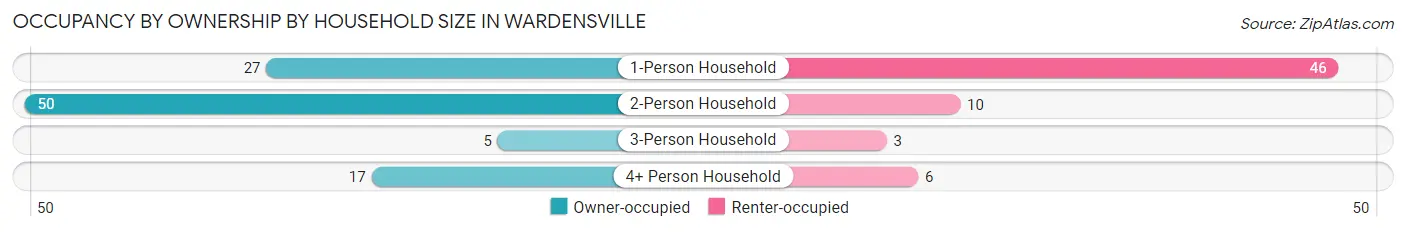
| Household Size | Owner-occupied | Renter-occupied |
| 1-Person Household | 27 (37.0%) | 46 (63.0%) |
| 2-Person Household | 50 (83.3%) | 10 (16.7%) |
| 3-Person Household | 5 (62.5%) | 3 (37.5%) |
| 4+ Person Household | 17 (73.9%) | 6 (26.1%) |
| Total Housing Units | 99 (60.4%) | 65 (39.6%) |
Occupancy by Educational Attainment in Wardensville
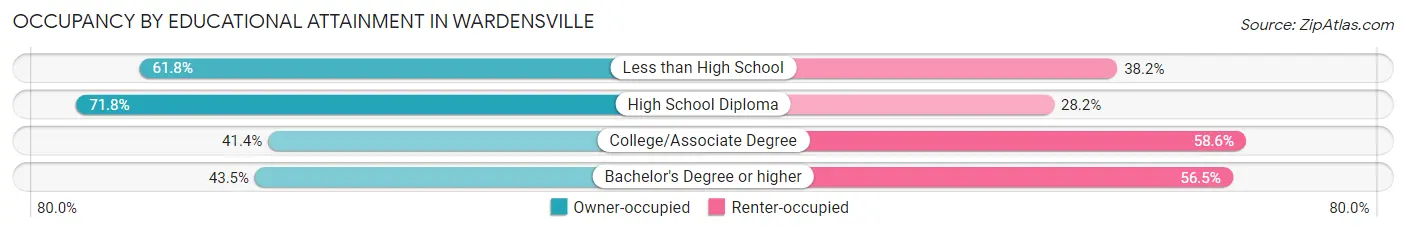
| Household Size | Owner-occupied | Renter-occupied |
| Less than High School | 21 (61.8%) | 13 (38.2%) |
| High School Diploma | 56 (71.8%) | 22 (28.2%) |
| College/Associate Degree | 12 (41.4%) | 17 (58.6%) |
| Bachelor's Degree or higher | 10 (43.5%) | 13 (56.5%) |
Occupancy by Age of Householder in Wardensville
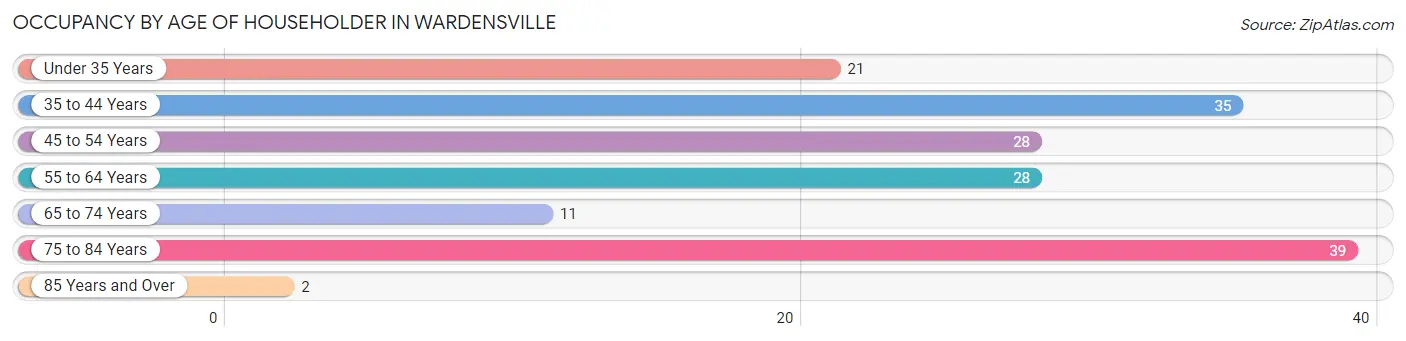
| Age Bracket | # Households | % Households |
| Under 35 Years | 21 | 12.8% |
| 35 to 44 Years | 35 | 21.3% |
| 45 to 54 Years | 28 | 17.1% |
| 55 to 64 Years | 28 | 17.1% |
| 65 to 74 Years | 11 | 6.7% |
| 75 to 84 Years | 39 | 23.8% |
| 85 Years and Over | 2 | 1.2% |
| Total | 164 | 100.0% |
Housing Finances in Wardensville
Median Income by Occupancy in Wardensville
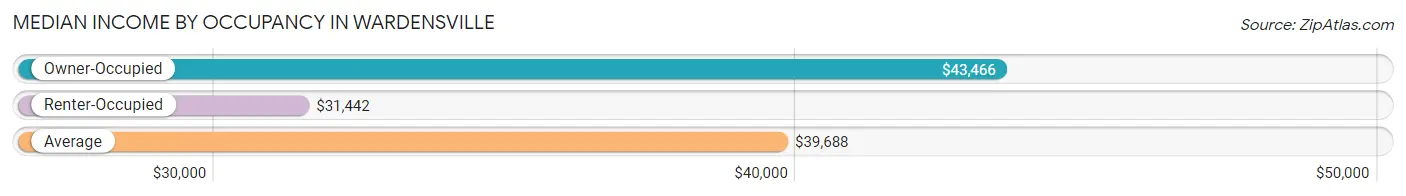
| Occupancy Type | # Households | Median Income |
| Owner-Occupied | 99 (60.4%) | $43,466 |
| Renter-Occupied | 65 (39.6%) | $31,442 |
| Average | 164 (100.0%) | $39,688 |
Occupancy by Householder Income Bracket in Wardensville
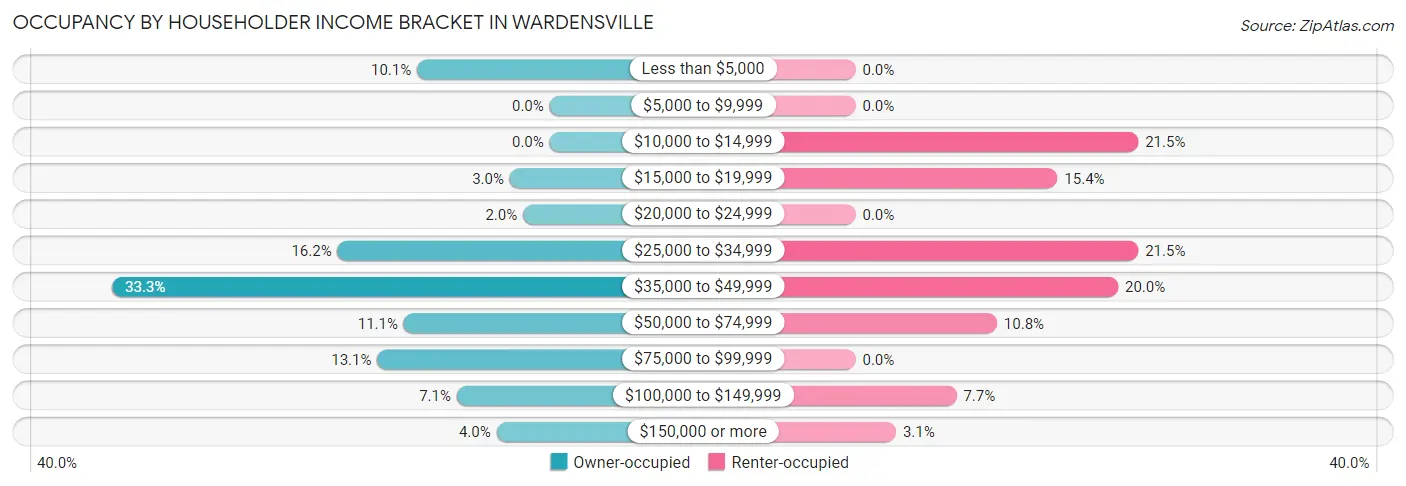
| Income Bracket | Owner-occupied | Renter-occupied |
| Less than $5,000 | 10 (10.1%) | 0 (0.0%) |
| $5,000 to $9,999 | 0 (0.0%) | 0 (0.0%) |
| $10,000 to $14,999 | 0 (0.0%) | 14 (21.5%) |
| $15,000 to $19,999 | 3 (3.0%) | 10 (15.4%) |
| $20,000 to $24,999 | 2 (2.0%) | 0 (0.0%) |
| $25,000 to $34,999 | 16 (16.2%) | 14 (21.5%) |
| $35,000 to $49,999 | 33 (33.3%) | 13 (20.0%) |
| $50,000 to $74,999 | 11 (11.1%) | 7 (10.8%) |
| $75,000 to $99,999 | 13 (13.1%) | 0 (0.0%) |
| $100,000 to $149,999 | 7 (7.1%) | 5 (7.7%) |
| $150,000 or more | 4 (4.0%) | 2 (3.1%) |
| Total | 99 (100.0%) | 65 (100.0%) |
Monthly Housing Cost Tiers in Wardensville
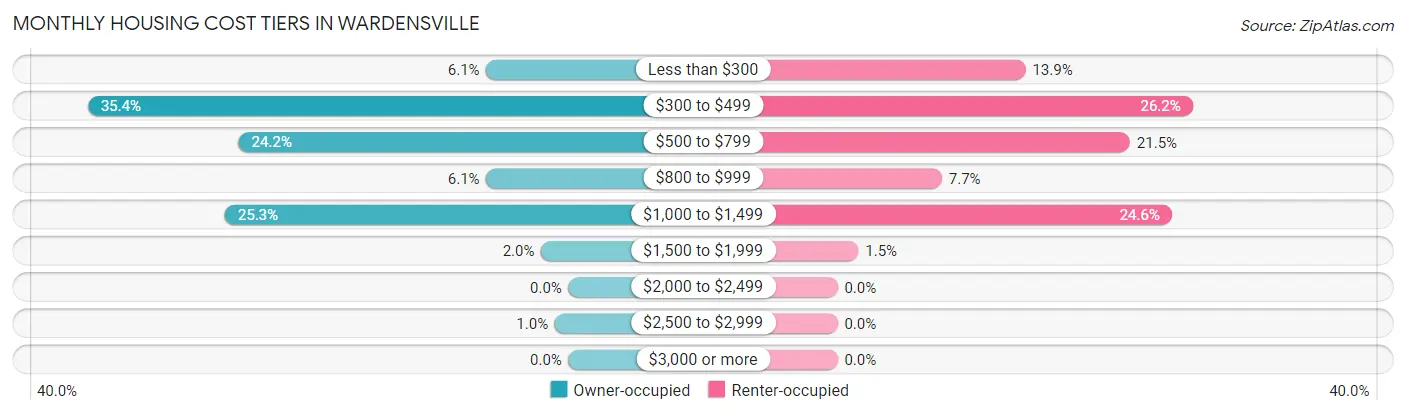
| Monthly Cost | Owner-occupied | Renter-occupied |
| Less than $300 | 6 (6.1%) | 9 (13.9%) |
| $300 to $499 | 35 (35.3%) | 17 (26.2%) |
| $500 to $799 | 24 (24.2%) | 14 (21.5%) |
| $800 to $999 | 6 (6.1%) | 5 (7.7%) |
| $1,000 to $1,499 | 25 (25.3%) | 16 (24.6%) |
| $1,500 to $1,999 | 2 (2.0%) | 1 (1.5%) |
| $2,000 to $2,499 | 0 (0.0%) | 0 (0.0%) |
| $2,500 to $2,999 | 1 (1.0%) | 0 (0.0%) |
| $3,000 or more | 0 (0.0%) | 0 (0.0%) |
| Total | 99 (100.0%) | 65 (100.0%) |
Physical Housing Characteristics in Wardensville
Housing Structures in Wardensville
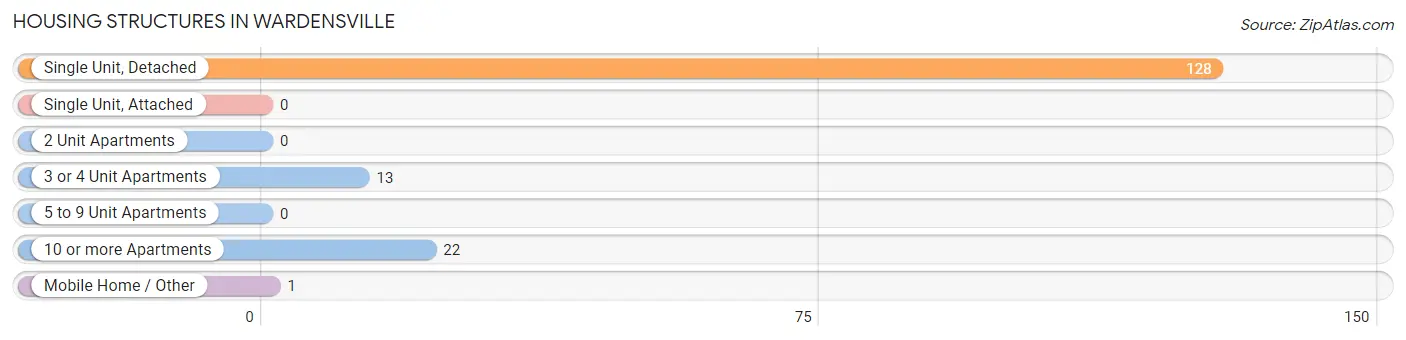
| Structure Type | # Housing Units | % Housing Units |
| Single Unit, Detached | 128 | 78.0% |
| Single Unit, Attached | 0 | 0.0% |
| 2 Unit Apartments | 0 | 0.0% |
| 3 or 4 Unit Apartments | 13 | 7.9% |
| 5 to 9 Unit Apartments | 0 | 0.0% |
| 10 or more Apartments | 22 | 13.4% |
| Mobile Home / Other | 1 | 0.6% |
| Total | 164 | 100.0% |
Housing Structures by Occupancy in Wardensville
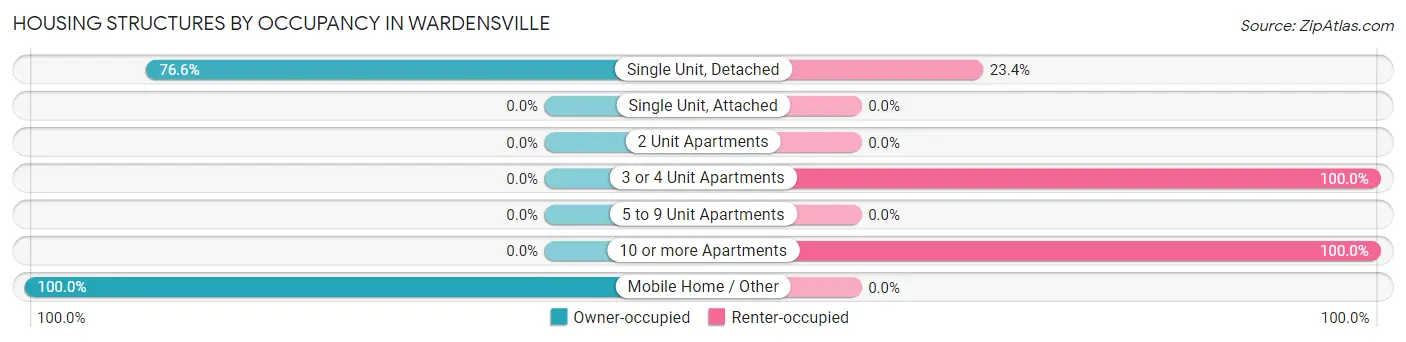
| Structure Type | Owner-occupied | Renter-occupied |
| Single Unit, Detached | 98 (76.6%) | 30 (23.4%) |
| Single Unit, Attached | 0 (0.0%) | 0 (0.0%) |
| 2 Unit Apartments | 0 (0.0%) | 0 (0.0%) |
| 3 or 4 Unit Apartments | 0 (0.0%) | 13 (100.0%) |
| 5 to 9 Unit Apartments | 0 (0.0%) | 0 (0.0%) |
| 10 or more Apartments | 0 (0.0%) | 22 (100.0%) |
| Mobile Home / Other | 1 (100.0%) | 0 (0.0%) |
| Total | 99 (60.4%) | 65 (39.6%) |
Housing Structures by Number of Rooms in Wardensville
| Number of Rooms | Owner-occupied | Renter-occupied |
| 1 Room | 0 (0.0%) | 0 (0.0%) |
| 2 or 3 Rooms | 1 (1.0%) | 33 (50.8%) |
| 4 or 5 Rooms | 16 (16.2%) | 16 (24.6%) |
| 6 or 7 Rooms | 63 (63.6%) | 13 (20.0%) |
| 8 or more Rooms | 19 (19.2%) | 3 (4.6%) |
| Total | 99 (100.0%) | 65 (100.0%) |
Housing Structure by Heating Type in Wardensville
| Heating Type | Owner-occupied | Renter-occupied |
| Utility Gas | 1 (1.0%) | 0 (0.0%) |
| Bottled, Tank, or LP Gas | 15 (15.1%) | 10 (15.4%) |
| Electricity | 62 (62.6%) | 55 (84.6%) |
| Fuel Oil or Kerosene | 12 (12.1%) | 0 (0.0%) |
| Coal or Coke | 0 (0.0%) | 0 (0.0%) |
| All other Fuels | 9 (9.1%) | 0 (0.0%) |
| No Fuel Used | 0 (0.0%) | 0 (0.0%) |
| Total | 99 (100.0%) | 65 (100.0%) |
Household Vehicle Usage in Wardensville
| Vehicles per Household | Owner-occupied | Renter-occupied |
| No Vehicle | 8 (8.1%) | 23 (35.4%) |
| 1 Vehicle | 39 (39.4%) | 16 (24.6%) |
| 2 Vehicles | 38 (38.4%) | 24 (36.9%) |
| 3 or more Vehicles | 14 (14.1%) | 2 (3.1%) |
| Total | 99 (100.0%) | 65 (100.0%) |
Real Estate & Mortgages in Wardensville
Real Estate and Mortgage Overview in Wardensville
| Characteristic | Without Mortgage | With Mortgage |
| Housing Units | 67 | 32 |
| Median Property Value | $173,200 | $161,500 |
| Median Household Income | $37,679 | $4 |
| Monthly Housing Costs | $463 | $0 |
| Real Estate Taxes | $685 | $0 |
Property Value by Mortgage Status in Wardensville
| Property Value | Without Mortgage | With Mortgage |
| Less than $50,000 | 9 (13.4%) | 0 (0.0%) |
| $50,000 to $99,999 | 5 (7.5%) | 6 (18.8%) |
| $100,000 to $299,999 | 51 (76.1%) | 26 (81.2%) |
| $300,000 to $499,999 | 2 (3.0%) | 0 (0.0%) |
| $500,000 to $749,999 | 0 (0.0%) | 0 (0.0%) |
| $750,000 to $999,999 | 0 (0.0%) | 0 (0.0%) |
| $1,000,000 or more | 0 (0.0%) | 0 (0.0%) |
| Total | 67 (100.0%) | 32 (100.0%) |
Household Income by Mortgage Status in Wardensville
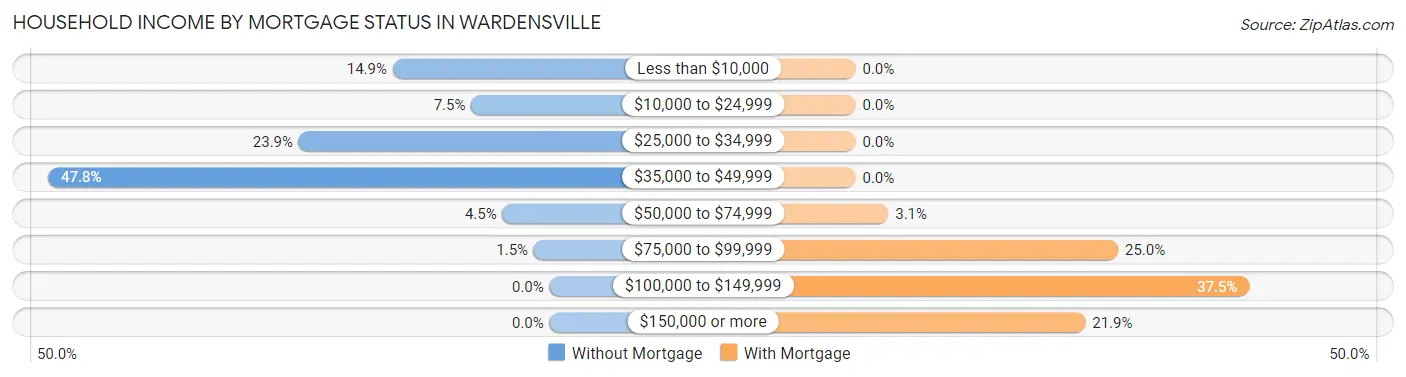
| Household Income | Without Mortgage | With Mortgage |
| Less than $10,000 | 10 (14.9%) | 0 (0.0%) |
| $10,000 to $24,999 | 5 (7.5%) | 0 (0.0%) |
| $25,000 to $34,999 | 16 (23.9%) | 0 (0.0%) |
| $35,000 to $49,999 | 32 (47.8%) | 0 (0.0%) |
| $50,000 to $74,999 | 3 (4.5%) | 1 (3.1%) |
| $75,000 to $99,999 | 1 (1.5%) | 8 (25.0%) |
| $100,000 to $149,999 | 0 (0.0%) | 12 (37.5%) |
| $150,000 or more | 0 (0.0%) | 7 (21.9%) |
| Total | 67 (100.0%) | 32 (100.0%) |
Property Value to Household Income Ratio in Wardensville
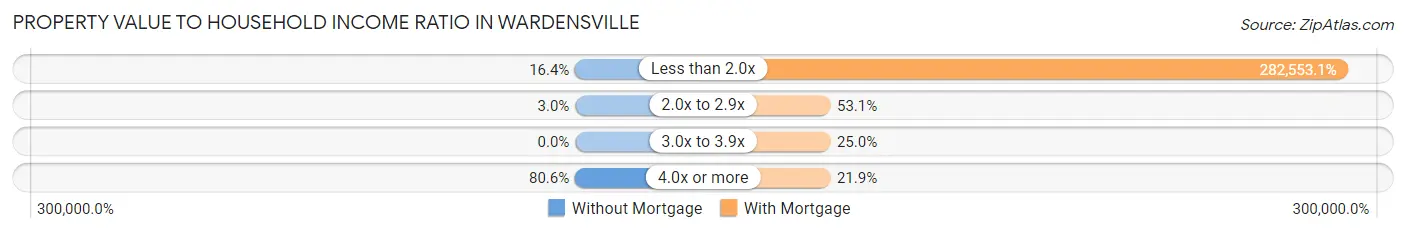
| Value-to-Income Ratio | Without Mortgage | With Mortgage |
| Less than 2.0x | 11 (16.4%) | 90,417 (282,553.1%) |
| 2.0x to 2.9x | 2 (3.0%) | 17 (53.1%) |
| 3.0x to 3.9x | 0 (0.0%) | 8 (25.0%) |
| 4.0x or more | 54 (80.6%) | 7 (21.9%) |
| Total | 67 (100.0%) | 32 (100.0%) |
Real Estate Taxes by Mortgage Status in Wardensville
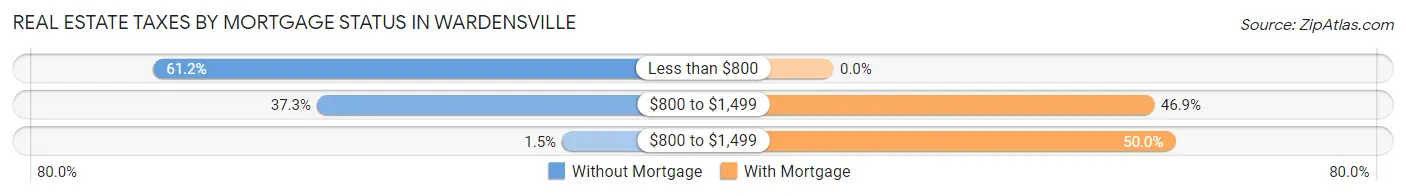
| Property Taxes | Without Mortgage | With Mortgage |
| Less than $800 | 41 (61.2%) | 0 (0.0%) |
| $800 to $1,499 | 25 (37.3%) | 15 (46.9%) |
| $800 to $1,499 | 1 (1.5%) | 16 (50.0%) |
| Total | 67 (100.0%) | 32 (100.0%) |
Health & Disability in Wardensville
Health Insurance Coverage by Age in Wardensville
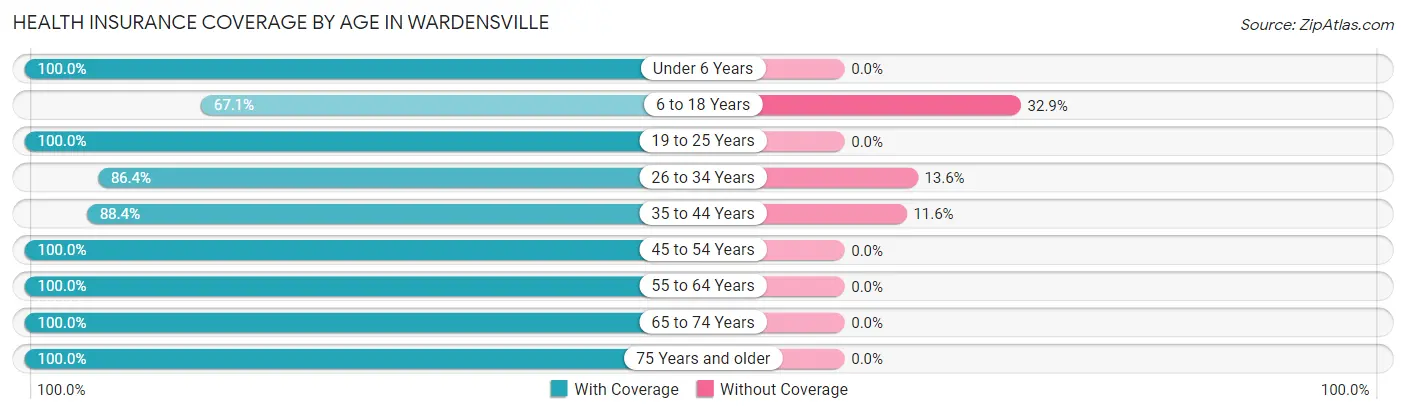
| Age Bracket | With Coverage | Without Coverage |
| Under 6 Years | 16 (100.0%) | 0 (0.0%) |
| 6 to 18 Years | 49 (67.1%) | 24 (32.9%) |
| 19 to 25 Years | 24 (100.0%) | 0 (0.0%) |
| 26 to 34 Years | 19 (86.4%) | 3 (13.6%) |
| 35 to 44 Years | 61 (88.4%) | 8 (11.6%) |
| 45 to 54 Years | 35 (100.0%) | 0 (0.0%) |
| 55 to 64 Years | 50 (100.0%) | 0 (0.0%) |
| 65 to 74 Years | 25 (100.0%) | 0 (0.0%) |
| 75 Years and older | 65 (100.0%) | 0 (0.0%) |
| Total | 344 (90.8%) | 35 (9.2%) |
Health Insurance Coverage by Citizenship Status in Wardensville
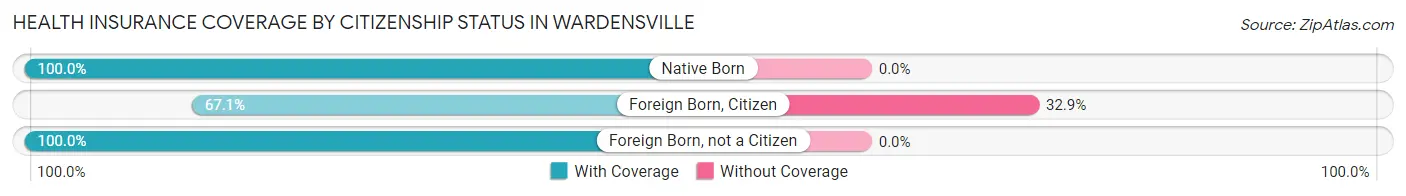
| Citizenship Status | With Coverage | Without Coverage |
| Native Born | 16 (100.0%) | 0 (0.0%) |
| Foreign Born, Citizen | 49 (67.1%) | 24 (32.9%) |
| Foreign Born, not a Citizen | 24 (100.0%) | 0 (0.0%) |
Health Insurance Coverage by Household Income in Wardensville
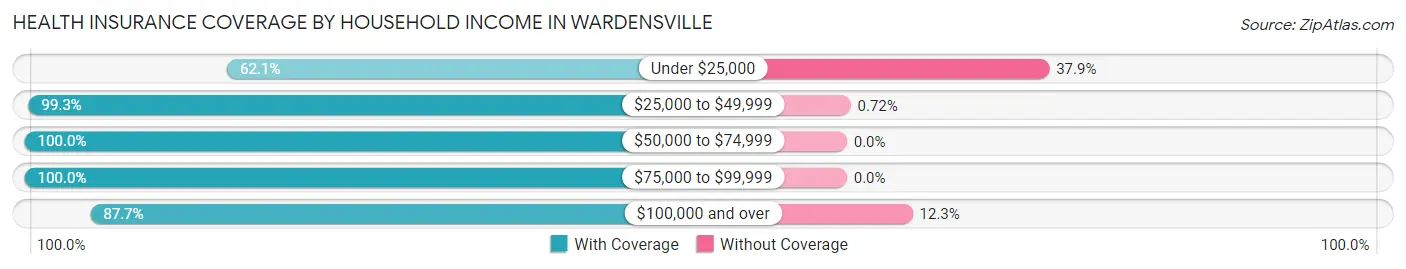
| Household Income | With Coverage | Without Coverage |
| Under $25,000 | 36 (62.1%) | 22 (37.9%) |
| $25,000 to $49,999 | 137 (99.3%) | 1 (0.7%) |
| $50,000 to $74,999 | 41 (100.0%) | 0 (0.0%) |
| $75,000 to $99,999 | 41 (100.0%) | 0 (0.0%) |
| $100,000 and over | 64 (87.7%) | 9 (12.3%) |
Public vs Private Health Insurance Coverage by Age in Wardensville
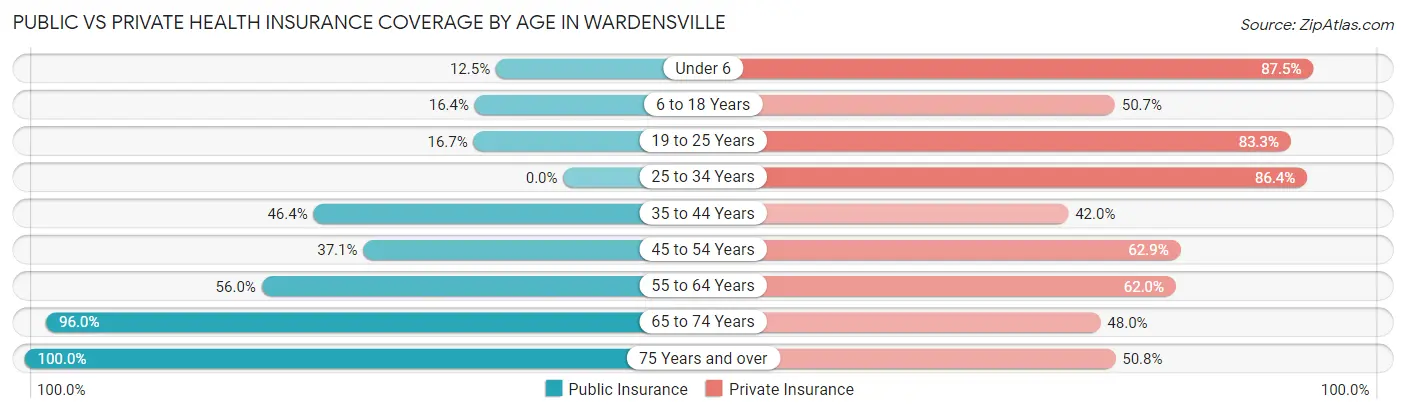
| Age Bracket | Public Insurance | Private Insurance |
| Under 6 | 2 (12.5%) | 14 (87.5%) |
| 6 to 18 Years | 12 (16.4%) | 37 (50.7%) |
| 19 to 25 Years | 4 (16.7%) | 20 (83.3%) |
| 25 to 34 Years | 0 (0.0%) | 19 (86.4%) |
| 35 to 44 Years | 32 (46.4%) | 29 (42.0%) |
| 45 to 54 Years | 13 (37.1%) | 22 (62.9%) |
| 55 to 64 Years | 28 (56.0%) | 31 (62.0%) |
| 65 to 74 Years | 24 (96.0%) | 12 (48.0%) |
| 75 Years and over | 65 (100.0%) | 33 (50.8%) |
| Total | 180 (47.5%) | 217 (57.3%) |
Disability Status by Sex by Age in Wardensville
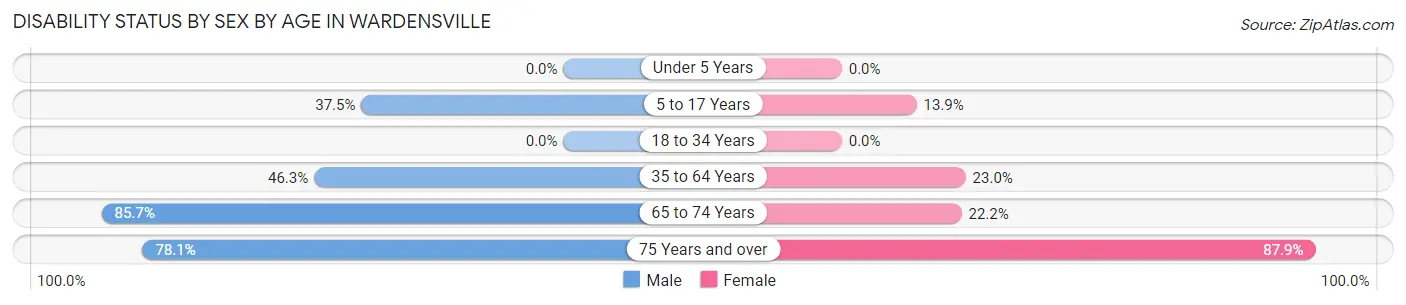
| Age Bracket | Male | Female |
| Under 5 Years | 0 (0.0%) | 0 (0.0%) |
| 5 to 17 Years | 9 (37.5%) | 5 (13.9%) |
| 18 to 34 Years | 0 (0.0%) | 0 (0.0%) |
| 35 to 64 Years | 31 (46.3%) | 20 (23.0%) |
| 65 to 74 Years | 6 (85.7%) | 4 (22.2%) |
| 75 Years and over | 25 (78.1%) | 29 (87.9%) |
Disability Class by Sex by Age in Wardensville
Disability Class: Hearing Difficulty
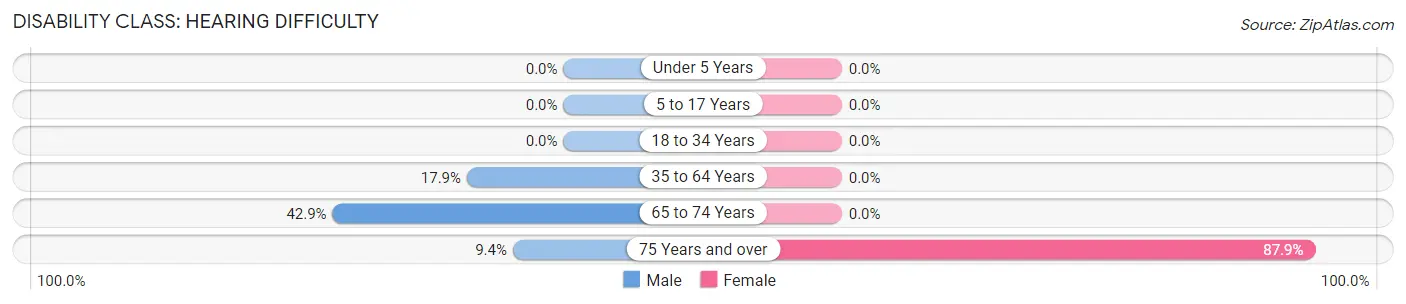
| Age Bracket | Male | Female |
| Under 5 Years | 0 (0.0%) | 0 (0.0%) |
| 5 to 17 Years | 0 (0.0%) | 0 (0.0%) |
| 18 to 34 Years | 0 (0.0%) | 0 (0.0%) |
| 35 to 64 Years | 12 (17.9%) | 0 (0.0%) |
| 65 to 74 Years | 3 (42.9%) | 0 (0.0%) |
| 75 Years and over | 3 (9.4%) | 29 (87.9%) |
Disability Class: Vision Difficulty

| Age Bracket | Male | Female |
| Under 5 Years | 0 (0.0%) | 0 (0.0%) |
| 5 to 17 Years | 0 (0.0%) | 5 (13.9%) |
| 18 to 34 Years | 0 (0.0%) | 0 (0.0%) |
| 35 to 64 Years | 11 (16.4%) | 2 (2.3%) |
| 65 to 74 Years | 3 (42.9%) | 0 (0.0%) |
| 75 Years and over | 3 (9.4%) | 29 (87.9%) |
Disability Class: Cognitive Difficulty
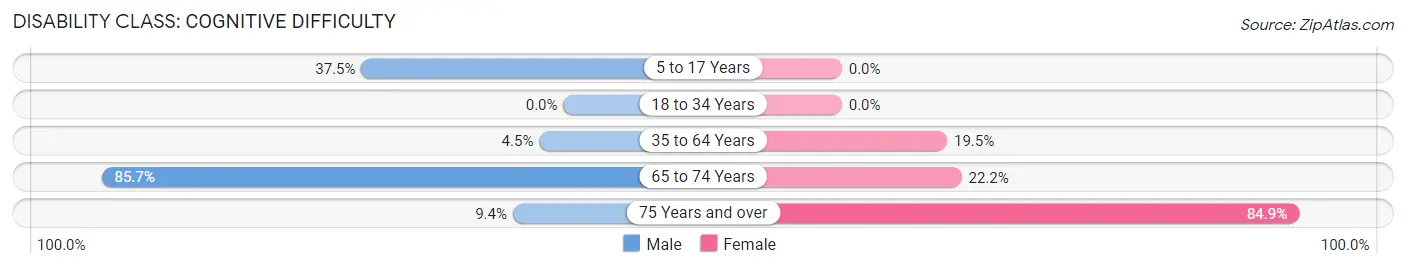
| Age Bracket | Male | Female |
| 5 to 17 Years | 9 (37.5%) | 0 (0.0%) |
| 18 to 34 Years | 0 (0.0%) | 0 (0.0%) |
| 35 to 64 Years | 3 (4.5%) | 17 (19.5%) |
| 65 to 74 Years | 6 (85.7%) | 4 (22.2%) |
| 75 Years and over | 3 (9.4%) | 28 (84.9%) |
Disability Class: Ambulatory Difficulty
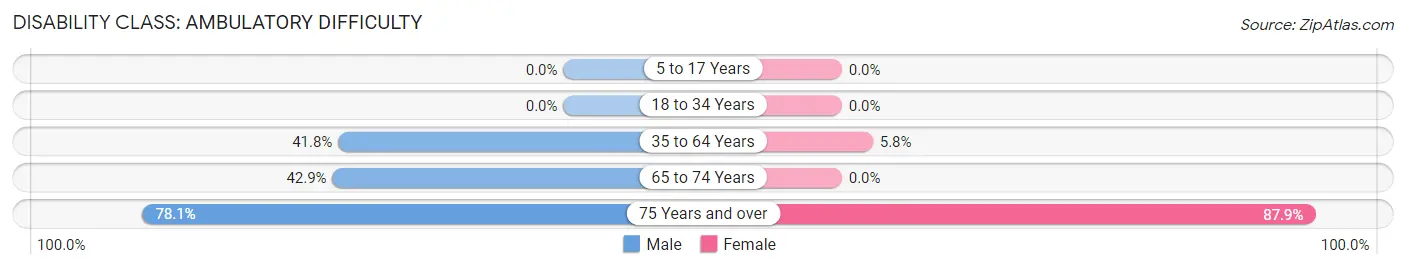
| Age Bracket | Male | Female |
| 5 to 17 Years | 0 (0.0%) | 0 (0.0%) |
| 18 to 34 Years | 0 (0.0%) | 0 (0.0%) |
| 35 to 64 Years | 28 (41.8%) | 5 (5.8%) |
| 65 to 74 Years | 3 (42.9%) | 0 (0.0%) |
| 75 Years and over | 25 (78.1%) | 29 (87.9%) |
Disability Class: Self-Care Difficulty
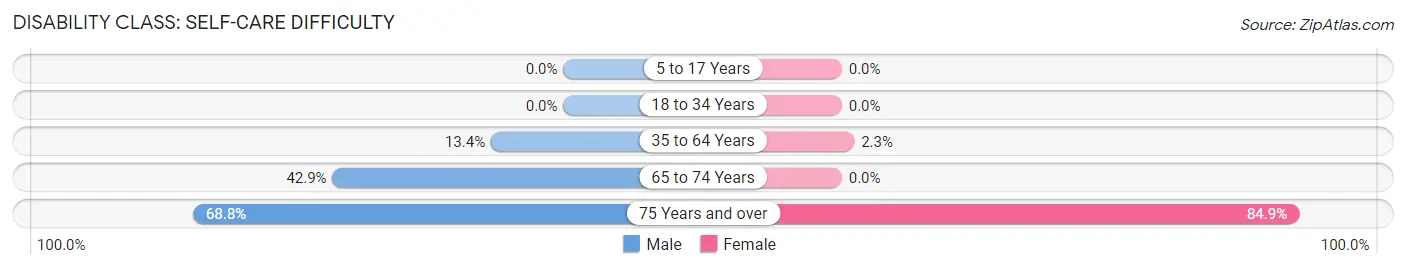
| Age Bracket | Male | Female |
| 5 to 17 Years | 0 (0.0%) | 0 (0.0%) |
| 18 to 34 Years | 0 (0.0%) | 0 (0.0%) |
| 35 to 64 Years | 9 (13.4%) | 2 (2.3%) |
| 65 to 74 Years | 3 (42.9%) | 0 (0.0%) |
| 75 Years and over | 22 (68.8%) | 28 (84.9%) |
Technology Access in Wardensville
Computing Device Access in Wardensville
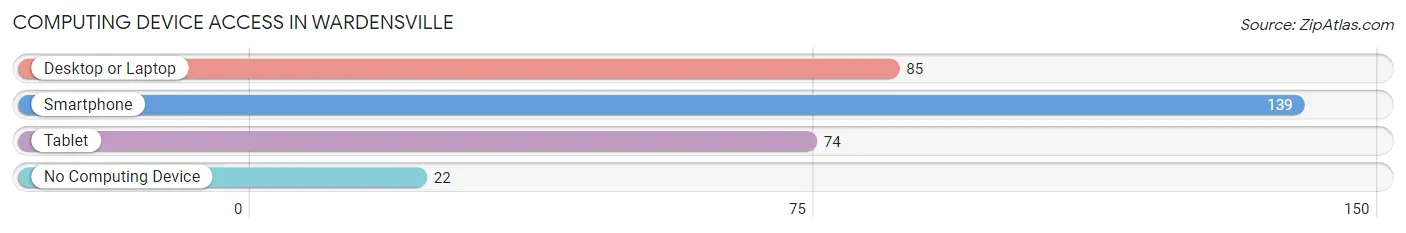
| Device Type | # Households | % Households |
| Desktop or Laptop | 85 | 51.8% |
| Smartphone | 139 | 84.8% |
| Tablet | 74 | 45.1% |
| No Computing Device | 22 | 13.4% |
| Total | 164 | 100.0% |
Internet Access in Wardensville
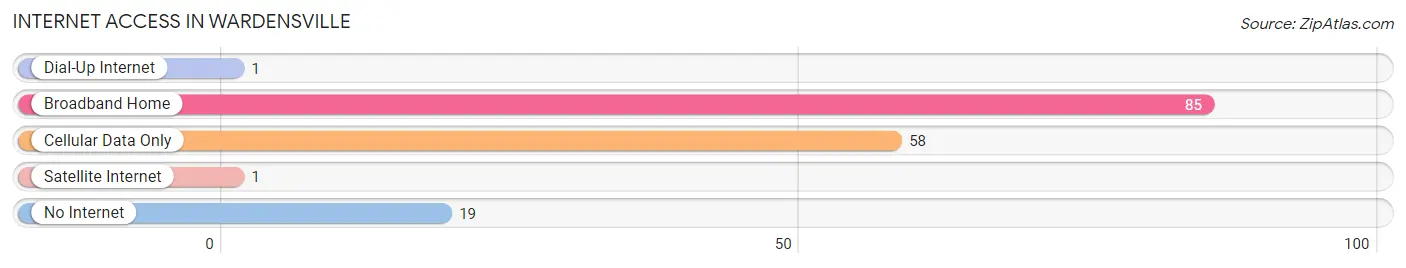
| Internet Type | # Households | % Households |
| Dial-Up Internet | 1 | 0.6% |
| Broadband Home | 85 | 51.8% |
| Cellular Data Only | 58 | 35.4% |
| Satellite Internet | 1 | 0.6% |
| No Internet | 19 | 11.6% |
| Total | 164 | 100.0% |
Wardensville Summary
Wardenville is a small town located in the eastern panhandle of West Virginia, in the United States. It is situated in the northern part of Hardy County, and is the county seat. The town was founded in 1790 and has a population of approximately 500 people.
History
Wardenville was founded in 1790 by a group of settlers from Pennsylvania. The town was named after the first settler, John Warden, who was a Revolutionary War veteran. The town was originally a farming community, and the first post office was established in 1802.
In 1820, the town was incorporated and the first courthouse was built. The town grew slowly over the next few decades, and by the mid-1800s, it had become a thriving commercial center. The town was home to several businesses, including a tannery, a blacksmith, a sawmill, and a gristmill.
In the late 1800s, Wardenville began to experience a period of decline. The town's economy was hurt by the decline of the railroad industry, and many of the businesses in town closed. The town's population also began to decline, and by the early 1900s, it had dropped to just over 200 people.
In the mid-1900s, Wardenville began to experience a period of revitalization. The town was connected to the national highway system in the 1950s, and the population began to grow again. The town also experienced a period of economic growth, as new businesses opened in town.
Geography
Wardenville is located in the northern part of Hardy County, in the eastern panhandle of West Virginia. The town is situated in the Appalachian Mountains, and is surrounded by rolling hills and forests. The town is located near the Potomac River, and is approximately 30 miles from the state capital of Charleston.
The climate in Wardenville is humid continental, with hot summers and cold winters. The average annual temperature is around 50 degrees Fahrenheit, and the average annual precipitation is around 40 inches.
Economy
The economy of Wardenville is largely based on tourism and agriculture. The town is home to several tourist attractions, including the historic Wardenville Courthouse, the Wardenville Museum, and the Wardenville Wildlife Refuge. The town is also home to several farms, which produce a variety of crops, including corn, soybeans, and hay.
The town is also home to several small businesses, including restaurants, shops, and a hardware store. The town is also home to a few manufacturing companies, which produce a variety of products, including furniture, clothing, and electronics.
Demographics
As of the 2010 census, the population of Wardenville was 498 people. The racial makeup of the town was 97.2% White, 0.6% African American, 0.2% Native American, 0.2% Asian, 0.2% from other races, and 1.8% from two or more races. The median household income in the town was $35,000, and the median family income was $41,000.
The town is home to several churches, including the Wardenville United Methodist Church, the Wardenville Baptist Church, and the Wardenville Presbyterian Church. The town is also home to a public library, a post office, and a fire department.
Common Questions
What is Per Capita Income in Wardensville?
Per Capita income in Wardensville is $22,361.
What is the Median Family Income in Wardensville?
Median Family Income in Wardensville is $45,357.
What is the Median Household income in Wardensville?
Median Household Income in Wardensville is $39,688.
What is Income or Wage Gap in Wardensville?
Income or Wage Gap in Wardensville is 46.0%.
Women in Wardensville earn 54.0 cents for every dollar earned by a man.
What is Inequality or Gini Index in Wardensville?
Inequality or Gini Index in Wardensville is 0.41.
What is the Total Population of Wardensville?
Total Population of Wardensville is 379.
What is the Total Male Population of Wardensville?
Total Male Population of Wardensville is 172.
What is the Total Female Population of Wardensville?
Total Female Population of Wardensville is 207.
What is the Ratio of Males per 100 Females in Wardensville?
There are 83.09 Males per 100 Females in Wardensville.
What is the Ratio of Females per 100 Males in Wardensville?
There are 120.35 Females per 100 Males in Wardensville.
What is the Median Population Age in Wardensville?
Median Population Age in Wardensville is 41.6 Years.
What is the Average Family Size in Wardensville
Average Family Size in Wardensville is 2.9 People.
What is the Average Household Size in Wardensville
Average Household Size in Wardensville is 2.1 People.
How Large is the Labor Force in Wardensville?
There are 162 People in the Labor Forcein in Wardensville.
What is the Percentage of People in the Labor Force in Wardensville?
49.4% of People are in the Labor Force in Wardensville.
What is the Unemployment Rate in Wardensville?
Unemployment Rate in Wardensville is 9.3%.