Brush Fork, WV Map & Demographics
Brush Fork Map
Brush Fork Overview
$23,203
PER CAPITA INCOME
$66,250
AVG FAMILY INCOME
$44,493
AVG HOUSEHOLD INCOME
53.1%
WAGE / INCOME GAP [ % ]
46.9¢/ $1
WAGE / INCOME GAP [ $ ]
0.37
INEQUALITY / GINI INDEX
1,150
TOTAL POPULATION
457
MALE POPULATION
693
FEMALE POPULATION
65.95
MALES / 100 FEMALES
151.64
FEMALES / 100 MALES
47.4
MEDIAN AGE
3.0
AVG FAMILY SIZE
2.4
AVG HOUSEHOLD SIZE
473
LABOR FORCE [ PEOPLE ]
49.2%
PERCENT IN LABOR FORCE
Income in Brush Fork
Income Overview in Brush Fork
Per Capita Income in Brush Fork is $23,203, while median incomes of families and households are $66,250 and $44,493 respectively.
| Characteristic | Number | Measure |
| Per Capita Income | 1,150 | $23,203 |
| Median Family Income | 320 | $66,250 |
| Mean Family Income | 320 | $70,036 |
| Median Household Income | 473 | $44,493 |
| Mean Household Income | 473 | $55,802 |
| Income Deficit | 320 | $0 |
| Wage / Income Gap (%) | 1,150 | 53.11% |
| Wage / Income Gap ($) | 1,150 | 46.89¢ per $1 |
| Gini / Inequality Index | 1,150 | 0.37 |
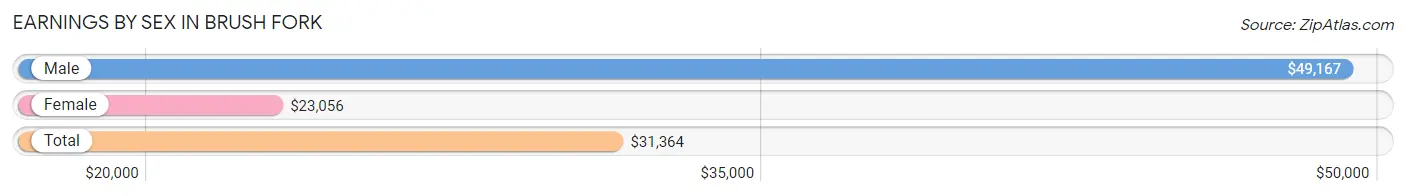
Earnings by Sex in Brush Fork
Average Earnings in Brush Fork are $31,364, $49,167 for men and $23,056 for women, a difference of 53.1%.
| Sex | Number | Average Earnings |
| Male | 192 (39.7%) | $49,167 |
| Female | 292 (60.3%) | $23,056 |
| Total | 484 (100.0%) | $31,364 |
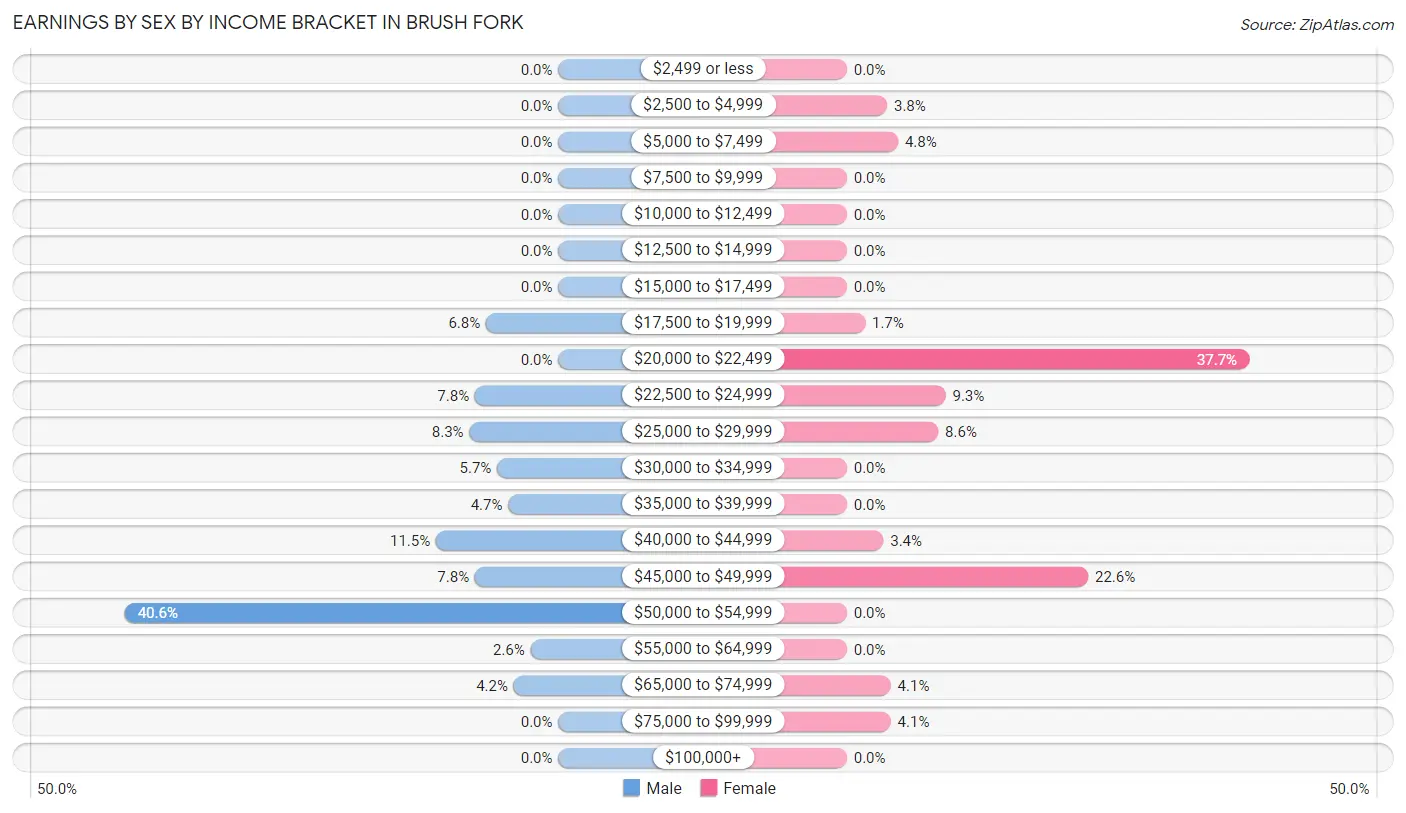
Earnings by Sex by Income Bracket in Brush Fork
The most common earnings brackets in Brush Fork are $50,000 to $54,999 for men (78 | 40.6%) and $20,000 to $22,499 for women (110 | 37.7%).
| Income | Male | Female |
| $2,499 or less | 0 (0.0%) | 0 (0.0%) |
| $2,500 to $4,999 | 0 (0.0%) | 11 (3.8%) |
| $5,000 to $7,499 | 0 (0.0%) | 14 (4.8%) |
| $7,500 to $9,999 | 0 (0.0%) | 0 (0.0%) |
| $10,000 to $12,499 | 0 (0.0%) | 0 (0.0%) |
| $12,500 to $14,999 | 0 (0.0%) | 0 (0.0%) |
| $15,000 to $17,499 | 0 (0.0%) | 0 (0.0%) |
| $17,500 to $19,999 | 13 (6.8%) | 5 (1.7%) |
| $20,000 to $22,499 | 0 (0.0%) | 110 (37.7%) |
| $22,500 to $24,999 | 15 (7.8%) | 27 (9.2%) |
| $25,000 to $29,999 | 16 (8.3%) | 25 (8.6%) |
| $30,000 to $34,999 | 11 (5.7%) | 0 (0.0%) |
| $35,000 to $39,999 | 9 (4.7%) | 0 (0.0%) |
| $40,000 to $44,999 | 22 (11.5%) | 10 (3.4%) |
| $45,000 to $49,999 | 15 (7.8%) | 66 (22.6%) |
| $50,000 to $54,999 | 78 (40.6%) | 0 (0.0%) |
| $55,000 to $64,999 | 5 (2.6%) | 0 (0.0%) |
| $65,000 to $74,999 | 8 (4.2%) | 12 (4.1%) |
| $75,000 to $99,999 | 0 (0.0%) | 12 (4.1%) |
| $100,000+ | 0 (0.0%) | 0 (0.0%) |
| Total | 192 (100.0%) | 292 (100.0%) |
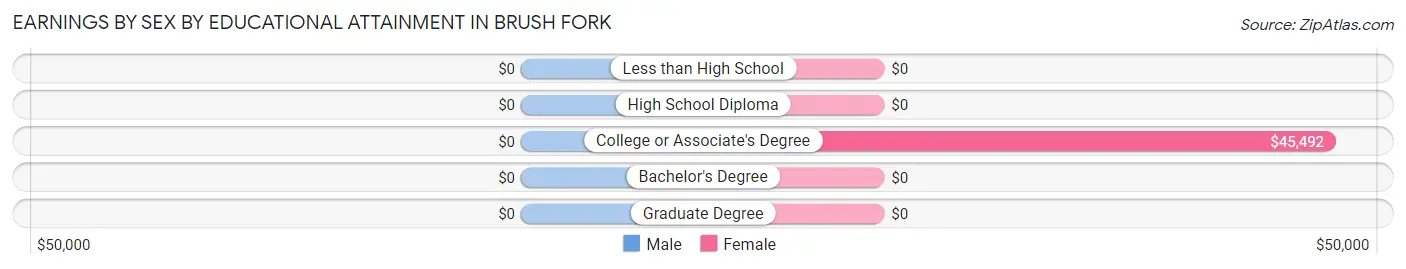
Earnings by Sex by Educational Attainment in Brush Fork
| Educational Attainment | Male Income | Female Income |
| Less than High School | - | - |
| High School Diploma | - | - |
| College or Associate's Degree | - | - |
| Bachelor's Degree | - | - |
| Graduate Degree | - | - |
| Total | $50,160 | $0 |
Family Income in Brush Fork
Family Income Brackets in Brush Fork
According to the Brush Fork family income data, there are 99 families falling into the $100,000 to $149,999 income range, which is the most common income bracket and makes up 30.9% of all families.
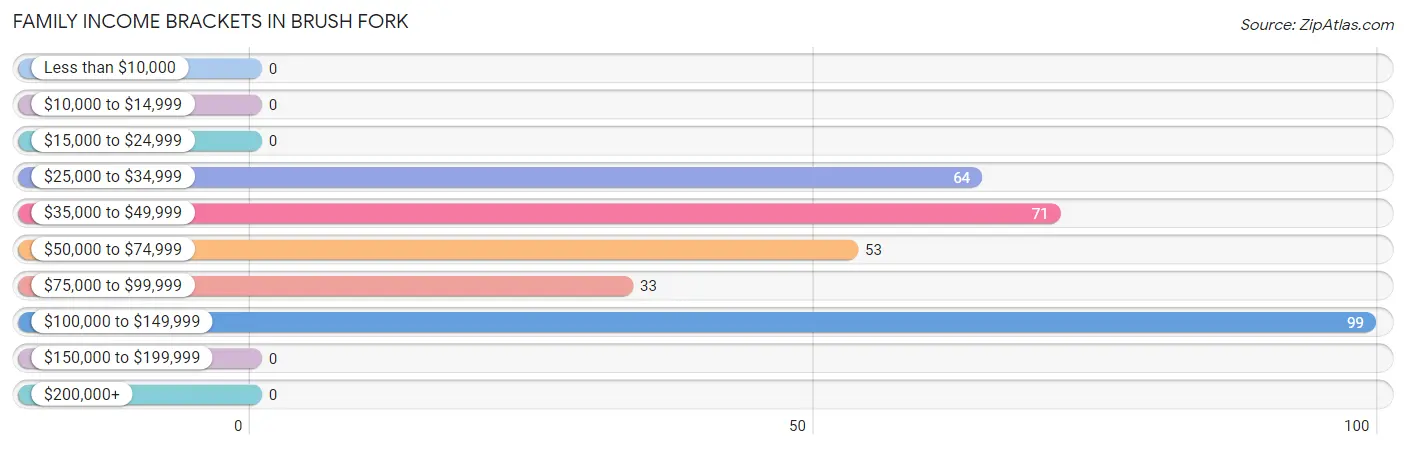
| Income Bracket | # Families | % Families |
| Less than $10,000 | 0 | 0.0% |
| $10,000 to $14,999 | 0 | 0.0% |
| $15,000 to $24,999 | 0 | 0.0% |
| $25,000 to $34,999 | 64 | 20.0% |
| $35,000 to $49,999 | 71 | 22.2% |
| $50,000 to $74,999 | 53 | 16.6% |
| $75,000 to $99,999 | 33 | 10.3% |
| $100,000 to $149,999 | 99 | 30.9% |
| $150,000 to $199,999 | 0 | 0.0% |
| $200,000+ | 0 | 0.0% |
Family Income by Famaliy Size in Brush Fork
2-person families (143 | 44.7%) account for the highest median family income in Brush Fork with $65,347 per family, while 2-person families (143 | 44.7%) have the highest median income of $32,674 per family member.
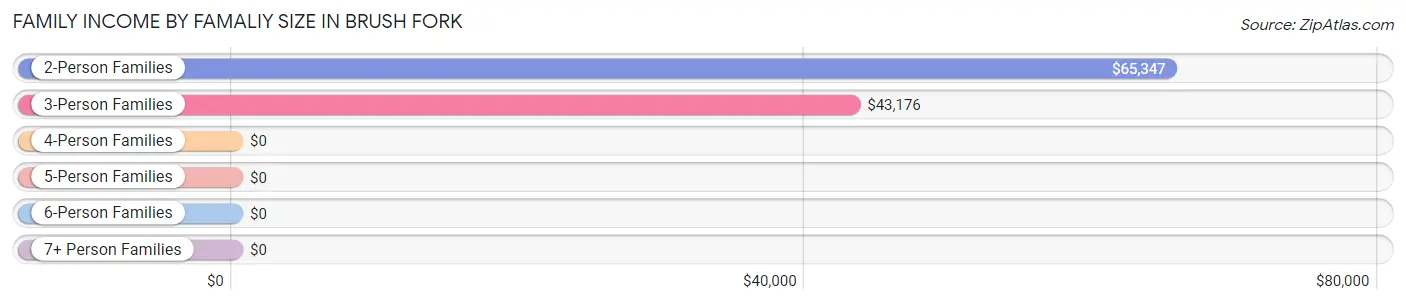
| Income Bracket | # Families | Median Income |
| 2-Person Families | 143 (44.7%) | $65,347 |
| 3-Person Families | 78 (24.4%) | $43,176 |
| 4-Person Families | 74 (23.1%) | $0 |
| 5-Person Families | 16 (5.0%) | $0 |
| 6-Person Families | 9 (2.8%) | $0 |
| 7+ Person Families | 0 (0.0%) | $0 |
| Total | 320 (100.0%) | $66,250 |
Family Income by Number of Earners in Brush Fork
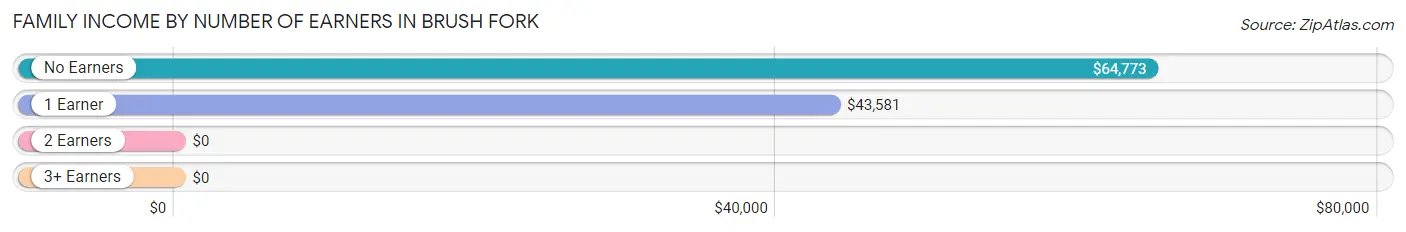
| Number of Earners | # Families | Median Income |
| No Earners | 96 (30.0%) | $64,773 |
| 1 Earner | 92 (28.7%) | $43,581 |
| 2 Earners | 57 (17.8%) | $0 |
| 3+ Earners | 75 (23.4%) | $0 |
| Total | 320 (100.0%) | $66,250 |
Household Income in Brush Fork
Household Income Brackets in Brush Fork
With 99 households falling in the category, the $100,000 to $149,999 income range is the most frequent in Brush Fork, accounting for 20.9% of all households.
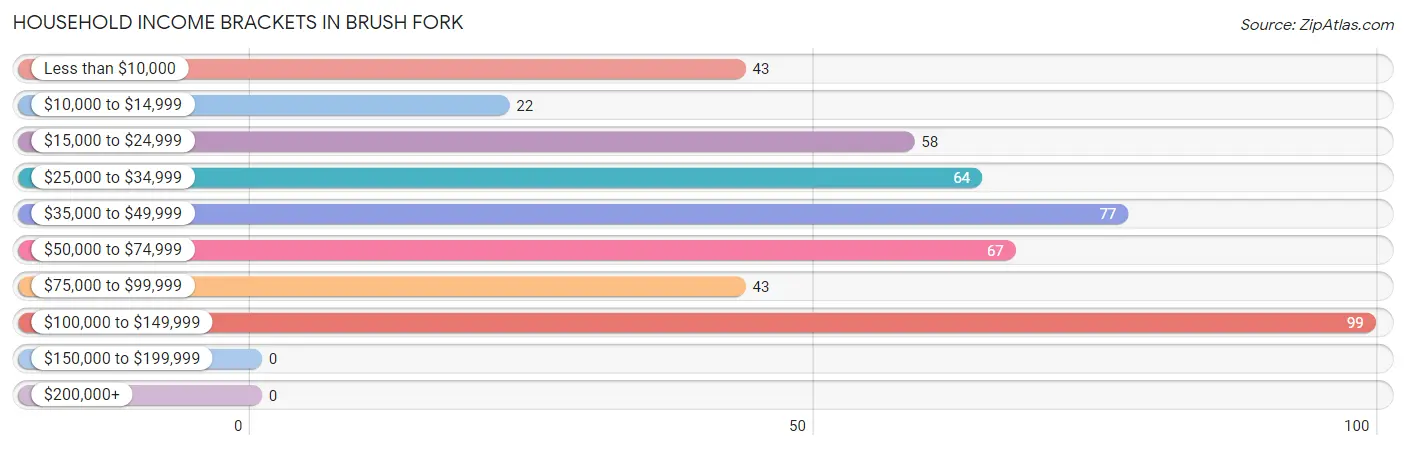
| Income Bracket | # Households | % Households |
| Less than $10,000 | 43 | 9.1% |
| $10,000 to $14,999 | 22 | 4.7% |
| $15,000 to $24,999 | 58 | 12.3% |
| $25,000 to $34,999 | 64 | 13.5% |
| $35,000 to $49,999 | 77 | 16.3% |
| $50,000 to $74,999 | 67 | 14.2% |
| $75,000 to $99,999 | 43 | 9.1% |
| $100,000 to $149,999 | 99 | 20.9% |
| $150,000 to $199,999 | 0 | 0.0% |
| $200,000+ | 0 | 0.0% |
Household Income by Householder Age in Brush Fork
The median household income in Brush Fork is $44,493, with the highest median household income of $117,955 found in the 25 to 44 years age bracket for the primary householder. A total of 108 households (22.8%) fall into this category. Meanwhile, the 15 to 24 years age bracket for the primary householder has the lowest median household income of $0, with 24 households (5.1%) in this group.
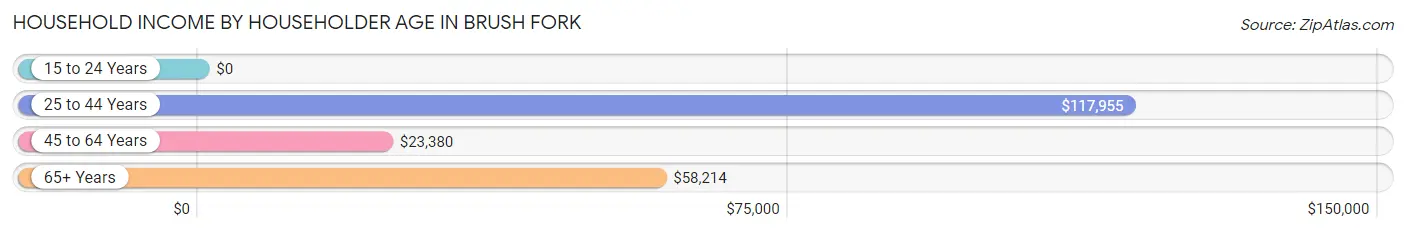
| Income Bracket | # Households | Median Income |
| 15 to 24 Years | 24 (5.1%) | $0 |
| 25 to 44 Years | 108 (22.8%) | $117,955 |
| 45 to 64 Years | 205 (43.3%) | $23,380 |
| 65+ Years | 136 (28.7%) | $58,214 |
| Total | 473 (100.0%) | $44,493 |
Poverty in Brush Fork
Income Below Poverty by Sex and Age in Brush Fork
With 8.3% poverty level for males and 17.9% for females among the residents of Brush Fork, 55 to 64 year old males and 45 to 54 year old females are the most vulnerable to poverty, with 22 males (34.9%) and 62 females (65.3%) in their respective age groups living below the poverty level.
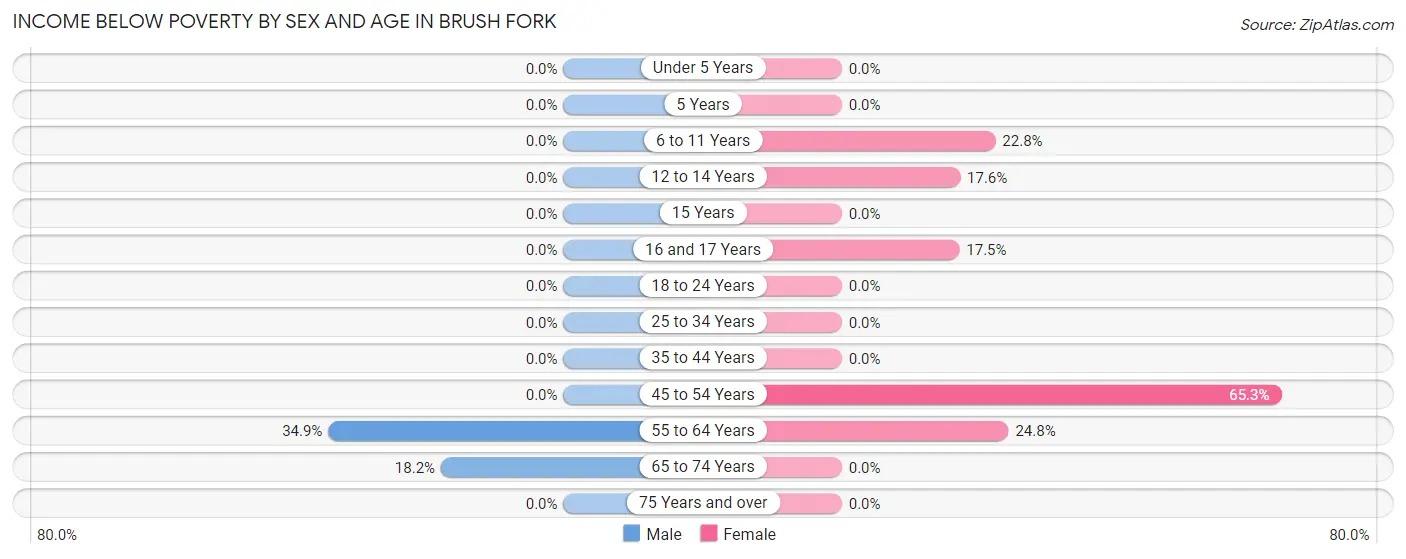
| Age Bracket | Male | Female |
| Under 5 Years | 0 (0.0%) | 0 (0.0%) |
| 5 Years | 0 (0.0%) | 0 (0.0%) |
| 6 to 11 Years | 0 (0.0%) | 13 (22.8%) |
| 12 to 14 Years | 0 (0.0%) | 13 (17.6%) |
| 15 Years | 0 (0.0%) | 0 (0.0%) |
| 16 and 17 Years | 0 (0.0%) | 11 (17.5%) |
| 18 to 24 Years | 0 (0.0%) | 0 (0.0%) |
| 25 to 34 Years | 0 (0.0%) | 0 (0.0%) |
| 35 to 44 Years | 0 (0.0%) | 0 (0.0%) |
| 45 to 54 Years | 0 (0.0%) | 62 (65.3%) |
| 55 to 64 Years | 22 (34.9%) | 25 (24.7%) |
| 65 to 74 Years | 16 (18.2%) | 0 (0.0%) |
| 75 Years and over | 0 (0.0%) | 0 (0.0%) |
| Total | 38 (8.3%) | 124 (17.9%) |
Income Above Poverty by Sex and Age in Brush Fork
According to the poverty statistics in Brush Fork, males aged under 5 years and females aged 15 years are the age groups that are most secure financially, with 100.0% of males and 100.0% of females in these age groups living above the poverty line.
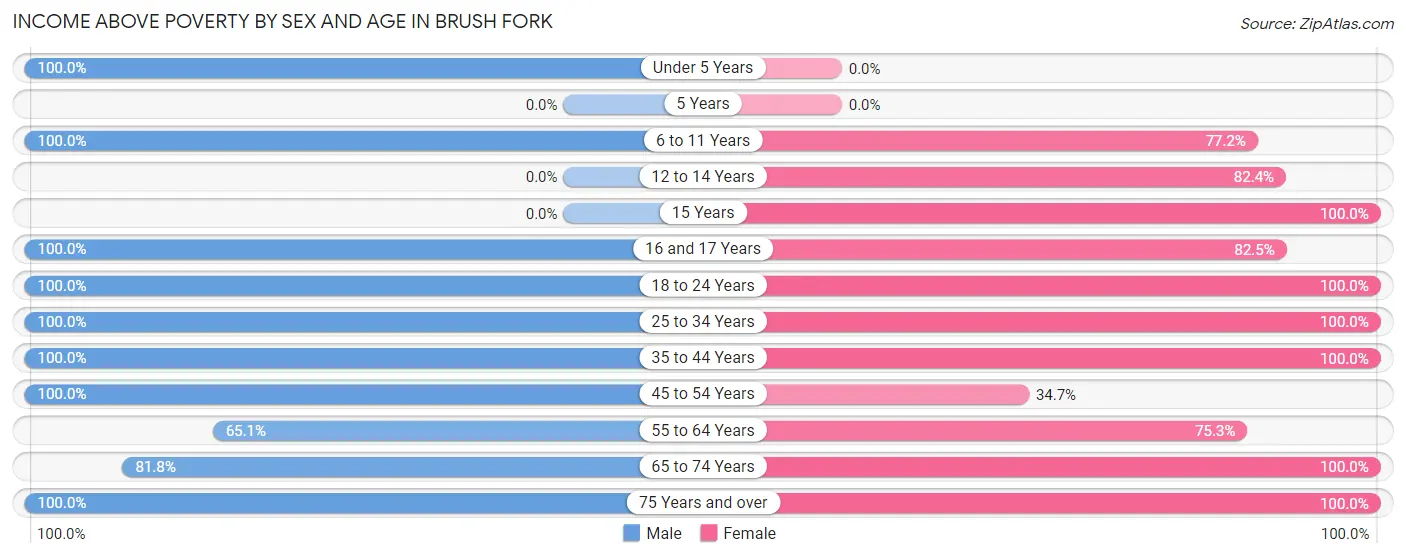
| Age Bracket | Male | Female |
| Under 5 Years | 10 (100.0%) | 0 (0.0%) |
| 5 Years | 0 (0.0%) | 0 (0.0%) |
| 6 to 11 Years | 41 (100.0%) | 44 (77.2%) |
| 12 to 14 Years | 0 (0.0%) | 61 (82.4%) |
| 15 Years | 0 (0.0%) | 7 (100.0%) |
| 16 and 17 Years | 29 (100.0%) | 52 (82.5%) |
| 18 to 24 Years | 20 (100.0%) | 24 (100.0%) |
| 25 to 34 Years | 27 (100.0%) | 99 (100.0%) |
| 35 to 44 Years | 12 (100.0%) | 76 (100.0%) |
| 45 to 54 Years | 136 (100.0%) | 33 (34.7%) |
| 55 to 64 Years | 41 (65.1%) | 76 (75.2%) |
| 65 to 74 Years | 72 (81.8%) | 84 (100.0%) |
| 75 Years and over | 31 (100.0%) | 13 (100.0%) |
| Total | 419 (91.7%) | 569 (82.1%) |
Income Below Poverty Among Married-Couple Families in Brush Fork
The poverty statistics for married-couple families in Brush Fork show that 7.7% or 16 of the total 208 families live below the poverty line. Families with 3 or 4 children have the highest poverty rate of 100.0%, comprising of 16 families. On the other hand, families with no children have the lowest poverty rate of 0.0%, which includes 0 families.
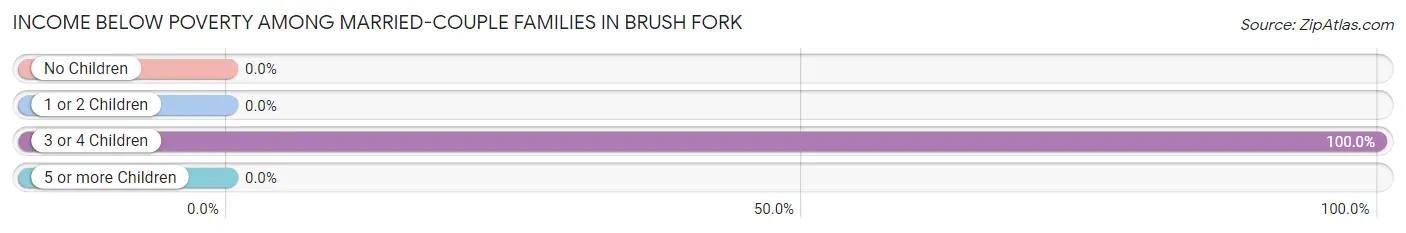
| Children | Above Poverty | Below Poverty |
| No Children | 97 (100.0%) | 0 (0.0%) |
| 1 or 2 Children | 95 (100.0%) | 0 (0.0%) |
| 3 or 4 Children | 0 (0.0%) | 16 (100.0%) |
| 5 or more Children | 0 (0.0%) | 0 (0.0%) |
| Total | 192 (92.3%) | 16 (7.7%) |
Income Below Poverty Among Single-Parent Households in Brush Fork
| Children | Single Father | Single Mother |
| No Children | 0 (0.0%) | 0 (0.0%) |
| 1 or 2 Children | 0 (0.0%) | 0 (0.0%) |
| 3 or 4 Children | 0 (0.0%) | 0 (0.0%) |
| 5 or more Children | 0 (0.0%) | 0 (0.0%) |
| Total | 0 (0.0%) | 0 (0.0%) |
Income Below Poverty Among Married-Couple vs Single-Parent Households in Brush Fork
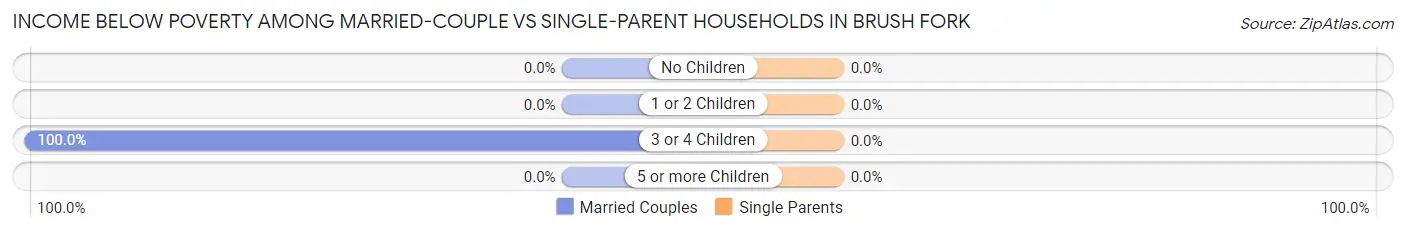
| Children | Married-Couple Families | Single-Parent Households |
| No Children | 0 (0.0%) | 0 (0.0%) |
| 1 or 2 Children | 0 (0.0%) | 0 (0.0%) |
| 3 or 4 Children | 16 (100.0%) | 0 (0.0%) |
| 5 or more Children | 0 (0.0%) | 0 (0.0%) |
| Total | 16 (7.7%) | 0 (0.0%) |
Race in Brush Fork
The most populous races in Brush Fork are White / Caucasian (1,147 | 99.7%), and Two or more Races (3 | 0.3%).
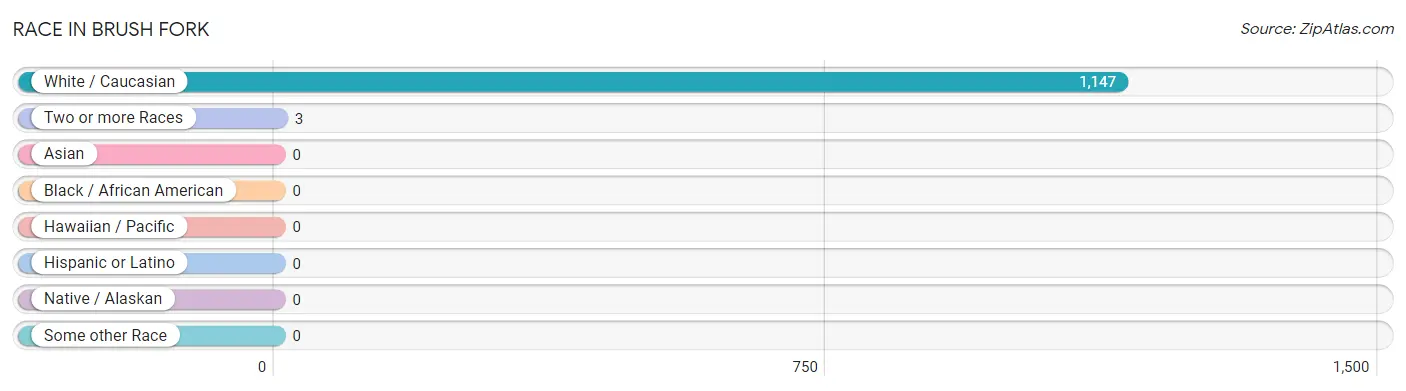
| Race | # Population | % Population |
| Asian | 0 | 0.0% |
| Black / African American | 0 | 0.0% |
| Hawaiian / Pacific | 0 | 0.0% |
| Hispanic or Latino | 0 | 0.0% |
| Native / Alaskan | 0 | 0.0% |
| White / Caucasian | 1,147 | 99.7% |
| Two or more Races | 3 | 0.3% |
| Some other Race | 0 | 0.0% |
| Total | 1,150 | 100.0% |
Ancestry in Brush Fork
The most populous ancestries reported in Brush Fork are American (354 | 30.8%), English (112 | 9.7%), Irish (57 | 5.0%), Dutch (44 | 3.8%), and French (27 | 2.4%), together accounting for 51.7% of all Brush Fork residents.
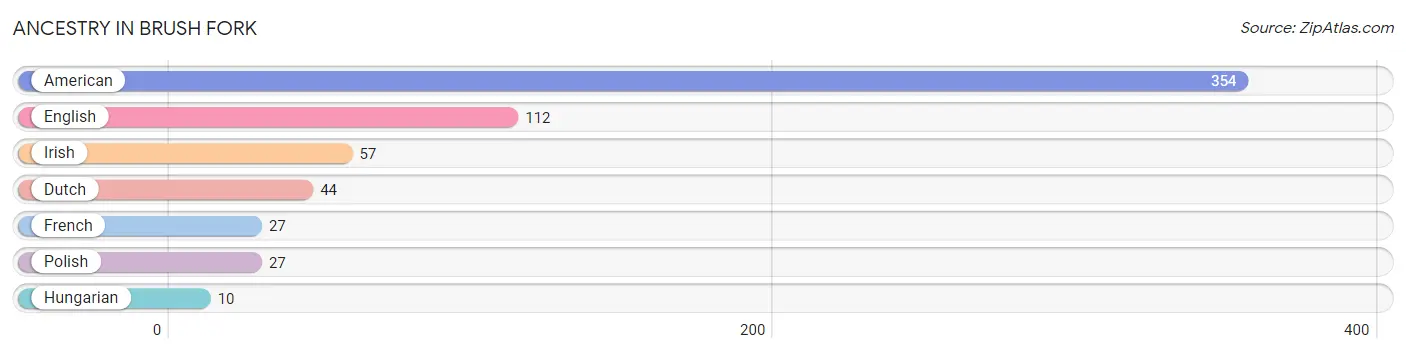
| Ancestry | # Population | % Population |
| American | 354 | 30.8% |
| Dutch | 44 | 3.8% |
| English | 112 | 9.7% |
| French | 27 | 2.4% |
| Hungarian | 10 | 0.9% |
| Irish | 57 | 5.0% |
| Polish | 27 | 2.4% | View All 7 Rows |
Immigrants in Brush Fork

| Immigration Origin | # Population | % Population | View All 0 Rows |
Sex and Age in Brush Fork
Sex and Age in Brush Fork
The most populous age groups in Brush Fork are 45 to 49 Years (89 | 19.5%) for men and 10 to 14 Years (123 | 17.7%) for women.
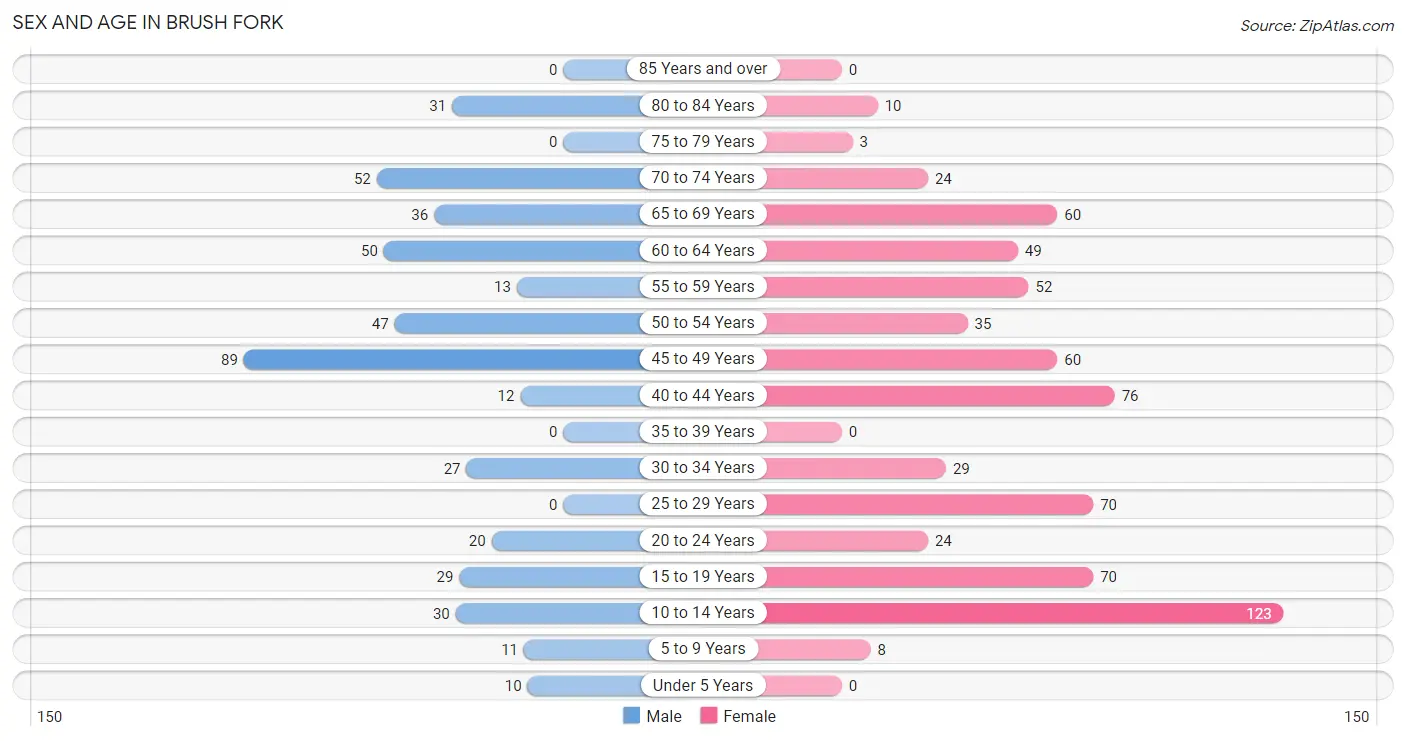
| Age Bracket | Male | Female |
| Under 5 Years | 10 (2.2%) | 0 (0.0%) |
| 5 to 9 Years | 11 (2.4%) | 8 (1.1%) |
| 10 to 14 Years | 30 (6.6%) | 123 (17.7%) |
| 15 to 19 Years | 29 (6.4%) | 70 (10.1%) |
| 20 to 24 Years | 20 (4.4%) | 24 (3.5%) |
| 25 to 29 Years | 0 (0.0%) | 70 (10.1%) |
| 30 to 34 Years | 27 (5.9%) | 29 (4.2%) |
| 35 to 39 Years | 0 (0.0%) | 0 (0.0%) |
| 40 to 44 Years | 12 (2.6%) | 76 (11.0%) |
| 45 to 49 Years | 89 (19.5%) | 60 (8.7%) |
| 50 to 54 Years | 47 (10.3%) | 35 (5.1%) |
| 55 to 59 Years | 13 (2.8%) | 52 (7.5%) |
| 60 to 64 Years | 50 (10.9%) | 49 (7.1%) |
| 65 to 69 Years | 36 (7.9%) | 60 (8.7%) |
| 70 to 74 Years | 52 (11.4%) | 24 (3.5%) |
| 75 to 79 Years | 0 (0.0%) | 3 (0.4%) |
| 80 to 84 Years | 31 (6.8%) | 10 (1.4%) |
| 85 Years and over | 0 (0.0%) | 0 (0.0%) |
| Total | 457 (100.0%) | 693 (100.0%) |
Families and Households in Brush Fork
Median Family Size in Brush Fork
The median family size in Brush Fork is 2.99 persons per family, with married-couple families (208 | 65.0%) accounting for the largest median family size of 3.13 persons per family. On the other hand, single male/father families (51 | 15.9%) represent the smallest median family size with 2.25 persons per family.
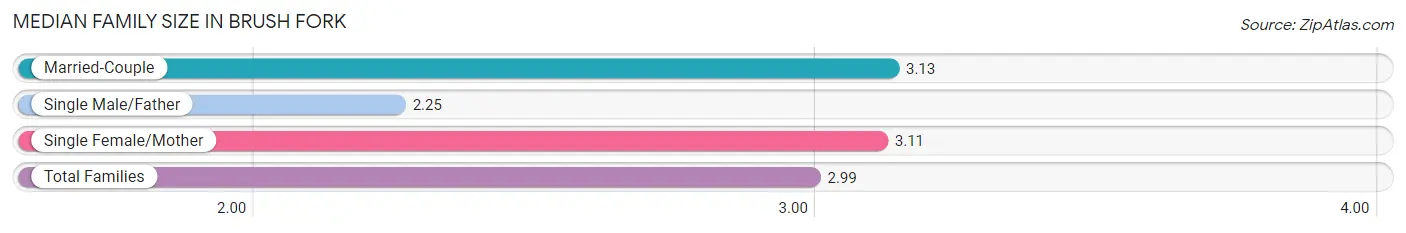
| Family Type | # Families | Family Size |
| Married-Couple | 208 (65.0%) | 3.13 |
| Single Male/Father | 51 (15.9%) | 2.25 |
| Single Female/Mother | 61 (19.1%) | 3.11 |
| Total Families | 320 (100.0%) | 2.99 |
Median Household Size in Brush Fork
The median household size in Brush Fork is 2.43 persons per household, with married-couple households (208 | 44.0%) accounting for the largest median household size of 3.13 persons per household. non-family households (153 | 32.4%) represent the smallest median household size with 1.07 persons per household.
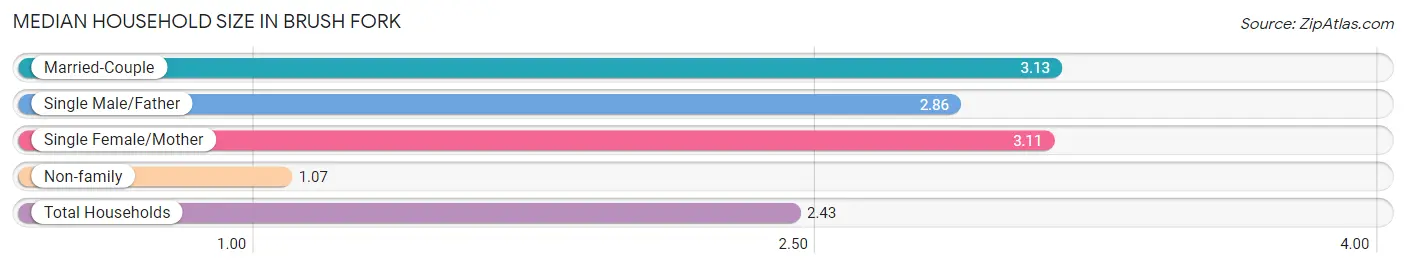
| Household Type | # Households | Household Size |
| Married-Couple | 208 (44.0%) | 3.13 |
| Single Male/Father | 51 (10.8%) | 2.86 |
| Single Female/Mother | 61 (12.9%) | 3.11 |
| Non-family | 153 (32.4%) | 1.07 |
| Total Households | 473 (100.0%) | 2.43 |
Household Size by Marriage Status in Brush Fork
Out of a total of 473 households in Brush Fork, 320 (67.6%) are family households, while 153 (32.4%) are nonfamily households. The most numerous type of family households are 2-person households, comprising 129, and the most common type of nonfamily households are 1-person households, comprising 143.
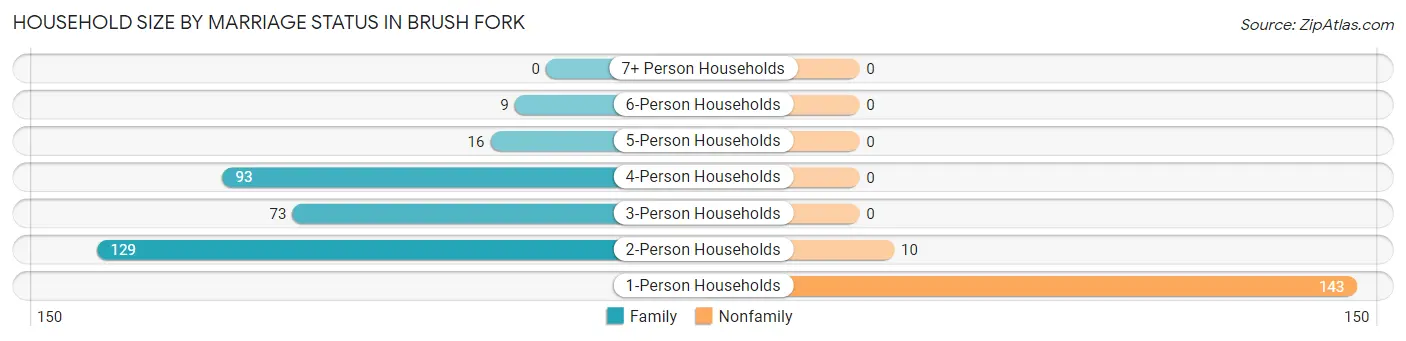
| Household Size | Family Households | Nonfamily Households |
| 1-Person Households | - | 143 (30.2%) |
| 2-Person Households | 129 (27.3%) | 10 (2.1%) |
| 3-Person Households | 73 (15.4%) | 0 (0.0%) |
| 4-Person Households | 93 (19.7%) | 0 (0.0%) |
| 5-Person Households | 16 (3.4%) | 0 (0.0%) |
| 6-Person Households | 9 (1.9%) | 0 (0.0%) |
| 7+ Person Households | 0 (0.0%) | 0 (0.0%) |
| Total | 320 (67.6%) | 153 (32.4%) |
Female Fertility in Brush Fork
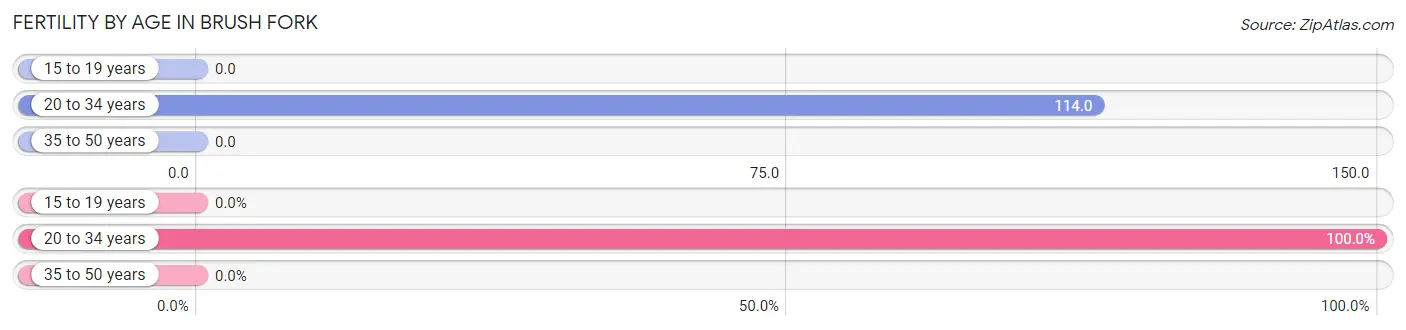
Fertility by Age in Brush Fork
Average fertility rate in Brush Fork is 43.0 births per 1,000 women. Women in the age bracket of 20 to 34 years have the highest fertility rate with 114.0 births per 1,000 women. Women in the age bracket of 20 to 34 years acount for 100.0% of all women with births.
| Age Bracket | Women with Births | Births / 1,000 Women |
| 15 to 19 years | 0 (0.0%) | 0.0 |
| 20 to 34 years | 14 (100.0%) | 114.0 |
| 35 to 50 years | 0 (0.0%) | 0.0 |
| Total | 14 (100.0%) | 43.0 |
Fertility by Age by Marriage Status in Brush Fork
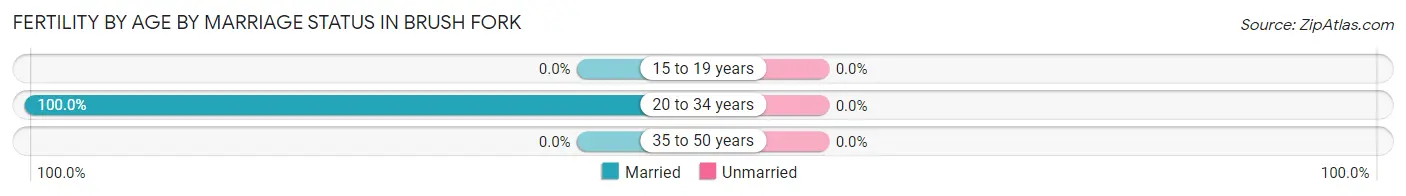
| Age Bracket | Married | Unmarried |
| 15 to 19 years | 0 (0.0%) | 0 (0.0%) |
| 20 to 34 years | 14 (100.0%) | 0 (0.0%) |
| 35 to 50 years | 0 (0.0%) | 0 (0.0%) |
| Total | 14 (100.0%) | 0 (0.0%) |
Fertility by Education in Brush Fork
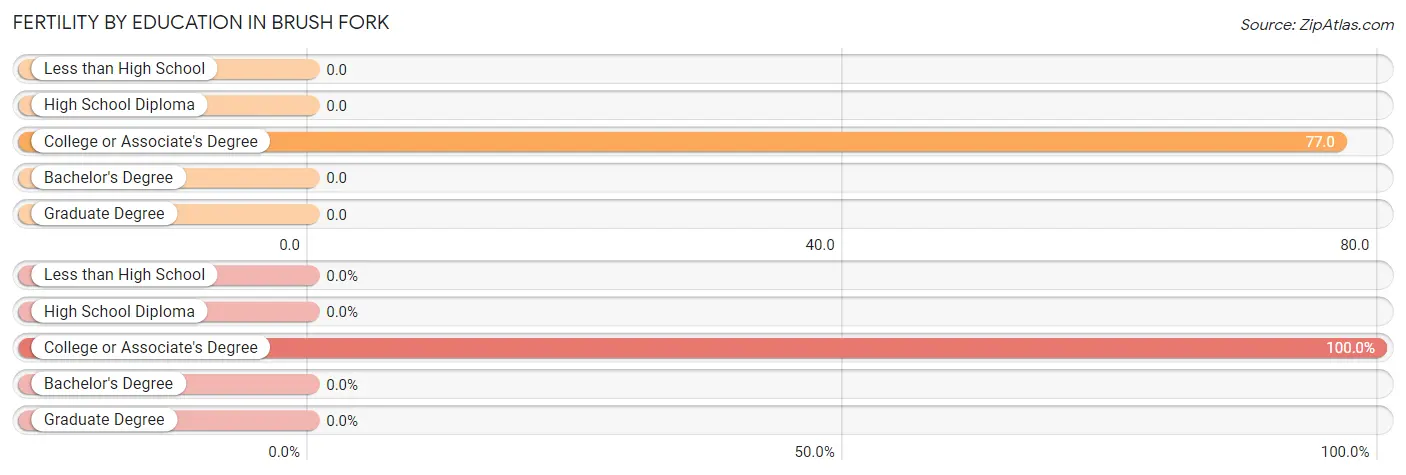
| Educational Attainment | Women with Births | Births / 1,000 Women |
| Less than High School | 0 (0.0%) | 0.0 |
| High School Diploma | 0 (0.0%) | 0.0 |
| College or Associate's Degree | 14 (100.0%) | 77.0 |
| Bachelor's Degree | 0 (0.0%) | 0.0 |
| Graduate Degree | 0 (0.0%) | 0.0 |
| Total | 14 (100.0%) | 43.0 |
Fertility by Education by Marriage Status in Brush Fork
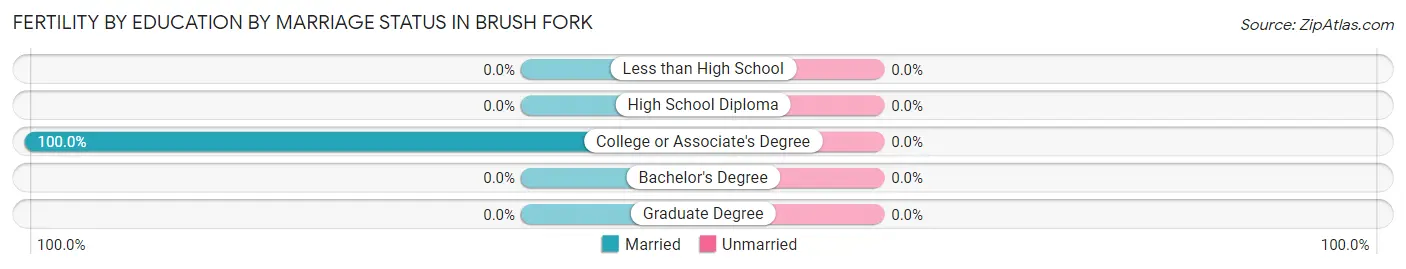
| Educational Attainment | Married | Unmarried |
| Less than High School | 0 (0.0%) | 0 (0.0%) |
| High School Diploma | 0 (0.0%) | 0 (0.0%) |
| College or Associate's Degree | 14 (100.0%) | 0 (0.0%) |
| Bachelor's Degree | 0 (0.0%) | 0 (0.0%) |
| Graduate Degree | 0 (0.0%) | 0 (0.0%) |
| Total | 14 (100.0%) | 0 (0.0%) |
Employment Characteristics in Brush Fork
Employment by Class of Employer in Brush Fork
Among the 446 employed individuals in Brush Fork, private company employees (291 | 65.2%), local government employees (96 | 21.5%), and state government employees (43 | 9.6%) make up the most common classes of employment.
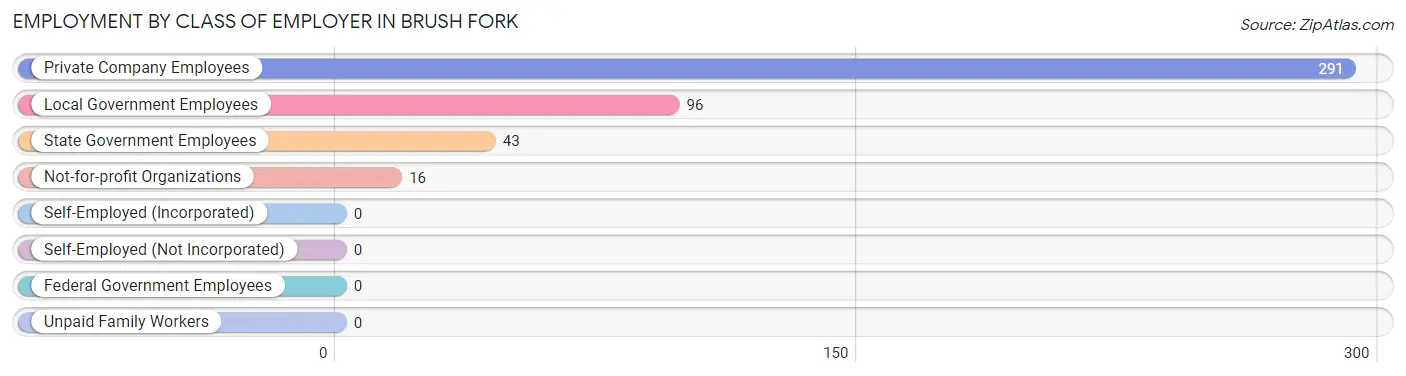
| Employer Class | # Employees | % Employees |
| Private Company Employees | 291 | 65.2% |
| Self-Employed (Incorporated) | 0 | 0.0% |
| Self-Employed (Not Incorporated) | 0 | 0.0% |
| Not-for-profit Organizations | 16 | 3.6% |
| Local Government Employees | 96 | 21.5% |
| State Government Employees | 43 | 9.6% |
| Federal Government Employees | 0 | 0.0% |
| Unpaid Family Workers | 0 | 0.0% |
| Total | 446 | 100.0% |
Employment Status by Age in Brush Fork
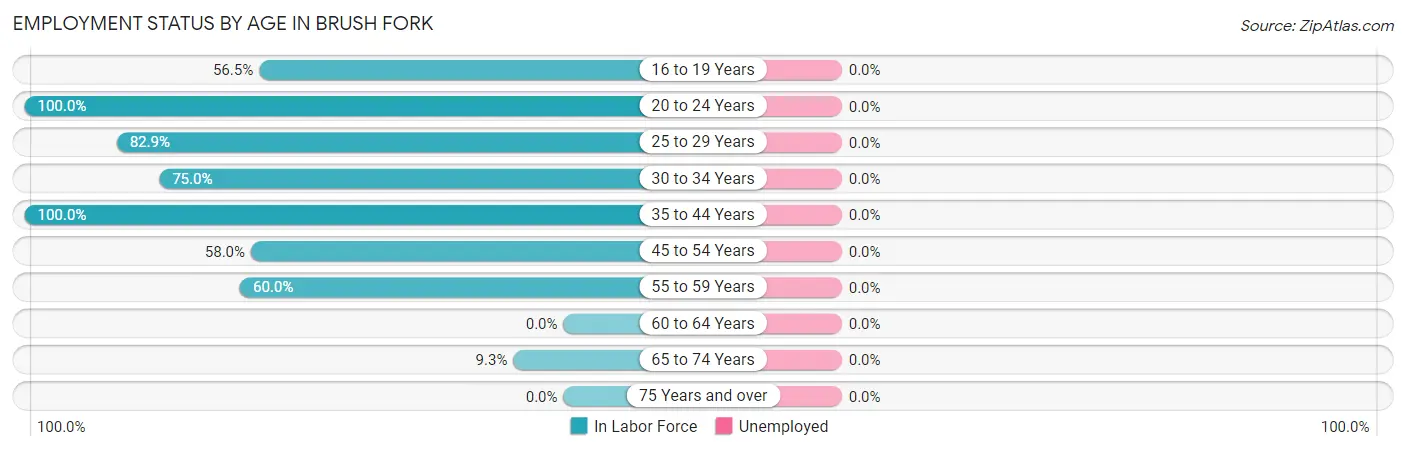
| Age Bracket | In Labor Force | Unemployed |
| 16 to 19 Years | 52 (56.5%) | 0 (0.0%) |
| 20 to 24 Years | 44 (100.0%) | 0 (0.0%) |
| 25 to 29 Years | 58 (82.9%) | 0 (0.0%) |
| 30 to 34 Years | 42 (75.0%) | 0 (0.0%) |
| 35 to 44 Years | 88 (100.0%) | 0 (0.0%) |
| 45 to 54 Years | 134 (58.0%) | 0 (0.0%) |
| 55 to 59 Years | 39 (60.0%) | 0 (0.0%) |
| 60 to 64 Years | 0 (0.0%) | 0 (0.0%) |
| 65 to 74 Years | 16 (9.3%) | 0 (0.0%) |
| 75 Years and over | 0 (0.0%) | 0 (0.0%) |
| Total | 473 (49.2%) | 0 (0.0%) |
Employment Status by Educational Attainment in Brush Fork
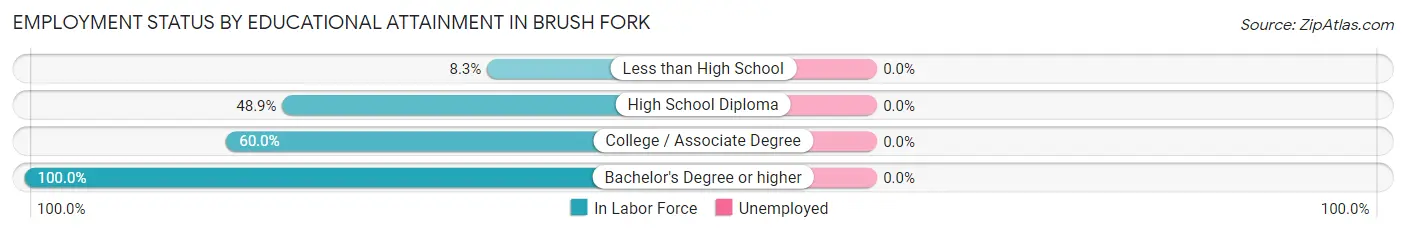
| Educational Attainment | In Labor Force | Unemployed |
| Less than High School | 5 (8.3%) | 0 (0.0%) |
| High School Diploma | 91 (48.9%) | 0 (0.0%) |
| College / Associate Degree | 147 (60.0%) | 0 (0.0%) |
| Bachelor's Degree or higher | 118 (100.0%) | 0 (0.0%) |
| Total | 361 (59.3%) | 0 (0.0%) |
Employment Occupations by Sex in Brush Fork
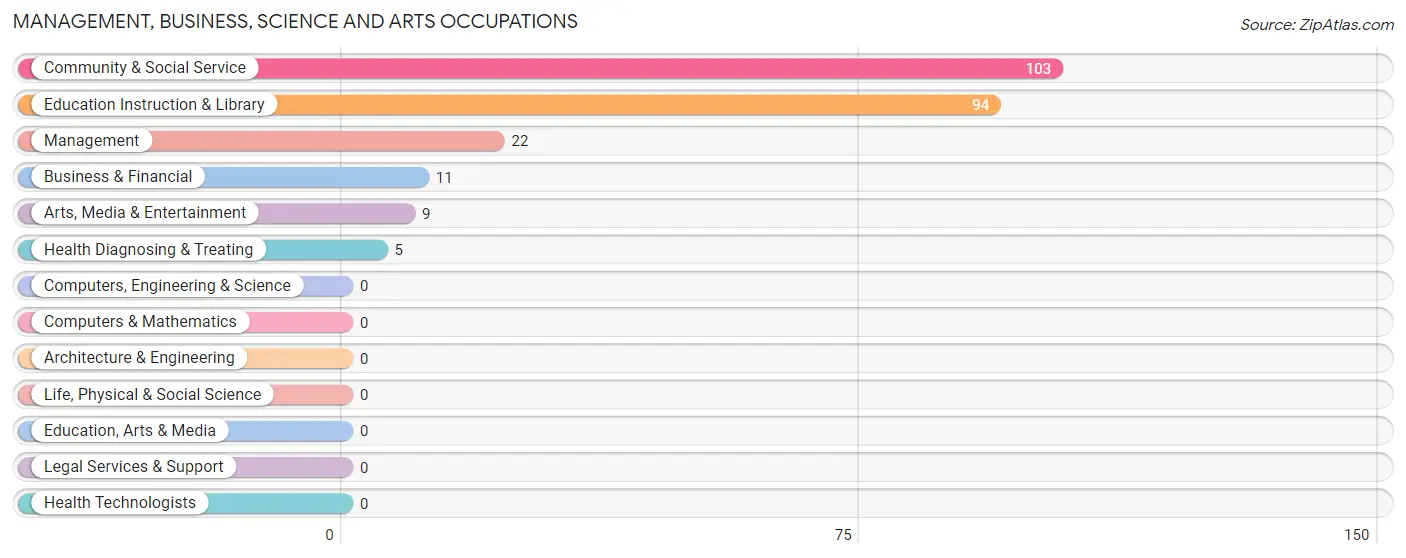
Management, Business, Science and Arts Occupations
The most common Management, Business, Science and Arts occupations in Brush Fork are Community & Social Service (103 | 21.8%), Education Instruction & Library (94 | 19.9%), Management (22 | 4.6%), Business & Financial (11 | 2.3%), and Arts, Media & Entertainment (9 | 1.9%).
Management, Business, Science and Arts Occupations by Sex
Within the Management, Business, Science and Arts occupations in Brush Fork, the most male-oriented occupations are Business & Financial (100.0%), Arts, Media & Entertainment (100.0%), and Community & Social Service (90.3%), while the most female-oriented occupations are Health Diagnosing & Treating (100.0%), Management (54.5%), and Education Instruction & Library (10.6%).
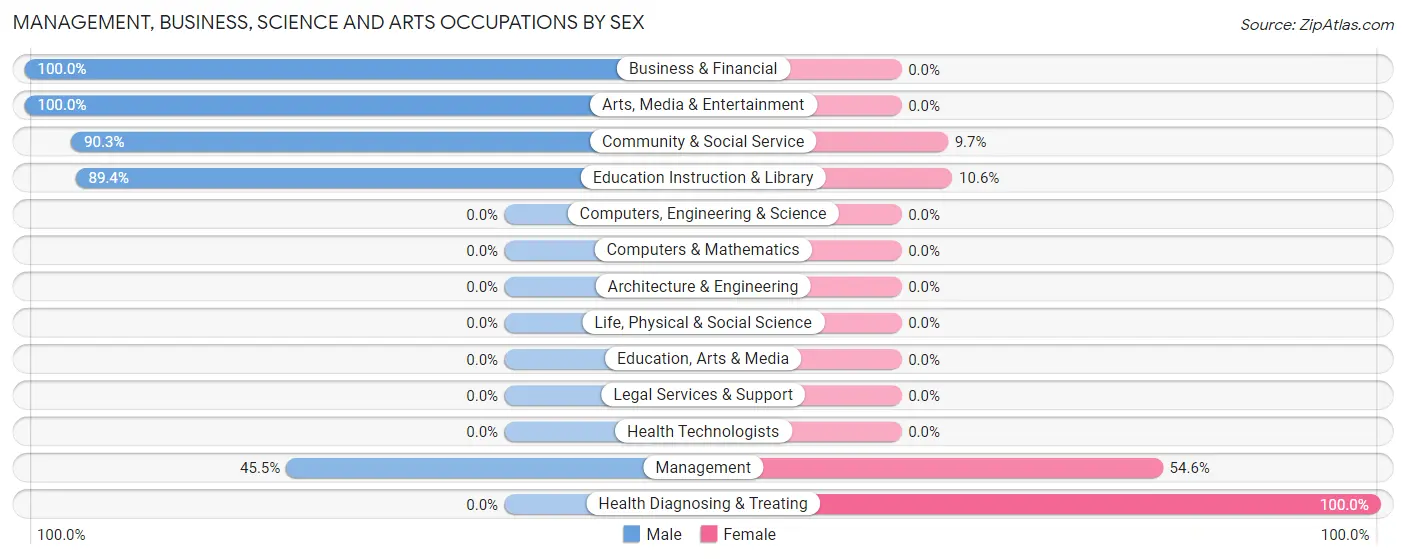
| Occupation | Male | Female |
| Management | 10 (45.5%) | 12 (54.5%) |
| Business & Financial | 11 (100.0%) | 0 (0.0%) |
| Computers, Engineering & Science | 0 (0.0%) | 0 (0.0%) |
| Computers & Mathematics | 0 (0.0%) | 0 (0.0%) |
| Architecture & Engineering | 0 (0.0%) | 0 (0.0%) |
| Life, Physical & Social Science | 0 (0.0%) | 0 (0.0%) |
| Community & Social Service | 93 (90.3%) | 10 (9.7%) |
| Education, Arts & Media | 0 (0.0%) | 0 (0.0%) |
| Legal Services & Support | 0 (0.0%) | 0 (0.0%) |
| Education Instruction & Library | 84 (89.4%) | 10 (10.6%) |
| Arts, Media & Entertainment | 9 (100.0%) | 0 (0.0%) |
| Health Diagnosing & Treating | 0 (0.0%) | 5 (100.0%) |
| Health Technologists | 0 (0.0%) | 0 (0.0%) |
| Total (Category) | 114 (80.8%) | 27 (19.2%) |
| Total (Overall) | 192 (40.6%) | 281 (59.4%) |
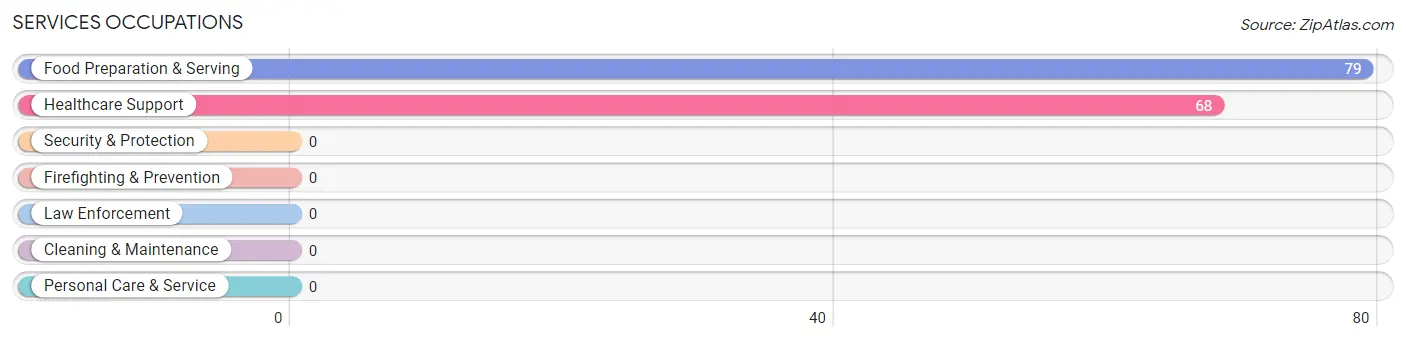
Services Occupations
The most common Services occupations in Brush Fork are Food Preparation & Serving (79 | 16.7%), and Healthcare Support (68 | 14.4%).
Services Occupations by Sex
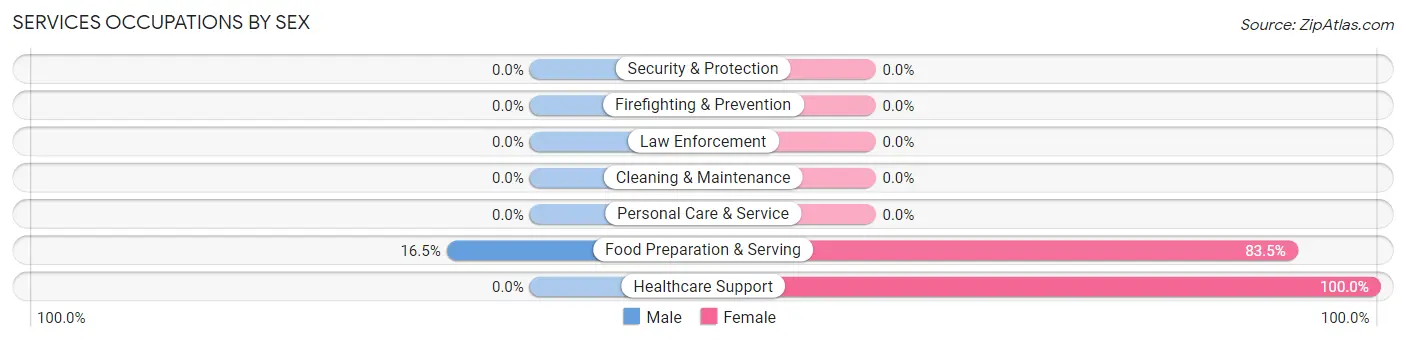
| Occupation | Male | Female |
| Healthcare Support | 0 (0.0%) | 68 (100.0%) |
| Security & Protection | 0 (0.0%) | 0 (0.0%) |
| Firefighting & Prevention | 0 (0.0%) | 0 (0.0%) |
| Law Enforcement | 0 (0.0%) | 0 (0.0%) |
| Food Preparation & Serving | 13 (16.5%) | 66 (83.5%) |
| Cleaning & Maintenance | 0 (0.0%) | 0 (0.0%) |
| Personal Care & Service | 0 (0.0%) | 0 (0.0%) |
| Total (Category) | 13 (8.8%) | 134 (91.2%) |
| Total (Overall) | 192 (40.6%) | 281 (59.4%) |
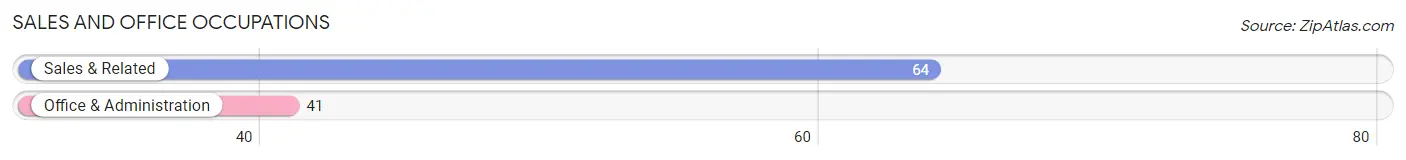
Sales and Office Occupations
The most common Sales and Office occupations in Brush Fork are Sales & Related (64 | 13.5%), and Office & Administration (41 | 8.7%).
Sales and Office Occupations by Sex
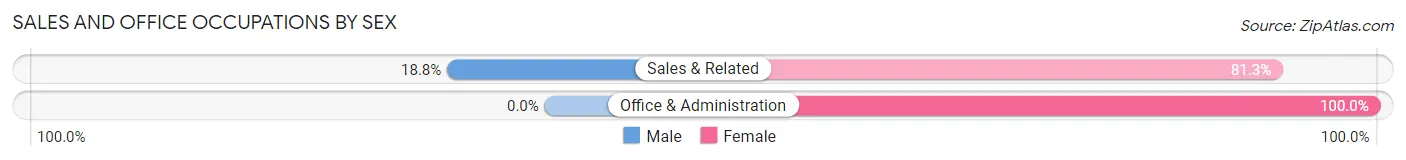
| Occupation | Male | Female |
| Sales & Related | 12 (18.8%) | 52 (81.2%) |
| Office & Administration | 0 (0.0%) | 41 (100.0%) |
| Total (Category) | 12 (11.4%) | 93 (88.6%) |
| Total (Overall) | 192 (40.6%) | 281 (59.4%) |
Natural Resources, Construction and Maintenance Occupations
Natural Resources, Construction and Maintenance Occupations by Sex
| Occupation | Male | Female |
| Farming, Fishing & Forestry | 0 (0.0%) | 0 (0.0%) |
| Construction & Extraction | 0 (0.0%) | 0 (0.0%) |
| Installation, Maintenance & Repair | 0 (0.0%) | 0 (0.0%) |
| Total (Category) | 0 (0.0%) | 0 (0.0%) |
| Total (Overall) | 192 (40.6%) | 281 (59.4%) |
Production, Transportation and Moving Occupations
The most common Production, Transportation and Moving occupations in Brush Fork are Material Moving (43 | 9.1%), Production (29 | 6.1%), and Transportation (8 | 1.7%).
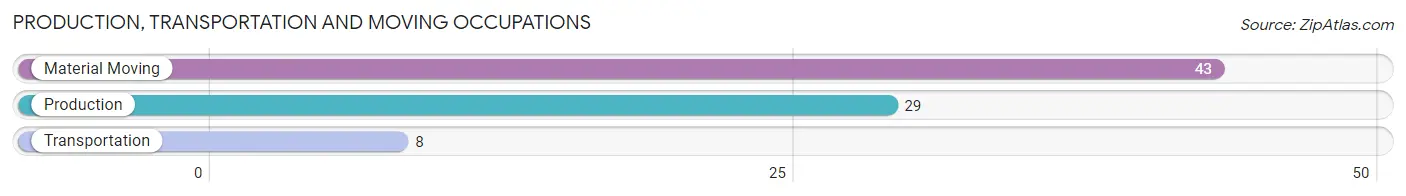
Production, Transportation and Moving Occupations by Sex
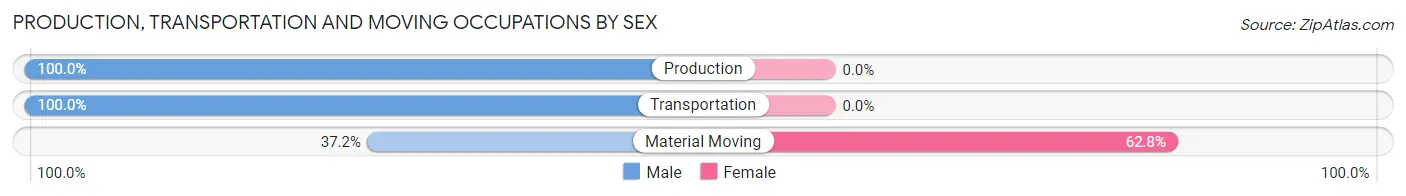
| Occupation | Male | Female |
| Production | 29 (100.0%) | 0 (0.0%) |
| Transportation | 8 (100.0%) | 0 (0.0%) |
| Material Moving | 16 (37.2%) | 27 (62.8%) |
| Total (Category) | 53 (66.2%) | 27 (33.8%) |
| Total (Overall) | 192 (40.6%) | 281 (59.4%) |
Employment Industries by Sex in Brush Fork
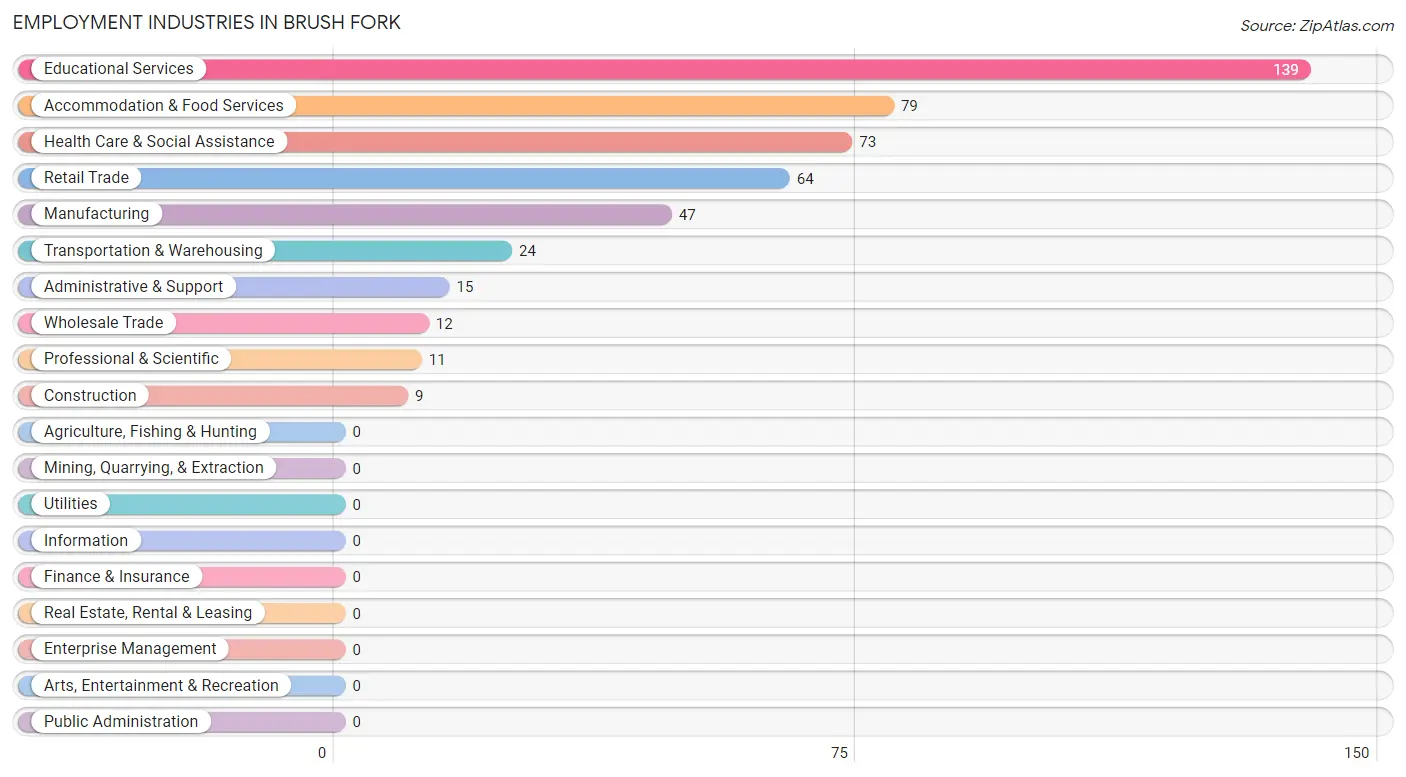
Employment Industries in Brush Fork
The major employment industries in Brush Fork include Educational Services (139 | 29.4%), Accommodation & Food Services (79 | 16.7%), Health Care & Social Assistance (73 | 15.4%), Retail Trade (64 | 13.5%), and Manufacturing (47 | 9.9%).
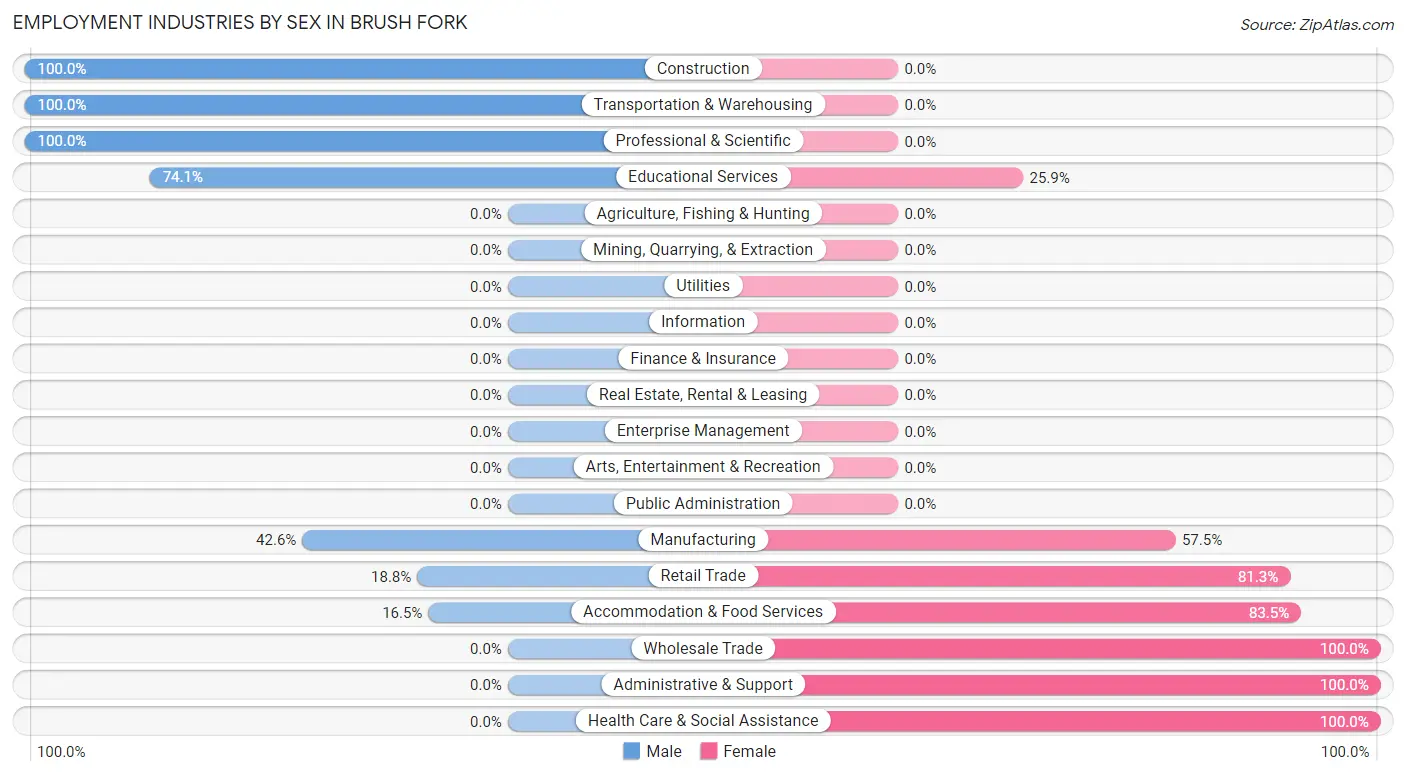
Employment Industries by Sex in Brush Fork
The Brush Fork industries that see more men than women are Construction (100.0%), Transportation & Warehousing (100.0%), and Professional & Scientific (100.0%), whereas the industries that tend to have a higher number of women are Wholesale Trade (100.0%), Administrative & Support (100.0%), and Health Care & Social Assistance (100.0%).
| Industry | Male | Female |
| Agriculture, Fishing & Hunting | 0 (0.0%) | 0 (0.0%) |
| Mining, Quarrying, & Extraction | 0 (0.0%) | 0 (0.0%) |
| Construction | 9 (100.0%) | 0 (0.0%) |
| Manufacturing | 20 (42.5%) | 27 (57.5%) |
| Wholesale Trade | 0 (0.0%) | 12 (100.0%) |
| Retail Trade | 12 (18.8%) | 52 (81.2%) |
| Transportation & Warehousing | 24 (100.0%) | 0 (0.0%) |
| Utilities | 0 (0.0%) | 0 (0.0%) |
| Information | 0 (0.0%) | 0 (0.0%) |
| Finance & Insurance | 0 (0.0%) | 0 (0.0%) |
| Real Estate, Rental & Leasing | 0 (0.0%) | 0 (0.0%) |
| Professional & Scientific | 11 (100.0%) | 0 (0.0%) |
| Enterprise Management | 0 (0.0%) | 0 (0.0%) |
| Administrative & Support | 0 (0.0%) | 15 (100.0%) |
| Educational Services | 103 (74.1%) | 36 (25.9%) |
| Health Care & Social Assistance | 0 (0.0%) | 73 (100.0%) |
| Arts, Entertainment & Recreation | 0 (0.0%) | 0 (0.0%) |
| Accommodation & Food Services | 13 (16.5%) | 66 (83.5%) |
| Public Administration | 0 (0.0%) | 0 (0.0%) |
| Total | 192 (40.6%) | 281 (59.4%) |
Education in Brush Fork
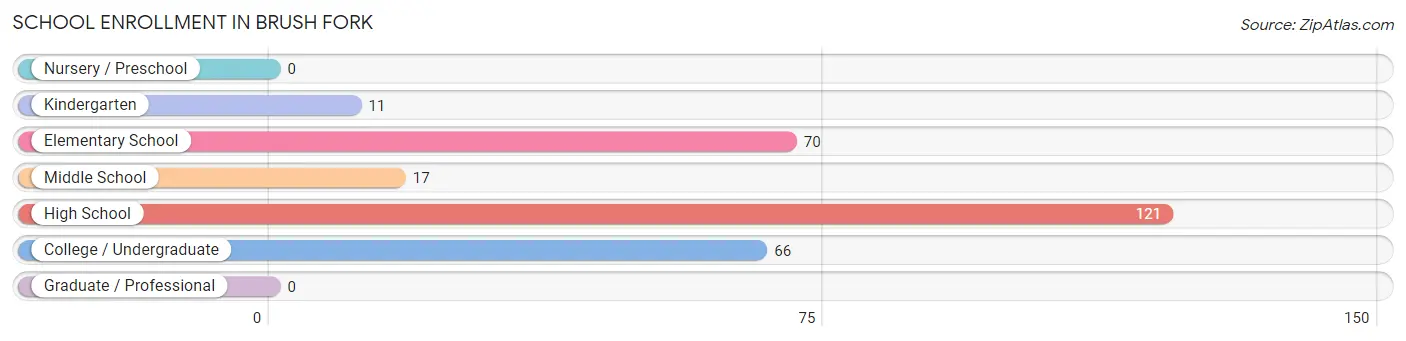
School Enrollment in Brush Fork
The most common levels of schooling among the 285 students in Brush Fork are high school (121 | 42.5%), elementary school (70 | 24.6%), and college / undergraduate (66 | 23.2%).
| School Level | # Students | % Students |
| Nursery / Preschool | 0 | 0.0% |
| Kindergarten | 11 | 3.9% |
| Elementary School | 70 | 24.6% |
| Middle School | 17 | 6.0% |
| High School | 121 | 42.5% |
| College / Undergraduate | 66 | 23.2% |
| Graduate / Professional | 0 | 0.0% |
| Total | 285 | 100.0% |
School Enrollment by Age by Funding Source in Brush Fork
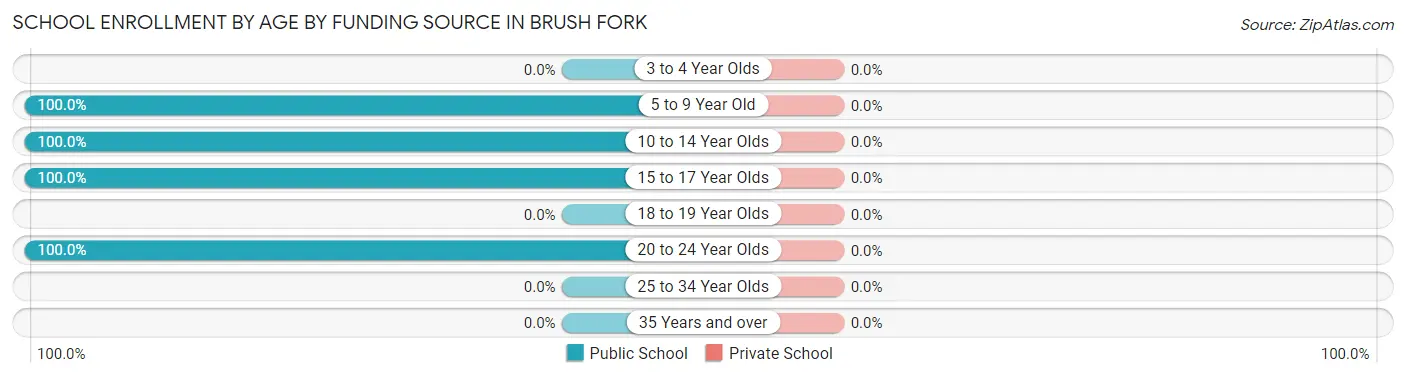
| Age Bracket | Public School | Private School |
| 3 to 4 Year Olds | 0 (0.0%) | 0 (0.0%) |
| 5 to 9 Year Old | 19 (100.0%) | 0 (0.0%) |
| 10 to 14 Year Olds | 153 (100.0%) | 0 (0.0%) |
| 15 to 17 Year Olds | 99 (100.0%) | 0 (0.0%) |
| 18 to 19 Year Olds | 0 (0.0%) | 0 (0.0%) |
| 20 to 24 Year Olds | 14 (100.0%) | 0 (0.0%) |
| 25 to 34 Year Olds | 0 (0.0%) | 0 (0.0%) |
| 35 Years and over | 0 (0.0%) | 0 (0.0%) |
| Total | 285 (100.0%) | 0 (0.0%) |
Educational Attainment by Field of Study in Brush Fork
Education (96 | 51.3%), arts & humanities (69 | 36.9%), computers & mathematics (12 | 6.4%), and physical & health sciences (10 | 5.3%) are the most common fields of study among 187 individuals in Brush Fork who have obtained a bachelor's degree or higher.
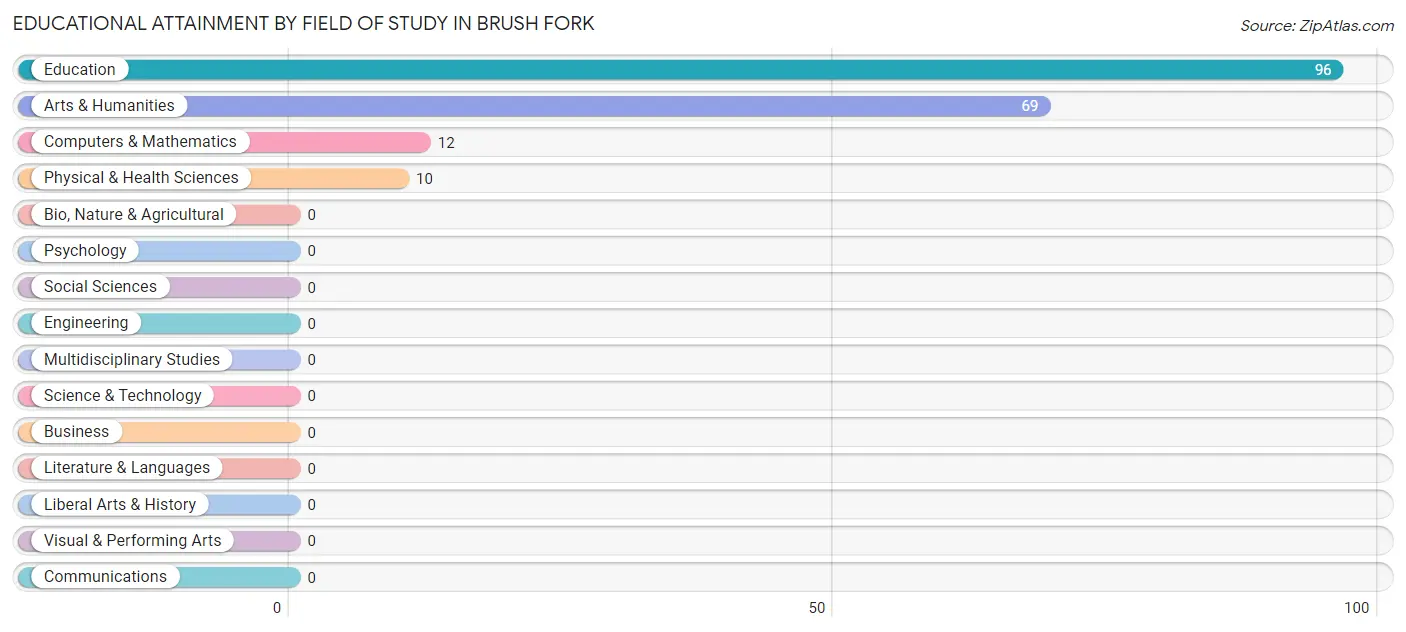
| Field of Study | # Graduates | % Graduates |
| Computers & Mathematics | 12 | 6.4% |
| Bio, Nature & Agricultural | 0 | 0.0% |
| Physical & Health Sciences | 10 | 5.3% |
| Psychology | 0 | 0.0% |
| Social Sciences | 0 | 0.0% |
| Engineering | 0 | 0.0% |
| Multidisciplinary Studies | 0 | 0.0% |
| Science & Technology | 0 | 0.0% |
| Business | 0 | 0.0% |
| Education | 96 | 51.3% |
| Literature & Languages | 0 | 0.0% |
| Liberal Arts & History | 0 | 0.0% |
| Visual & Performing Arts | 0 | 0.0% |
| Communications | 0 | 0.0% |
| Arts & Humanities | 69 | 36.9% |
| Total | 187 | 100.0% |
Transportation & Commute in Brush Fork
Vehicle Availability by Sex in Brush Fork
The most prevalent vehicle ownership categories in Brush Fork are males with 3 vehicles (85, accounting for 44.3%) and females with 3 vehicles (118, making up 33.5%).
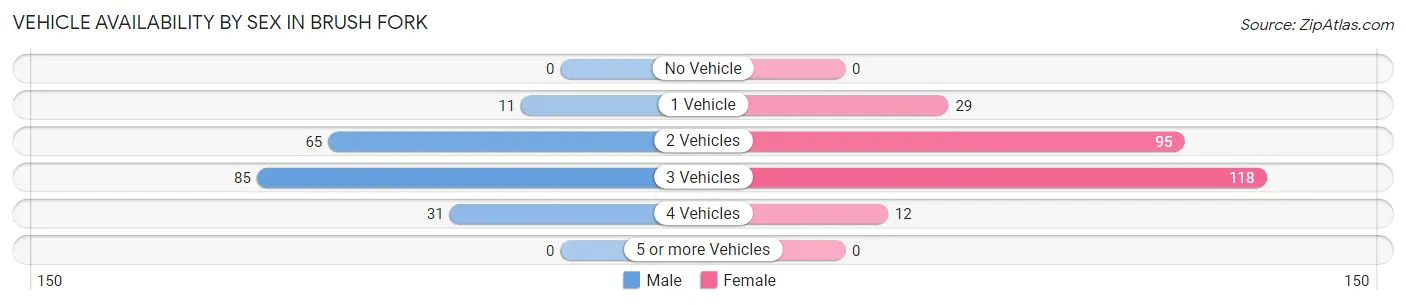
| Vehicles Available | Male | Female |
| No Vehicle | 0 (0.0%) | 0 (0.0%) |
| 1 Vehicle | 11 (5.7%) | 29 (11.4%) |
| 2 Vehicles | 65 (33.9%) | 95 (37.4%) |
| 3 Vehicles | 85 (44.3%) | 118 (46.5%) |
| 4 Vehicles | 31 (16.2%) | 12 (4.7%) |
| 5 or more Vehicles | 0 (0.0%) | 0 (0.0%) |
| Total | 192 (100.0%) | 254 (100.0%) |
Commute Time in Brush Fork
The most frequently occuring commute durations in Brush Fork are 15 to 19 minutes (170 commuters, 38.1%), 10 to 14 minutes (114 commuters, 25.6%), and 5 to 9 minutes (70 commuters, 15.7%).
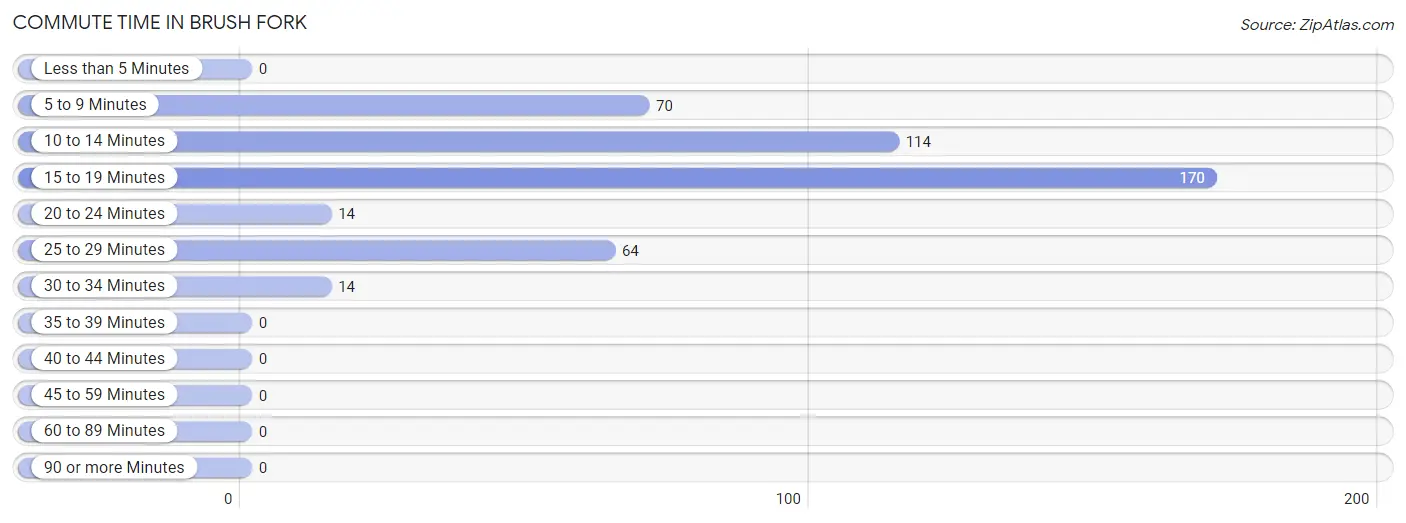
| Commute Time | # Commuters | % Commuters |
| Less than 5 Minutes | 0 | 0.0% |
| 5 to 9 Minutes | 70 | 15.7% |
| 10 to 14 Minutes | 114 | 25.6% |
| 15 to 19 Minutes | 170 | 38.1% |
| 20 to 24 Minutes | 14 | 3.1% |
| 25 to 29 Minutes | 64 | 14.3% |
| 30 to 34 Minutes | 14 | 3.1% |
| 35 to 39 Minutes | 0 | 0.0% |
| 40 to 44 Minutes | 0 | 0.0% |
| 45 to 59 Minutes | 0 | 0.0% |
| 60 to 89 Minutes | 0 | 0.0% |
| 90 or more Minutes | 0 | 0.0% |
Commute Time by Sex in Brush Fork
The most common commute times in Brush Fork are 10 to 14 minutes (84 commuters, 43.8%) for males and 15 to 19 minutes (146 commuters, 57.5%) for females.
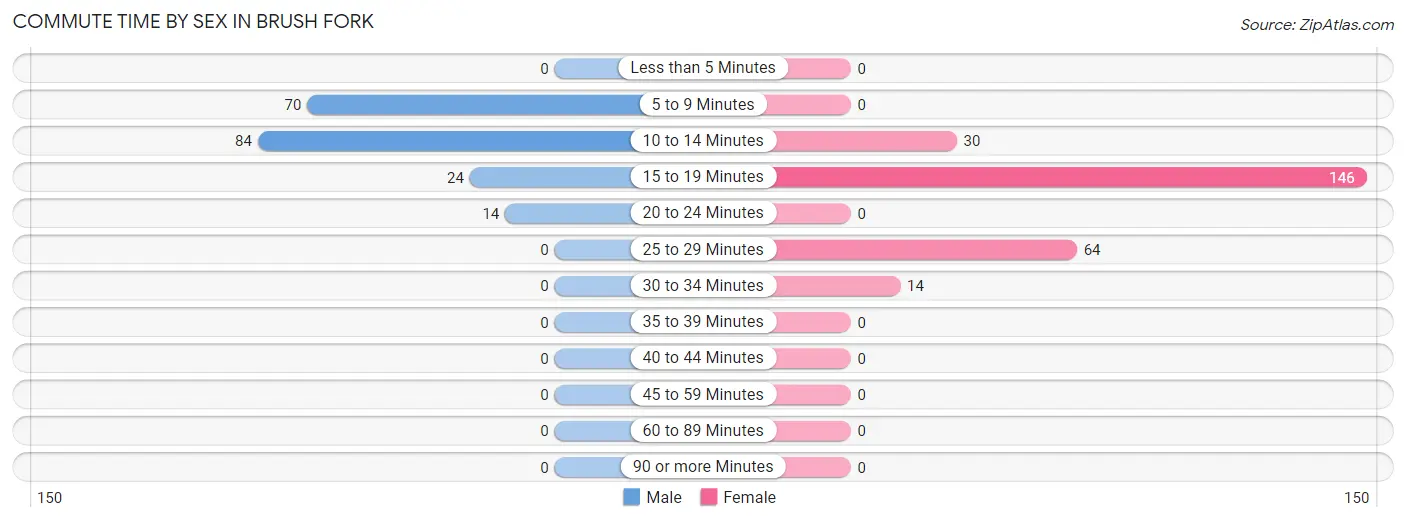
| Commute Time | Male | Female |
| Less than 5 Minutes | 0 (0.0%) | 0 (0.0%) |
| 5 to 9 Minutes | 70 (36.5%) | 0 (0.0%) |
| 10 to 14 Minutes | 84 (43.8%) | 30 (11.8%) |
| 15 to 19 Minutes | 24 (12.5%) | 146 (57.5%) |
| 20 to 24 Minutes | 14 (7.3%) | 0 (0.0%) |
| 25 to 29 Minutes | 0 (0.0%) | 64 (25.2%) |
| 30 to 34 Minutes | 0 (0.0%) | 14 (5.5%) |
| 35 to 39 Minutes | 0 (0.0%) | 0 (0.0%) |
| 40 to 44 Minutes | 0 (0.0%) | 0 (0.0%) |
| 45 to 59 Minutes | 0 (0.0%) | 0 (0.0%) |
| 60 to 89 Minutes | 0 (0.0%) | 0 (0.0%) |
| 90 or more Minutes | 0 (0.0%) | 0 (0.0%) |
Time of Departure to Work by Sex in Brush Fork
The most frequent times of departure to work in Brush Fork are 6:30 AM to 6:59 AM (77, 40.1%) for males and 7:30 AM to 7:59 AM (139, 54.7%) for females.
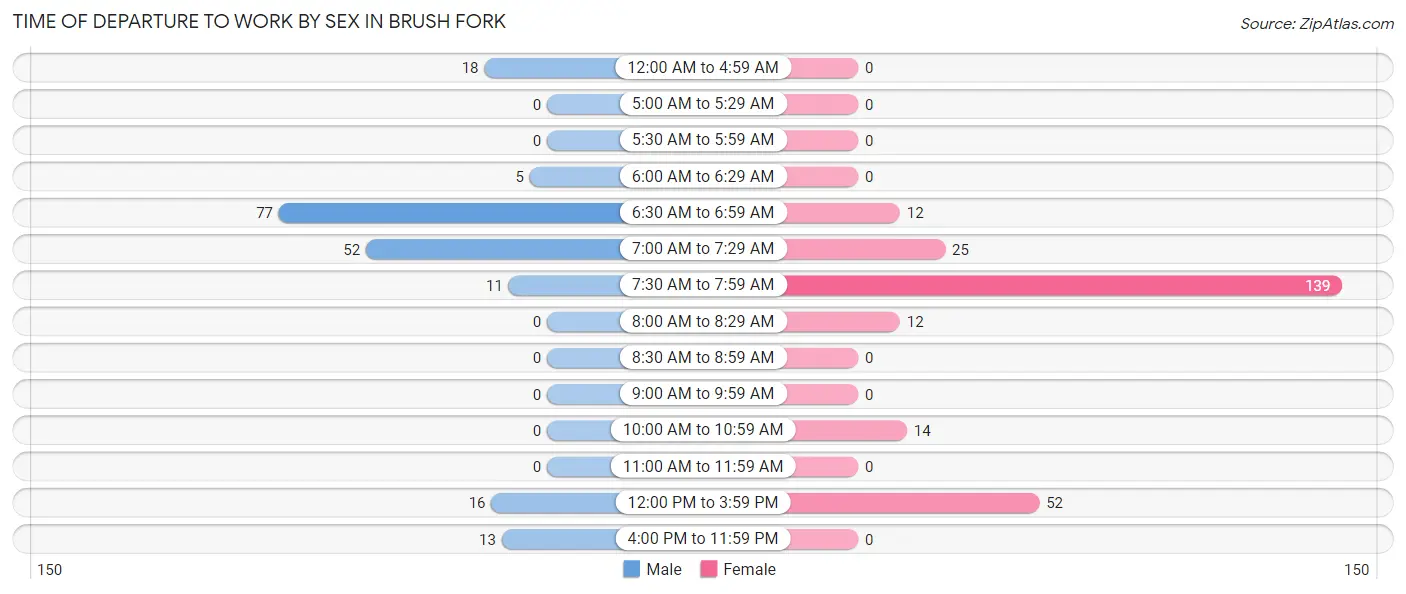
| Time of Departure | Male | Female |
| 12:00 AM to 4:59 AM | 18 (9.4%) | 0 (0.0%) |
| 5:00 AM to 5:29 AM | 0 (0.0%) | 0 (0.0%) |
| 5:30 AM to 5:59 AM | 0 (0.0%) | 0 (0.0%) |
| 6:00 AM to 6:29 AM | 5 (2.6%) | 0 (0.0%) |
| 6:30 AM to 6:59 AM | 77 (40.1%) | 12 (4.7%) |
| 7:00 AM to 7:29 AM | 52 (27.1%) | 25 (9.8%) |
| 7:30 AM to 7:59 AM | 11 (5.7%) | 139 (54.7%) |
| 8:00 AM to 8:29 AM | 0 (0.0%) | 12 (4.7%) |
| 8:30 AM to 8:59 AM | 0 (0.0%) | 0 (0.0%) |
| 9:00 AM to 9:59 AM | 0 (0.0%) | 0 (0.0%) |
| 10:00 AM to 10:59 AM | 0 (0.0%) | 14 (5.5%) |
| 11:00 AM to 11:59 AM | 0 (0.0%) | 0 (0.0%) |
| 12:00 PM to 3:59 PM | 16 (8.3%) | 52 (20.5%) |
| 4:00 PM to 11:59 PM | 13 (6.8%) | 0 (0.0%) |
| Total | 192 (100.0%) | 254 (100.0%) |
Housing Occupancy in Brush Fork
Occupancy by Ownership in Brush Fork
Of the total 473 dwellings in Brush Fork, owner-occupied units account for 422 (89.2%), while renter-occupied units make up 51 (10.8%).
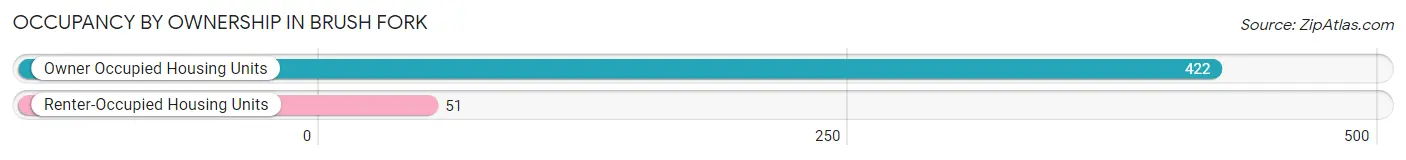
| Occupancy | # Housing Units | % Housing Units |
| Owner Occupied Housing Units | 422 | 89.2% |
| Renter-Occupied Housing Units | 51 | 10.8% |
| Total Occupied Housing Units | 473 | 100.0% |
Occupancy by Household Size in Brush Fork
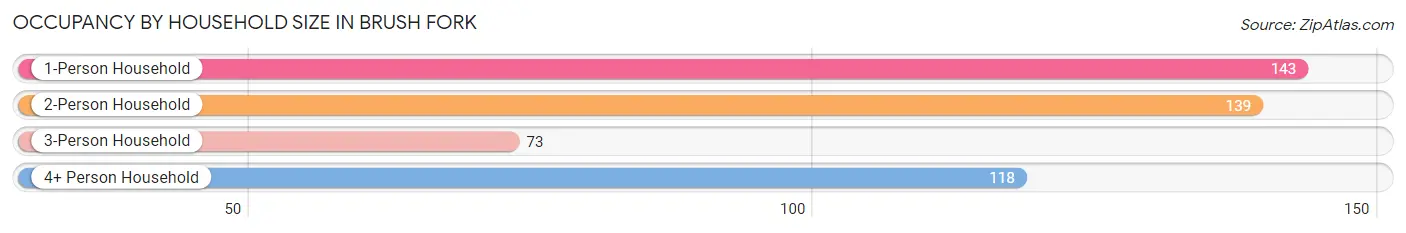
| Household Size | # Housing Units | % Housing Units |
| 1-Person Household | 143 | 30.2% |
| 2-Person Household | 139 | 29.4% |
| 3-Person Household | 73 | 15.4% |
| 4+ Person Household | 118 | 24.9% |
| Total Housing Units | 473 | 100.0% |
Occupancy by Ownership by Household Size in Brush Fork
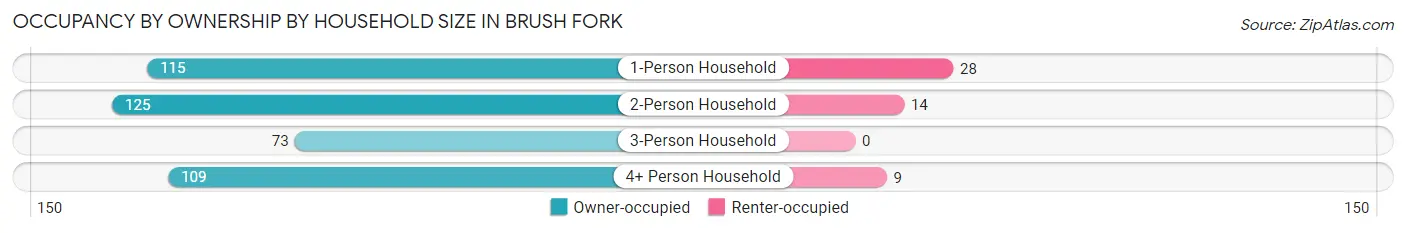
| Household Size | Owner-occupied | Renter-occupied |
| 1-Person Household | 115 (80.4%) | 28 (19.6%) |
| 2-Person Household | 125 (89.9%) | 14 (10.1%) |
| 3-Person Household | 73 (100.0%) | 0 (0.0%) |
| 4+ Person Household | 109 (92.4%) | 9 (7.6%) |
| Total Housing Units | 422 (89.2%) | 51 (10.8%) |
Occupancy by Educational Attainment in Brush Fork
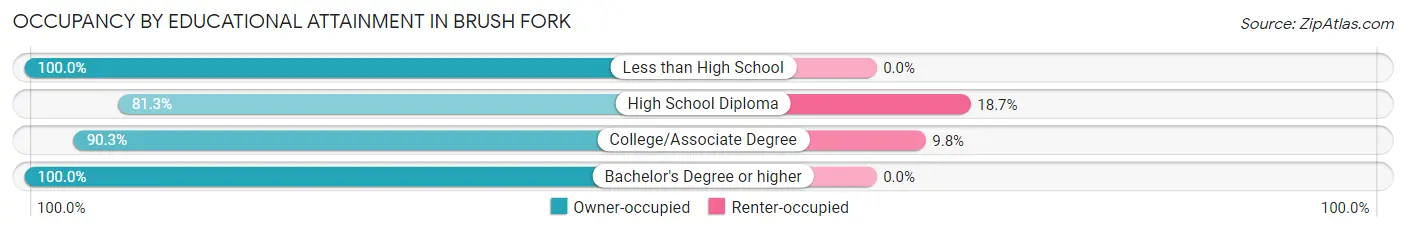
| Household Size | Owner-occupied | Renter-occupied |
| Less than High School | 65 (100.0%) | 0 (0.0%) |
| High School Diploma | 122 (81.3%) | 28 (18.7%) |
| College/Associate Degree | 213 (90.2%) | 23 (9.8%) |
| Bachelor's Degree or higher | 22 (100.0%) | 0 (0.0%) |
Occupancy by Age of Householder in Brush Fork
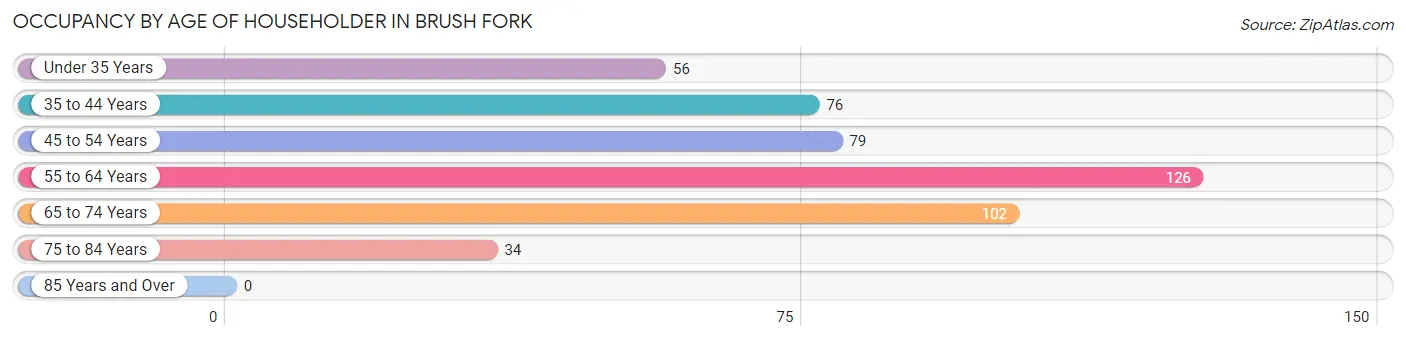
| Age Bracket | # Households | % Households |
| Under 35 Years | 56 | 11.8% |
| 35 to 44 Years | 76 | 16.1% |
| 45 to 54 Years | 79 | 16.7% |
| 55 to 64 Years | 126 | 26.6% |
| 65 to 74 Years | 102 | 21.6% |
| 75 to 84 Years | 34 | 7.2% |
| 85 Years and Over | 0 | 0.0% |
| Total | 473 | 100.0% |
Housing Finances in Brush Fork
Median Income by Occupancy in Brush Fork
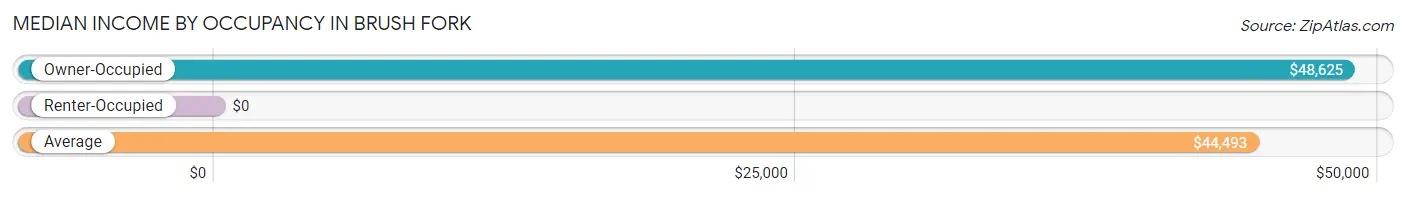
| Occupancy Type | # Households | Median Income |
| Owner-Occupied | 422 (89.2%) | $48,625 |
| Renter-Occupied | 51 (10.8%) | $0 |
| Average | 473 (100.0%) | $44,493 |
Occupancy by Householder Income Bracket in Brush Fork
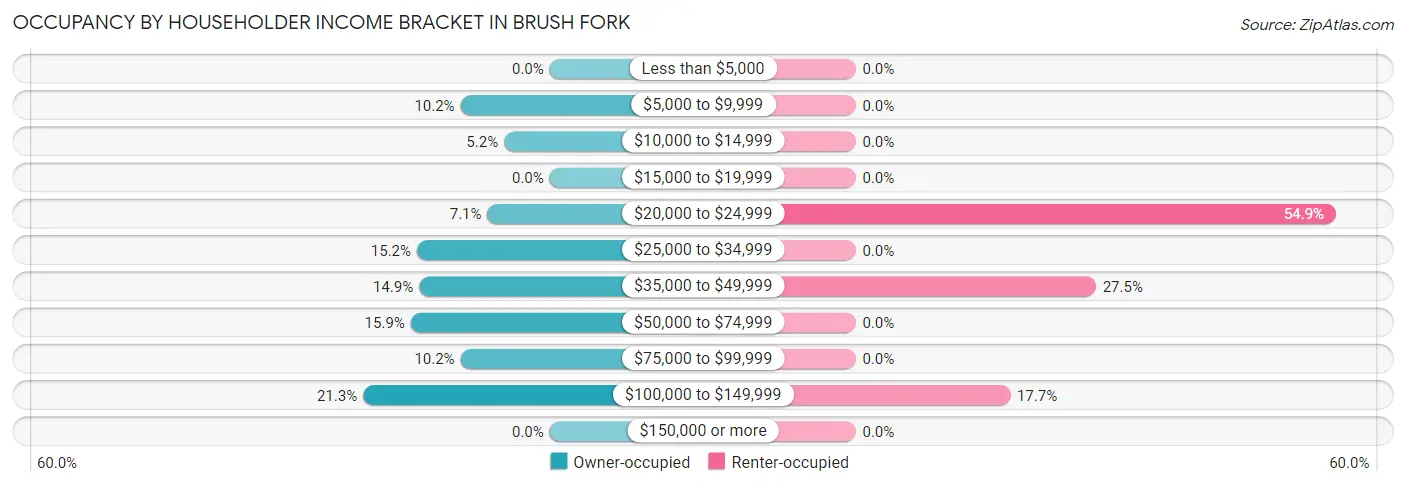
| Income Bracket | Owner-occupied | Renter-occupied |
| Less than $5,000 | 0 (0.0%) | 0 (0.0%) |
| $5,000 to $9,999 | 43 (10.2%) | 0 (0.0%) |
| $10,000 to $14,999 | 22 (5.2%) | 0 (0.0%) |
| $15,000 to $19,999 | 0 (0.0%) | 0 (0.0%) |
| $20,000 to $24,999 | 30 (7.1%) | 28 (54.9%) |
| $25,000 to $34,999 | 64 (15.2%) | 0 (0.0%) |
| $35,000 to $49,999 | 63 (14.9%) | 14 (27.5%) |
| $50,000 to $74,999 | 67 (15.9%) | 0 (0.0%) |
| $75,000 to $99,999 | 43 (10.2%) | 0 (0.0%) |
| $100,000 to $149,999 | 90 (21.3%) | 9 (17.6%) |
| $150,000 or more | 0 (0.0%) | 0 (0.0%) |
| Total | 422 (100.0%) | 51 (100.0%) |
Monthly Housing Cost Tiers in Brush Fork
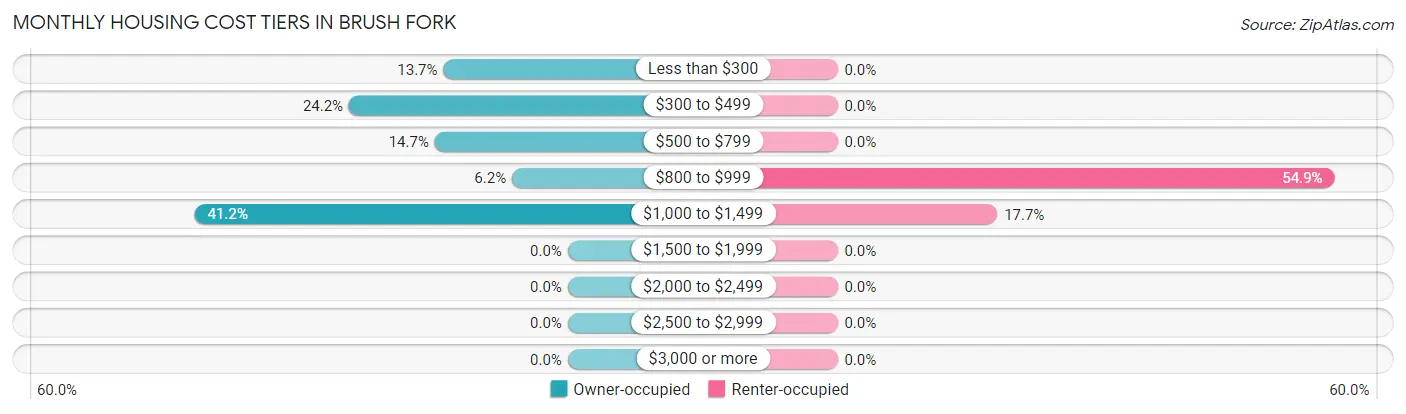
| Monthly Cost | Owner-occupied | Renter-occupied |
| Less than $300 | 58 (13.7%) | 0 (0.0%) |
| $300 to $499 | 102 (24.2%) | 0 (0.0%) |
| $500 to $799 | 62 (14.7%) | 0 (0.0%) |
| $800 to $999 | 26 (6.2%) | 28 (54.9%) |
| $1,000 to $1,499 | 174 (41.2%) | 9 (17.6%) |
| $1,500 to $1,999 | 0 (0.0%) | 0 (0.0%) |
| $2,000 to $2,499 | 0 (0.0%) | 0 (0.0%) |
| $2,500 to $2,999 | 0 (0.0%) | 0 (0.0%) |
| $3,000 or more | 0 (0.0%) | 0 (0.0%) |
| Total | 422 (100.0%) | 51 (100.0%) |
Physical Housing Characteristics in Brush Fork
Housing Structures in Brush Fork
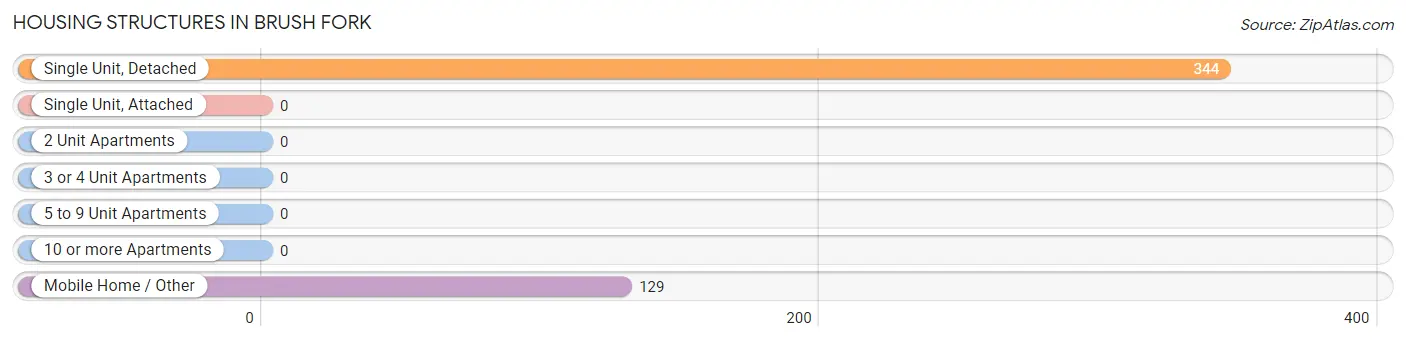
| Structure Type | # Housing Units | % Housing Units |
| Single Unit, Detached | 344 | 72.7% |
| Single Unit, Attached | 0 | 0.0% |
| 2 Unit Apartments | 0 | 0.0% |
| 3 or 4 Unit Apartments | 0 | 0.0% |
| 5 to 9 Unit Apartments | 0 | 0.0% |
| 10 or more Apartments | 0 | 0.0% |
| Mobile Home / Other | 129 | 27.3% |
| Total | 473 | 100.0% |
Housing Structures by Occupancy in Brush Fork
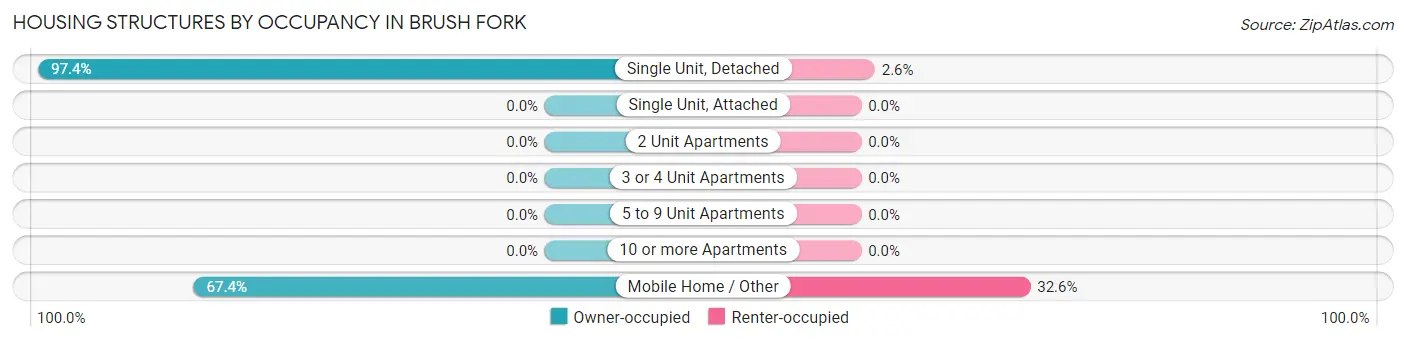
| Structure Type | Owner-occupied | Renter-occupied |
| Single Unit, Detached | 335 (97.4%) | 9 (2.6%) |
| Single Unit, Attached | 0 (0.0%) | 0 (0.0%) |
| 2 Unit Apartments | 0 (0.0%) | 0 (0.0%) |
| 3 or 4 Unit Apartments | 0 (0.0%) | 0 (0.0%) |
| 5 to 9 Unit Apartments | 0 (0.0%) | 0 (0.0%) |
| 10 or more Apartments | 0 (0.0%) | 0 (0.0%) |
| Mobile Home / Other | 87 (67.4%) | 42 (32.6%) |
| Total | 422 (89.2%) | 51 (10.8%) |
Housing Structures by Number of Rooms in Brush Fork
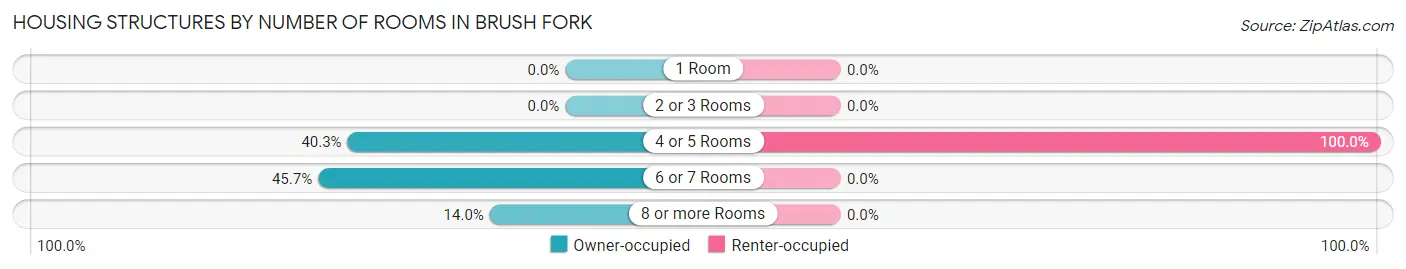
| Number of Rooms | Owner-occupied | Renter-occupied |
| 1 Room | 0 (0.0%) | 0 (0.0%) |
| 2 or 3 Rooms | 0 (0.0%) | 0 (0.0%) |
| 4 or 5 Rooms | 170 (40.3%) | 51 (100.0%) |
| 6 or 7 Rooms | 193 (45.7%) | 0 (0.0%) |
| 8 or more Rooms | 59 (14.0%) | 0 (0.0%) |
| Total | 422 (100.0%) | 51 (100.0%) |
Housing Structure by Heating Type in Brush Fork
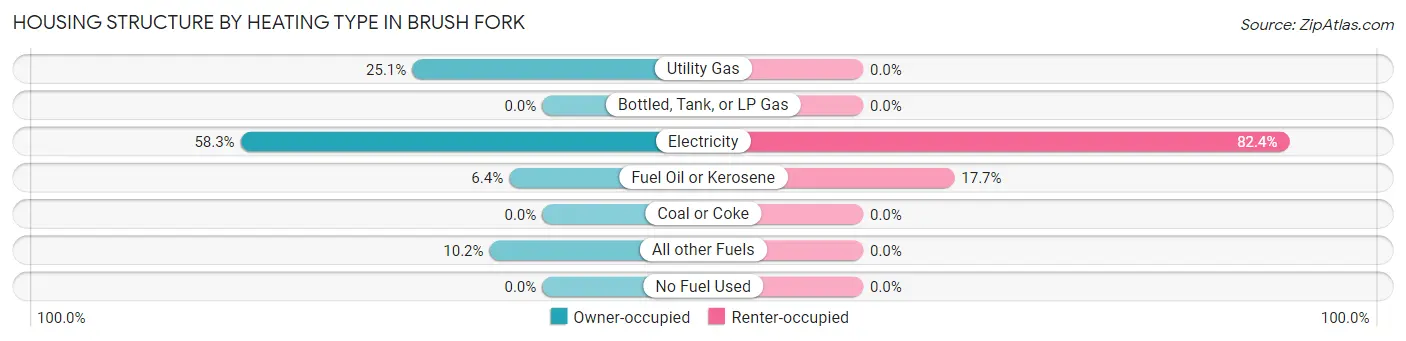
| Heating Type | Owner-occupied | Renter-occupied |
| Utility Gas | 106 (25.1%) | 0 (0.0%) |
| Bottled, Tank, or LP Gas | 0 (0.0%) | 0 (0.0%) |
| Electricity | 246 (58.3%) | 42 (82.4%) |
| Fuel Oil or Kerosene | 27 (6.4%) | 9 (17.6%) |
| Coal or Coke | 0 (0.0%) | 0 (0.0%) |
| All other Fuels | 43 (10.2%) | 0 (0.0%) |
| No Fuel Used | 0 (0.0%) | 0 (0.0%) |
| Total | 422 (100.0%) | 51 (100.0%) |
Household Vehicle Usage in Brush Fork
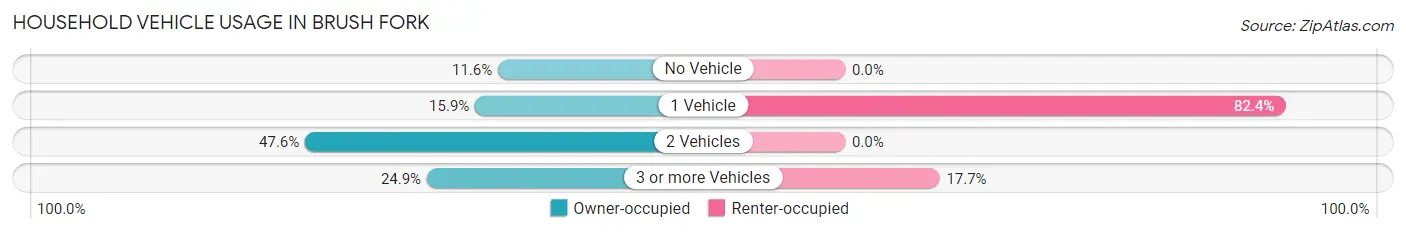
| Vehicles per Household | Owner-occupied | Renter-occupied |
| No Vehicle | 49 (11.6%) | 0 (0.0%) |
| 1 Vehicle | 67 (15.9%) | 42 (82.4%) |
| 2 Vehicles | 201 (47.6%) | 0 (0.0%) |
| 3 or more Vehicles | 105 (24.9%) | 9 (17.6%) |
| Total | 422 (100.0%) | 51 (100.0%) |
Real Estate & Mortgages in Brush Fork
Real Estate and Mortgage Overview in Brush Fork
| Characteristic | Without Mortgage | With Mortgage |
| Housing Units | 211 | 211 |
| Median Property Value | $56,200 | $69,500 |
| Median Household Income | $32,829 | $0 |
| Monthly Housing Costs | $355 | $0 |
| Real Estate Taxes | $288 | $0 |
Property Value by Mortgage Status in Brush Fork
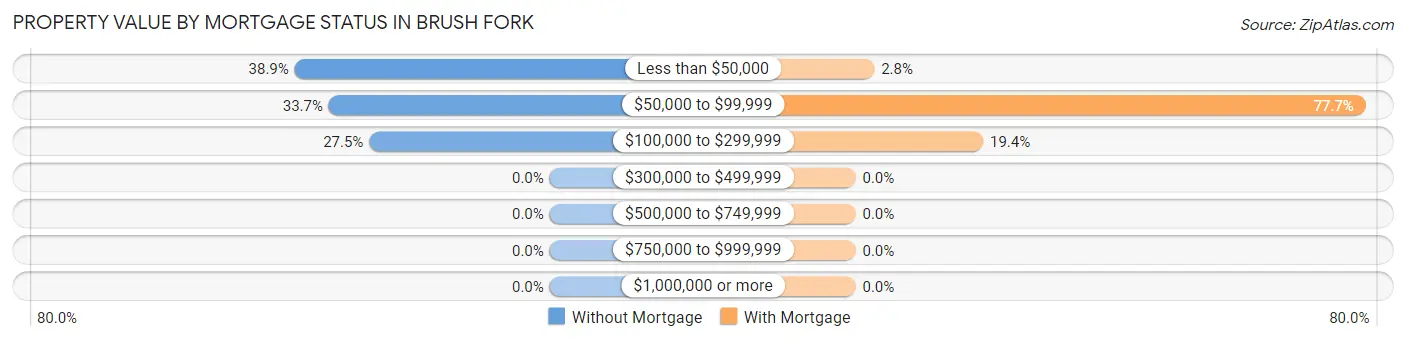
| Property Value | Without Mortgage | With Mortgage |
| Less than $50,000 | 82 (38.9%) | 6 (2.8%) |
| $50,000 to $99,999 | 71 (33.7%) | 164 (77.7%) |
| $100,000 to $299,999 | 58 (27.5%) | 41 (19.4%) |
| $300,000 to $499,999 | 0 (0.0%) | 0 (0.0%) |
| $500,000 to $749,999 | 0 (0.0%) | 0 (0.0%) |
| $750,000 to $999,999 | 0 (0.0%) | 0 (0.0%) |
| $1,000,000 or more | 0 (0.0%) | 0 (0.0%) |
| Total | 211 (100.0%) | 211 (100.0%) |
Household Income by Mortgage Status in Brush Fork
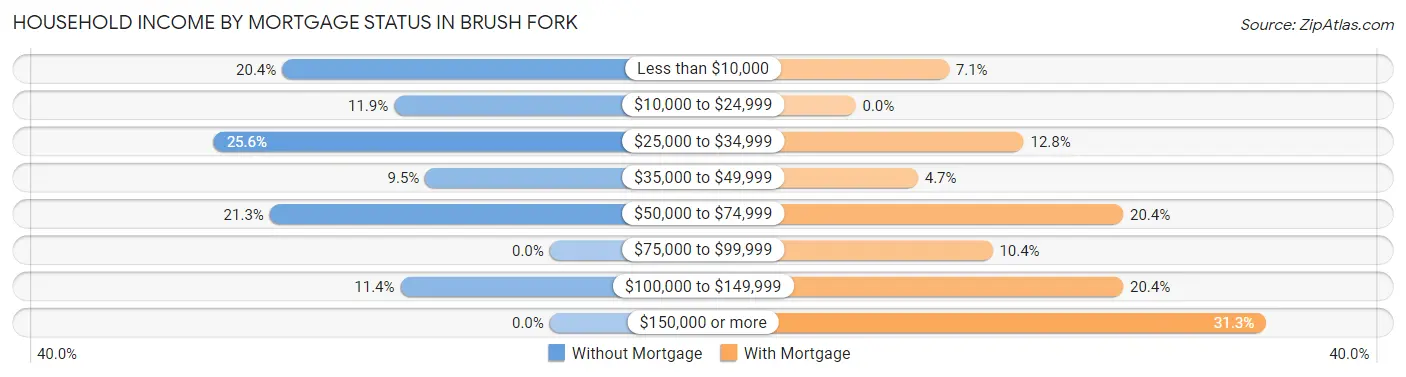
| Household Income | Without Mortgage | With Mortgage |
| Less than $10,000 | 43 (20.4%) | 15 (7.1%) |
| $10,000 to $24,999 | 25 (11.8%) | 0 (0.0%) |
| $25,000 to $34,999 | 54 (25.6%) | 27 (12.8%) |
| $35,000 to $49,999 | 20 (9.5%) | 10 (4.7%) |
| $50,000 to $74,999 | 45 (21.3%) | 43 (20.4%) |
| $75,000 to $99,999 | 0 (0.0%) | 22 (10.4%) |
| $100,000 to $149,999 | 24 (11.4%) | 43 (20.4%) |
| $150,000 or more | 0 (0.0%) | 66 (31.3%) |
| Total | 211 (100.0%) | 211 (100.0%) |
Property Value to Household Income Ratio in Brush Fork
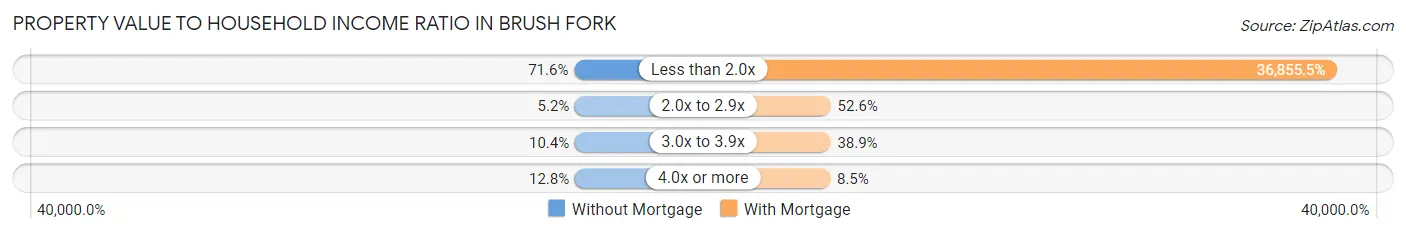
| Value-to-Income Ratio | Without Mortgage | With Mortgage |
| Less than 2.0x | 151 (71.6%) | 77,765 (36,855.5%) |
| 2.0x to 2.9x | 11 (5.2%) | 111 (52.6%) |
| 3.0x to 3.9x | 22 (10.4%) | 82 (38.9%) |
| 4.0x or more | 27 (12.8%) | 18 (8.5%) |
| Total | 211 (100.0%) | 211 (100.0%) |
Real Estate Taxes by Mortgage Status in Brush Fork
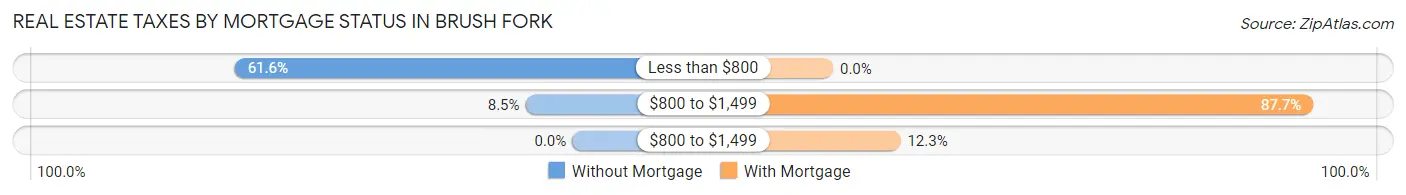
| Property Taxes | Without Mortgage | With Mortgage |
| Less than $800 | 130 (61.6%) | 0 (0.0%) |
| $800 to $1,499 | 18 (8.5%) | 185 (87.7%) |
| $800 to $1,499 | 0 (0.0%) | 26 (12.3%) |
| Total | 211 (100.0%) | 211 (100.0%) |
Health & Disability in Brush Fork
Health Insurance Coverage by Age in Brush Fork
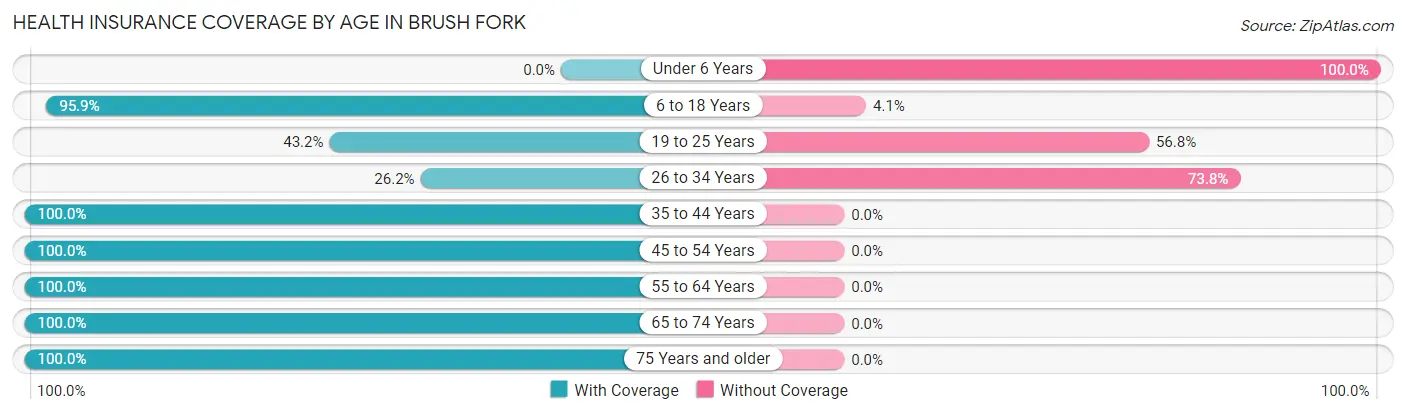
| Age Bracket | With Coverage | Without Coverage |
| Under 6 Years | 0 (0.0%) | 10 (100.0%) |
| 6 to 18 Years | 260 (95.9%) | 11 (4.1%) |
| 19 to 25 Years | 19 (43.2%) | 25 (56.8%) |
| 26 to 34 Years | 33 (26.2%) | 93 (73.8%) |
| 35 to 44 Years | 88 (100.0%) | 0 (0.0%) |
| 45 to 54 Years | 231 (100.0%) | 0 (0.0%) |
| 55 to 64 Years | 164 (100.0%) | 0 (0.0%) |
| 65 to 74 Years | 172 (100.0%) | 0 (0.0%) |
| 75 Years and older | 44 (100.0%) | 0 (0.0%) |
| Total | 1,011 (87.9%) | 139 (12.1%) |
Health Insurance Coverage by Citizenship Status in Brush Fork
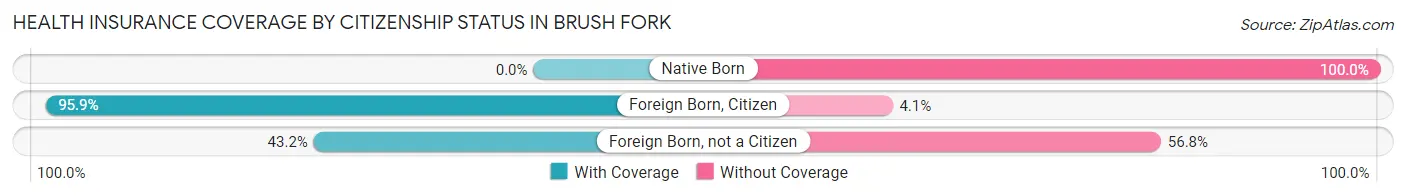
| Citizenship Status | With Coverage | Without Coverage |
| Native Born | 0 (0.0%) | 10 (100.0%) |
| Foreign Born, Citizen | 260 (95.9%) | 11 (4.1%) |
| Foreign Born, not a Citizen | 19 (43.2%) | 25 (56.8%) |
Health Insurance Coverage by Household Income in Brush Fork
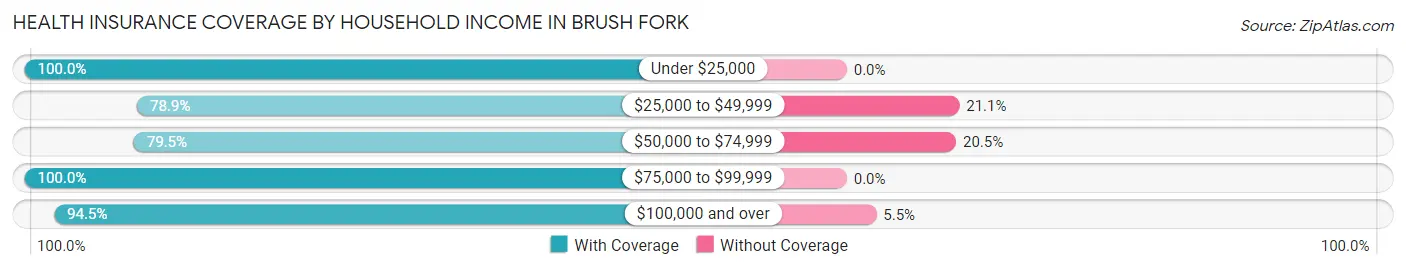
| Household Income | With Coverage | Without Coverage |
| Under $25,000 | 123 (100.0%) | 0 (0.0%) |
| $25,000 to $49,999 | 311 (78.9%) | 83 (21.1%) |
| $50,000 to $74,999 | 136 (79.5%) | 35 (20.5%) |
| $75,000 to $99,999 | 83 (100.0%) | 0 (0.0%) |
| $100,000 and over | 358 (94.5%) | 21 (5.5%) |
Public vs Private Health Insurance Coverage by Age in Brush Fork
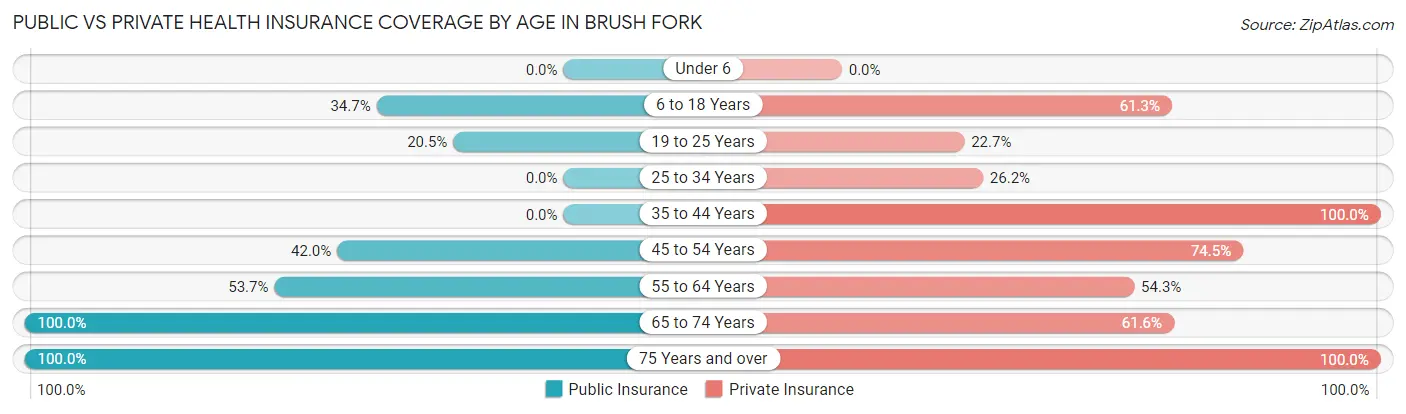
| Age Bracket | Public Insurance | Private Insurance |
| Under 6 | 0 (0.0%) | 0 (0.0%) |
| 6 to 18 Years | 94 (34.7%) | 166 (61.3%) |
| 19 to 25 Years | 9 (20.4%) | 10 (22.7%) |
| 25 to 34 Years | 0 (0.0%) | 33 (26.2%) |
| 35 to 44 Years | 0 (0.0%) | 88 (100.0%) |
| 45 to 54 Years | 97 (42.0%) | 172 (74.5%) |
| 55 to 64 Years | 88 (53.7%) | 89 (54.3%) |
| 65 to 74 Years | 172 (100.0%) | 106 (61.6%) |
| 75 Years and over | 44 (100.0%) | 44 (100.0%) |
| Total | 504 (43.8%) | 708 (61.6%) |
Disability Status by Sex by Age in Brush Fork
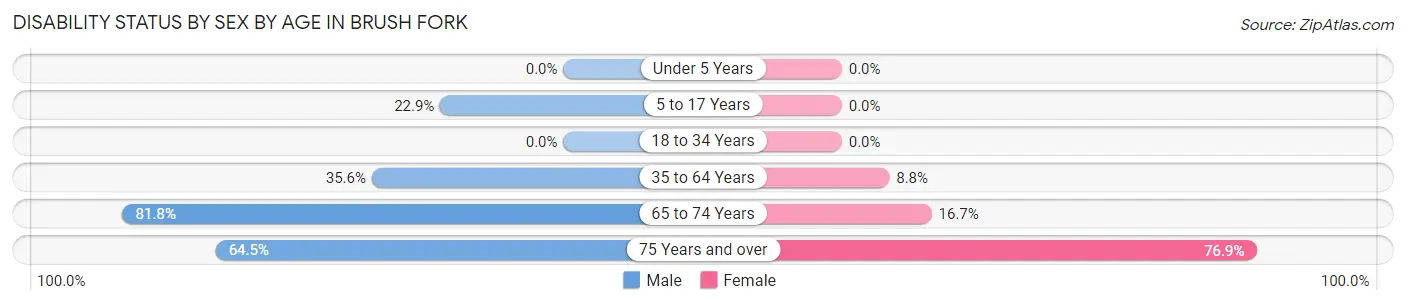
| Age Bracket | Male | Female |
| Under 5 Years | 0 (0.0%) | 0 (0.0%) |
| 5 to 17 Years | 16 (22.9%) | 0 (0.0%) |
| 18 to 34 Years | 0 (0.0%) | 0 (0.0%) |
| 35 to 64 Years | 75 (35.5%) | 24 (8.8%) |
| 65 to 74 Years | 72 (81.8%) | 14 (16.7%) |
| 75 Years and over | 20 (64.5%) | 10 (76.9%) |
Disability Class by Sex by Age in Brush Fork
Disability Class: Hearing Difficulty
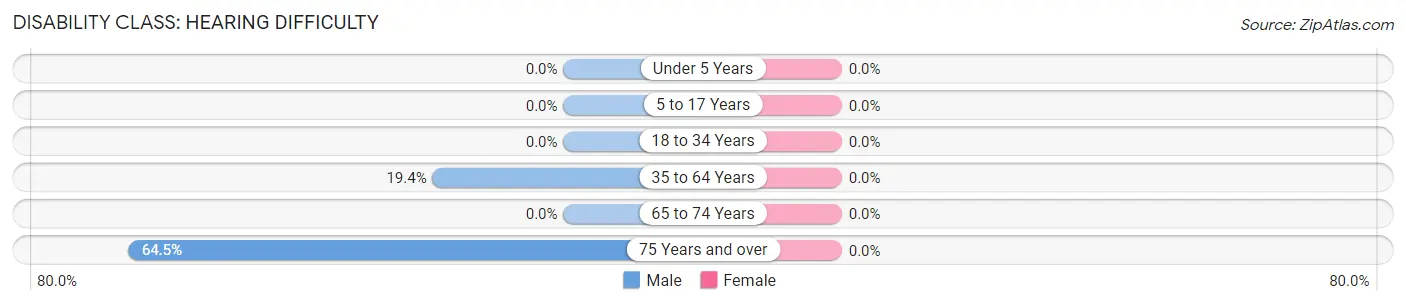
| Age Bracket | Male | Female |
| Under 5 Years | 0 (0.0%) | 0 (0.0%) |
| 5 to 17 Years | 0 (0.0%) | 0 (0.0%) |
| 18 to 34 Years | 0 (0.0%) | 0 (0.0%) |
| 35 to 64 Years | 41 (19.4%) | 0 (0.0%) |
| 65 to 74 Years | 0 (0.0%) | 0 (0.0%) |
| 75 Years and over | 20 (64.5%) | 0 (0.0%) |
Disability Class: Vision Difficulty
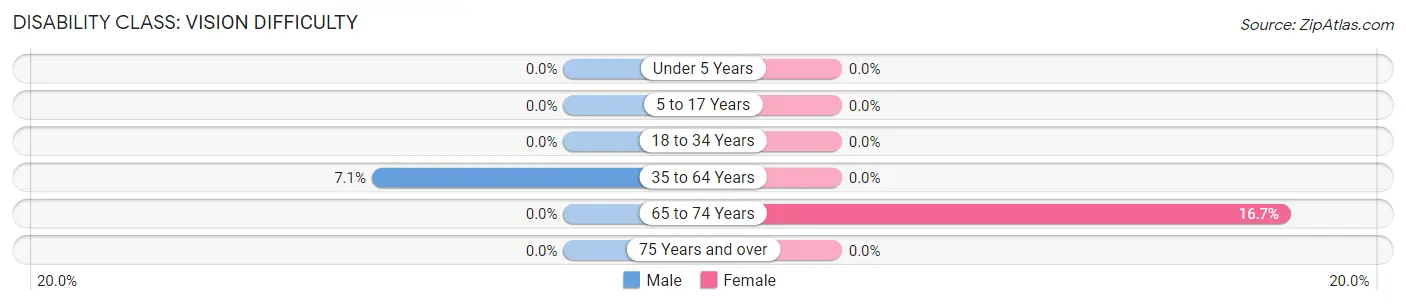
| Age Bracket | Male | Female |
| Under 5 Years | 0 (0.0%) | 0 (0.0%) |
| 5 to 17 Years | 0 (0.0%) | 0 (0.0%) |
| 18 to 34 Years | 0 (0.0%) | 0 (0.0%) |
| 35 to 64 Years | 15 (7.1%) | 0 (0.0%) |
| 65 to 74 Years | 0 (0.0%) | 14 (16.7%) |
| 75 Years and over | 0 (0.0%) | 0 (0.0%) |
Disability Class: Cognitive Difficulty
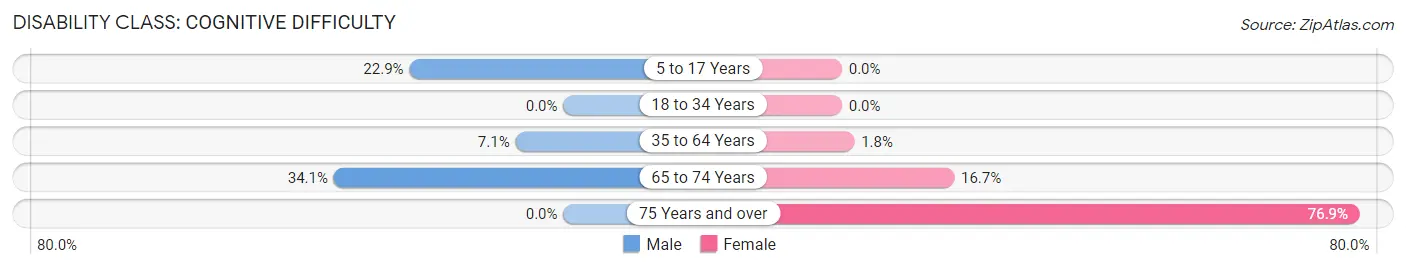
| Age Bracket | Male | Female |
| 5 to 17 Years | 16 (22.9%) | 0 (0.0%) |
| 18 to 34 Years | 0 (0.0%) | 0 (0.0%) |
| 35 to 64 Years | 15 (7.1%) | 5 (1.8%) |
| 65 to 74 Years | 30 (34.1%) | 14 (16.7%) |
| 75 Years and over | 0 (0.0%) | 10 (76.9%) |
Disability Class: Ambulatory Difficulty
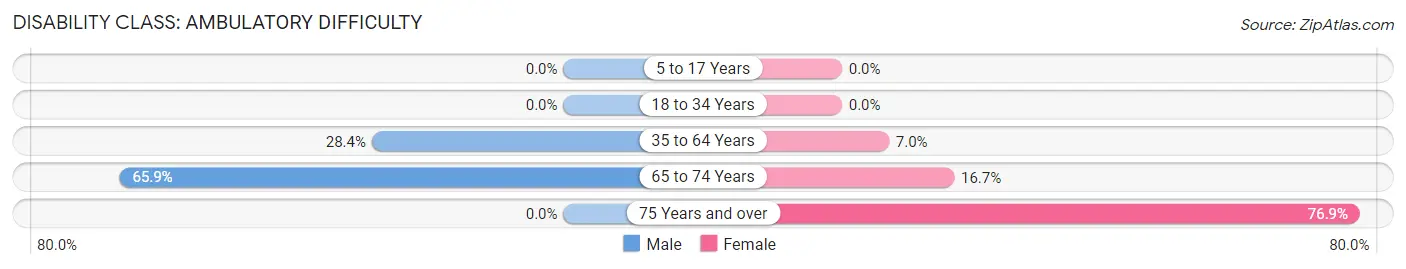
| Age Bracket | Male | Female |
| 5 to 17 Years | 0 (0.0%) | 0 (0.0%) |
| 18 to 34 Years | 0 (0.0%) | 0 (0.0%) |
| 35 to 64 Years | 60 (28.4%) | 19 (7.0%) |
| 65 to 74 Years | 58 (65.9%) | 14 (16.7%) |
| 75 Years and over | 0 (0.0%) | 10 (76.9%) |
Disability Class: Self-Care Difficulty
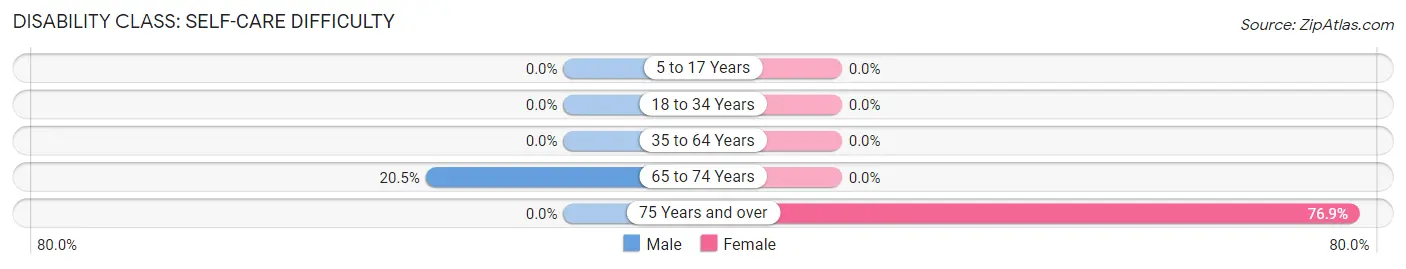
| Age Bracket | Male | Female |
| 5 to 17 Years | 0 (0.0%) | 0 (0.0%) |
| 18 to 34 Years | 0 (0.0%) | 0 (0.0%) |
| 35 to 64 Years | 0 (0.0%) | 0 (0.0%) |
| 65 to 74 Years | 18 (20.4%) | 0 (0.0%) |
| 75 Years and over | 0 (0.0%) | 10 (76.9%) |
Technology Access in Brush Fork
Computing Device Access in Brush Fork
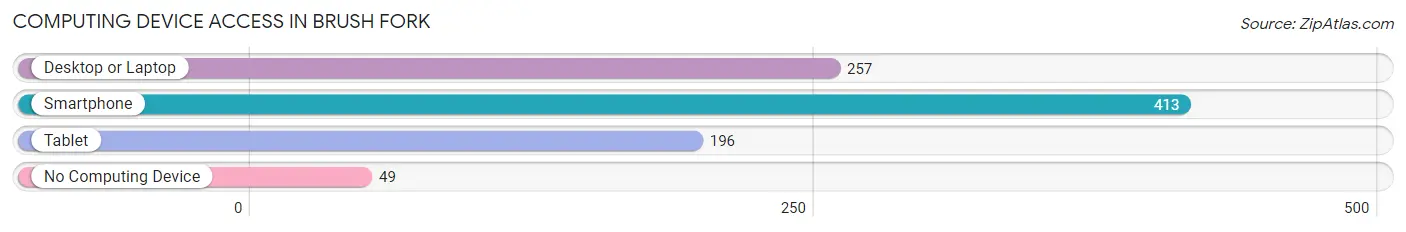
| Device Type | # Households | % Households |
| Desktop or Laptop | 257 | 54.3% |
| Smartphone | 413 | 87.3% |
| Tablet | 196 | 41.4% |
| No Computing Device | 49 | 10.4% |
| Total | 473 | 100.0% |
Internet Access in Brush Fork
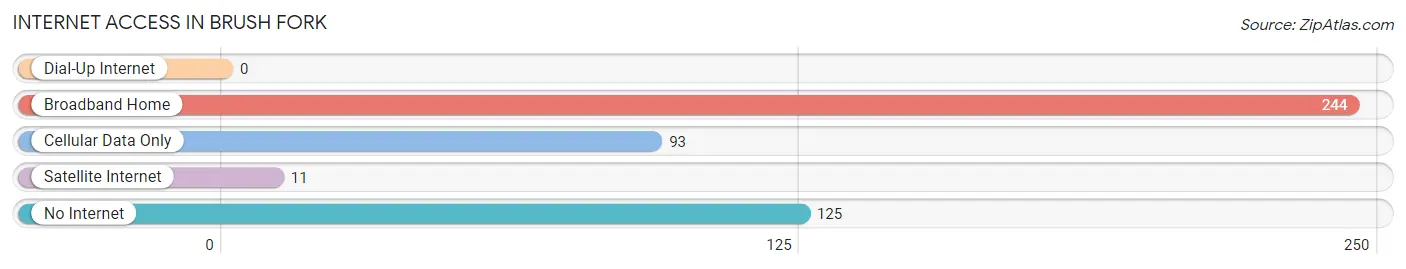
| Internet Type | # Households | % Households |
| Dial-Up Internet | 0 | 0.0% |
| Broadband Home | 244 | 51.6% |
| Cellular Data Only | 93 | 19.7% |
| Satellite Internet | 11 | 2.3% |
| No Internet | 125 | 26.4% |
| Total | 473 | 100.0% |
Brush Fork Summary
Brush Fork is an unincorporated community located in Mercer County, West Virginia. It is situated in the Appalachian Mountains, and is part of the Bluefield, WV-VA micropolitan area. The community is located along the Brush Fork of the Bluestone River, and is home to a population of approximately 1,000 people.
History
The area that is now Brush Fork was first settled in the late 1700s by settlers from the British Isles. The community was originally known as Brushy Fork, and was named after the nearby creek. The first post office was established in 1883, and the town was officially incorporated in 1891.
The town was a major coal mining center in the early 1900s, and the coal industry was the primary source of employment for the residents. The coal industry declined in the mid-1900s, and the town has since become a bedroom community for the larger cities in the region.
Geography
Brush Fork is located in the Appalachian Mountains of West Virginia. The town is situated along the Brush Fork of the Bluestone River, and is surrounded by rolling hills and forests. The town is located approximately 10 miles from the city of Bluefield, and is about a two-hour drive from the state capital of Charleston.
Economy
The economy of Brush Fork is largely based on the service industry. The town is home to several small businesses, including restaurants, retail stores, and a few manufacturing plants. The town is also home to a number of small farms, which produce a variety of crops and livestock.
Demographics
As of the 2010 census, the population of Brush Fork was 1,000 people. The racial makeup of the town was 97.2% White, 0.7% African American, 0.3% Native American, 0.2% Asian, and 1.6% from other races. The median household income was $30,000, and the median age was 40 years.
Conclusion
Brush Fork is a small unincorporated community located in Mercer County, West Virginia. The town is situated in the Appalachian Mountains, and is part of the Bluefield, WV-VA micropolitan area. The town was originally settled in the late 1700s, and was a major coal mining center in the early 1900s. The economy of Brush Fork is largely based on the service industry, and the town is home to a population of approximately 1,000 people.
Common Questions
What is Per Capita Income in Brush Fork?
Per Capita income in Brush Fork is $23,203.
What is the Median Family Income in Brush Fork?
Median Family Income in Brush Fork is $66,250.
What is the Median Household income in Brush Fork?
Median Household Income in Brush Fork is $44,493.
What is Income or Wage Gap in Brush Fork?
Income or Wage Gap in Brush Fork is 53.1%.
Women in Brush Fork earn 46.9 cents for every dollar earned by a man.
What is Inequality or Gini Index in Brush Fork?
Inequality or Gini Index in Brush Fork is 0.37.
What is the Total Population of Brush Fork?
Total Population of Brush Fork is 1,150.
What is the Total Male Population of Brush Fork?
Total Male Population of Brush Fork is 457.
What is the Total Female Population of Brush Fork?
Total Female Population of Brush Fork is 693.
What is the Ratio of Males per 100 Females in Brush Fork?
There are 65.95 Males per 100 Females in Brush Fork.
What is the Ratio of Females per 100 Males in Brush Fork?
There are 151.64 Females per 100 Males in Brush Fork.
What is the Median Population Age in Brush Fork?
Median Population Age in Brush Fork is 47.4 Years.
What is the Average Family Size in Brush Fork
Average Family Size in Brush Fork is 3.0 People.
What is the Average Household Size in Brush Fork
Average Household Size in Brush Fork is 2.4 People.
How Large is the Labor Force in Brush Fork?
There are 473 People in the Labor Forcein in Brush Fork.
What is the Percentage of People in the Labor Force in Brush Fork?
49.2% of People are in the Labor Force in Brush Fork.