Elizabeth, WV Map & Demographics
Elizabeth Map
Elizabeth Overview
$15,833
PER CAPITA INCOME
58.7%
WAGE / INCOME GAP [ % ]
41.3¢/ $1
WAGE / INCOME GAP [ $ ]
$6,783
FAMILY INCOME DEFICIT
0.46
INEQUALITY / GINI INDEX
700
TOTAL POPULATION
356
MALE POPULATION
344
FEMALE POPULATION
103.49
MALES / 100 FEMALES
96.63
FEMALES / 100 MALES
37.1
MEDIAN AGE
3.0
AVG FAMILY SIZE
2.5
AVG HOUSEHOLD SIZE
281
LABOR FORCE [ PEOPLE ]
50.4%
PERCENT IN LABOR FORCE
1.1%
UNEMPLOYMENT RATE
Elizabeth Zip Codes
Income in Elizabeth
Income Overview in Elizabeth
| Characteristic | Number | Measure |
| Per Capita Income | 700 | $15,833 |
| Median Family Income | 192 | $0 |
| Mean Family Income | 192 | $46,555 |
| Median Household Income | 283 | $0 |
| Mean Household Income | 283 | $42,449 |
| Income Deficit | 192 | $6,783 |
| Wage / Income Gap (%) | 700 | 58.75% |
| Wage / Income Gap ($) | 700 | 41.25¢ per $1 |
| Gini / Inequality Index | 700 | 0.46 |
Earnings by Sex in Elizabeth
Average Earnings in Elizabeth are $28,846, $37,661 for men and $15,536 for women, a difference of 58.8%.
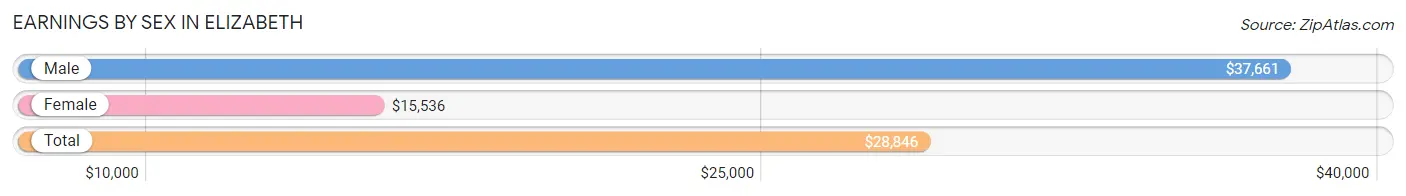
| Sex | Number | Average Earnings |
| Male | 114 (38.8%) | $37,661 |
| Female | 180 (61.2%) | $15,536 |
| Total | 294 (100.0%) | $28,846 |
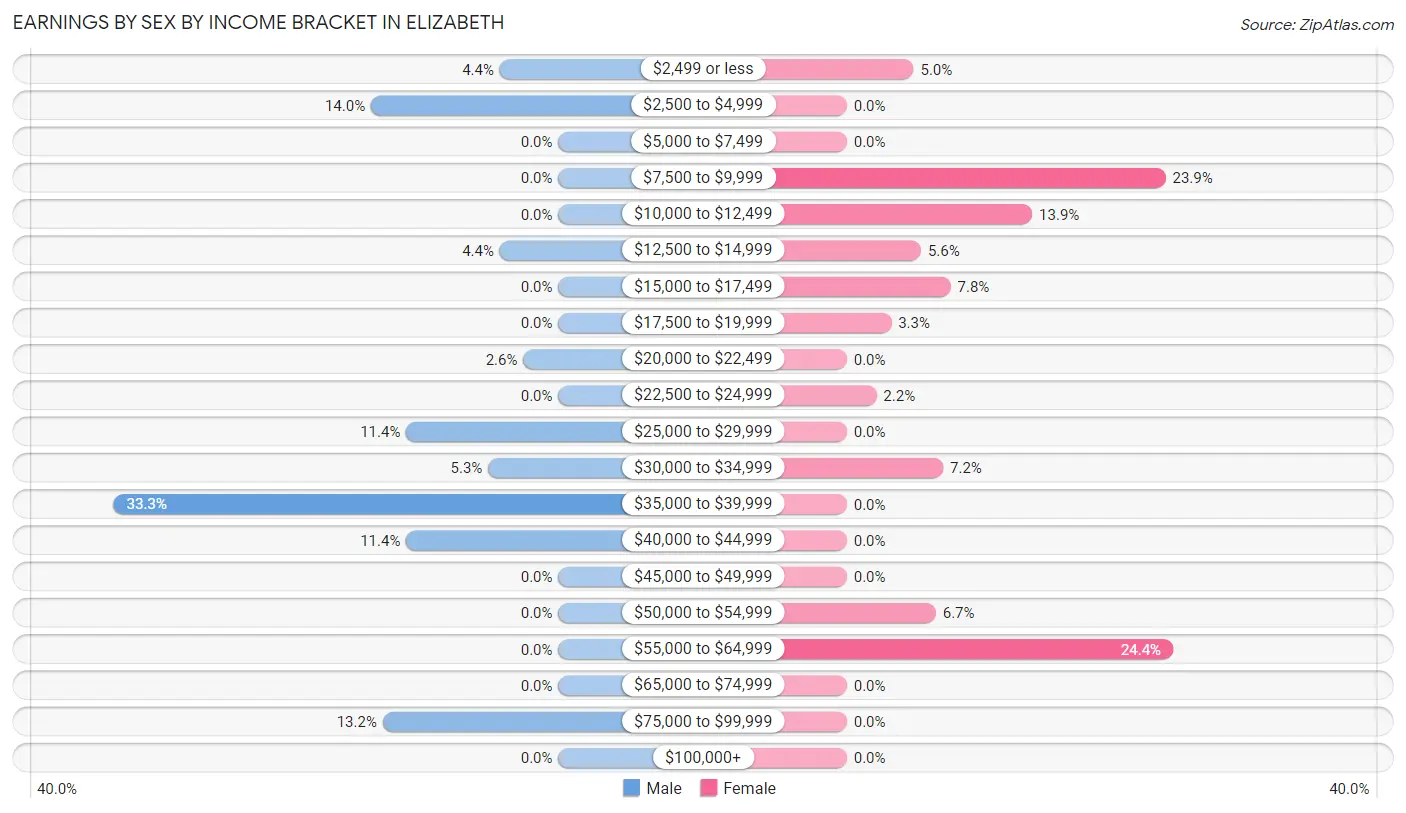
Earnings by Sex by Income Bracket in Elizabeth
The most common earnings brackets in Elizabeth are $35,000 to $39,999 for men (38 | 33.3%) and $55,000 to $64,999 for women (44 | 24.4%).
| Income | Male | Female |
| $2,499 or less | 5 (4.4%) | 9 (5.0%) |
| $2,500 to $4,999 | 16 (14.0%) | 0 (0.0%) |
| $5,000 to $7,499 | 0 (0.0%) | 0 (0.0%) |
| $7,500 to $9,999 | 0 (0.0%) | 43 (23.9%) |
| $10,000 to $12,499 | 0 (0.0%) | 25 (13.9%) |
| $12,500 to $14,999 | 5 (4.4%) | 10 (5.6%) |
| $15,000 to $17,499 | 0 (0.0%) | 14 (7.8%) |
| $17,500 to $19,999 | 0 (0.0%) | 6 (3.3%) |
| $20,000 to $22,499 | 3 (2.6%) | 0 (0.0%) |
| $22,500 to $24,999 | 0 (0.0%) | 4 (2.2%) |
| $25,000 to $29,999 | 13 (11.4%) | 0 (0.0%) |
| $30,000 to $34,999 | 6 (5.3%) | 13 (7.2%) |
| $35,000 to $39,999 | 38 (33.3%) | 0 (0.0%) |
| $40,000 to $44,999 | 13 (11.4%) | 0 (0.0%) |
| $45,000 to $49,999 | 0 (0.0%) | 0 (0.0%) |
| $50,000 to $54,999 | 0 (0.0%) | 12 (6.7%) |
| $55,000 to $64,999 | 0 (0.0%) | 44 (24.4%) |
| $65,000 to $74,999 | 0 (0.0%) | 0 (0.0%) |
| $75,000 to $99,999 | 15 (13.2%) | 0 (0.0%) |
| $100,000+ | 0 (0.0%) | 0 (0.0%) |
| Total | 114 (100.0%) | 180 (100.0%) |
Earnings by Sex by Educational Attainment in Elizabeth
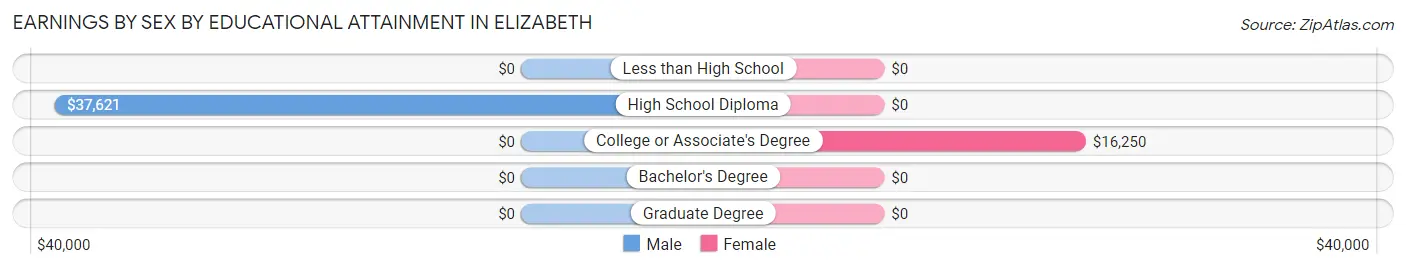
| Educational Attainment | Male Income | Female Income |
| Less than High School | - | - |
| High School Diploma | $37,621 | $0 |
| College or Associate's Degree | - | - |
| Bachelor's Degree | - | - |
| Graduate Degree | - | - |
| Total | $37,863 | $0 |
Family Income in Elizabeth
Family Income Brackets in Elizabeth
According to the Elizabeth family income data, there are 44 families falling into the $100,000 to $149,999 income range, which is the most common income bracket and makes up 22.9% of all families.
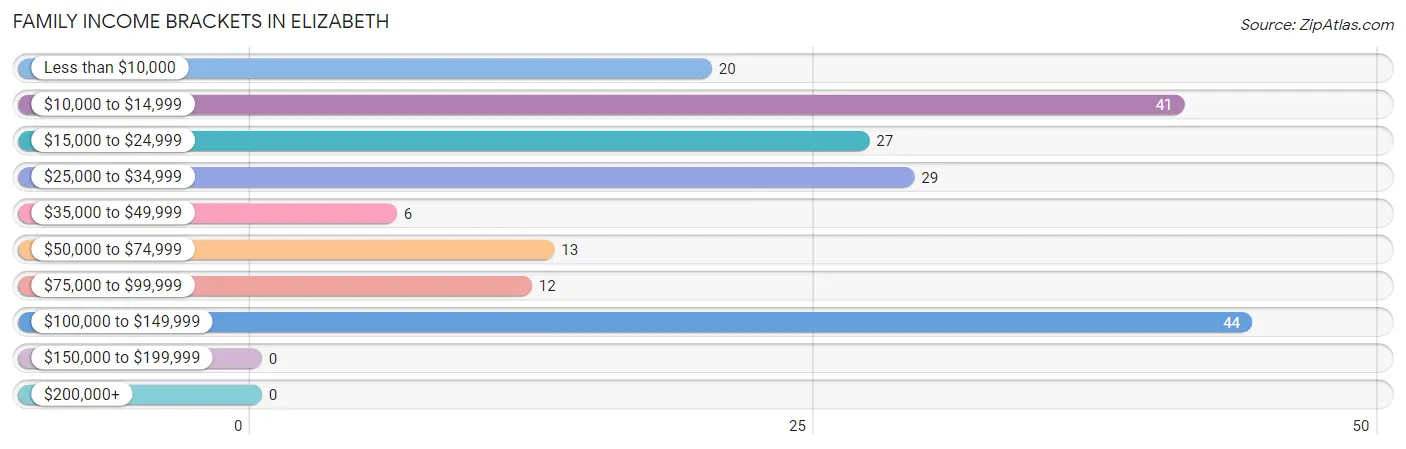
| Income Bracket | # Families | % Families |
| Less than $10,000 | 20 | 10.4% |
| $10,000 to $14,999 | 41 | 21.4% |
| $15,000 to $24,999 | 27 | 14.1% |
| $25,000 to $34,999 | 29 | 15.1% |
| $35,000 to $49,999 | 6 | 3.1% |
| $50,000 to $74,999 | 13 | 6.8% |
| $75,000 to $99,999 | 12 | 6.3% |
| $100,000 to $149,999 | 44 | 22.9% |
| $150,000 to $199,999 | 0 | 0.0% |
| $200,000+ | 0 | 0.0% |
Family Income by Famaliy Size in Elizabeth
4-person families (90 | 46.9%) account for the highest median family income in Elizabeth with $89,792 per family, while 4-person families (90 | 46.9%) have the highest median income of $22,448 per family member.
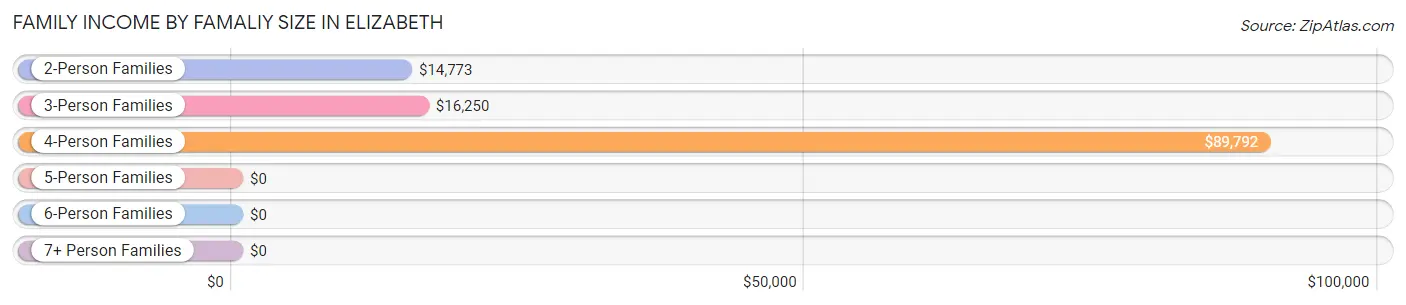
| Income Bracket | # Families | Median Income |
| 2-Person Families | 76 (39.6%) | $14,773 |
| 3-Person Families | 26 (13.5%) | $16,250 |
| 4-Person Families | 90 (46.9%) | $89,792 |
| 5-Person Families | 0 (0.0%) | $0 |
| 6-Person Families | 0 (0.0%) | $0 |
| 7+ Person Families | 0 (0.0%) | $0 |
| Total | 192 (100.0%) | $0 |
Family Income by Number of Earners in Elizabeth
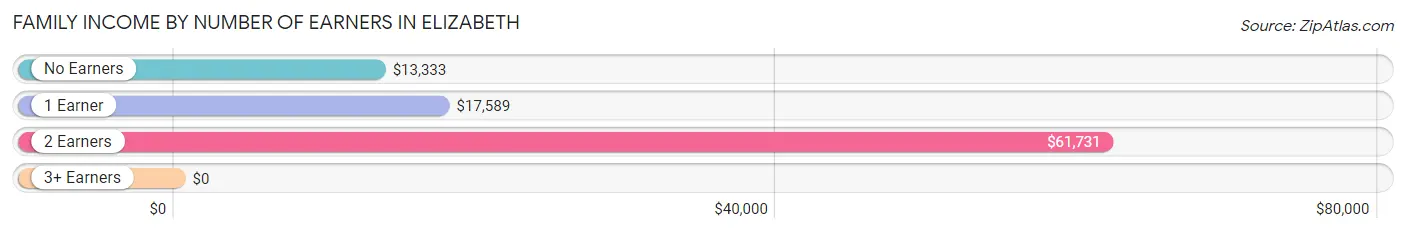
| Number of Earners | # Families | Median Income |
| No Earners | 58 (30.2%) | $13,333 |
| 1 Earner | 53 (27.6%) | $17,589 |
| 2 Earners | 32 (16.7%) | $61,731 |
| 3+ Earners | 49 (25.5%) | $0 |
| Total | 192 (100.0%) | $0 |
Household Income in Elizabeth
Household Income Brackets in Elizabeth
With 71 households falling in the category, the $10,000 to $14,999 income range is the most frequent in Elizabeth, accounting for 25.1% of all households.
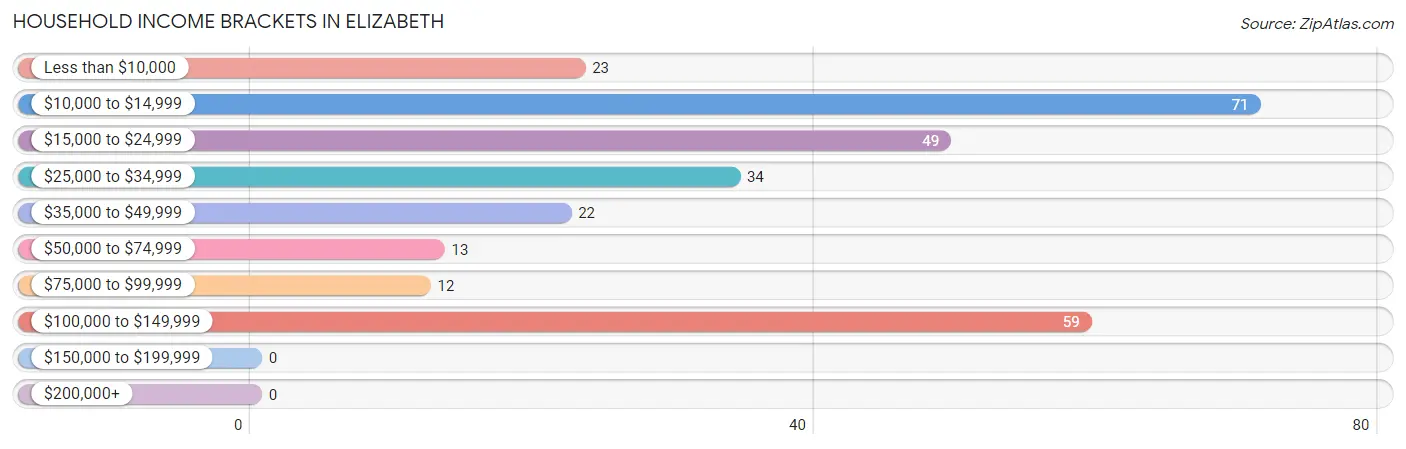
| Income Bracket | # Households | % Households |
| Less than $10,000 | 23 | 8.1% |
| $10,000 to $14,999 | 71 | 25.1% |
| $15,000 to $24,999 | 49 | 17.3% |
| $25,000 to $34,999 | 34 | 12.0% |
| $35,000 to $49,999 | 22 | 7.8% |
| $50,000 to $74,999 | 13 | 4.6% |
| $75,000 to $99,999 | 12 | 4.2% |
| $100,000 to $149,999 | 59 | 20.8% |
| $150,000 to $199,999 | 0 | 0.0% |
| $200,000+ | 0 | 0.0% |
Household Income by Householder Age in Elizabeth
The median household income in Elizabeth is $0, with the highest median household income of $18,083 found in the 65+ years age bracket for the primary householder. A total of 49 households (17.3%) fall into this category. Meanwhile, the 15 to 24 years age bracket for the primary householder has the lowest median household income of $0, with 11 households (3.9%) in this group.
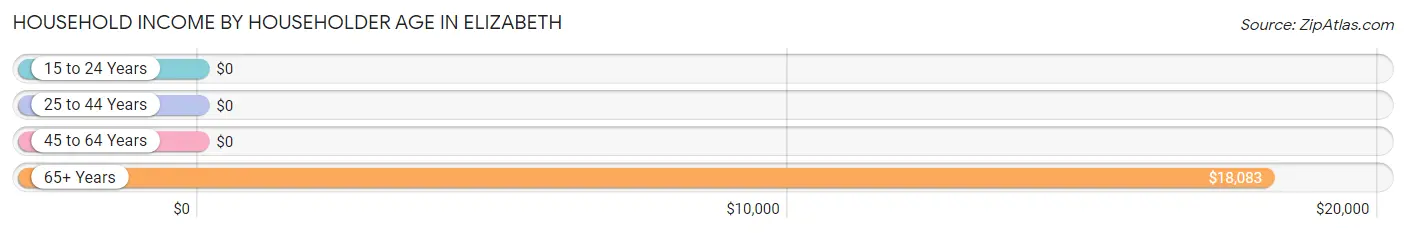
| Income Bracket | # Households | Median Income |
| 15 to 24 Years | 11 (3.9%) | $0 |
| 25 to 44 Years | 98 (34.6%) | $0 |
| 45 to 64 Years | 125 (44.2%) | $0 |
| 65+ Years | 49 (17.3%) | $18,083 |
| Total | 283 (100.0%) | $0 |
Poverty in Elizabeth
Income Below Poverty by Sex and Age in Elizabeth
With 43.0% poverty level for males and 56.1% for females among the residents of Elizabeth, 15 year old males and 6 to 11 year old females are the most vulnerable to poverty, with 13 males (100.0%) and 25 females (100.0%) in their respective age groups living below the poverty level.
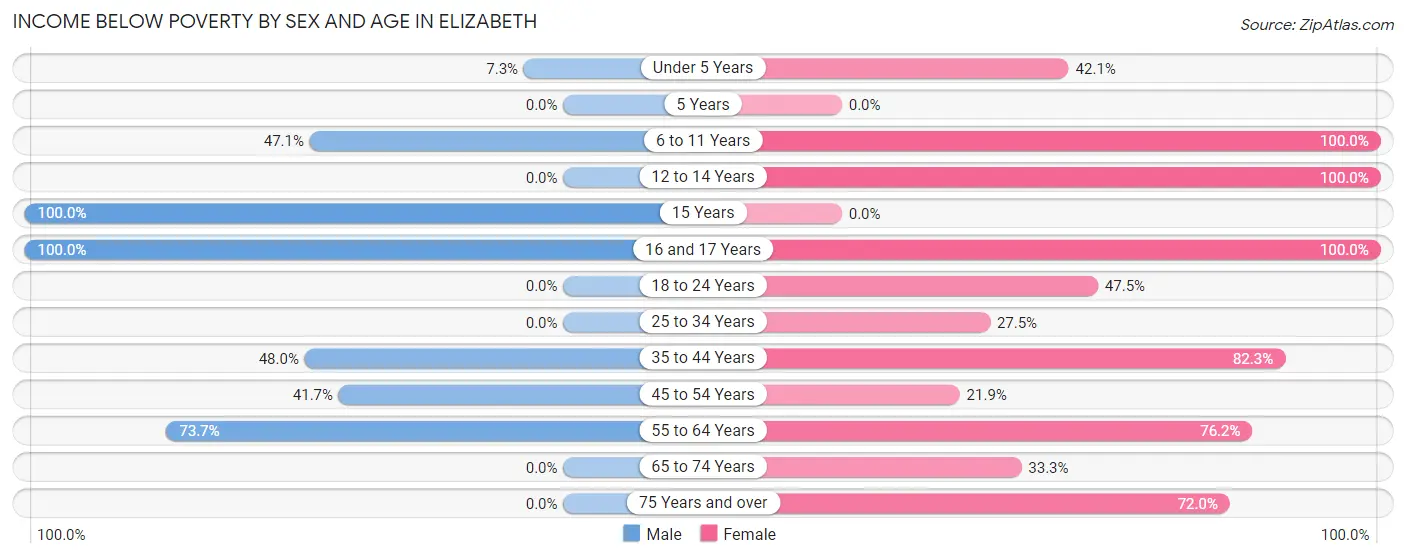
| Age Bracket | Male | Female |
| Under 5 Years | 3 (7.3%) | 8 (42.1%) |
| 5 Years | 0 (0.0%) | 0 (0.0%) |
| 6 to 11 Years | 16 (47.1%) | 25 (100.0%) |
| 12 to 14 Years | 0 (0.0%) | 10 (100.0%) |
| 15 Years | 13 (100.0%) | 0 (0.0%) |
| 16 and 17 Years | 14 (100.0%) | 8 (100.0%) |
| 18 to 24 Years | 0 (0.0%) | 29 (47.5%) |
| 25 to 34 Years | 0 (0.0%) | 11 (27.5%) |
| 35 to 44 Years | 60 (48.0%) | 51 (82.3%) |
| 45 to 54 Years | 5 (41.7%) | 14 (21.9%) |
| 55 to 64 Years | 42 (73.7%) | 16 (76.2%) |
| 65 to 74 Years | 0 (0.0%) | 3 (33.3%) |
| 75 Years and over | 0 (0.0%) | 18 (72.0%) |
| Total | 153 (43.0%) | 193 (56.1%) |
Income Above Poverty by Sex and Age in Elizabeth
According to the poverty statistics in Elizabeth, males aged 18 to 24 years and females aged 45 to 54 years are the age groups that are most secure financially, with 100.0% of males and 78.1% of females in these age groups living above the poverty line.
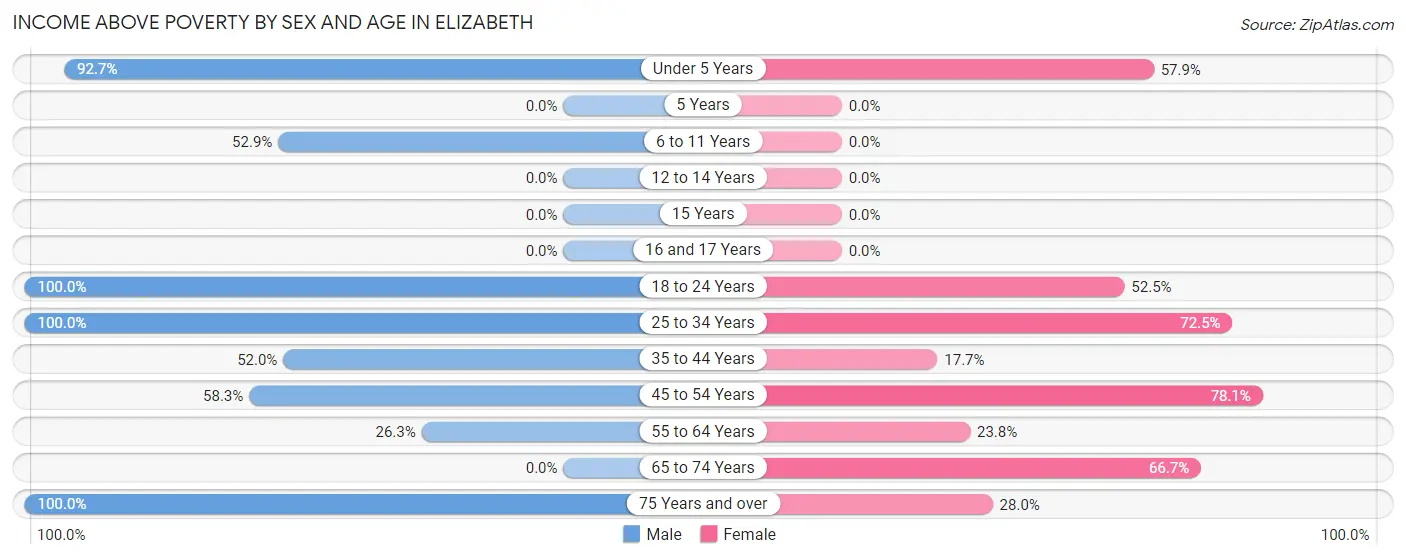
| Age Bracket | Male | Female |
| Under 5 Years | 38 (92.7%) | 11 (57.9%) |
| 5 Years | 0 (0.0%) | 0 (0.0%) |
| 6 to 11 Years | 18 (52.9%) | 0 (0.0%) |
| 12 to 14 Years | 0 (0.0%) | 0 (0.0%) |
| 15 Years | 0 (0.0%) | 0 (0.0%) |
| 16 and 17 Years | 0 (0.0%) | 0 (0.0%) |
| 18 to 24 Years | 27 (100.0%) | 32 (52.5%) |
| 25 to 34 Years | 7 (100.0%) | 29 (72.5%) |
| 35 to 44 Years | 65 (52.0%) | 11 (17.7%) |
| 45 to 54 Years | 7 (58.3%) | 50 (78.1%) |
| 55 to 64 Years | 15 (26.3%) | 5 (23.8%) |
| 65 to 74 Years | 0 (0.0%) | 6 (66.7%) |
| 75 Years and over | 26 (100.0%) | 7 (28.0%) |
| Total | 203 (57.0%) | 151 (43.9%) |
Income Below Poverty Among Married-Couple Families in Elizabeth
The poverty statistics for married-couple families in Elizabeth show that 21.4% or 27 of the total 126 families live below the poverty line. Families with 1 or 2 children have the highest poverty rate of 28.3%, comprising of 15 families. On the other hand, families with no children have the lowest poverty rate of 16.4%, which includes 12 families.
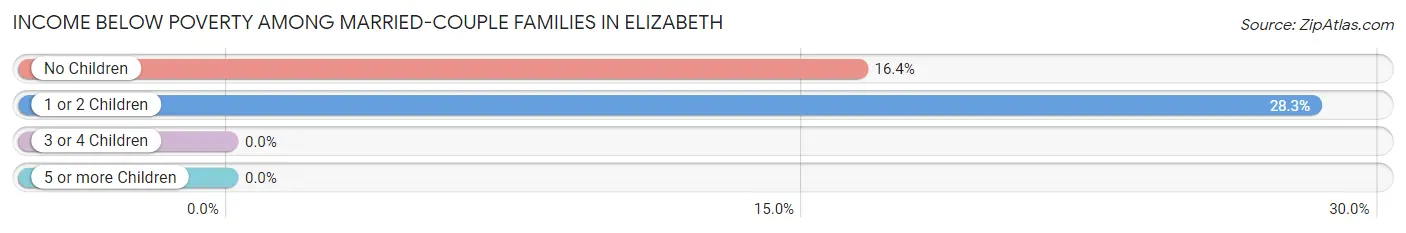
| Children | Above Poverty | Below Poverty |
| No Children | 61 (83.6%) | 12 (16.4%) |
| 1 or 2 Children | 38 (71.7%) | 15 (28.3%) |
| 3 or 4 Children | 0 (0.0%) | 0 (0.0%) |
| 5 or more Children | 0 (0.0%) | 0 (0.0%) |
| Total | 99 (78.6%) | 27 (21.4%) |
Income Below Poverty Among Single-Parent Households in Elizabeth
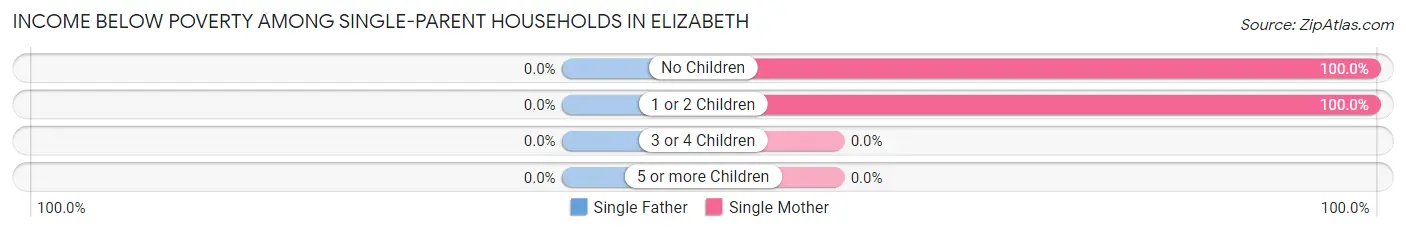
| Children | Single Father | Single Mother |
| No Children | 0 (0.0%) | 27 (100.0%) |
| 1 or 2 Children | 0 (0.0%) | 39 (100.0%) |
| 3 or 4 Children | 0 (0.0%) | 0 (0.0%) |
| 5 or more Children | 0 (0.0%) | 0 (0.0%) |
| Total | 0 (0.0%) | 66 (100.0%) |
Income Below Poverty Among Married-Couple vs Single-Parent Households in Elizabeth
The poverty data for Elizabeth shows that 27 of the married-couple family households (21.4%) and 66 of the single-parent households (100.0%) are living below the poverty level. Within the married-couple family households, those with 1 or 2 children have the highest poverty rate, with 15 households (28.3%) falling below the poverty line. Among the single-parent households, those with no children have the highest poverty rate, with 27 household (100.0%) living below poverty.
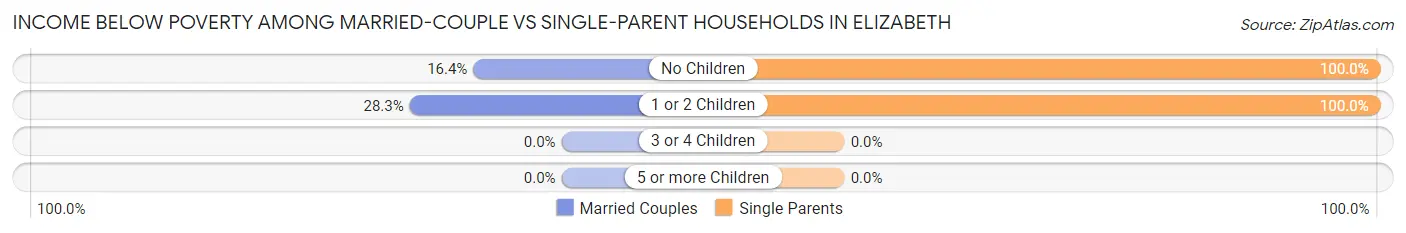
| Children | Married-Couple Families | Single-Parent Households |
| No Children | 12 (16.4%) | 27 (100.0%) |
| 1 or 2 Children | 15 (28.3%) | 39 (100.0%) |
| 3 or 4 Children | 0 (0.0%) | 0 (0.0%) |
| 5 or more Children | 0 (0.0%) | 0 (0.0%) |
| Total | 27 (21.4%) | 66 (100.0%) |
Race in Elizabeth
The most populous races in Elizabeth are White / Caucasian (691 | 98.7%), Black / African American (6 | 0.9%), and Two or more Races (3 | 0.4%).
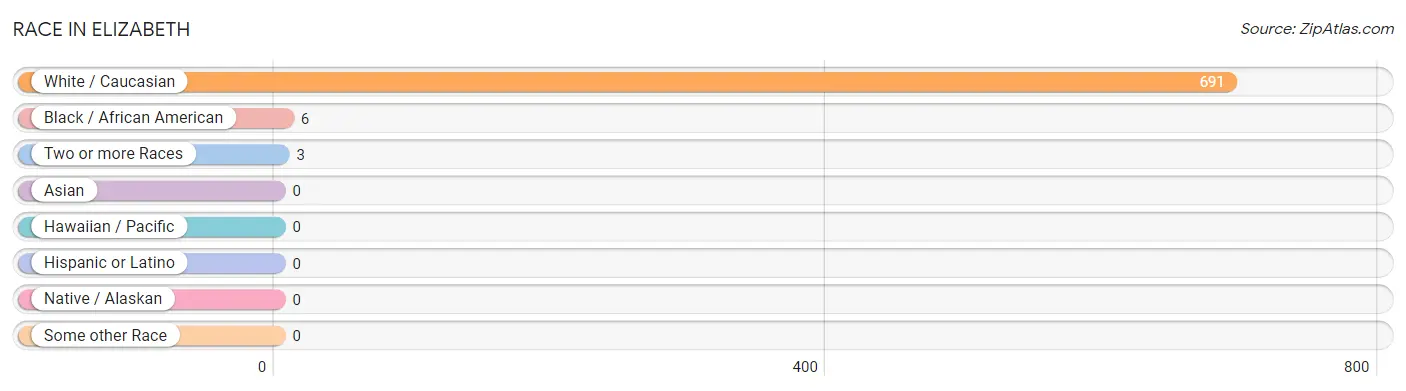
| Race | # Population | % Population |
| Asian | 0 | 0.0% |
| Black / African American | 6 | 0.9% |
| Hawaiian / Pacific | 0 | 0.0% |
| Hispanic or Latino | 0 | 0.0% |
| Native / Alaskan | 0 | 0.0% |
| White / Caucasian | 691 | 98.7% |
| Two or more Races | 3 | 0.4% |
| Some other Race | 0 | 0.0% |
| Total | 700 | 100.0% |
Ancestry in Elizabeth
The most populous ancestries reported in Elizabeth are Scotch-Irish (122 | 17.4%), German (110 | 15.7%), American (102 | 14.6%), Irish (25 | 3.6%), and Czech (23 | 3.3%), together accounting for 54.6% of all Elizabeth residents.
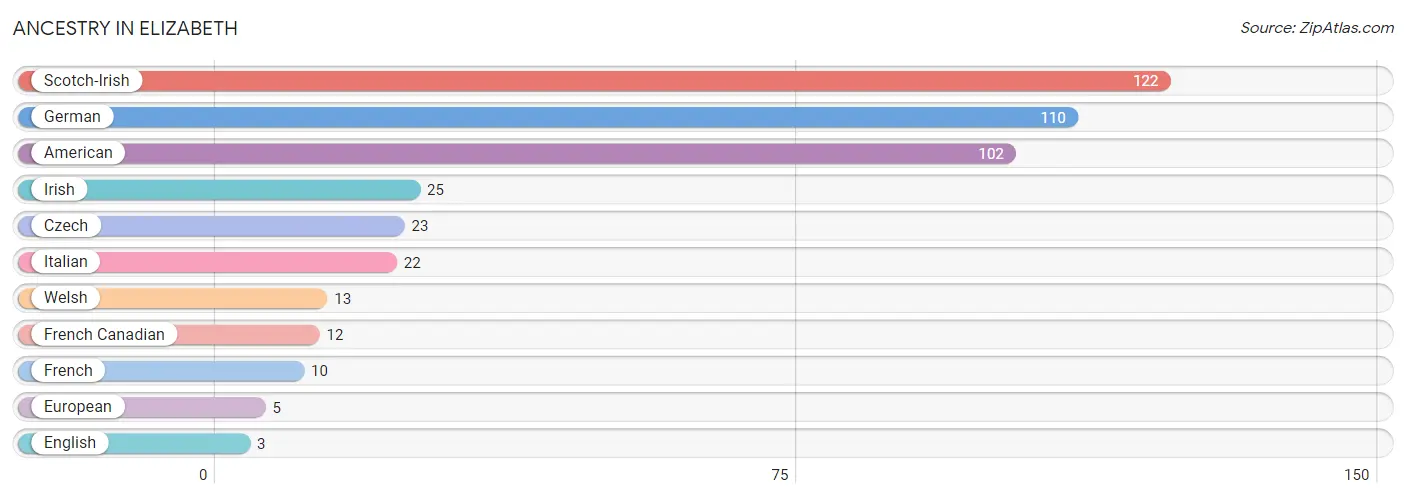
| Ancestry | # Population | % Population |
| American | 102 | 14.6% |
| Czech | 23 | 3.3% |
| English | 3 | 0.4% |
| European | 5 | 0.7% |
| French | 10 | 1.4% |
| French Canadian | 12 | 1.7% |
| German | 110 | 15.7% |
| Irish | 25 | 3.6% |
| Italian | 22 | 3.1% |
| Scotch-Irish | 122 | 17.4% |
| Welsh | 13 | 1.9% | View All 11 Rows |
Immigrants in Elizabeth

| Immigration Origin | # Population | % Population | View All 0 Rows |
Sex and Age in Elizabeth
Sex and Age in Elizabeth
The most populous age groups in Elizabeth are 35 to 39 Years (69 | 19.4%) for men and 40 to 44 Years (52 | 15.1%) for women.
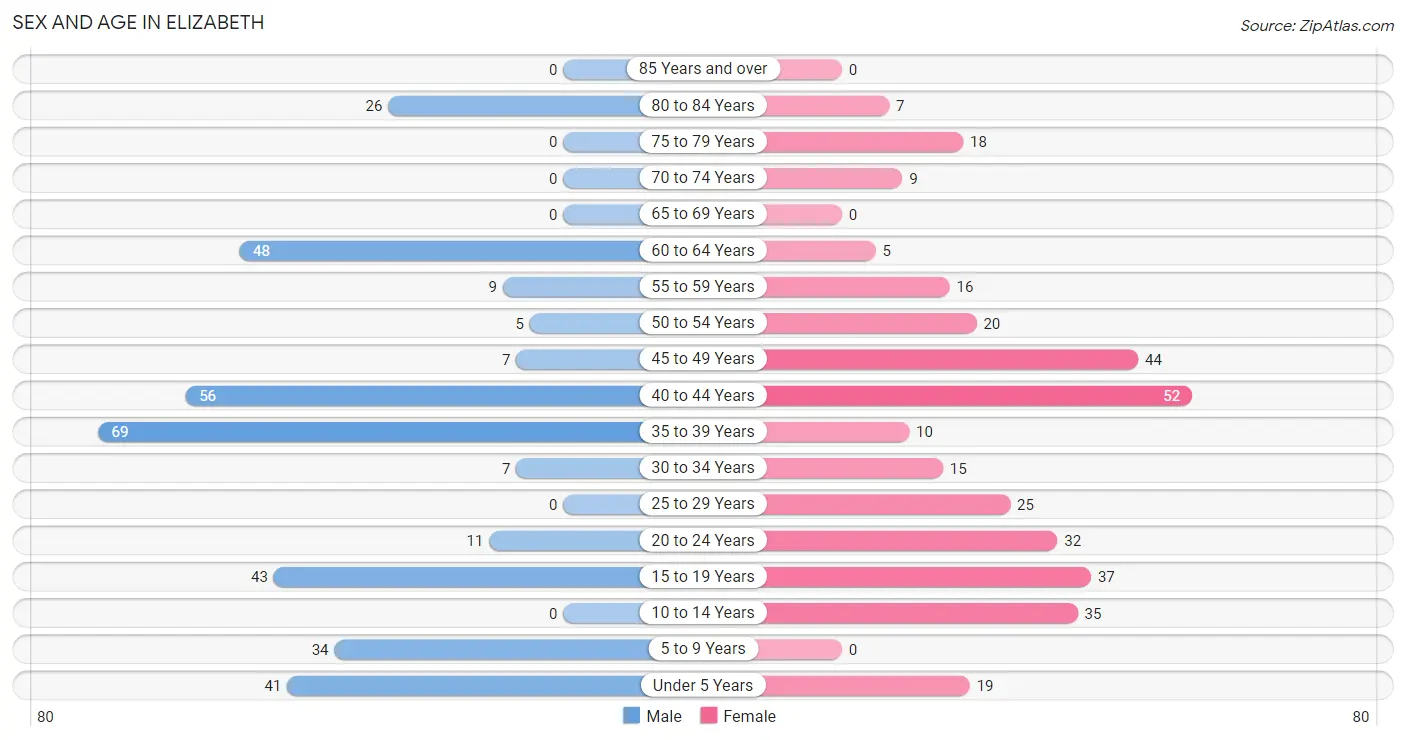
| Age Bracket | Male | Female |
| Under 5 Years | 41 (11.5%) | 19 (5.5%) |
| 5 to 9 Years | 34 (9.6%) | 0 (0.0%) |
| 10 to 14 Years | 0 (0.0%) | 35 (10.2%) |
| 15 to 19 Years | 43 (12.1%) | 37 (10.8%) |
| 20 to 24 Years | 11 (3.1%) | 32 (9.3%) |
| 25 to 29 Years | 0 (0.0%) | 25 (7.3%) |
| 30 to 34 Years | 7 (2.0%) | 15 (4.4%) |
| 35 to 39 Years | 69 (19.4%) | 10 (2.9%) |
| 40 to 44 Years | 56 (15.7%) | 52 (15.1%) |
| 45 to 49 Years | 7 (2.0%) | 44 (12.8%) |
| 50 to 54 Years | 5 (1.4%) | 20 (5.8%) |
| 55 to 59 Years | 9 (2.5%) | 16 (4.6%) |
| 60 to 64 Years | 48 (13.5%) | 5 (1.5%) |
| 65 to 69 Years | 0 (0.0%) | 0 (0.0%) |
| 70 to 74 Years | 0 (0.0%) | 9 (2.6%) |
| 75 to 79 Years | 0 (0.0%) | 18 (5.2%) |
| 80 to 84 Years | 26 (7.3%) | 7 (2.0%) |
| 85 Years and over | 0 (0.0%) | 0 (0.0%) |
| Total | 356 (100.0%) | 344 (100.0%) |
Families and Households in Elizabeth
Median Family Size in Elizabeth
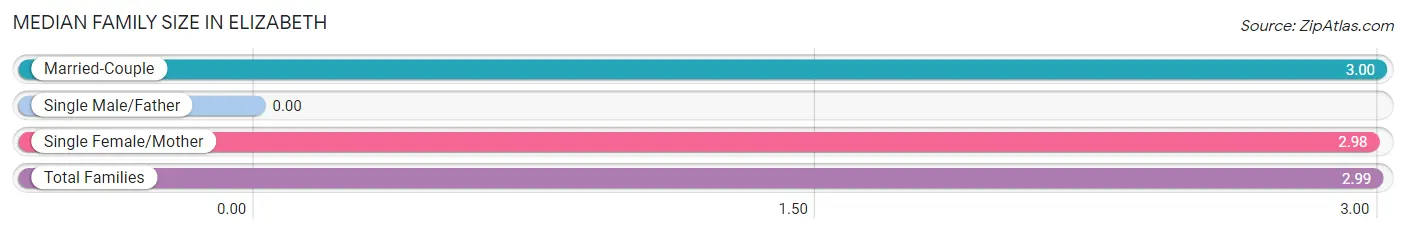
| Family Type | # Families | Family Size |
| Married-Couple | 126 (65.6%) | 3.00 |
| Single Male/Father | 0 (0.0%) | - |
| Single Female/Mother | 66 (34.4%) | 2.98 |
| Total Families | 192 (100.0%) | 2.99 |
Median Household Size in Elizabeth
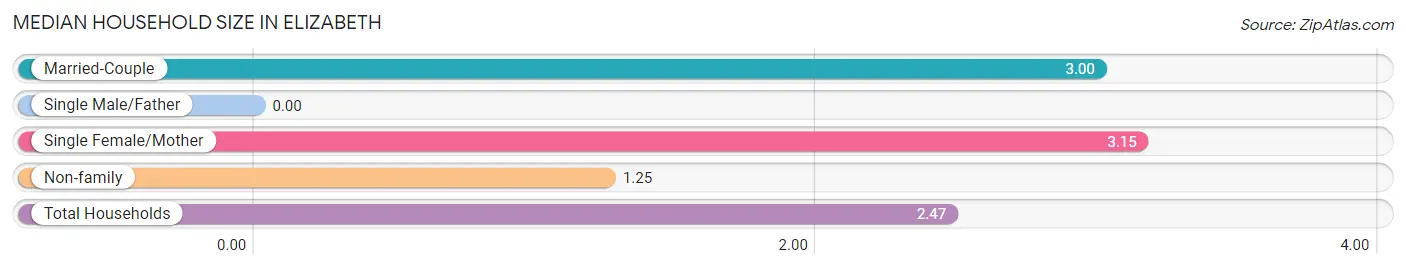
| Household Type | # Households | Household Size |
| Married-Couple | 126 (44.5%) | 3.00 |
| Single Male/Father | 0 (0.0%) | - |
| Single Female/Mother | 66 (23.3%) | 3.15 |
| Non-family | 91 (32.2%) | 1.25 |
| Total Households | 283 (100.0%) | 2.47 |
Household Size by Marriage Status in Elizabeth
Out of a total of 283 households in Elizabeth, 192 (67.8%) are family households, while 91 (32.2%) are nonfamily households. The most numerous type of family households are 4-person households, comprising 90, and the most common type of nonfamily households are 1-person households, comprising 76.
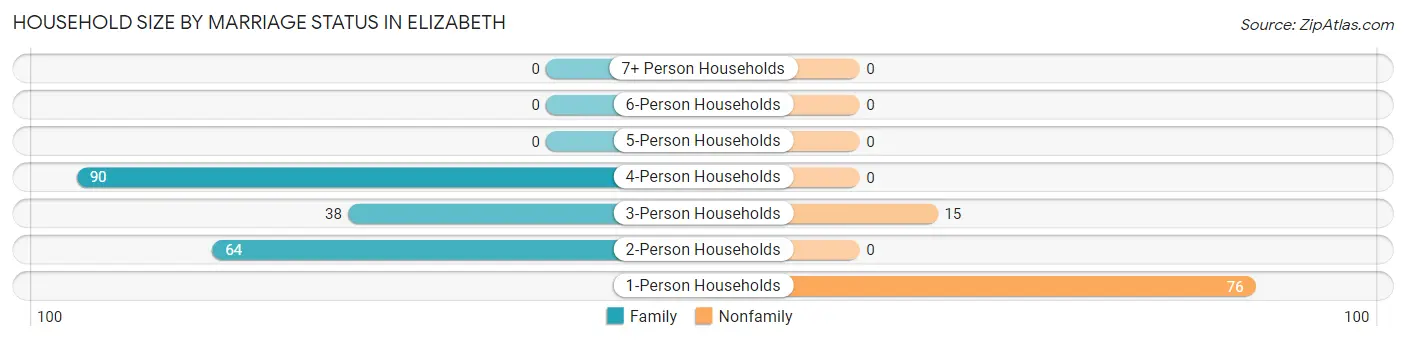
| Household Size | Family Households | Nonfamily Households |
| 1-Person Households | - | 76 (26.9%) |
| 2-Person Households | 64 (22.6%) | 0 (0.0%) |
| 3-Person Households | 38 (13.4%) | 15 (5.3%) |
| 4-Person Households | 90 (31.8%) | 0 (0.0%) |
| 5-Person Households | 0 (0.0%) | 0 (0.0%) |
| 6-Person Households | 0 (0.0%) | 0 (0.0%) |
| 7+ Person Households | 0 (0.0%) | 0 (0.0%) |
| Total | 192 (67.8%) | 91 (32.2%) |
Female Fertility in Elizabeth
Fertility by Age in Elizabeth
| Age Bracket | Women with Births | Births / 1,000 Women |
| 15 to 19 years | 0 (0.0%) | 0.0 |
| 20 to 34 years | 0 (0.0%) | 0.0 |
| 35 to 50 years | 0 (0.0%) | 0.0 |
| Total | 0 (0.0%) | 0.0 |
Fertility by Age by Marriage Status in Elizabeth
| Age Bracket | Married | Unmarried |
| 15 to 19 years | 0 (0.0%) | 0 (0.0%) |
| 20 to 34 years | 0 (0.0%) | 0 (0.0%) |
| 35 to 50 years | 0 (0.0%) | 0 (0.0%) |
| Total | 0 (0.0%) | 0 (0.0%) |
Fertility by Education in Elizabeth
| Educational Attainment | Women with Births | Births / 1,000 Women |
| Less than High School | 0 (0.0%) | 0.0 |
| High School Diploma | 0 (0.0%) | 0.0 |
| College or Associate's Degree | 0 (0.0%) | 0.0 |
| Bachelor's Degree | 0 (0.0%) | 0.0 |
| Graduate Degree | 0 (0.0%) | 0.0 |
| Total | 0 (0.0%) | 0.0 |
Fertility by Education by Marriage Status in Elizabeth
| Educational Attainment | Married | Unmarried |
| Less than High School | 0 (0.0%) | 0 (0.0%) |
| High School Diploma | 0 (0.0%) | 0 (0.0%) |
| College or Associate's Degree | 0 (0.0%) | 0 (0.0%) |
| Bachelor's Degree | 0 (0.0%) | 0 (0.0%) |
| Graduate Degree | 0 (0.0%) | 0 (0.0%) |
| Total | 0 (0.0%) | 0 (0.0%) |
Employment Characteristics in Elizabeth
Employment by Class of Employer in Elizabeth
Among the 278 employed individuals in Elizabeth, private company employees (170 | 61.2%), local government employees (44 | 15.8%), and not-for-profit organizations (42 | 15.1%) make up the most common classes of employment.
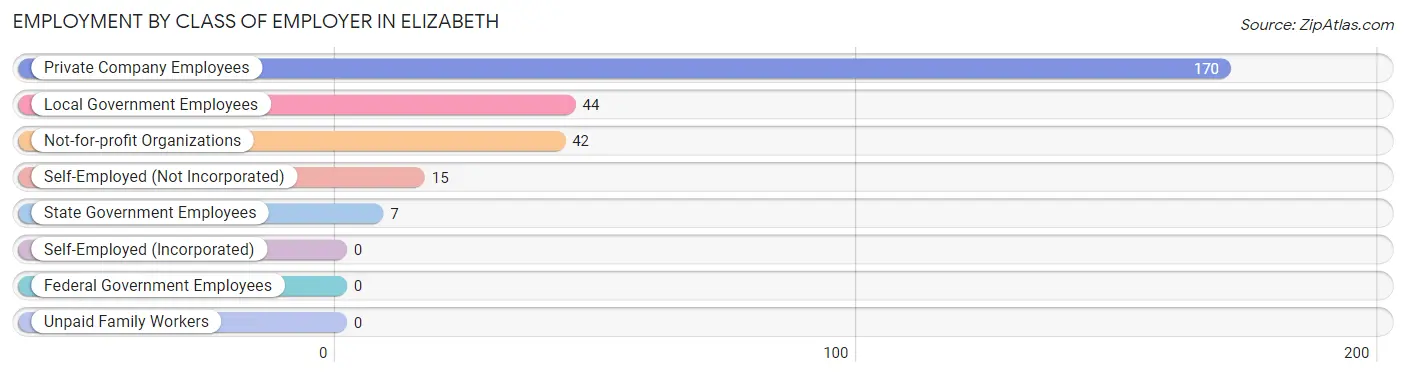
| Employer Class | # Employees | % Employees |
| Private Company Employees | 170 | 61.2% |
| Self-Employed (Incorporated) | 0 | 0.0% |
| Self-Employed (Not Incorporated) | 15 | 5.4% |
| Not-for-profit Organizations | 42 | 15.1% |
| Local Government Employees | 44 | 15.8% |
| State Government Employees | 7 | 2.5% |
| Federal Government Employees | 0 | 0.0% |
| Unpaid Family Workers | 0 | 0.0% |
| Total | 278 | 100.0% |
Employment Status by Age in Elizabeth
According to the labor force statistics for Elizabeth, out of the total population over 16 years of age (558), 50.4% or 281 individuals are in the labor force, with 1.1% or 3 of them unemployed. The age group with the highest labor force participation rate is 20 to 24 years, with 100.0% or 43 individuals in the labor force. Within the labor force, the 16 to 19 years age range has the highest percentage of unemployed individuals, with 12.0% or 3 of them being unemployed.
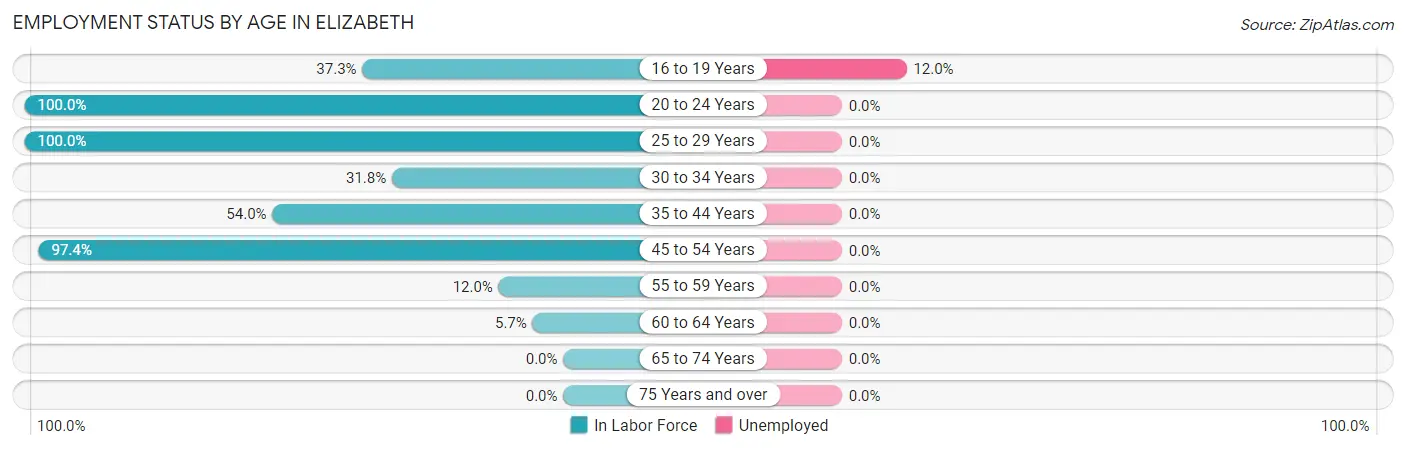
| Age Bracket | In Labor Force | Unemployed |
| 16 to 19 Years | 25 (37.3%) | 3 (12.0%) |
| 20 to 24 Years | 43 (100.0%) | 0 (0.0%) |
| 25 to 29 Years | 25 (100.0%) | 0 (0.0%) |
| 30 to 34 Years | 7 (31.8%) | 0 (0.0%) |
| 35 to 44 Years | 101 (54.0%) | 0 (0.0%) |
| 45 to 54 Years | 74 (97.4%) | 0 (0.0%) |
| 55 to 59 Years | 3 (12.0%) | 0 (0.0%) |
| 60 to 64 Years | 3 (5.7%) | 0 (0.0%) |
| 65 to 74 Years | 0 (0.0%) | 0 (0.0%) |
| 75 Years and over | 0 (0.0%) | 0 (0.0%) |
| Total | 281 (50.4%) | 3 (1.1%) |
Employment Status by Educational Attainment in Elizabeth
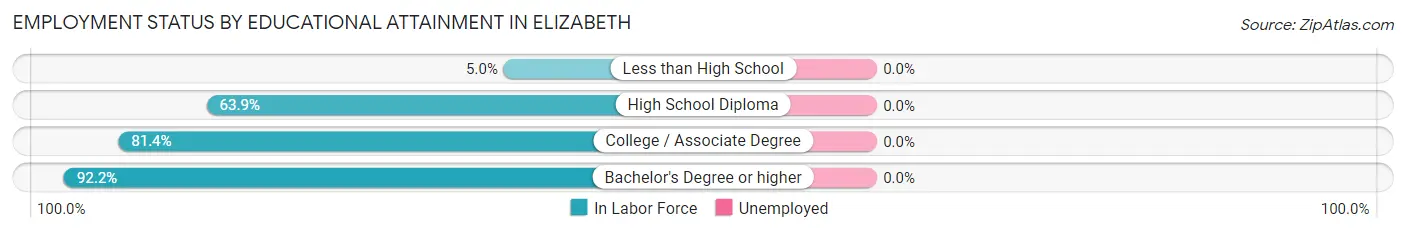
| Educational Attainment | In Labor Force | Unemployed |
| Less than High School | 6 (5.0%) | 0 (0.0%) |
| High School Diploma | 69 (63.9%) | 0 (0.0%) |
| College / Associate Degree | 79 (81.4%) | 0 (0.0%) |
| Bachelor's Degree or higher | 59 (92.2%) | 0 (0.0%) |
| Total | 213 (54.9%) | 0 (0.0%) |
Employment Occupations by Sex in Elizabeth
Management, Business, Science and Arts Occupations
The most common Management, Business, Science and Arts occupations in Elizabeth are Community & Social Service (86 | 30.9%), Education Instruction & Library (76 | 27.3%), Management (20 | 7.2%), and Education, Arts & Media (10 | 3.6%).
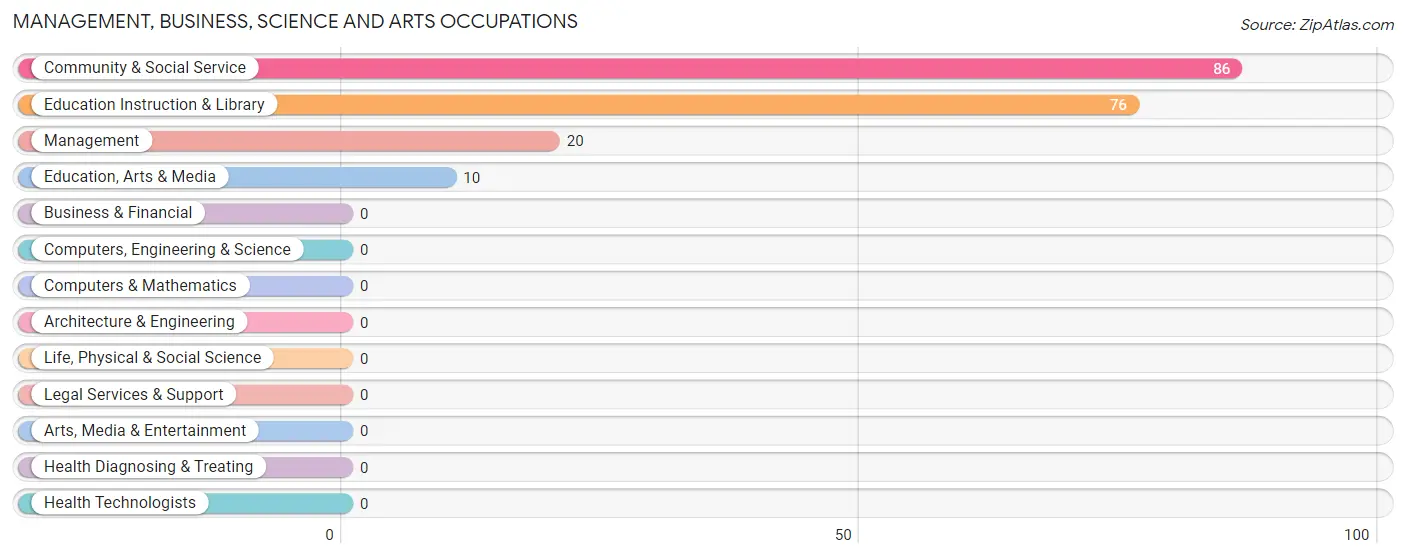
Management, Business, Science and Arts Occupations by Sex
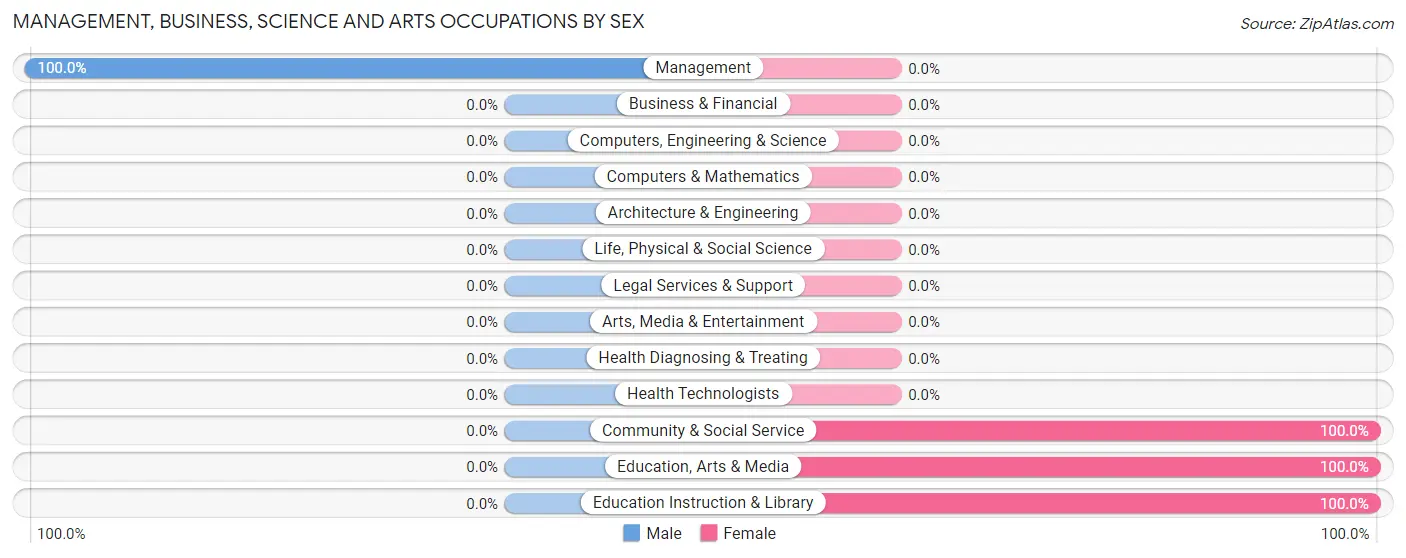
| Occupation | Male | Female |
| Management | 20 (100.0%) | 0 (0.0%) |
| Business & Financial | 0 (0.0%) | 0 (0.0%) |
| Computers, Engineering & Science | 0 (0.0%) | 0 (0.0%) |
| Computers & Mathematics | 0 (0.0%) | 0 (0.0%) |
| Architecture & Engineering | 0 (0.0%) | 0 (0.0%) |
| Life, Physical & Social Science | 0 (0.0%) | 0 (0.0%) |
| Community & Social Service | 0 (0.0%) | 86 (100.0%) |
| Education, Arts & Media | 0 (0.0%) | 10 (100.0%) |
| Legal Services & Support | 0 (0.0%) | 0 (0.0%) |
| Education Instruction & Library | 0 (0.0%) | 76 (100.0%) |
| Arts, Media & Entertainment | 0 (0.0%) | 0 (0.0%) |
| Health Diagnosing & Treating | 0 (0.0%) | 0 (0.0%) |
| Health Technologists | 0 (0.0%) | 0 (0.0%) |
| Total (Category) | 20 (18.9%) | 86 (81.1%) |
| Total (Overall) | 112 (40.3%) | 166 (59.7%) |
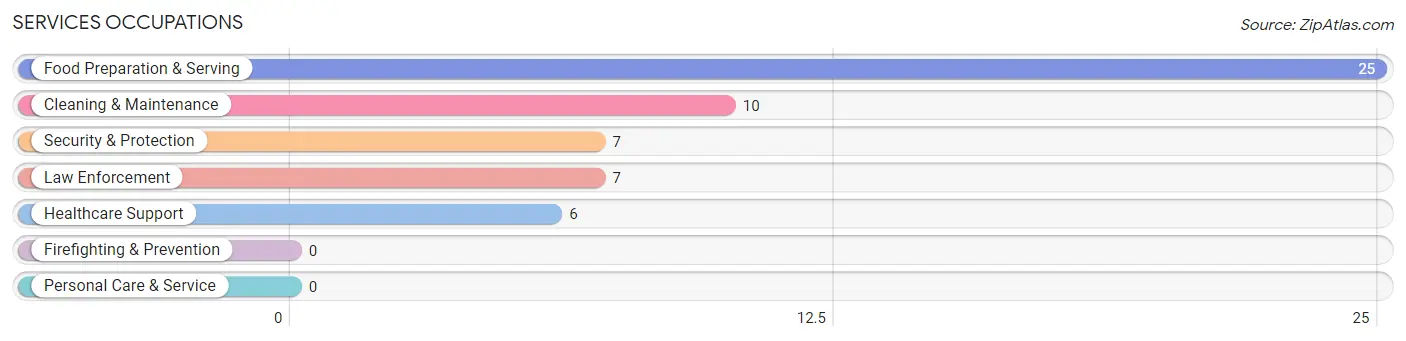
Services Occupations
The most common Services occupations in Elizabeth are Food Preparation & Serving (25 | 9.0%), Cleaning & Maintenance (10 | 3.6%), Security & Protection (7 | 2.5%), Law Enforcement (7 | 2.5%), and Healthcare Support (6 | 2.2%).
Services Occupations by Sex
Within the Services occupations in Elizabeth, the most male-oriented occupations are Security & Protection (100.0%), Law Enforcement (100.0%), and Food Preparation & Serving (32.0%), while the most female-oriented occupations are Healthcare Support (100.0%), Cleaning & Maintenance (100.0%), and Food Preparation & Serving (68.0%).
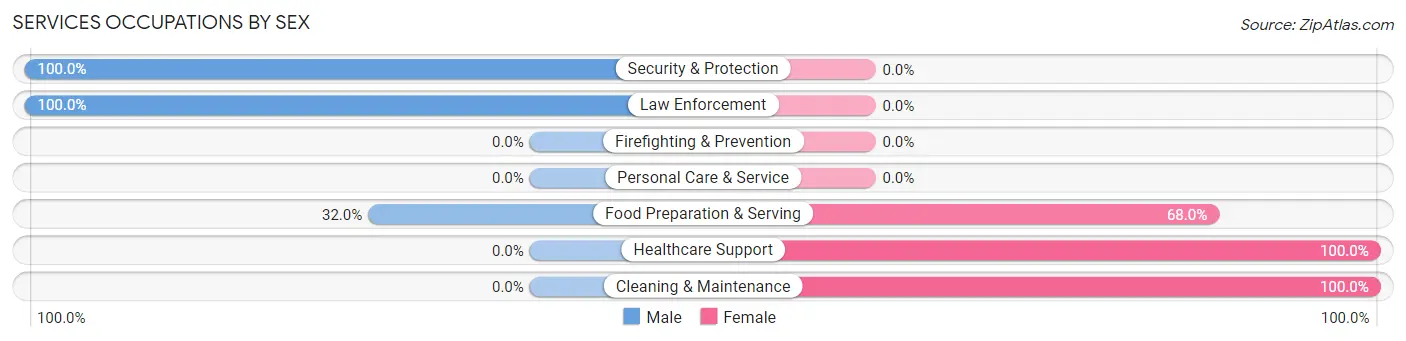
| Occupation | Male | Female |
| Healthcare Support | 0 (0.0%) | 6 (100.0%) |
| Security & Protection | 7 (100.0%) | 0 (0.0%) |
| Firefighting & Prevention | 0 (0.0%) | 0 (0.0%) |
| Law Enforcement | 7 (100.0%) | 0 (0.0%) |
| Food Preparation & Serving | 8 (32.0%) | 17 (68.0%) |
| Cleaning & Maintenance | 0 (0.0%) | 10 (100.0%) |
| Personal Care & Service | 0 (0.0%) | 0 (0.0%) |
| Total (Category) | 15 (31.2%) | 33 (68.8%) |
| Total (Overall) | 112 (40.3%) | 166 (59.7%) |
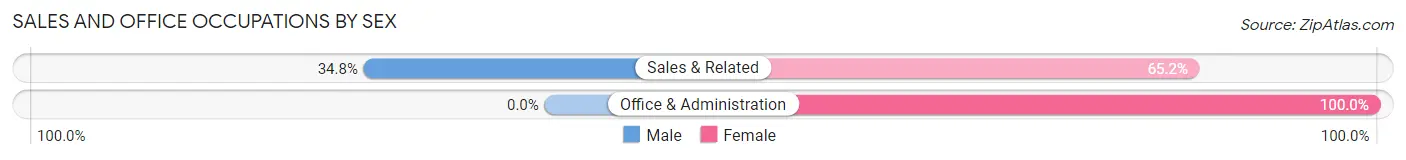
Sales and Office Occupations
The most common Sales and Office occupations in Elizabeth are Sales & Related (46 | 16.6%), and Office & Administration (4 | 1.4%).
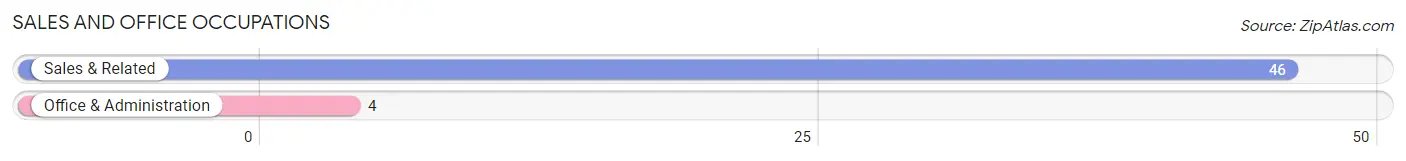
Sales and Office Occupations by Sex
| Occupation | Male | Female |
| Sales & Related | 16 (34.8%) | 30 (65.2%) |
| Office & Administration | 0 (0.0%) | 4 (100.0%) |
| Total (Category) | 16 (32.0%) | 34 (68.0%) |
| Total (Overall) | 112 (40.3%) | 166 (59.7%) |
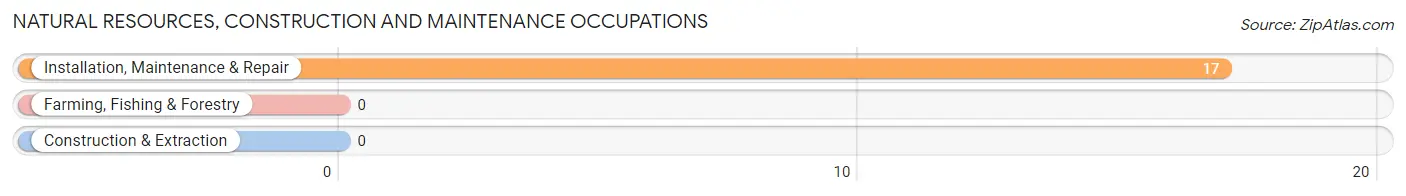
Natural Resources, Construction and Maintenance Occupations
The most common Natural Resources, Construction and Maintenance occupations in Elizabeth are , and Installation, Maintenance & Repair (17 | 6.1%).
Natural Resources, Construction and Maintenance Occupations by Sex
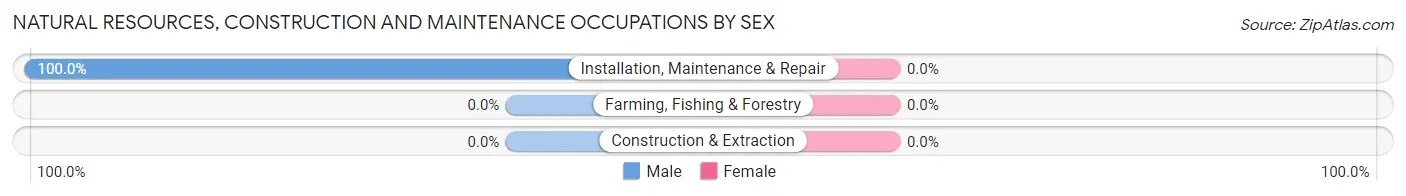
| Occupation | Male | Female |
| Farming, Fishing & Forestry | 0 (0.0%) | 0 (0.0%) |
| Construction & Extraction | 0 (0.0%) | 0 (0.0%) |
| Installation, Maintenance & Repair | 17 (100.0%) | 0 (0.0%) |
| Total (Category) | 17 (100.0%) | 0 (0.0%) |
| Total (Overall) | 112 (40.3%) | 166 (59.7%) |
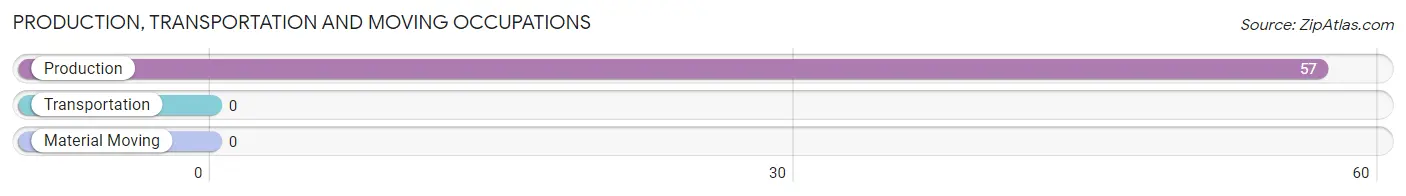
Production, Transportation and Moving Occupations
The most common Production, Transportation and Moving occupations in Elizabeth are , and Production (57 | 20.5%).
Production, Transportation and Moving Occupations by Sex
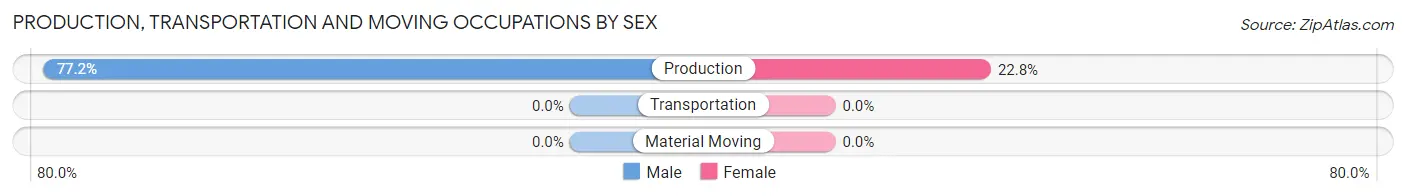
| Occupation | Male | Female |
| Production | 44 (77.2%) | 13 (22.8%) |
| Transportation | 0 (0.0%) | 0 (0.0%) |
| Material Moving | 0 (0.0%) | 0 (0.0%) |
| Total (Category) | 44 (77.2%) | 13 (22.8%) |
| Total (Overall) | 112 (40.3%) | 166 (59.7%) |
Employment Industries by Sex in Elizabeth
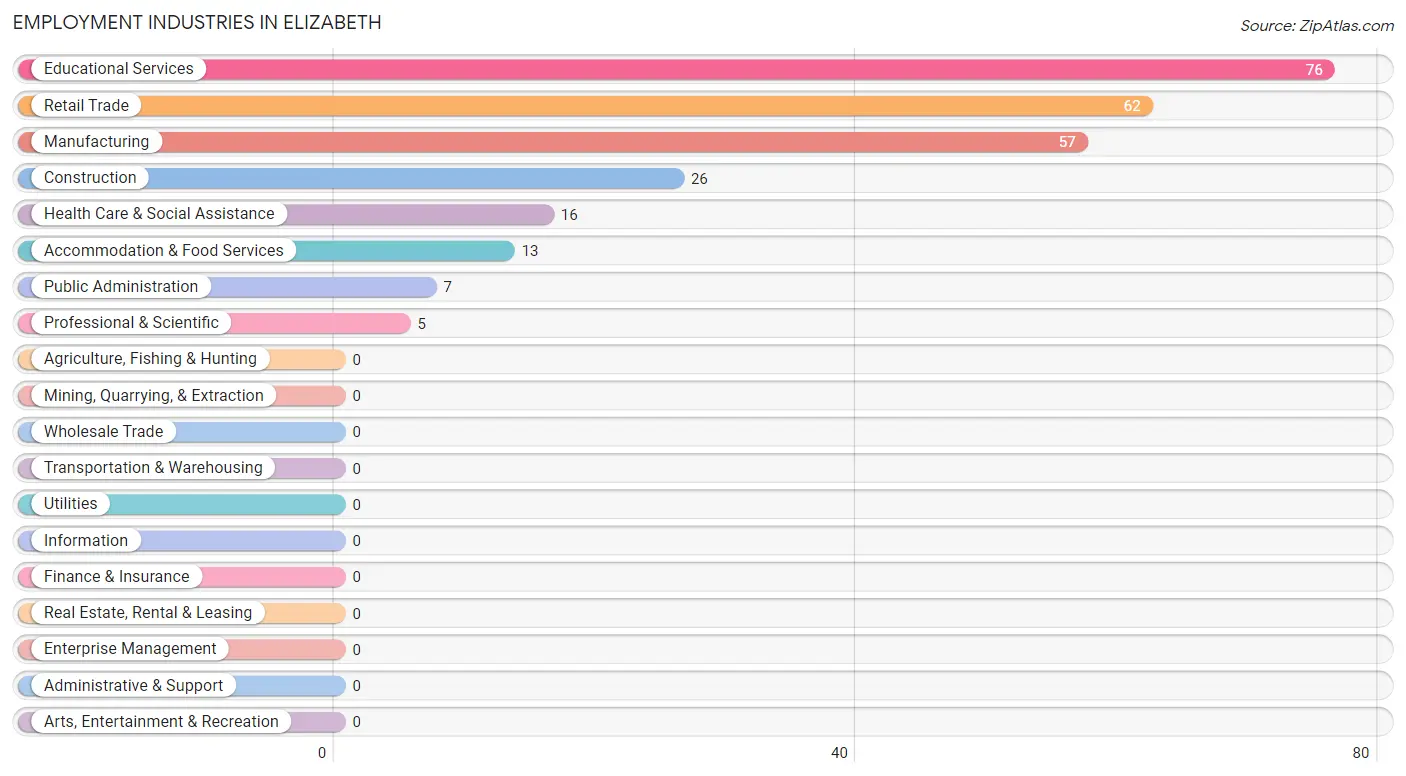
Employment Industries in Elizabeth
The major employment industries in Elizabeth include Educational Services (76 | 27.3%), Retail Trade (62 | 22.3%), Manufacturing (57 | 20.5%), Construction (26 | 9.3%), and Health Care & Social Assistance (16 | 5.8%).
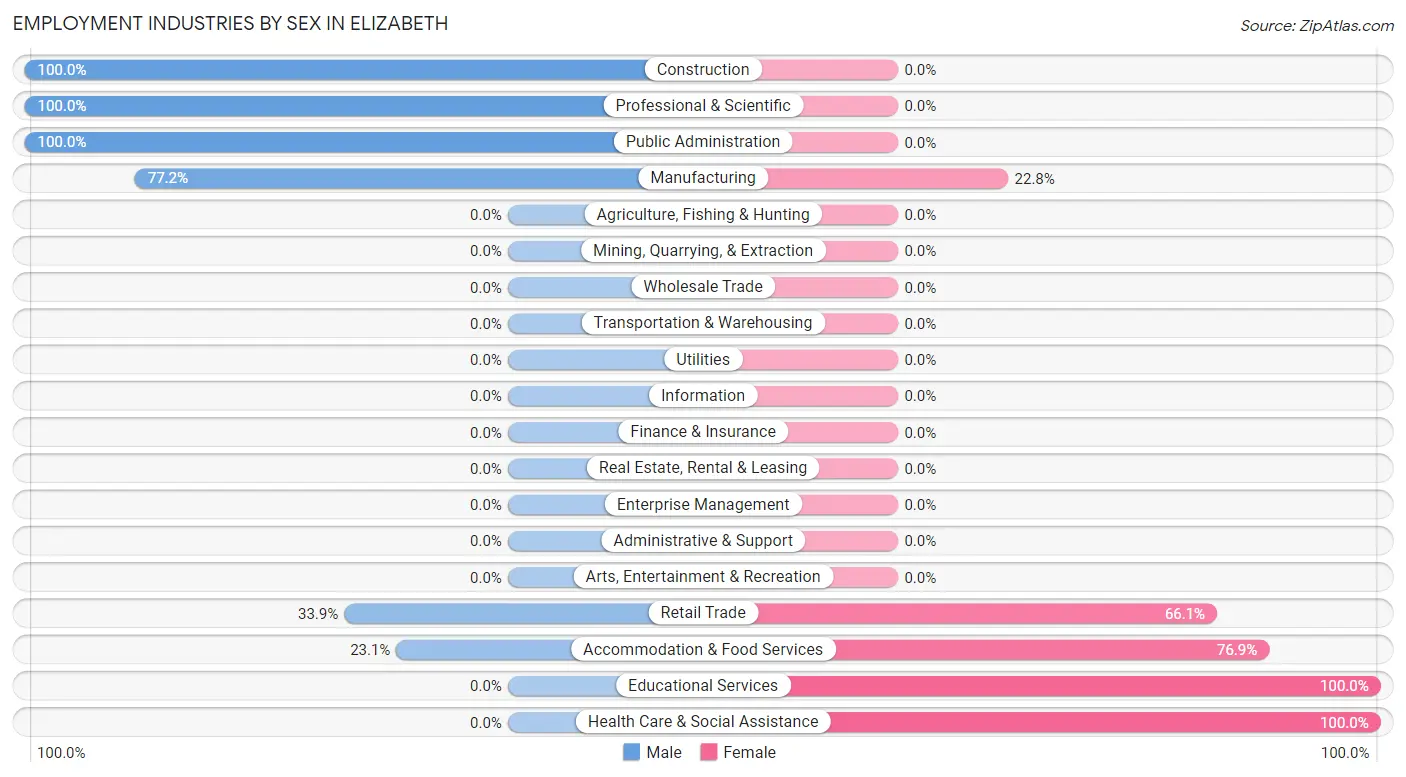
Employment Industries by Sex in Elizabeth
The Elizabeth industries that see more men than women are Construction (100.0%), Professional & Scientific (100.0%), and Public Administration (100.0%), whereas the industries that tend to have a higher number of women are Educational Services (100.0%), Health Care & Social Assistance (100.0%), and Accommodation & Food Services (76.9%).
| Industry | Male | Female |
| Agriculture, Fishing & Hunting | 0 (0.0%) | 0 (0.0%) |
| Mining, Quarrying, & Extraction | 0 (0.0%) | 0 (0.0%) |
| Construction | 26 (100.0%) | 0 (0.0%) |
| Manufacturing | 44 (77.2%) | 13 (22.8%) |
| Wholesale Trade | 0 (0.0%) | 0 (0.0%) |
| Retail Trade | 21 (33.9%) | 41 (66.1%) |
| Transportation & Warehousing | 0 (0.0%) | 0 (0.0%) |
| Utilities | 0 (0.0%) | 0 (0.0%) |
| Information | 0 (0.0%) | 0 (0.0%) |
| Finance & Insurance | 0 (0.0%) | 0 (0.0%) |
| Real Estate, Rental & Leasing | 0 (0.0%) | 0 (0.0%) |
| Professional & Scientific | 5 (100.0%) | 0 (0.0%) |
| Enterprise Management | 0 (0.0%) | 0 (0.0%) |
| Administrative & Support | 0 (0.0%) | 0 (0.0%) |
| Educational Services | 0 (0.0%) | 76 (100.0%) |
| Health Care & Social Assistance | 0 (0.0%) | 16 (100.0%) |
| Arts, Entertainment & Recreation | 0 (0.0%) | 0 (0.0%) |
| Accommodation & Food Services | 3 (23.1%) | 10 (76.9%) |
| Public Administration | 7 (100.0%) | 0 (0.0%) |
| Total | 112 (40.3%) | 166 (59.7%) |
Education in Elizabeth
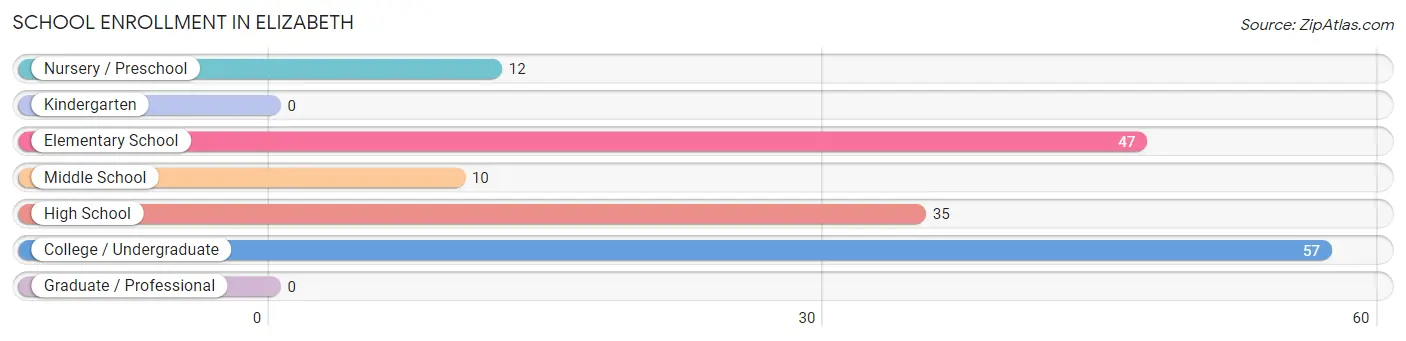
School Enrollment in Elizabeth
The most common levels of schooling among the 161 students in Elizabeth are college / undergraduate (57 | 35.4%), elementary school (47 | 29.2%), and high school (35 | 21.7%).
| School Level | # Students | % Students |
| Nursery / Preschool | 12 | 7.4% |
| Kindergarten | 0 | 0.0% |
| Elementary School | 47 | 29.2% |
| Middle School | 10 | 6.2% |
| High School | 35 | 21.7% |
| College / Undergraduate | 57 | 35.4% |
| Graduate / Professional | 0 | 0.0% |
| Total | 161 | 100.0% |
School Enrollment by Age by Funding Source in Elizabeth
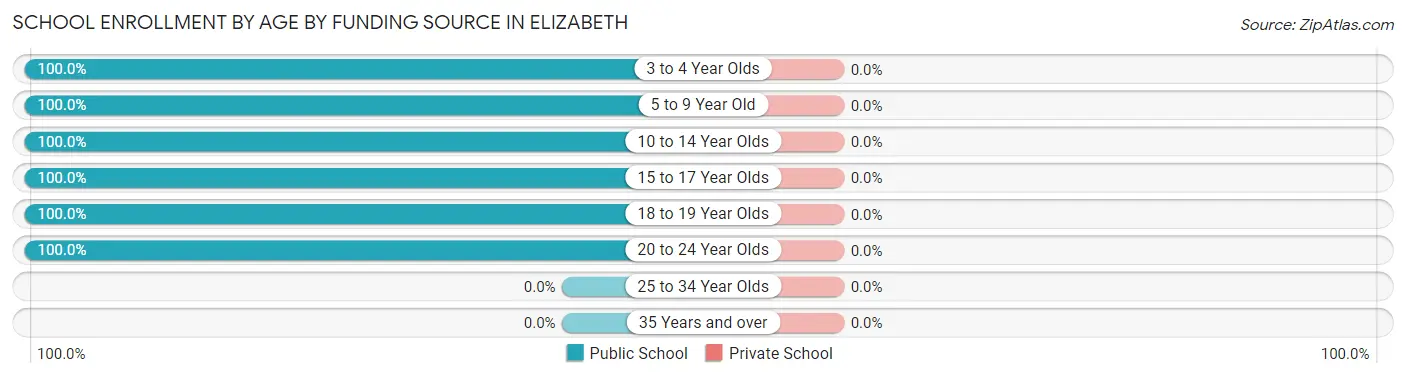
| Age Bracket | Public School | Private School |
| 3 to 4 Year Olds | 12 (100.0%) | 0 (0.0%) |
| 5 to 9 Year Old | 22 (100.0%) | 0 (0.0%) |
| 10 to 14 Year Olds | 35 (100.0%) | 0 (0.0%) |
| 15 to 17 Year Olds | 35 (100.0%) | 0 (0.0%) |
| 18 to 19 Year Olds | 25 (100.0%) | 0 (0.0%) |
| 20 to 24 Year Olds | 32 (100.0%) | 0 (0.0%) |
| 25 to 34 Year Olds | 0 (0.0%) | 0 (0.0%) |
| 35 Years and over | 0 (0.0%) | 0 (0.0%) |
| Total | 161 (100.0%) | 0 (0.0%) |
Educational Attainment by Field of Study in Elizabeth
Education (49 | 76.6%), and bio, nature & agricultural (15 | 23.4%) are the most common fields of study among 64 individuals in Elizabeth who have obtained a bachelor's degree or higher.
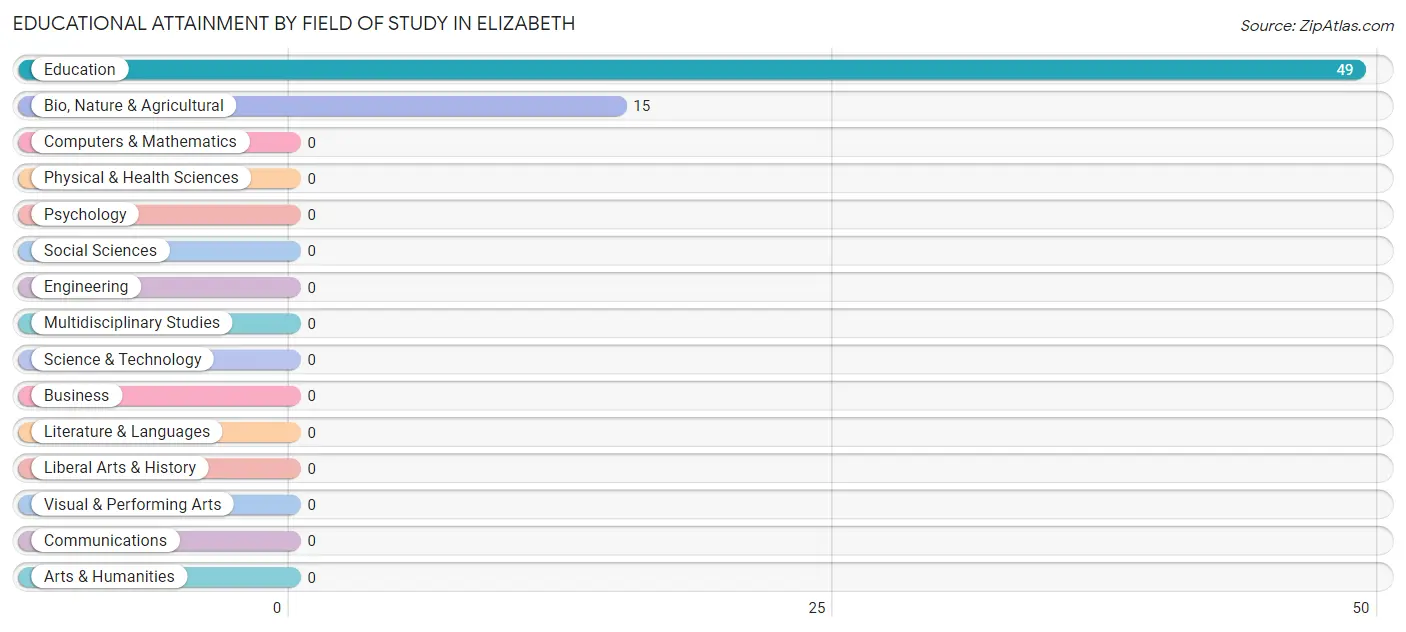
| Field of Study | # Graduates | % Graduates |
| Computers & Mathematics | 0 | 0.0% |
| Bio, Nature & Agricultural | 15 | 23.4% |
| Physical & Health Sciences | 0 | 0.0% |
| Psychology | 0 | 0.0% |
| Social Sciences | 0 | 0.0% |
| Engineering | 0 | 0.0% |
| Multidisciplinary Studies | 0 | 0.0% |
| Science & Technology | 0 | 0.0% |
| Business | 0 | 0.0% |
| Education | 49 | 76.6% |
| Literature & Languages | 0 | 0.0% |
| Liberal Arts & History | 0 | 0.0% |
| Visual & Performing Arts | 0 | 0.0% |
| Communications | 0 | 0.0% |
| Arts & Humanities | 0 | 0.0% |
| Total | 64 | 100.0% |
Transportation & Commute in Elizabeth
Vehicle Availability by Sex in Elizabeth
The most prevalent vehicle ownership categories in Elizabeth are males with 4 vehicles (47, accounting for 42.0%) and females with 4 vehicles (76, making up 28.3%).
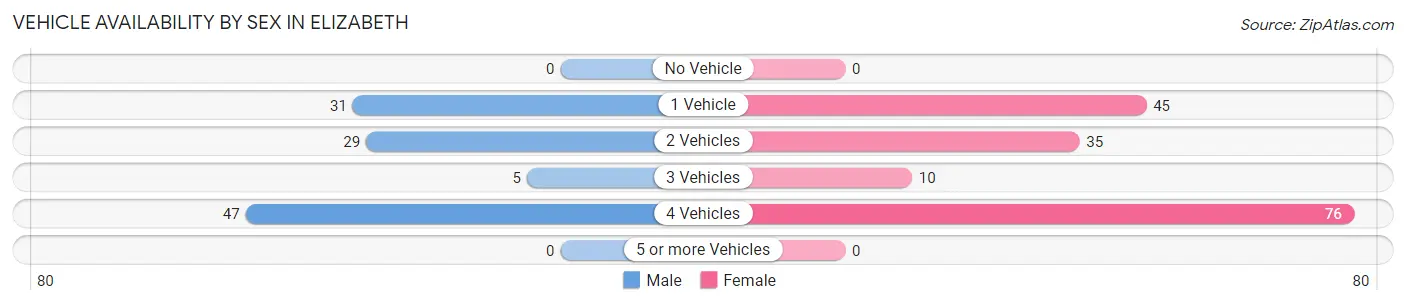
| Vehicles Available | Male | Female |
| No Vehicle | 0 (0.0%) | 0 (0.0%) |
| 1 Vehicle | 31 (27.7%) | 45 (27.1%) |
| 2 Vehicles | 29 (25.9%) | 35 (21.1%) |
| 3 Vehicles | 5 (4.5%) | 10 (6.0%) |
| 4 Vehicles | 47 (42.0%) | 76 (45.8%) |
| 5 or more Vehicles | 0 (0.0%) | 0 (0.0%) |
| Total | 112 (100.0%) | 166 (100.0%) |
Commute Time in Elizabeth
The most frequently occuring commute durations in Elizabeth are 30 to 34 minutes (67 commuters, 25.9%), less than 5 minutes (60 commuters, 23.2%), and 45 to 59 minutes (46 commuters, 17.8%).
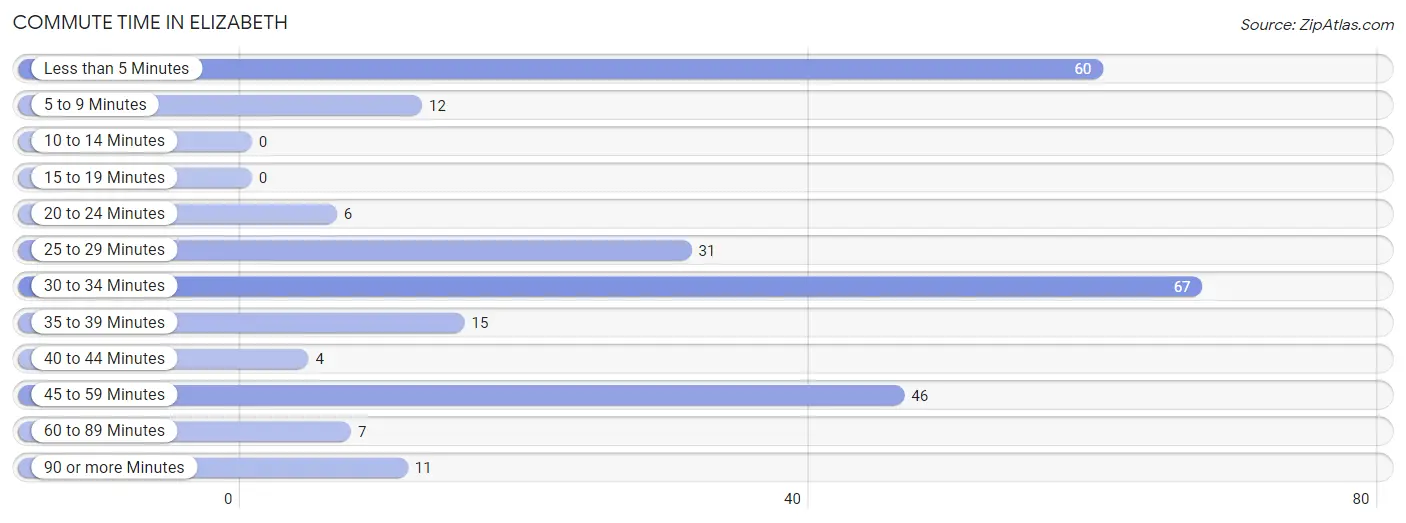
| Commute Time | # Commuters | % Commuters |
| Less than 5 Minutes | 60 | 23.2% |
| 5 to 9 Minutes | 12 | 4.6% |
| 10 to 14 Minutes | 0 | 0.0% |
| 15 to 19 Minutes | 0 | 0.0% |
| 20 to 24 Minutes | 6 | 2.3% |
| 25 to 29 Minutes | 31 | 12.0% |
| 30 to 34 Minutes | 67 | 25.9% |
| 35 to 39 Minutes | 15 | 5.8% |
| 40 to 44 Minutes | 4 | 1.5% |
| 45 to 59 Minutes | 46 | 17.8% |
| 60 to 89 Minutes | 7 | 2.7% |
| 90 or more Minutes | 11 | 4.3% |
Commute Time by Sex in Elizabeth
The most common commute times in Elizabeth are 25 to 29 minutes (31 commuters, 29.0%) for males and 30 to 34 minutes (54 commuters, 35.5%) for females.
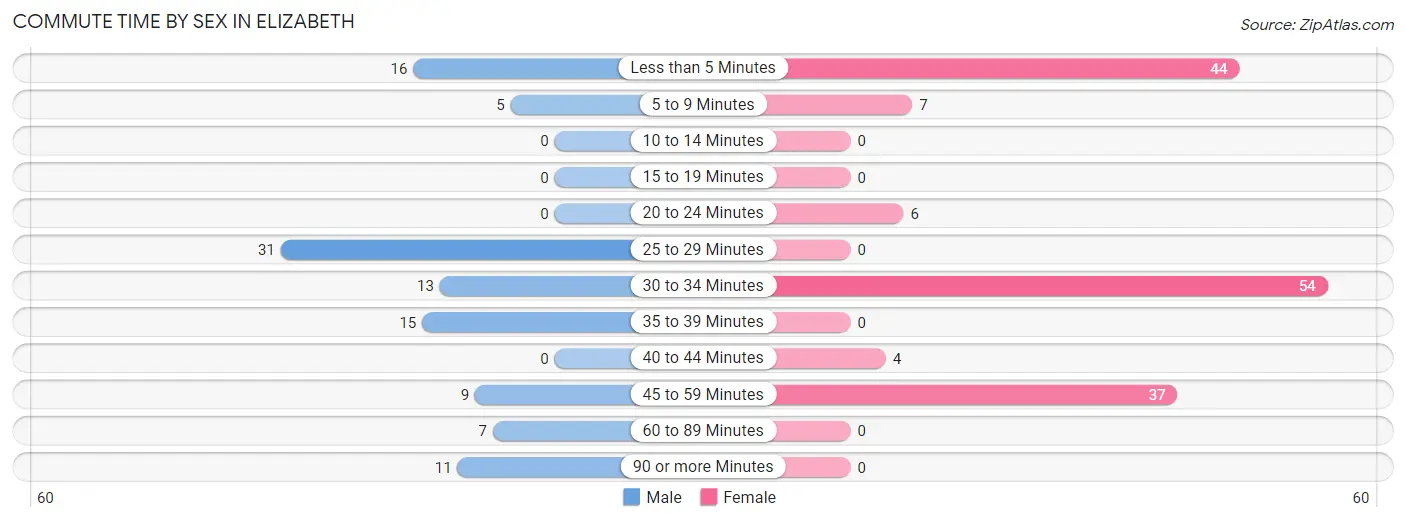
| Commute Time | Male | Female |
| Less than 5 Minutes | 16 (14.9%) | 44 (28.9%) |
| 5 to 9 Minutes | 5 (4.7%) | 7 (4.6%) |
| 10 to 14 Minutes | 0 (0.0%) | 0 (0.0%) |
| 15 to 19 Minutes | 0 (0.0%) | 0 (0.0%) |
| 20 to 24 Minutes | 0 (0.0%) | 6 (4.0%) |
| 25 to 29 Minutes | 31 (29.0%) | 0 (0.0%) |
| 30 to 34 Minutes | 13 (12.1%) | 54 (35.5%) |
| 35 to 39 Minutes | 15 (14.0%) | 0 (0.0%) |
| 40 to 44 Minutes | 0 (0.0%) | 4 (2.6%) |
| 45 to 59 Minutes | 9 (8.4%) | 37 (24.3%) |
| 60 to 89 Minutes | 7 (6.5%) | 0 (0.0%) |
| 90 or more Minutes | 11 (10.3%) | 0 (0.0%) |
Time of Departure to Work by Sex in Elizabeth
The most frequent times of departure to work in Elizabeth are 12:00 AM to 4:59 AM (60, 56.1%) for males and 7:00 AM to 7:29 AM (51, 33.6%) for females.
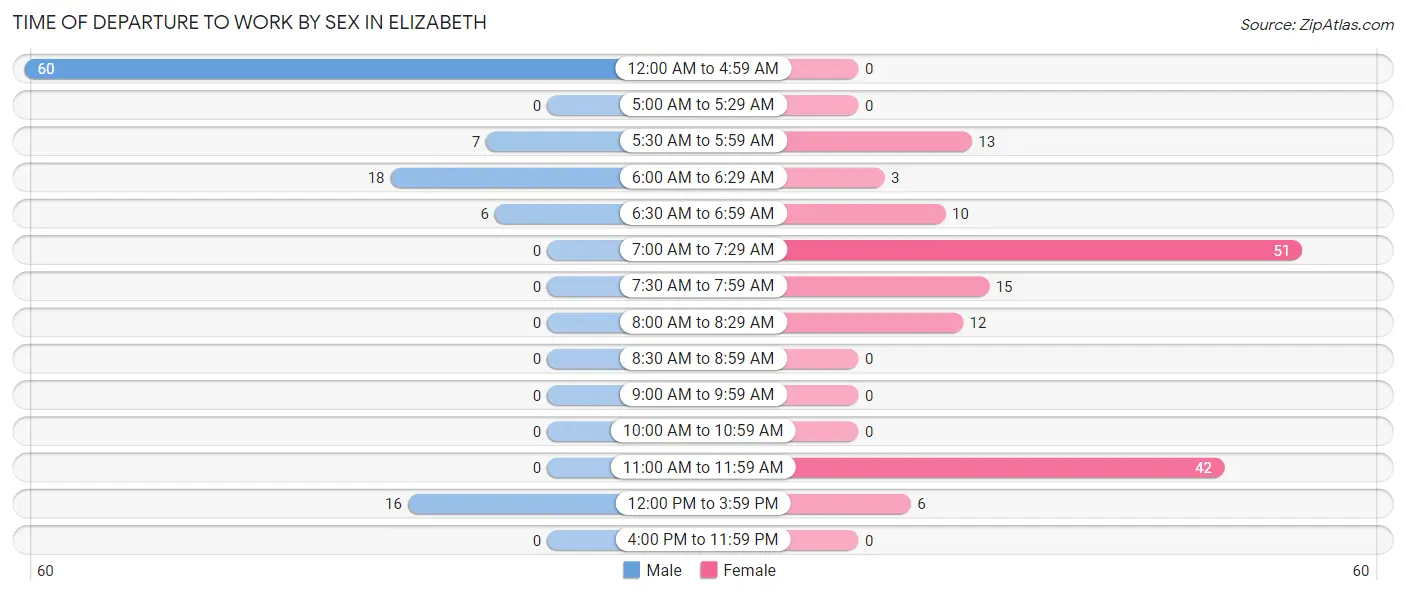
| Time of Departure | Male | Female |
| 12:00 AM to 4:59 AM | 60 (56.1%) | 0 (0.0%) |
| 5:00 AM to 5:29 AM | 0 (0.0%) | 0 (0.0%) |
| 5:30 AM to 5:59 AM | 7 (6.5%) | 13 (8.6%) |
| 6:00 AM to 6:29 AM | 18 (16.8%) | 3 (2.0%) |
| 6:30 AM to 6:59 AM | 6 (5.6%) | 10 (6.6%) |
| 7:00 AM to 7:29 AM | 0 (0.0%) | 51 (33.6%) |
| 7:30 AM to 7:59 AM | 0 (0.0%) | 15 (9.9%) |
| 8:00 AM to 8:29 AM | 0 (0.0%) | 12 (7.9%) |
| 8:30 AM to 8:59 AM | 0 (0.0%) | 0 (0.0%) |
| 9:00 AM to 9:59 AM | 0 (0.0%) | 0 (0.0%) |
| 10:00 AM to 10:59 AM | 0 (0.0%) | 0 (0.0%) |
| 11:00 AM to 11:59 AM | 0 (0.0%) | 42 (27.6%) |
| 12:00 PM to 3:59 PM | 16 (14.9%) | 6 (4.0%) |
| 4:00 PM to 11:59 PM | 0 (0.0%) | 0 (0.0%) |
| Total | 107 (100.0%) | 152 (100.0%) |
Housing Occupancy in Elizabeth
Occupancy by Ownership in Elizabeth
Of the total 283 dwellings in Elizabeth, owner-occupied units account for 125 (44.2%), while renter-occupied units make up 158 (55.8%).
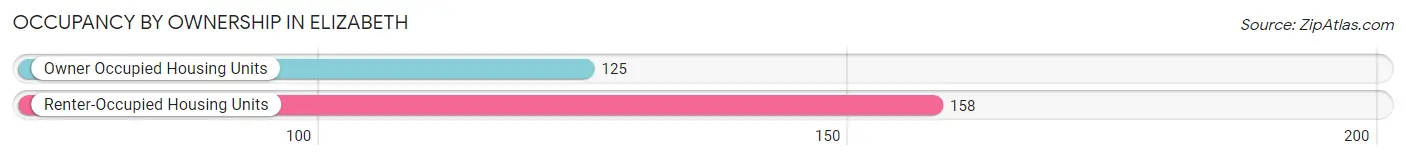
| Occupancy | # Housing Units | % Housing Units |
| Owner Occupied Housing Units | 125 | 44.2% |
| Renter-Occupied Housing Units | 158 | 55.8% |
| Total Occupied Housing Units | 283 | 100.0% |
Occupancy by Household Size in Elizabeth
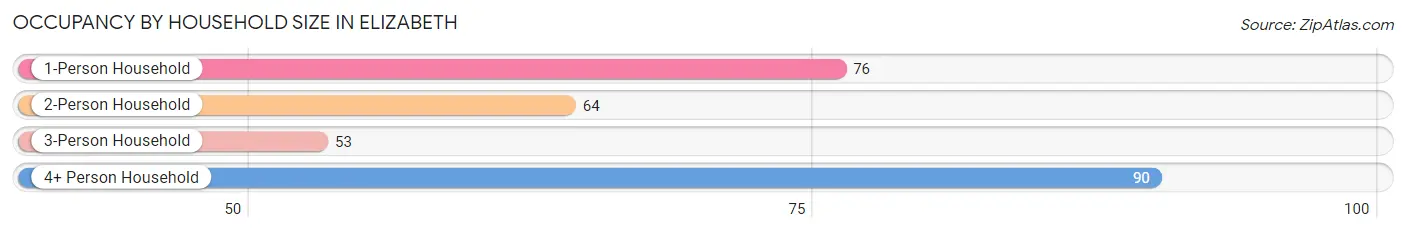
| Household Size | # Housing Units | % Housing Units |
| 1-Person Household | 76 | 26.9% |
| 2-Person Household | 64 | 22.6% |
| 3-Person Household | 53 | 18.7% |
| 4+ Person Household | 90 | 31.8% |
| Total Housing Units | 283 | 100.0% |
Occupancy by Ownership by Household Size in Elizabeth
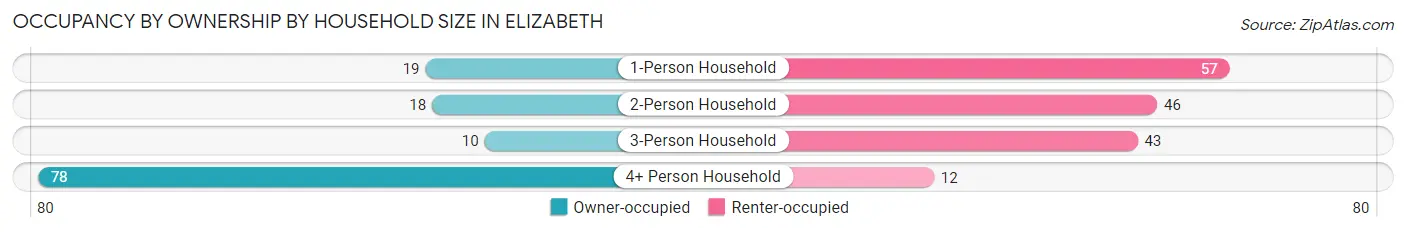
| Household Size | Owner-occupied | Renter-occupied |
| 1-Person Household | 19 (25.0%) | 57 (75.0%) |
| 2-Person Household | 18 (28.1%) | 46 (71.9%) |
| 3-Person Household | 10 (18.9%) | 43 (81.1%) |
| 4+ Person Household | 78 (86.7%) | 12 (13.3%) |
| Total Housing Units | 125 (44.2%) | 158 (55.8%) |
Occupancy by Educational Attainment in Elizabeth
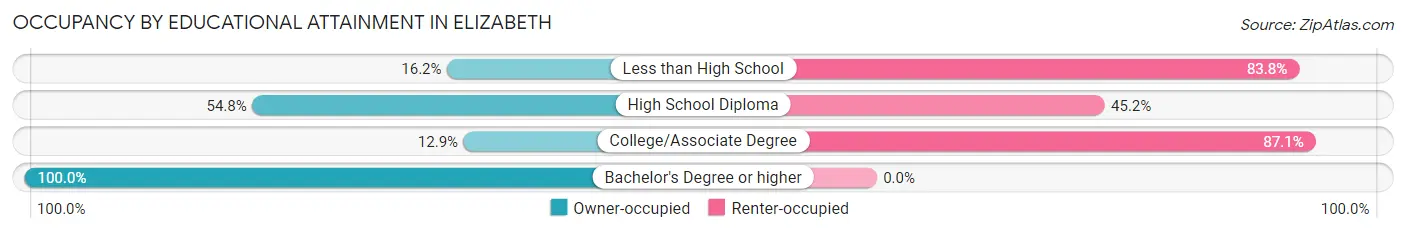
| Household Size | Owner-occupied | Renter-occupied |
| Less than High School | 11 (16.2%) | 57 (83.8%) |
| High School Diploma | 57 (54.8%) | 47 (45.2%) |
| College/Associate Degree | 8 (12.9%) | 54 (87.1%) |
| Bachelor's Degree or higher | 49 (100.0%) | 0 (0.0%) |
Occupancy by Age of Householder in Elizabeth
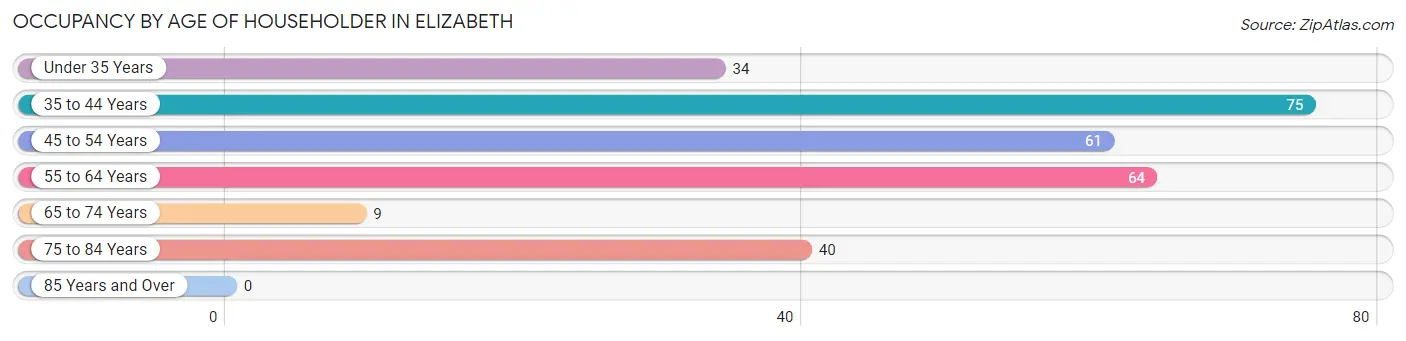
| Age Bracket | # Households | % Households |
| Under 35 Years | 34 | 12.0% |
| 35 to 44 Years | 75 | 26.5% |
| 45 to 54 Years | 61 | 21.5% |
| 55 to 64 Years | 64 | 22.6% |
| 65 to 74 Years | 9 | 3.2% |
| 75 to 84 Years | 40 | 14.1% |
| 85 Years and Over | 0 | 0.0% |
| Total | 283 | 100.0% |
Housing Finances in Elizabeth
Median Income by Occupancy in Elizabeth
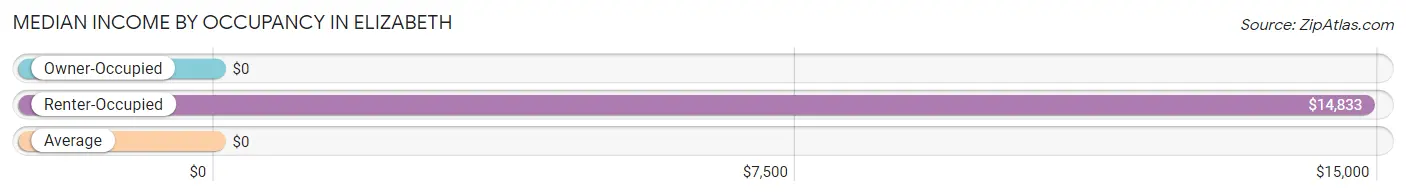
| Occupancy Type | # Households | Median Income |
| Owner-Occupied | 125 (44.2%) | $0 |
| Renter-Occupied | 158 (55.8%) | $14,833 |
| Average | 283 (100.0%) | $0 |
Occupancy by Householder Income Bracket in Elizabeth
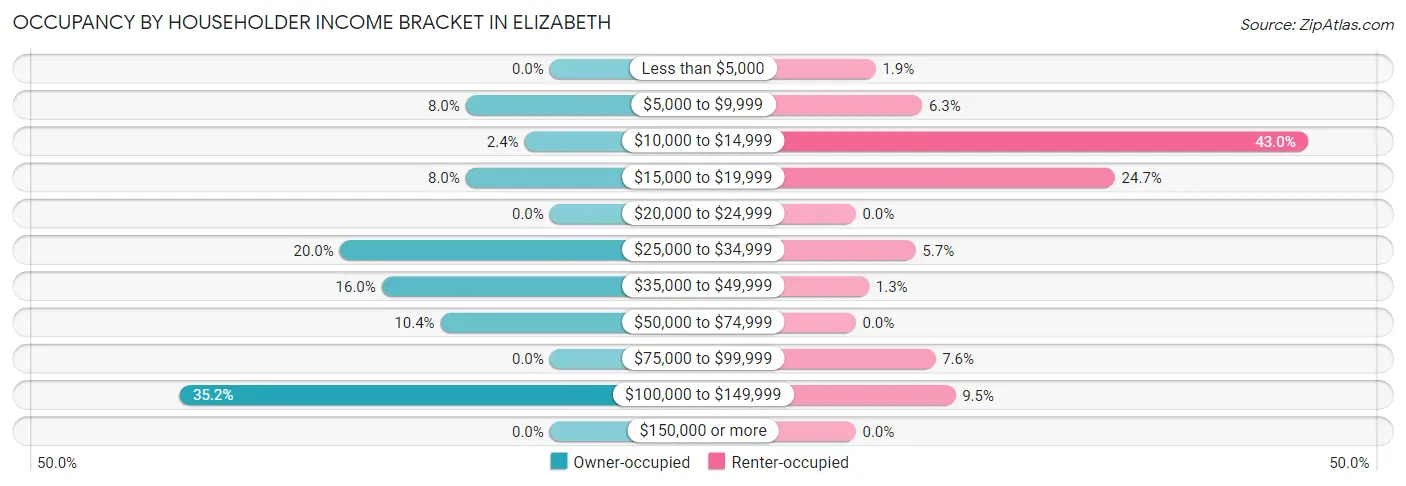
| Income Bracket | Owner-occupied | Renter-occupied |
| Less than $5,000 | 0 (0.0%) | 3 (1.9%) |
| $5,000 to $9,999 | 10 (8.0%) | 10 (6.3%) |
| $10,000 to $14,999 | 3 (2.4%) | 68 (43.0%) |
| $15,000 to $19,999 | 10 (8.0%) | 39 (24.7%) |
| $20,000 to $24,999 | 0 (0.0%) | 0 (0.0%) |
| $25,000 to $34,999 | 25 (20.0%) | 9 (5.7%) |
| $35,000 to $49,999 | 20 (16.0%) | 2 (1.3%) |
| $50,000 to $74,999 | 13 (10.4%) | 0 (0.0%) |
| $75,000 to $99,999 | 0 (0.0%) | 12 (7.6%) |
| $100,000 to $149,999 | 44 (35.2%) | 15 (9.5%) |
| $150,000 or more | 0 (0.0%) | 0 (0.0%) |
| Total | 125 (100.0%) | 158 (100.0%) |
Monthly Housing Cost Tiers in Elizabeth
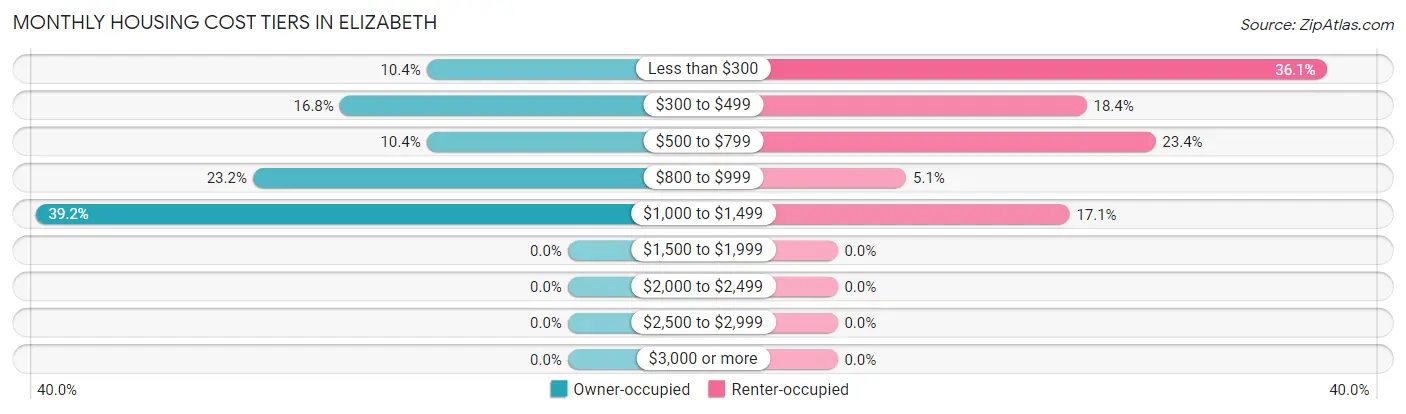
| Monthly Cost | Owner-occupied | Renter-occupied |
| Less than $300 | 13 (10.4%) | 57 (36.1%) |
| $300 to $499 | 21 (16.8%) | 29 (18.3%) |
| $500 to $799 | 13 (10.4%) | 37 (23.4%) |
| $800 to $999 | 29 (23.2%) | 8 (5.1%) |
| $1,000 to $1,499 | 49 (39.2%) | 27 (17.1%) |
| $1,500 to $1,999 | 0 (0.0%) | 0 (0.0%) |
| $2,000 to $2,499 | 0 (0.0%) | 0 (0.0%) |
| $2,500 to $2,999 | 0 (0.0%) | 0 (0.0%) |
| $3,000 or more | 0 (0.0%) | 0 (0.0%) |
| Total | 125 (100.0%) | 158 (100.0%) |
Physical Housing Characteristics in Elizabeth
Housing Structures in Elizabeth
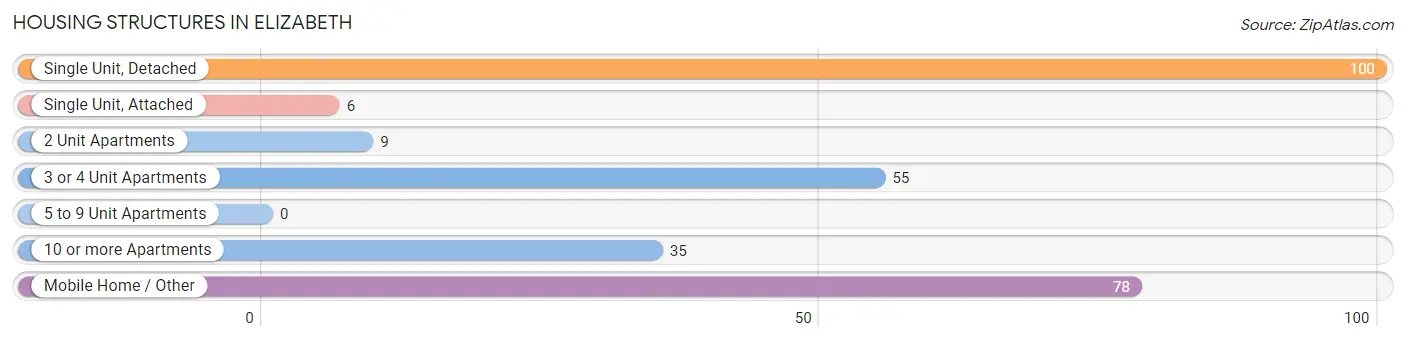
| Structure Type | # Housing Units | % Housing Units |
| Single Unit, Detached | 100 | 35.3% |
| Single Unit, Attached | 6 | 2.1% |
| 2 Unit Apartments | 9 | 3.2% |
| 3 or 4 Unit Apartments | 55 | 19.4% |
| 5 to 9 Unit Apartments | 0 | 0.0% |
| 10 or more Apartments | 35 | 12.4% |
| Mobile Home / Other | 78 | 27.6% |
| Total | 283 | 100.0% |
Housing Structures by Occupancy in Elizabeth
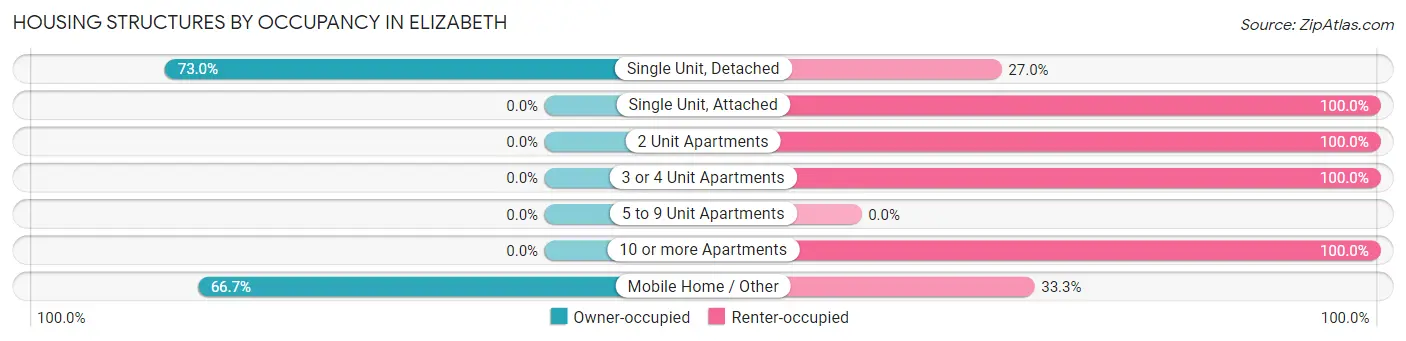
| Structure Type | Owner-occupied | Renter-occupied |
| Single Unit, Detached | 73 (73.0%) | 27 (27.0%) |
| Single Unit, Attached | 0 (0.0%) | 6 (100.0%) |
| 2 Unit Apartments | 0 (0.0%) | 9 (100.0%) |
| 3 or 4 Unit Apartments | 0 (0.0%) | 55 (100.0%) |
| 5 to 9 Unit Apartments | 0 (0.0%) | 0 (0.0%) |
| 10 or more Apartments | 0 (0.0%) | 35 (100.0%) |
| Mobile Home / Other | 52 (66.7%) | 26 (33.3%) |
| Total | 125 (44.2%) | 158 (55.8%) |
Housing Structures by Number of Rooms in Elizabeth
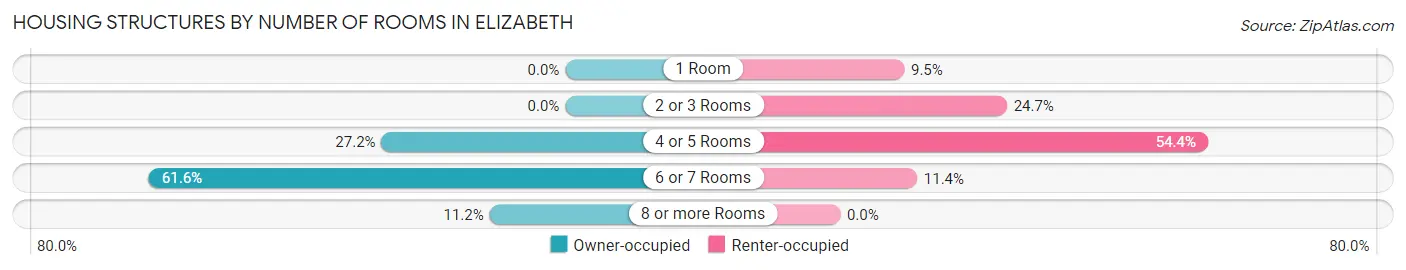
| Number of Rooms | Owner-occupied | Renter-occupied |
| 1 Room | 0 (0.0%) | 15 (9.5%) |
| 2 or 3 Rooms | 0 (0.0%) | 39 (24.7%) |
| 4 or 5 Rooms | 34 (27.2%) | 86 (54.4%) |
| 6 or 7 Rooms | 77 (61.6%) | 18 (11.4%) |
| 8 or more Rooms | 14 (11.2%) | 0 (0.0%) |
| Total | 125 (100.0%) | 158 (100.0%) |
Housing Structure by Heating Type in Elizabeth
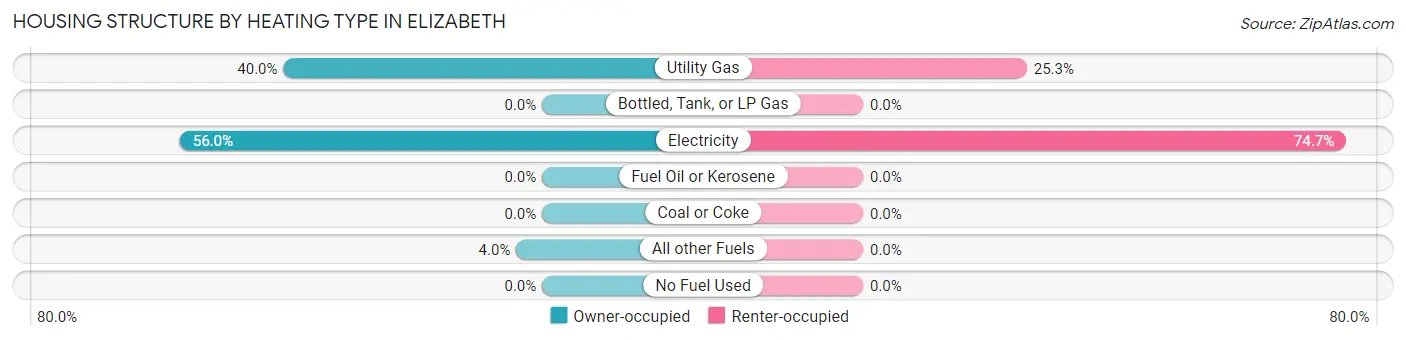
| Heating Type | Owner-occupied | Renter-occupied |
| Utility Gas | 50 (40.0%) | 40 (25.3%) |
| Bottled, Tank, or LP Gas | 0 (0.0%) | 0 (0.0%) |
| Electricity | 70 (56.0%) | 118 (74.7%) |
| Fuel Oil or Kerosene | 0 (0.0%) | 0 (0.0%) |
| Coal or Coke | 0 (0.0%) | 0 (0.0%) |
| All other Fuels | 5 (4.0%) | 0 (0.0%) |
| No Fuel Used | 0 (0.0%) | 0 (0.0%) |
| Total | 125 (100.0%) | 158 (100.0%) |
Household Vehicle Usage in Elizabeth
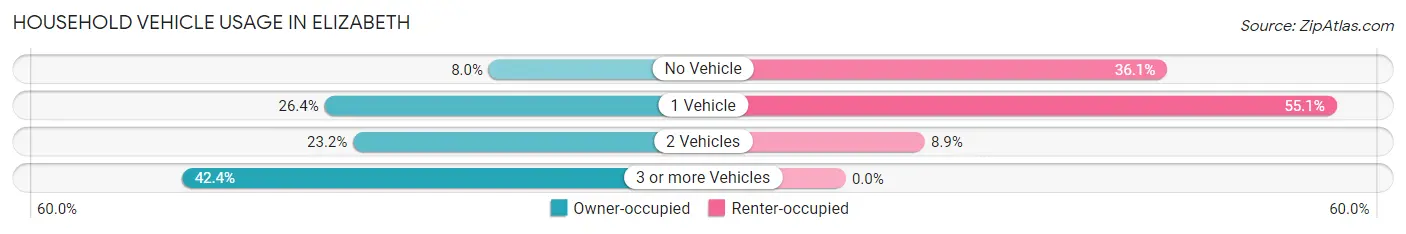
| Vehicles per Household | Owner-occupied | Renter-occupied |
| No Vehicle | 10 (8.0%) | 57 (36.1%) |
| 1 Vehicle | 33 (26.4%) | 87 (55.1%) |
| 2 Vehicles | 29 (23.2%) | 14 (8.9%) |
| 3 or more Vehicles | 53 (42.4%) | 0 (0.0%) |
| Total | 125 (100.0%) | 158 (100.0%) |
Real Estate & Mortgages in Elizabeth
Real Estate and Mortgage Overview in Elizabeth
| Characteristic | Without Mortgage | With Mortgage |
| Housing Units | 47 | 78 |
| Median Property Value | - | - |
| Median Household Income | $31,705 | $0 |
| Monthly Housing Costs | $352 | $0 |
| Real Estate Taxes | $199 | $0 |
Property Value by Mortgage Status in Elizabeth
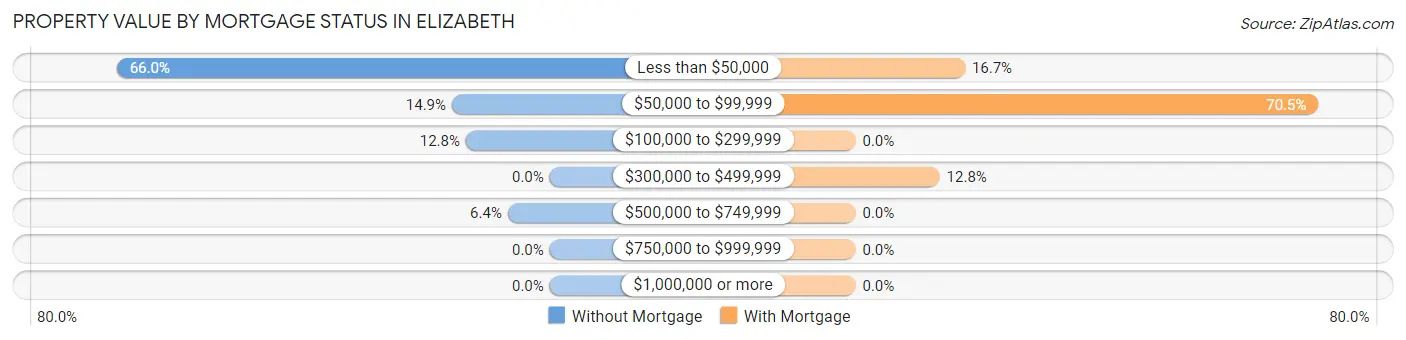
| Property Value | Without Mortgage | With Mortgage |
| Less than $50,000 | 31 (66.0%) | 13 (16.7%) |
| $50,000 to $99,999 | 7 (14.9%) | 55 (70.5%) |
| $100,000 to $299,999 | 6 (12.8%) | 0 (0.0%) |
| $300,000 to $499,999 | 0 (0.0%) | 10 (12.8%) |
| $500,000 to $749,999 | 3 (6.4%) | 0 (0.0%) |
| $750,000 to $999,999 | 0 (0.0%) | 0 (0.0%) |
| $1,000,000 or more | 0 (0.0%) | 0 (0.0%) |
| Total | 47 (100.0%) | 78 (100.0%) |
Household Income by Mortgage Status in Elizabeth
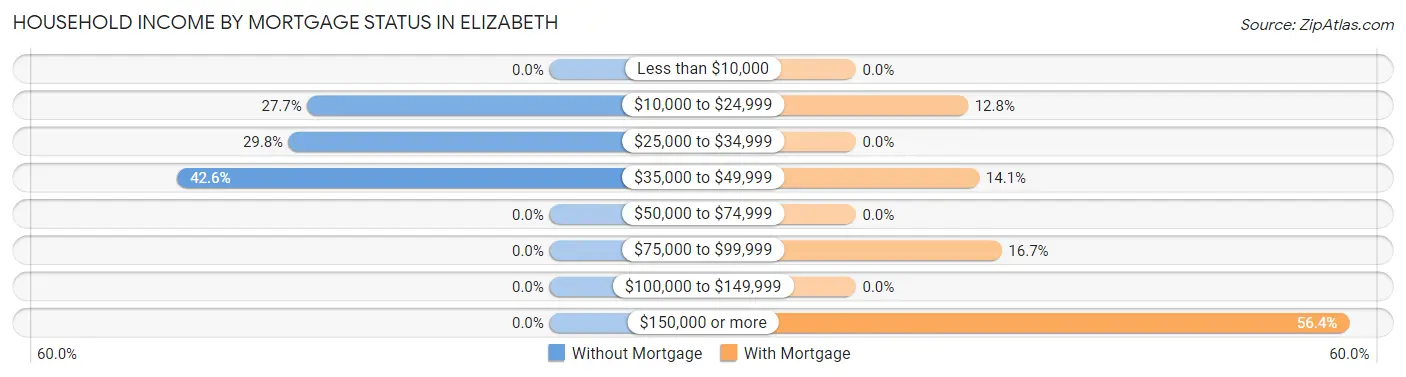
| Household Income | Without Mortgage | With Mortgage |
| Less than $10,000 | 0 (0.0%) | 0 (0.0%) |
| $10,000 to $24,999 | 13 (27.7%) | 10 (12.8%) |
| $25,000 to $34,999 | 14 (29.8%) | 0 (0.0%) |
| $35,000 to $49,999 | 20 (42.5%) | 11 (14.1%) |
| $50,000 to $74,999 | 0 (0.0%) | 0 (0.0%) |
| $75,000 to $99,999 | 0 (0.0%) | 13 (16.7%) |
| $100,000 to $149,999 | 0 (0.0%) | 0 (0.0%) |
| $150,000 or more | 0 (0.0%) | 44 (56.4%) |
| Total | 47 (100.0%) | 78 (100.0%) |
Property Value to Household Income Ratio in Elizabeth
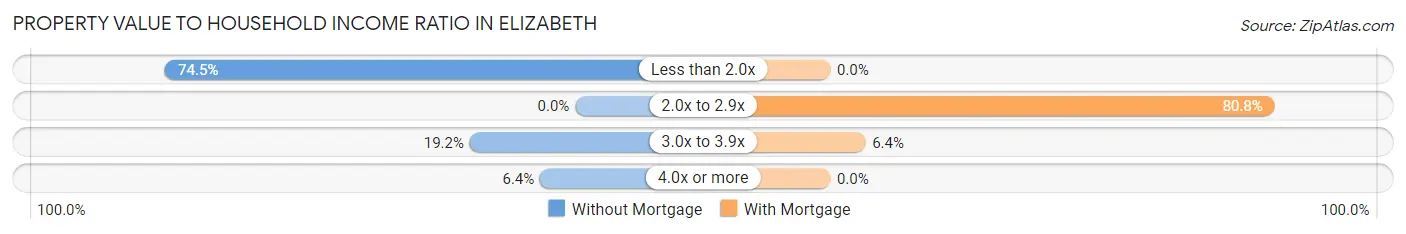
| Value-to-Income Ratio | Without Mortgage | With Mortgage |
| Less than 2.0x | 35 (74.5%) | 0 (0.0%) |
| 2.0x to 2.9x | 0 (0.0%) | 63 (80.8%) |
| 3.0x to 3.9x | 9 (19.2%) | 5 (6.4%) |
| 4.0x or more | 3 (6.4%) | 0 (0.0%) |
| Total | 47 (100.0%) | 78 (100.0%) |
Real Estate Taxes by Mortgage Status in Elizabeth
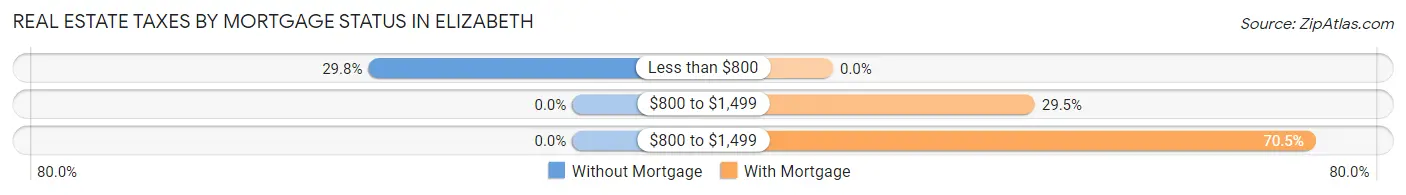
| Property Taxes | Without Mortgage | With Mortgage |
| Less than $800 | 14 (29.8%) | 0 (0.0%) |
| $800 to $1,499 | 0 (0.0%) | 23 (29.5%) |
| $800 to $1,499 | 0 (0.0%) | 55 (70.5%) |
| Total | 47 (100.0%) | 78 (100.0%) |
Health & Disability in Elizabeth
Health Insurance Coverage by Age in Elizabeth
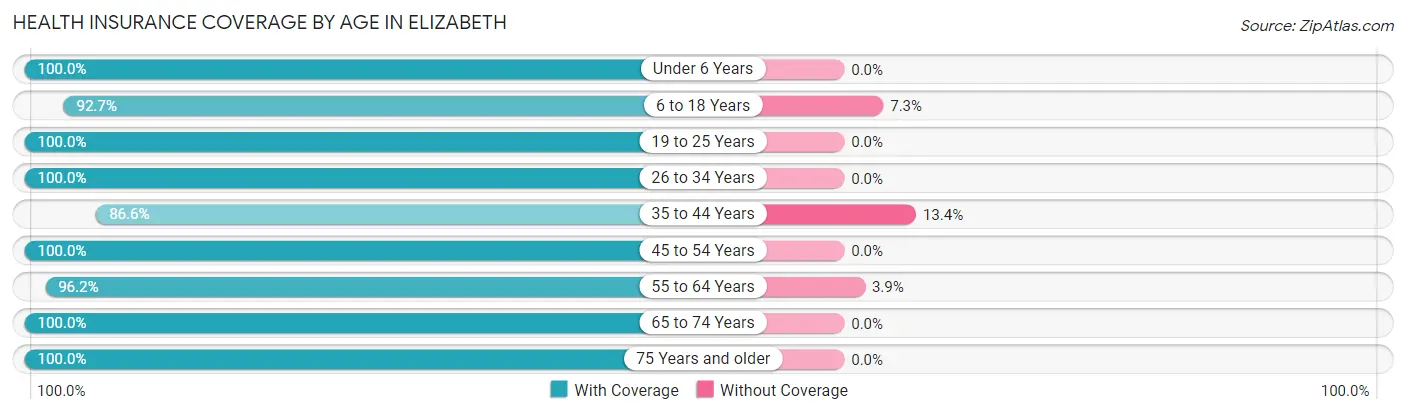
| Age Bracket | With Coverage | Without Coverage |
| Under 6 Years | 60 (100.0%) | 0 (0.0%) |
| 6 to 18 Years | 102 (92.7%) | 8 (7.3%) |
| 19 to 25 Years | 94 (100.0%) | 0 (0.0%) |
| 26 to 34 Years | 35 (100.0%) | 0 (0.0%) |
| 35 to 44 Years | 162 (86.6%) | 25 (13.4%) |
| 45 to 54 Years | 76 (100.0%) | 0 (0.0%) |
| 55 to 64 Years | 75 (96.2%) | 3 (3.8%) |
| 65 to 74 Years | 9 (100.0%) | 0 (0.0%) |
| 75 Years and older | 51 (100.0%) | 0 (0.0%) |
| Total | 664 (94.9%) | 36 (5.1%) |
Health Insurance Coverage by Citizenship Status in Elizabeth
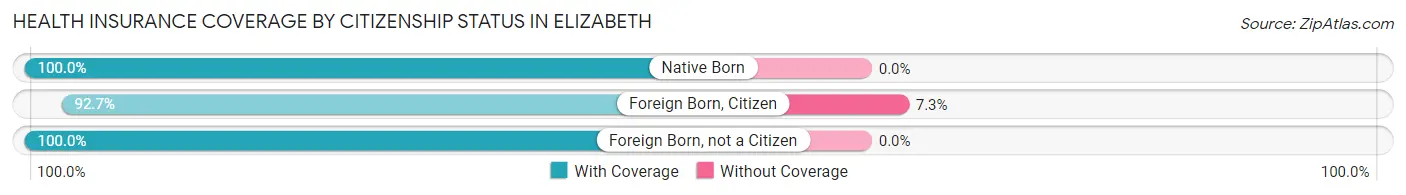
| Citizenship Status | With Coverage | Without Coverage |
| Native Born | 60 (100.0%) | 0 (0.0%) |
| Foreign Born, Citizen | 102 (92.7%) | 8 (7.3%) |
| Foreign Born, not a Citizen | 94 (100.0%) | 0 (0.0%) |
Health Insurance Coverage by Household Income in Elizabeth
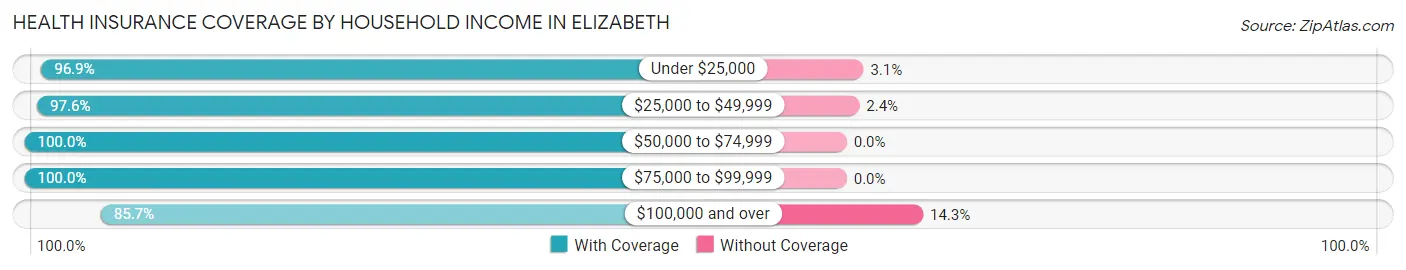
| Household Income | With Coverage | Without Coverage |
| Under $25,000 | 309 (96.9%) | 10 (3.1%) |
| $25,000 to $49,999 | 124 (97.6%) | 3 (2.4%) |
| $50,000 to $74,999 | 51 (100.0%) | 0 (0.0%) |
| $75,000 to $99,999 | 42 (100.0%) | 0 (0.0%) |
| $100,000 and over | 138 (85.7%) | 23 (14.3%) |
Public vs Private Health Insurance Coverage by Age in Elizabeth
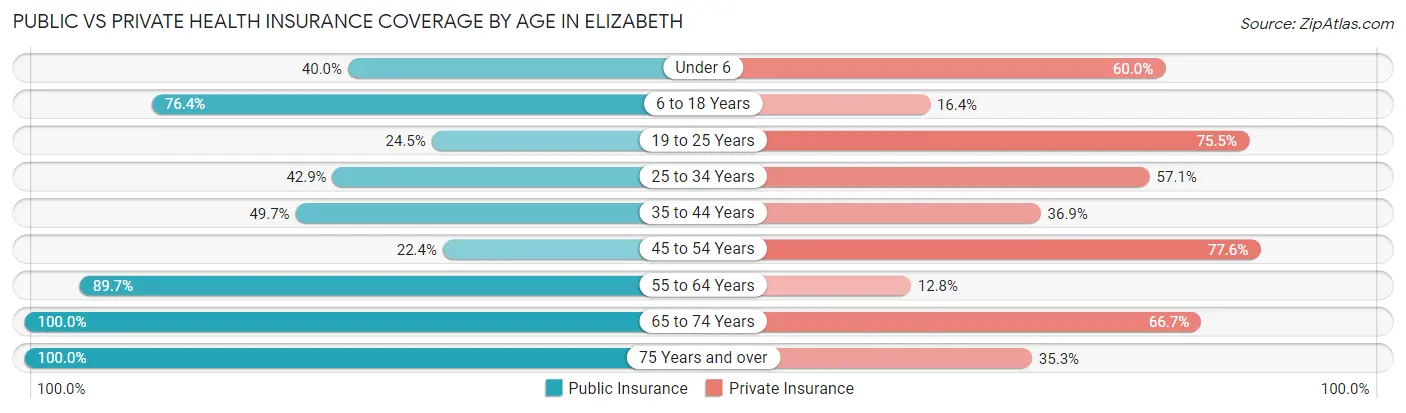
| Age Bracket | Public Insurance | Private Insurance |
| Under 6 | 24 (40.0%) | 36 (60.0%) |
| 6 to 18 Years | 84 (76.4%) | 18 (16.4%) |
| 19 to 25 Years | 23 (24.5%) | 71 (75.5%) |
| 25 to 34 Years | 15 (42.9%) | 20 (57.1%) |
| 35 to 44 Years | 93 (49.7%) | 69 (36.9%) |
| 45 to 54 Years | 17 (22.4%) | 59 (77.6%) |
| 55 to 64 Years | 70 (89.7%) | 10 (12.8%) |
| 65 to 74 Years | 9 (100.0%) | 6 (66.7%) |
| 75 Years and over | 51 (100.0%) | 18 (35.3%) |
| Total | 386 (55.1%) | 307 (43.9%) |
Disability Status by Sex by Age in Elizabeth
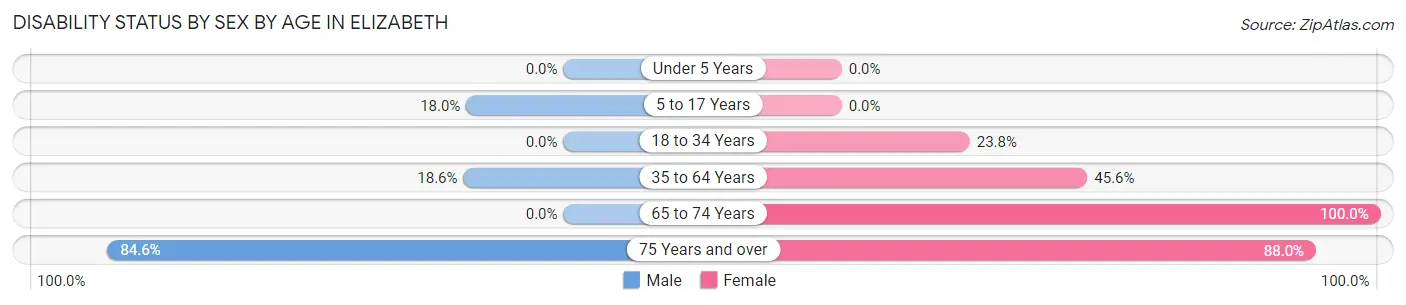
| Age Bracket | Male | Female |
| Under 5 Years | 0 (0.0%) | 0 (0.0%) |
| 5 to 17 Years | 11 (18.0%) | 0 (0.0%) |
| 18 to 34 Years | 0 (0.0%) | 24 (23.8%) |
| 35 to 64 Years | 36 (18.6%) | 67 (45.6%) |
| 65 to 74 Years | 0 (0.0%) | 9 (100.0%) |
| 75 Years and over | 22 (84.6%) | 22 (88.0%) |
Disability Class by Sex by Age in Elizabeth
Disability Class: Hearing Difficulty
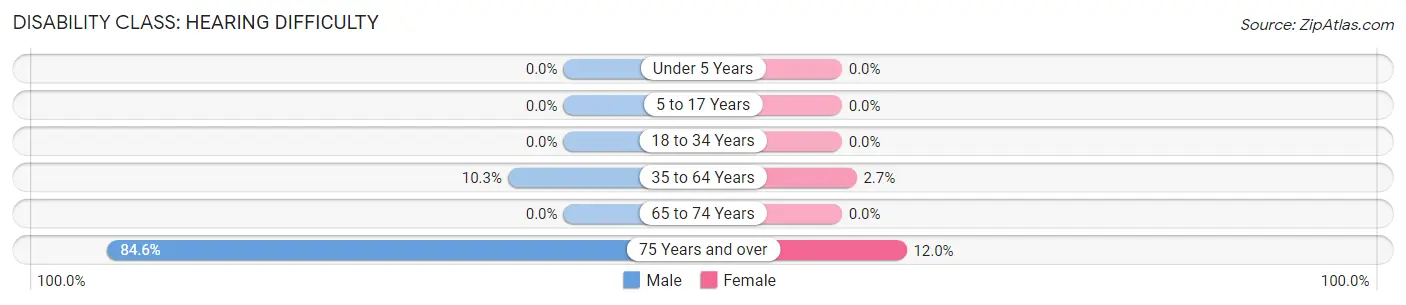
| Age Bracket | Male | Female |
| Under 5 Years | 0 (0.0%) | 0 (0.0%) |
| 5 to 17 Years | 0 (0.0%) | 0 (0.0%) |
| 18 to 34 Years | 0 (0.0%) | 0 (0.0%) |
| 35 to 64 Years | 20 (10.3%) | 4 (2.7%) |
| 65 to 74 Years | 0 (0.0%) | 0 (0.0%) |
| 75 Years and over | 22 (84.6%) | 3 (12.0%) |
Disability Class: Vision Difficulty
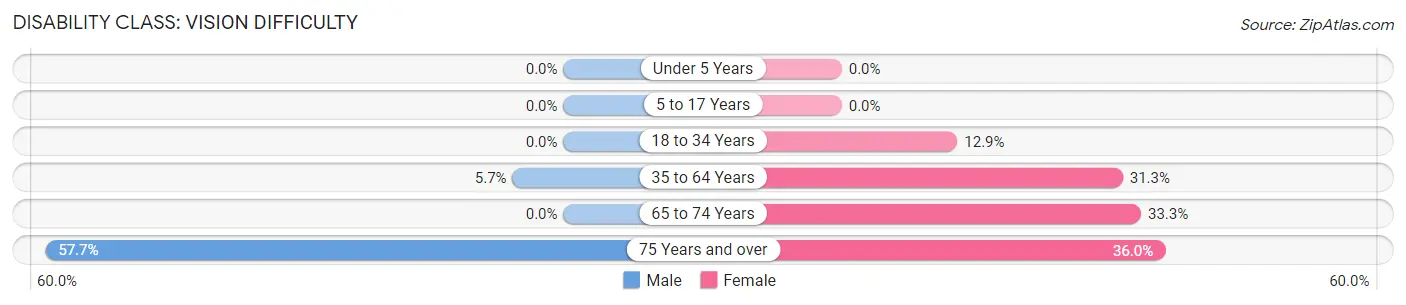
| Age Bracket | Male | Female |
| Under 5 Years | 0 (0.0%) | 0 (0.0%) |
| 5 to 17 Years | 0 (0.0%) | 0 (0.0%) |
| 18 to 34 Years | 0 (0.0%) | 13 (12.9%) |
| 35 to 64 Years | 11 (5.7%) | 46 (31.3%) |
| 65 to 74 Years | 0 (0.0%) | 3 (33.3%) |
| 75 Years and over | 15 (57.7%) | 9 (36.0%) |
Disability Class: Cognitive Difficulty
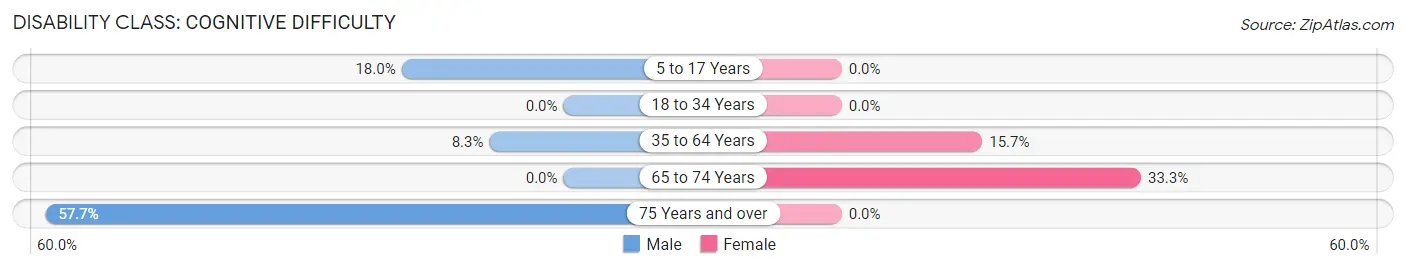
| Age Bracket | Male | Female |
| 5 to 17 Years | 11 (18.0%) | 0 (0.0%) |
| 18 to 34 Years | 0 (0.0%) | 0 (0.0%) |
| 35 to 64 Years | 16 (8.3%) | 23 (15.7%) |
| 65 to 74 Years | 0 (0.0%) | 3 (33.3%) |
| 75 Years and over | 15 (57.7%) | 0 (0.0%) |
Disability Class: Ambulatory Difficulty
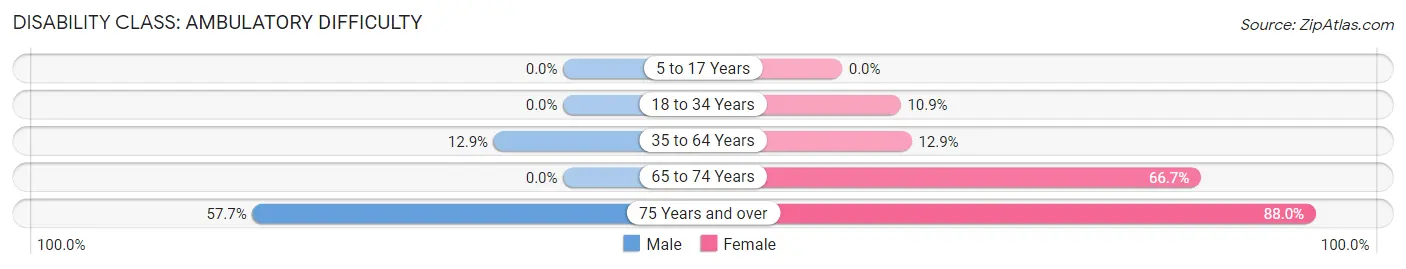
| Age Bracket | Male | Female |
| 5 to 17 Years | 0 (0.0%) | 0 (0.0%) |
| 18 to 34 Years | 0 (0.0%) | 11 (10.9%) |
| 35 to 64 Years | 25 (12.9%) | 19 (12.9%) |
| 65 to 74 Years | 0 (0.0%) | 6 (66.7%) |
| 75 Years and over | 15 (57.7%) | 22 (88.0%) |
Disability Class: Self-Care Difficulty
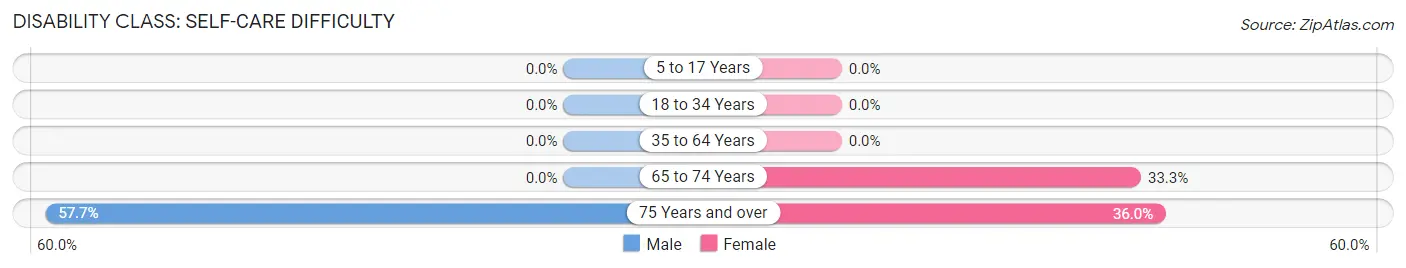
| Age Bracket | Male | Female |
| 5 to 17 Years | 0 (0.0%) | 0 (0.0%) |
| 18 to 34 Years | 0 (0.0%) | 0 (0.0%) |
| 35 to 64 Years | 0 (0.0%) | 0 (0.0%) |
| 65 to 74 Years | 0 (0.0%) | 3 (33.3%) |
| 75 Years and over | 15 (57.7%) | 9 (36.0%) |
Technology Access in Elizabeth
Computing Device Access in Elizabeth
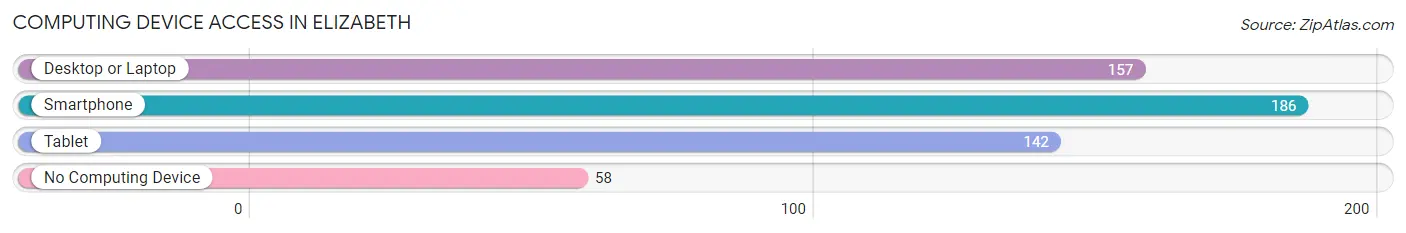
| Device Type | # Households | % Households |
| Desktop or Laptop | 157 | 55.5% |
| Smartphone | 186 | 65.7% |
| Tablet | 142 | 50.2% |
| No Computing Device | 58 | 20.5% |
| Total | 283 | 100.0% |
Internet Access in Elizabeth
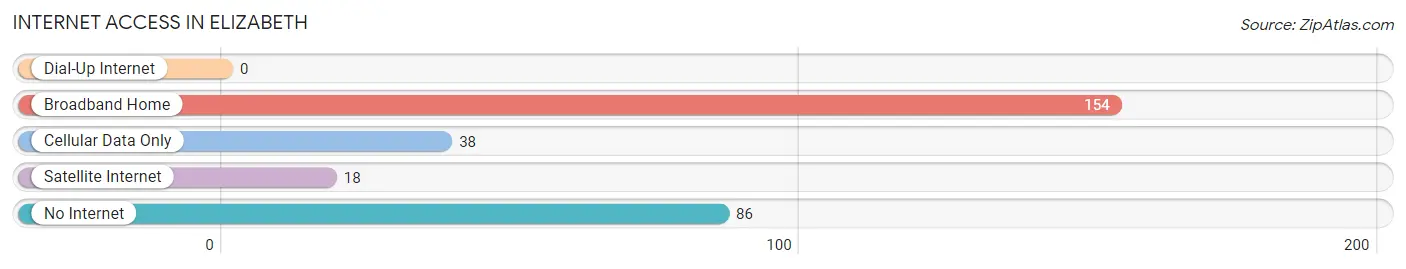
| Internet Type | # Households | % Households |
| Dial-Up Internet | 0 | 0.0% |
| Broadband Home | 154 | 54.4% |
| Cellular Data Only | 38 | 13.4% |
| Satellite Internet | 18 | 6.4% |
| No Internet | 86 | 30.4% |
| Total | 283 | 100.0% |
Elizabeth Summary
Elizabeth, West Virginia is a small town located in the northern part of the state, in Wirt County. It is situated on the banks of the Little Kanawha River, and is home to a population of just over 1,000 people. The town was founded in 1817, and has a rich history of coal mining, timber production, and other industries.
Geography
Elizabeth is located in the northern part of West Virginia, in Wirt County. It is situated on the banks of the Little Kanawha River, and is surrounded by rolling hills and forests. The town is located at an elevation of 890 feet, and has a total area of 0.7 square miles. The climate in Elizabeth is humid continental, with hot summers and cold winters.
Economy
Elizabeth has a long history of coal mining and timber production. The town was once home to several coal mines, and the timber industry was also a major employer in the area. In recent years, the economy of Elizabeth has shifted to focus more on tourism and outdoor recreation. The town is home to several parks and recreational areas, and is a popular destination for fishing, hunting, and camping.
Demographics
As of the 2010 census, Elizabeth had a population of 1,072 people. The racial makeup of the town was 97.2% White, 0.7% African American, 0.2% Native American, 0.2% Asian, 0.1% Pacific Islander, 0.2% from other races, and 1.0% from two or more races. The median household income in Elizabeth was $30,938, and the median family income was $37,813.
Conclusion
Elizabeth, West Virginia is a small town located in the northern part of the state, in Wirt County. It is situated on the banks of the Little Kanawha River, and is home to a population of just over 1,000 people. The town has a long history of coal mining and timber production, but in recent years the economy has shifted to focus more on tourism and outdoor recreation. The racial makeup of the town is predominantly White, and the median household income is $30,938. Elizabeth is a popular destination for fishing, hunting, and camping, and is a great place to visit for those looking to explore the outdoors.
Common Questions
What is Per Capita Income in Elizabeth?
Per Capita income in Elizabeth is $15,833.
What is Income or Wage Gap in Elizabeth?
Income or Wage Gap in Elizabeth is 58.7%.
Women in Elizabeth earn 41.3 cents for every dollar earned by a man.
What is Family Income Deficit in Elizabeth?
Family Income Deficit in Elizabeth is $6,783.
Families that are below poverty line in Elizabeth earn $6,783 less on average than the poverty threshold level.
What is Inequality or Gini Index in Elizabeth?
Inequality or Gini Index in Elizabeth is 0.46.
What is the Total Population of Elizabeth?
Total Population of Elizabeth is 700.
What is the Total Male Population of Elizabeth?
Total Male Population of Elizabeth is 356.
What is the Total Female Population of Elizabeth?
Total Female Population of Elizabeth is 344.
What is the Ratio of Males per 100 Females in Elizabeth?
There are 103.49 Males per 100 Females in Elizabeth.
What is the Ratio of Females per 100 Males in Elizabeth?
There are 96.63 Females per 100 Males in Elizabeth.
What is the Median Population Age in Elizabeth?
Median Population Age in Elizabeth is 37.1 Years.
What is the Average Family Size in Elizabeth
Average Family Size in Elizabeth is 3.0 People.
What is the Average Household Size in Elizabeth
Average Household Size in Elizabeth is 2.5 People.
How Large is the Labor Force in Elizabeth?
There are 281 People in the Labor Forcein in Elizabeth.
What is the Percentage of People in the Labor Force in Elizabeth?
50.4% of People are in the Labor Force in Elizabeth.
What is the Unemployment Rate in Elizabeth?
Unemployment Rate in Elizabeth is 1.1%.