Zip Codes with the Highest Percentage of Population Employed in Food Preparation & Serving in Huntington, WV
RELATED REPORTS & OPTIONS
Food Preparation & Serving
Huntington
Compare Zip Codes
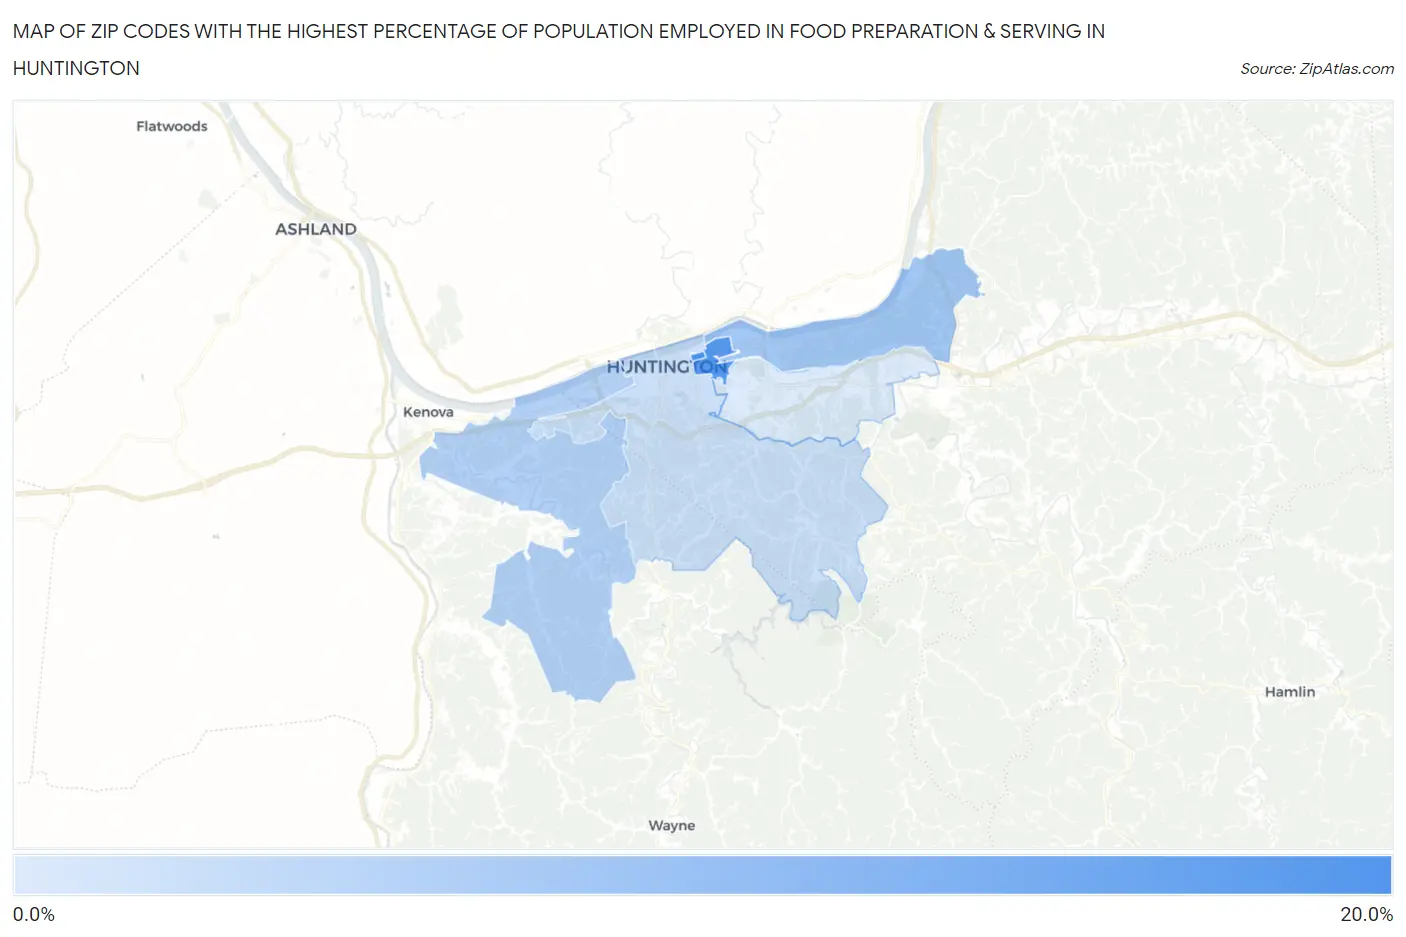
Map of Zip Codes with the Highest Percentage of Population Employed in Food Preparation & Serving in Huntington
6.8%
18.9%
Zip Codes with the Highest Percentage of Population Employed in Food Preparation & Serving in Huntington, WV
| Zip Code | % Employed | vs State | vs National | |
| 1. | 25755 | 18.9% | 5.7%(+13.3)#40 | 5.3%(+13.6)#571 |
| 2. | 25703 | 17.8% | 5.7%(+12.1)#46 | 5.3%(+12.5)#675 |
| 3. | 25702 | 11.4% | 5.7%(+5.72)#77 | 5.3%(+6.09)#1,887 |
| 4. | 25704 | 10.0% | 5.7%(+4.34)#95 | 5.3%(+4.71)#2,642 |
| 5. | 25701 | 8.1% | 5.7%(+2.40)#129 | 5.3%(+2.77)#4,643 |
| 6. | 25705 | 6.8% | 5.7%(+1.16)#164 | 5.3%(+1.53)#7,015 |
1
Common Questions
What are the Top 5 Zip Codes with the Highest Percentage of Population Employed in Food Preparation & Serving in Huntington, WV?
Top 5 Zip Codes with the Highest Percentage of Population Employed in Food Preparation & Serving in Huntington, WV are:
What zip code has the Highest Percentage of Population Employed in Food Preparation & Serving in Huntington, WV?
25755 has the Highest Percentage of Population Employed in Food Preparation & Serving in Huntington, WV with 18.9%.
What is the Percentage of Population Employed in Food Preparation & Serving in Huntington, WV?
Percentage of Population Employed in Food Preparation & Serving in Huntington is 10.6%.
What is the Percentage of Population Employed in Food Preparation & Serving in West Virginia?
Percentage of Population Employed in Food Preparation & Serving in West Virginia is 5.7%.
What is the Percentage of Population Employed in Food Preparation & Serving in the United States?
Percentage of Population Employed in Food Preparation & Serving in the United States is 5.3%.