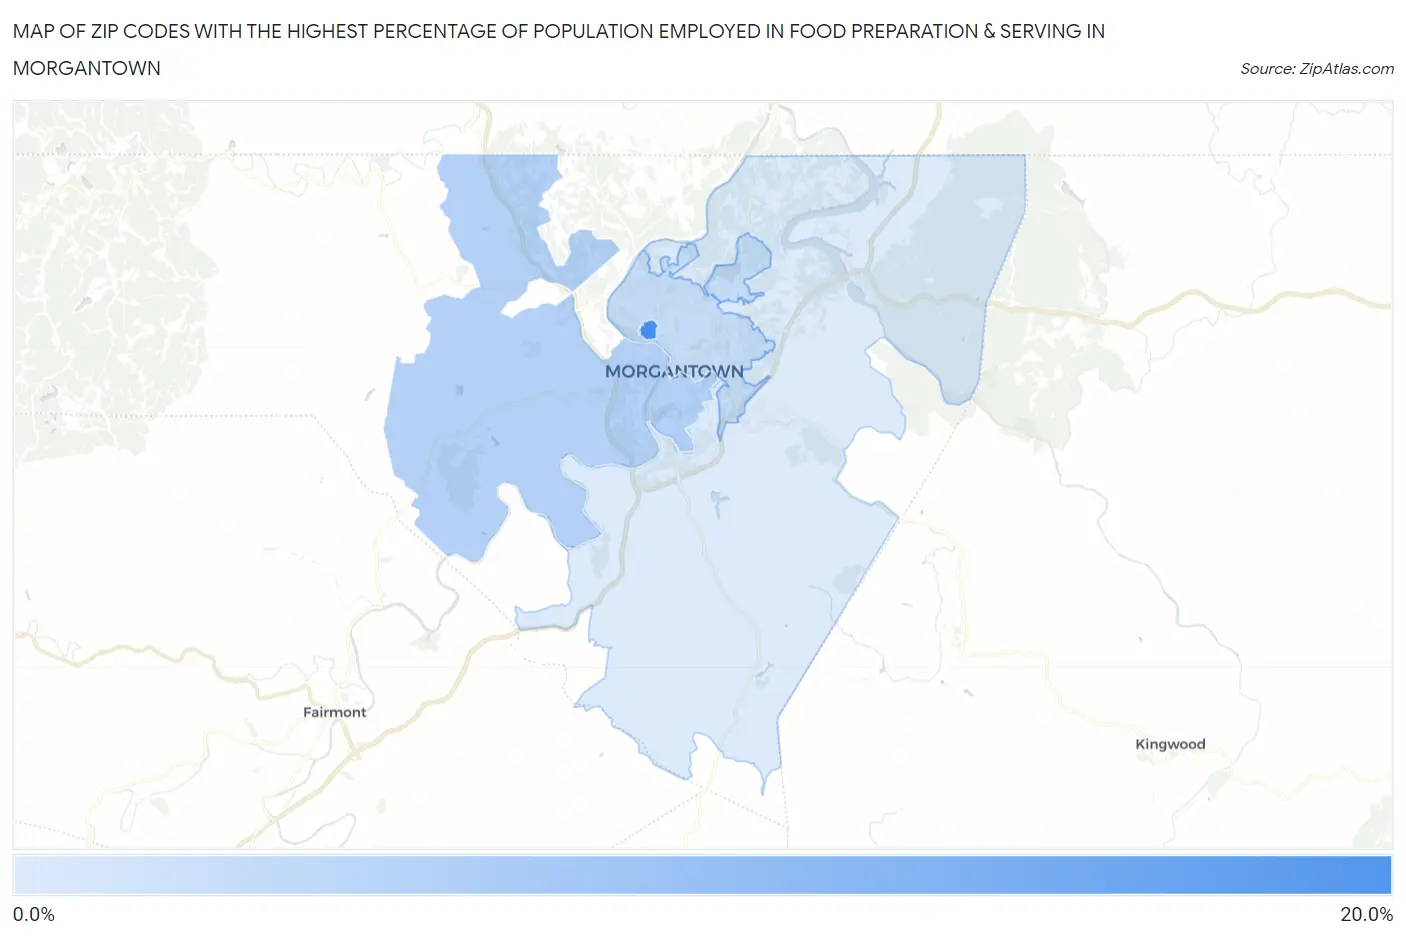
Zip Codes with the Highest Percentage of Population Employed in Food Preparation & Serving in Morgantown, WV
RELATED REPORTS & OPTIONS
Food Preparation & Serving
Morgantown
Compare Zip Codes
Map of Zip Codes with the Highest Percentage of Population Employed in Food Preparation & Serving in Morgantown
6.3%
16.7%
Zip Codes with the Highest Percentage of Population Employed in Food Preparation & Serving in Morgantown, WV
| Zip Code | % Employed | vs State | vs National | |
| 1. | 26506 | 16.7% | 5.7%(+11.0)#51 | 5.3%(+11.4)#775 |
| 2. | 26501 | 9.1% | 5.7%(+3.46)#108 | 5.3%(+3.83)#3,401 |
| 3. | 26505 | 7.8% | 5.7%(+2.16)#136 | 5.3%(+2.53)#5,020 |
| 4. | 26508 | 6.3% | 5.7%(+0.599)#182 | 5.3%(+0.970)#8,560 |
1
Common Questions
What are the Top 3 Zip Codes with the Highest Percentage of Population Employed in Food Preparation & Serving in Morgantown, WV?
Top 3 Zip Codes with the Highest Percentage of Population Employed in Food Preparation & Serving in Morgantown, WV are:
What zip code has the Highest Percentage of Population Employed in Food Preparation & Serving in Morgantown, WV?
26506 has the Highest Percentage of Population Employed in Food Preparation & Serving in Morgantown, WV with 16.7%.
What is the Percentage of Population Employed in Food Preparation & Serving in Morgantown, WV?
Percentage of Population Employed in Food Preparation & Serving in Morgantown is 10.7%.
What is the Percentage of Population Employed in Food Preparation & Serving in West Virginia?
Percentage of Population Employed in Food Preparation & Serving in West Virginia is 5.7%.
What is the Percentage of Population Employed in Food Preparation & Serving in the United States?
Percentage of Population Employed in Food Preparation & Serving in the United States is 5.3%.