Zip Codes with the Highest Percentage of Population Employed in Food Preparation & Serving in Charleston, WV
RELATED REPORTS & OPTIONS
Food Preparation & Serving
Charleston
Compare Zip Codes
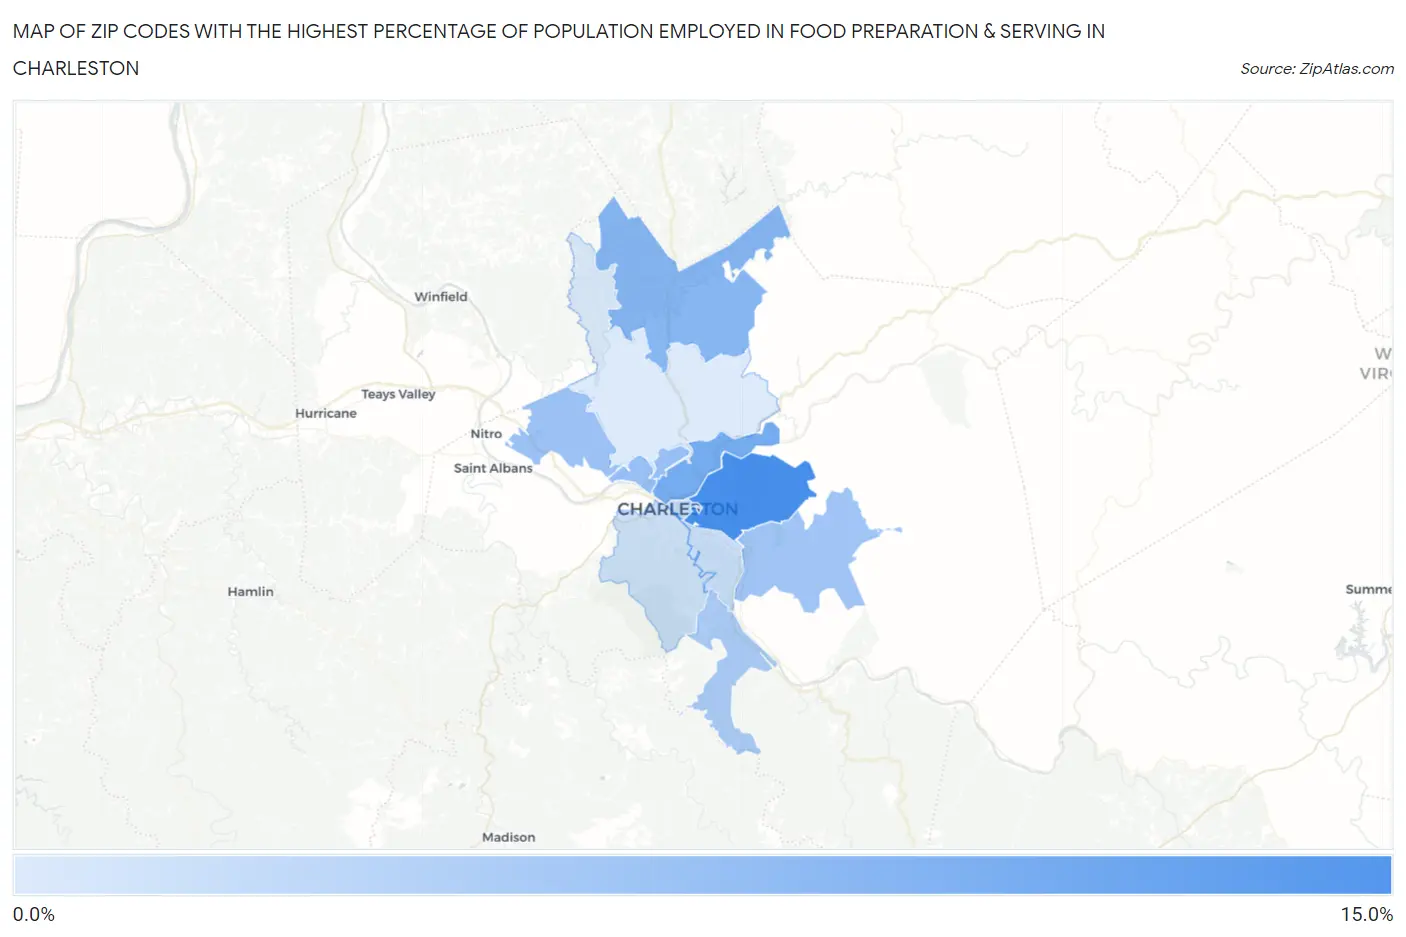
Map of Zip Codes with the Highest Percentage of Population Employed in Food Preparation & Serving in Charleston
1.6%
12.0%
Zip Codes with the Highest Percentage of Population Employed in Food Preparation & Serving in Charleston, WV
| Zip Code | % Employed | vs State | vs National | |
| 1. | 25311 | 12.0% | 5.7%(+6.39)#73 | 5.3%(+6.76)#1,648 |
| 2. | 25302 | 8.7% | 5.7%(+3.04)#115 | 5.3%(+3.42)#3,843 |
| 3. | 25320 | 7.5% | 5.7%(+1.82)#150 | 5.3%(+2.19)#5,601 |
| 4. | 25387 | 6.3% | 5.7%(+0.661)#181 | 5.3%(+1.03)#8,384 |
| 5. | 25313 | 6.2% | 5.7%(+0.516)#186 | 5.3%(+0.887)#8,813 |
| 6. | 25306 | 5.6% | 5.7%(-0.051)#203 | 5.3%(+0.320)#10,681 |
| 7. | 25315 | 4.9% | 5.7%(-0.745)#227 | 5.3%(-0.374)#13,299 |
| 8. | 25301 | 3.1% | 5.7%(-2.53)#306 | 5.3%(-2.16)#20,767 |
| 9. | 25304 | 2.8% | 5.7%(-2.81)#315 | 5.3%(-2.44)#21,875 |
| 10. | 25314 | 2.6% | 5.7%(-3.10)#325 | 5.3%(-2.73)#22,968 |
| 11. | 25312 | 1.6% | 5.7%(-4.10)#364 | 5.3%(-3.73)#25,861 |
1
Common Questions
What are the Top 10 Zip Codes with the Highest Percentage of Population Employed in Food Preparation & Serving in Charleston, WV?
Top 10 Zip Codes with the Highest Percentage of Population Employed in Food Preparation & Serving in Charleston, WV are:
What zip code has the Highest Percentage of Population Employed in Food Preparation & Serving in Charleston, WV?
25311 has the Highest Percentage of Population Employed in Food Preparation & Serving in Charleston, WV with 12.0%.
What is the Percentage of Population Employed in Food Preparation & Serving in Charleston, WV?
Percentage of Population Employed in Food Preparation & Serving in Charleston is 5.4%.
What is the Percentage of Population Employed in Food Preparation & Serving in West Virginia?
Percentage of Population Employed in Food Preparation & Serving in West Virginia is 5.7%.
What is the Percentage of Population Employed in Food Preparation & Serving in the United States?
Percentage of Population Employed in Food Preparation & Serving in the United States is 5.3%.