Alderson, WV Map & Demographics
Alderson Map
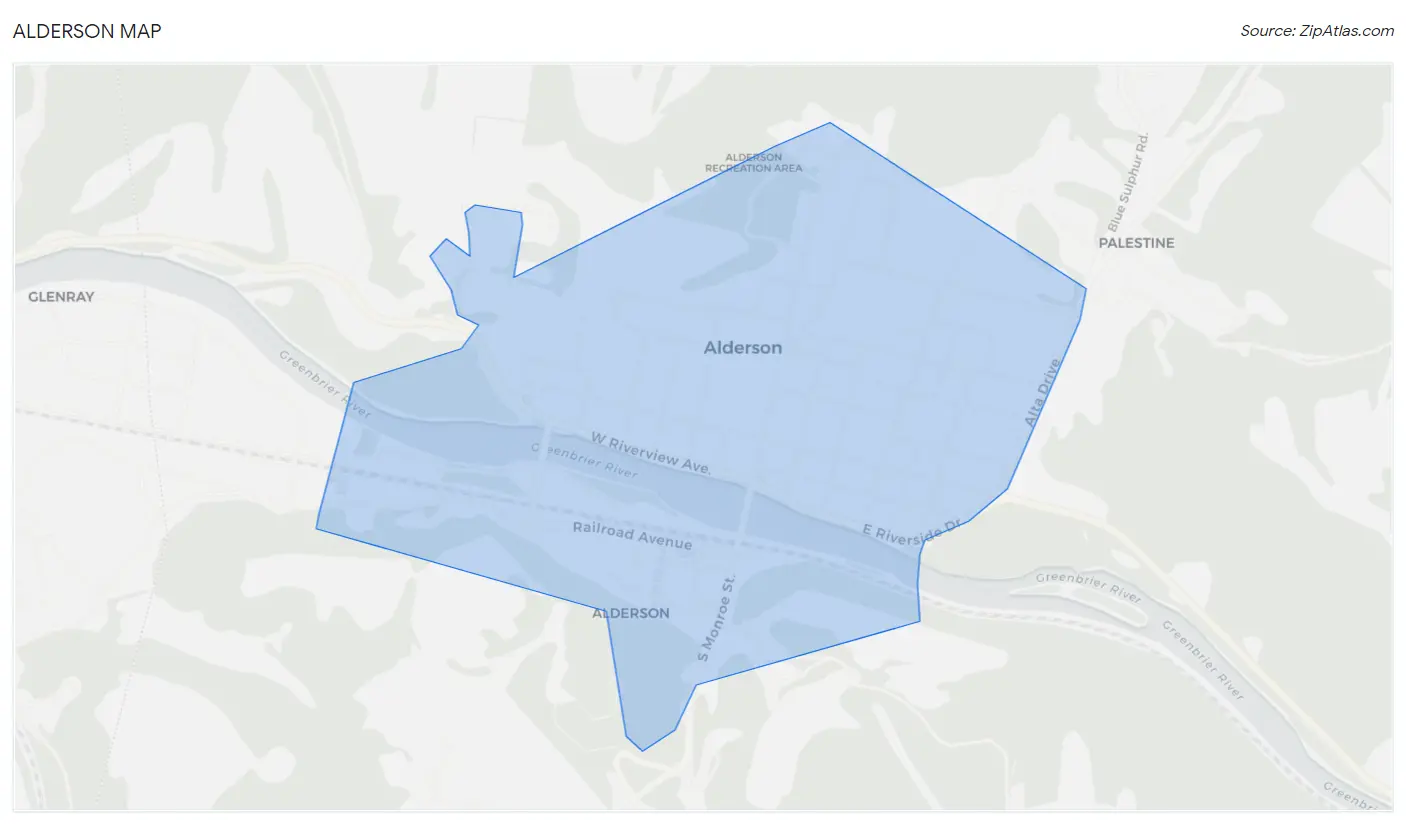
Alderson Overview
$20,394
PER CAPITA INCOME
$51,731
AVG FAMILY INCOME
$30,689
AVG HOUSEHOLD INCOME
8.7%
WAGE / INCOME GAP [ % ]
91.3¢/ $1
WAGE / INCOME GAP [ $ ]
0.47
INEQUALITY / GINI INDEX
969
TOTAL POPULATION
452
MALE POPULATION
517
FEMALE POPULATION
87.43
MALES / 100 FEMALES
114.38
FEMALES / 100 MALES
56.1
MEDIAN AGE
3.2
AVG FAMILY SIZE
2.0
AVG HOUSEHOLD SIZE
296
LABOR FORCE [ PEOPLE ]
33.7%
PERCENT IN LABOR FORCE
1.7%
UNEMPLOYMENT RATE
Alderson Zip Codes
Income in Alderson
Income Overview in Alderson
Per Capita Income in Alderson is $20,394, while median incomes of families and households are $51,731 and $30,689 respectively.
| Characteristic | Number | Measure |
| Per Capita Income | 969 | $20,394 |
| Median Family Income | 190 | $51,731 |
| Mean Family Income | 190 | $56,753 |
| Median Household Income | 489 | $30,689 |
| Mean Household Income | 489 | $35,244 |
| Income Deficit | 190 | $0 |
| Wage / Income Gap (%) | 969 | 8.70% |
| Wage / Income Gap ($) | 969 | 91.30¢ per $1 |
| Gini / Inequality Index | 969 | 0.47 |
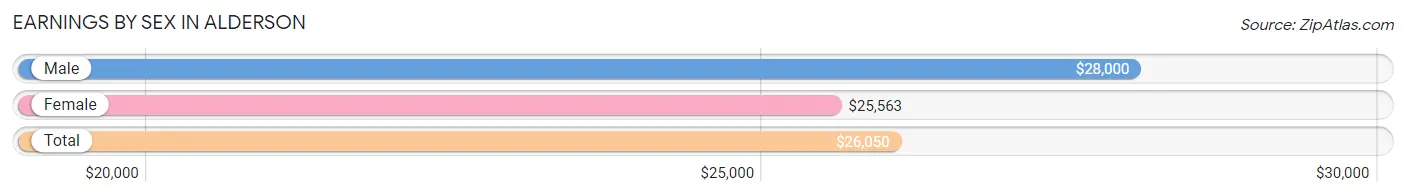
Earnings by Sex in Alderson
Average Earnings in Alderson are $26,050, $28,000 for men and $25,563 for women, a difference of 8.7%.
| Sex | Number | Average Earnings |
| Male | 188 (57.9%) | $28,000 |
| Female | 137 (42.1%) | $25,563 |
| Total | 325 (100.0%) | $26,050 |
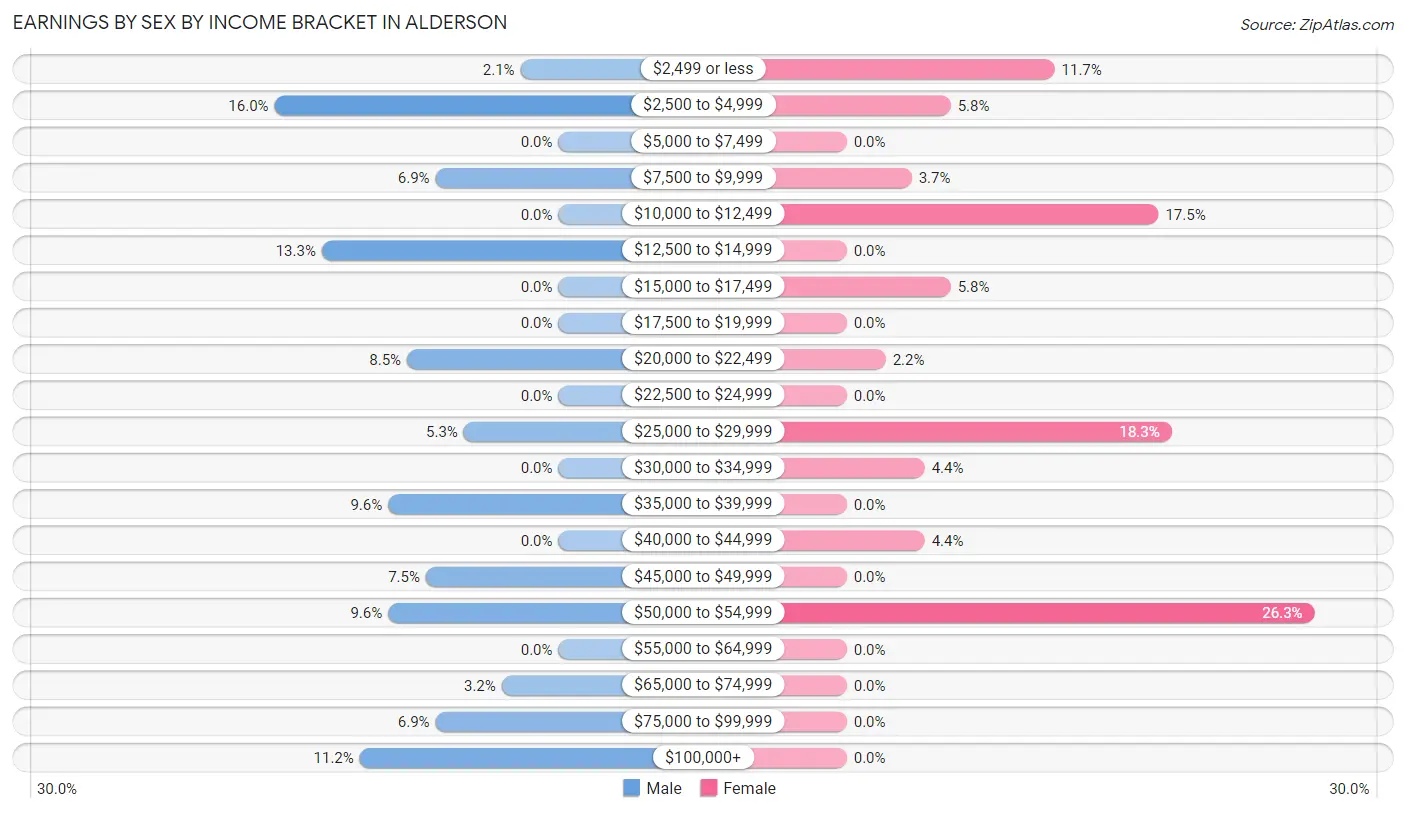
Earnings by Sex by Income Bracket in Alderson
The most common earnings brackets in Alderson are $2,500 to $4,999 for men (30 | 16.0%) and $50,000 to $54,999 for women (36 | 26.3%).
| Income | Male | Female |
| $2,499 or less | 4 (2.1%) | 16 (11.7%) |
| $2,500 to $4,999 | 30 (16.0%) | 8 (5.8%) |
| $5,000 to $7,499 | 0 (0.0%) | 0 (0.0%) |
| $7,500 to $9,999 | 13 (6.9%) | 5 (3.6%) |
| $10,000 to $12,499 | 0 (0.0%) | 24 (17.5%) |
| $12,500 to $14,999 | 25 (13.3%) | 0 (0.0%) |
| $15,000 to $17,499 | 0 (0.0%) | 8 (5.8%) |
| $17,500 to $19,999 | 0 (0.0%) | 0 (0.0%) |
| $20,000 to $22,499 | 16 (8.5%) | 3 (2.2%) |
| $22,500 to $24,999 | 0 (0.0%) | 0 (0.0%) |
| $25,000 to $29,999 | 10 (5.3%) | 25 (18.2%) |
| $30,000 to $34,999 | 0 (0.0%) | 6 (4.4%) |
| $35,000 to $39,999 | 18 (9.6%) | 0 (0.0%) |
| $40,000 to $44,999 | 0 (0.0%) | 6 (4.4%) |
| $45,000 to $49,999 | 14 (7.4%) | 0 (0.0%) |
| $50,000 to $54,999 | 18 (9.6%) | 36 (26.3%) |
| $55,000 to $64,999 | 0 (0.0%) | 0 (0.0%) |
| $65,000 to $74,999 | 6 (3.2%) | 0 (0.0%) |
| $75,000 to $99,999 | 13 (6.9%) | 0 (0.0%) |
| $100,000+ | 21 (11.2%) | 0 (0.0%) |
| Total | 188 (100.0%) | 137 (100.0%) |
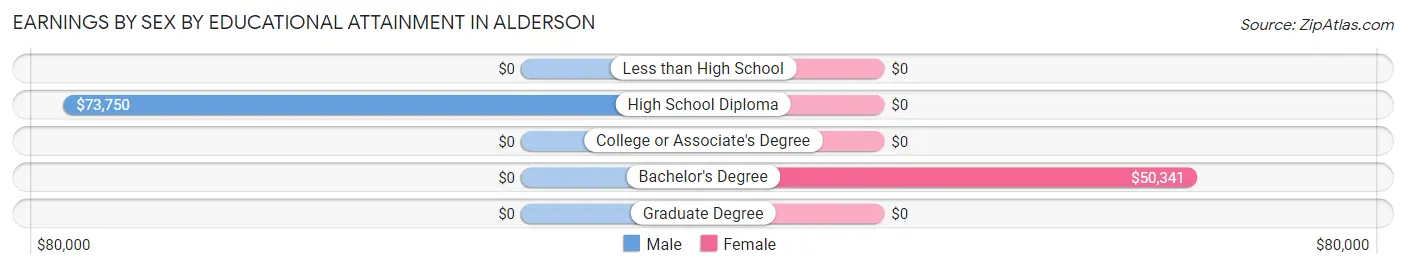
Earnings by Sex by Educational Attainment in Alderson
Average earnings in Alderson are $39,514 for men and $26,063 for women, a difference of 34.0%. Men with an educational attainment of high school diploma enjoy the highest average annual earnings of $73,750, while those with high school diploma education earn the least with $73,750. Women with an educational attainment of bachelor's degree earn the most with the average annual earnings of $50,341, while those with bachelor's degree education have the smallest earnings of $50,341.
| Educational Attainment | Male Income | Female Income |
| Less than High School | - | - |
| High School Diploma | $73,750 | $0 |
| College or Associate's Degree | - | - |
| Bachelor's Degree | - | - |
| Graduate Degree | - | - |
| Total | $39,514 | $26,063 |
Family Income in Alderson
Family Income Brackets in Alderson
According to the Alderson family income data, there are 50 families falling into the $50,000 to $74,999 income range, which is the most common income bracket and makes up 26.3% of all families.
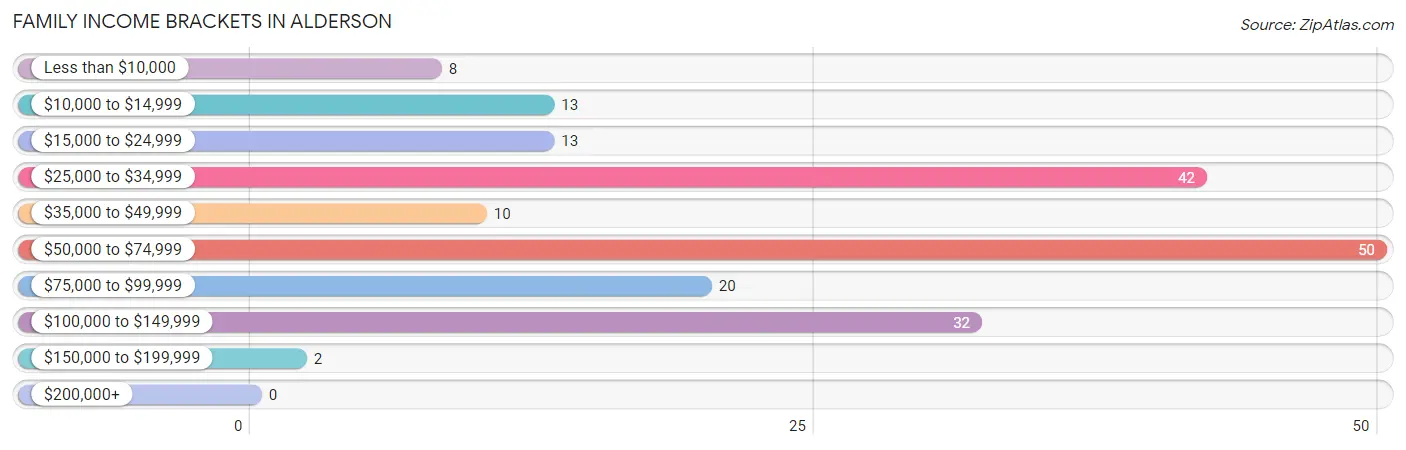
| Income Bracket | # Families | % Families |
| Less than $10,000 | 8 | 4.2% |
| $10,000 to $14,999 | 13 | 6.8% |
| $15,000 to $24,999 | 13 | 6.8% |
| $25,000 to $34,999 | 42 | 22.1% |
| $35,000 to $49,999 | 10 | 5.3% |
| $50,000 to $74,999 | 50 | 26.3% |
| $75,000 to $99,999 | 20 | 10.5% |
| $100,000 to $149,999 | 32 | 16.8% |
| $150,000 to $199,999 | 2 | 1.1% |
| $200,000+ | 0 | 0.0% |
Family Income by Famaliy Size in Alderson
2-person families (110 | 57.9%) account for the highest median family income in Alderson with $65,893 per family, while 2-person families (110 | 57.9%) have the highest median income of $32,946 per family member.
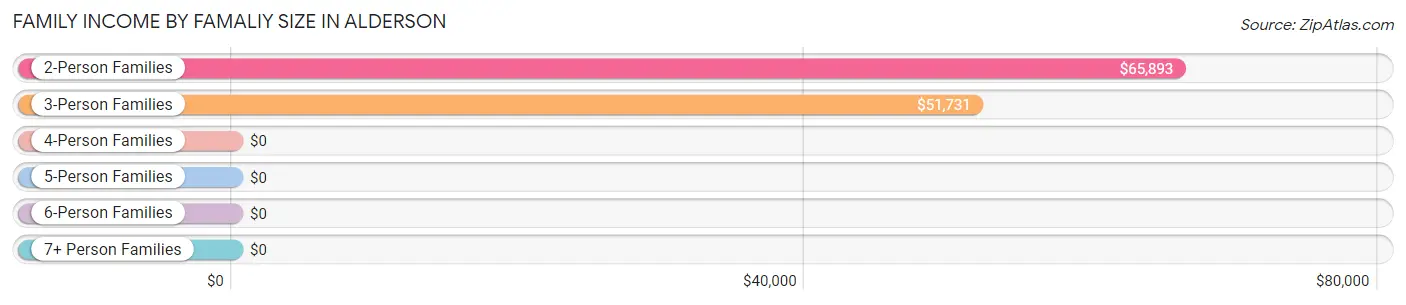
| Income Bracket | # Families | Median Income |
| 2-Person Families | 110 (57.9%) | $65,893 |
| 3-Person Families | 46 (24.2%) | $51,731 |
| 4-Person Families | 12 (6.3%) | $0 |
| 5-Person Families | 22 (11.6%) | $0 |
| 6-Person Families | 0 (0.0%) | $0 |
| 7+ Person Families | 0 (0.0%) | $0 |
| Total | 190 (100.0%) | $51,731 |
Family Income by Number of Earners in Alderson
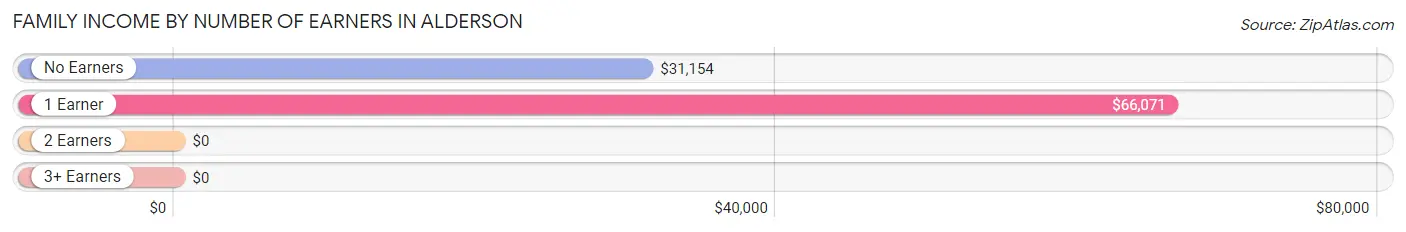
| Number of Earners | # Families | Median Income |
| No Earners | 54 (28.4%) | $31,154 |
| 1 Earner | 76 (40.0%) | $66,071 |
| 2 Earners | 45 (23.7%) | $0 |
| 3+ Earners | 15 (7.9%) | $0 |
| Total | 190 (100.0%) | $51,731 |
Household Income in Alderson
Household Income Brackets in Alderson
With 93 households falling in the category, the $25,000 to $34,999 income range is the most frequent in Alderson, accounting for 19.0% of all households.
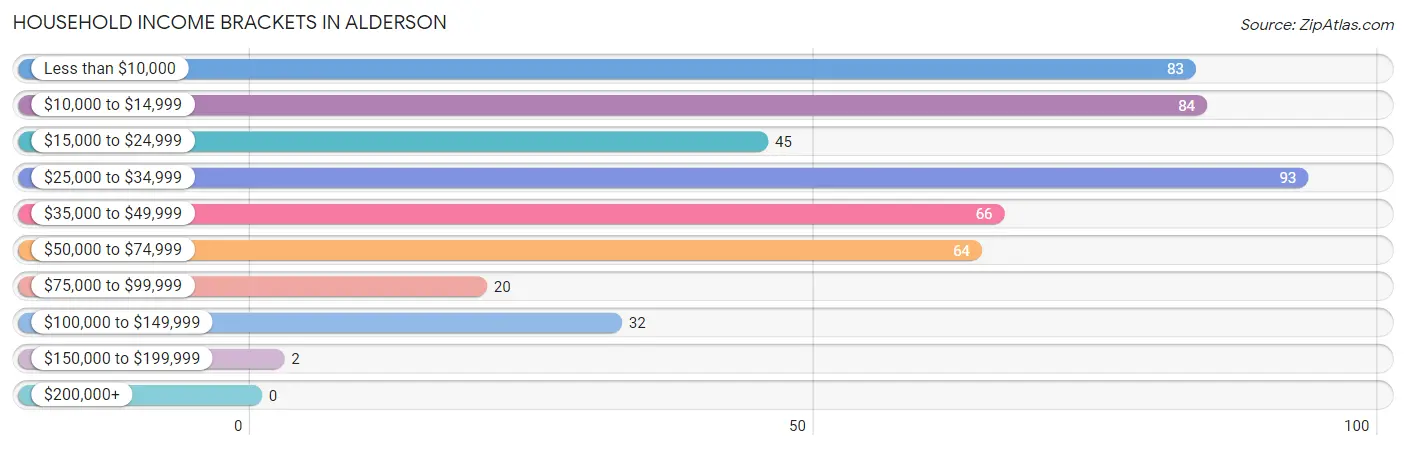
| Income Bracket | # Households | % Households |
| Less than $10,000 | 83 | 17.0% |
| $10,000 to $14,999 | 84 | 17.2% |
| $15,000 to $24,999 | 45 | 9.2% |
| $25,000 to $34,999 | 93 | 19.0% |
| $35,000 to $49,999 | 66 | 13.5% |
| $50,000 to $74,999 | 64 | 13.1% |
| $75,000 to $99,999 | 20 | 4.1% |
| $100,000 to $149,999 | 32 | 6.5% |
| $150,000 to $199,999 | 2 | 0.4% |
| $200,000+ | 0 | 0.0% |
Household Income by Householder Age in Alderson
The median household income in Alderson is $30,689, with the highest median household income of $61,442 found in the 25 to 44 years age bracket for the primary householder. A total of 35 households (7.2%) fall into this category. Meanwhile, the 15 to 24 years age bracket for the primary householder has the lowest median household income of $0, with 3 households (0.6%) in this group.
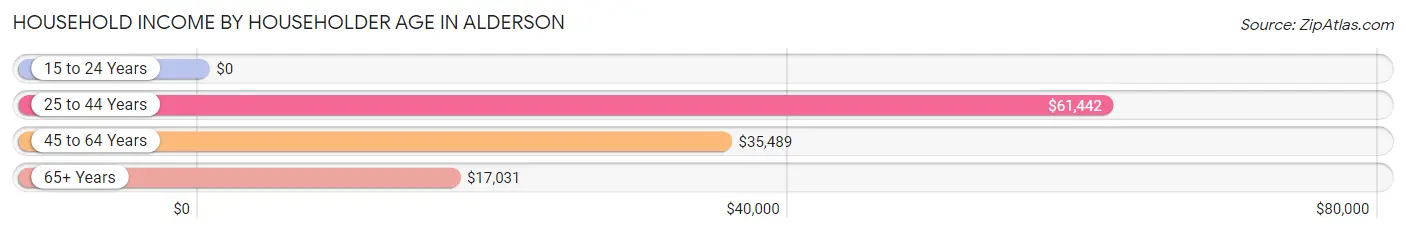
| Income Bracket | # Households | Median Income |
| 15 to 24 Years | 3 (0.6%) | $0 |
| 25 to 44 Years | 35 (7.2%) | $61,442 |
| 45 to 64 Years | 221 (45.2%) | $35,489 |
| 65+ Years | 230 (47.0%) | $17,031 |
| Total | 489 (100.0%) | $30,689 |
Poverty in Alderson
Income Below Poverty by Sex and Age in Alderson
With 28.5% poverty level for males and 53.0% for females among the residents of Alderson, under 5 year old males and 16 and 17 year old females are the most vulnerable to poverty, with 22 males (100.0%) and 16 females (100.0%) in their respective age groups living below the poverty level.
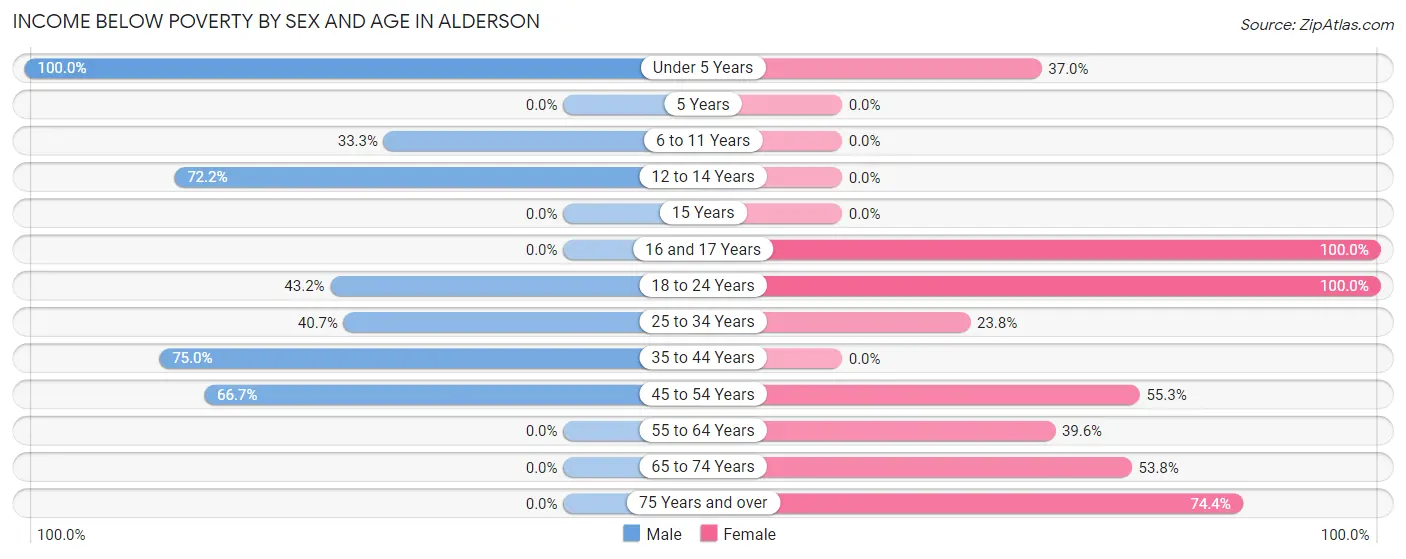
| Age Bracket | Male | Female |
| Under 5 Years | 22 (100.0%) | 10 (37.0%) |
| 5 Years | 0 (0.0%) | 0 (0.0%) |
| 6 to 11 Years | 6 (33.3%) | 0 (0.0%) |
| 12 to 14 Years | 13 (72.2%) | 0 (0.0%) |
| 15 Years | 0 (0.0%) | 0 (0.0%) |
| 16 and 17 Years | 0 (0.0%) | 16 (100.0%) |
| 18 to 24 Years | 16 (43.2%) | 28 (100.0%) |
| 25 to 34 Years | 22 (40.7%) | 10 (23.8%) |
| 35 to 44 Years | 18 (75.0%) | 0 (0.0%) |
| 45 to 54 Years | 32 (66.7%) | 42 (55.3%) |
| 55 to 64 Years | 0 (0.0%) | 36 (39.6%) |
| 65 to 74 Years | 0 (0.0%) | 71 (53.8%) |
| 75 Years and over | 0 (0.0%) | 61 (74.4%) |
| Total | 129 (28.5%) | 274 (53.0%) |
Income Above Poverty by Sex and Age in Alderson
According to the poverty statistics in Alderson, males aged 5 years and females aged 35 to 44 years are the age groups that are most secure financially, with 100.0% of males and 100.0% of females in these age groups living above the poverty line.
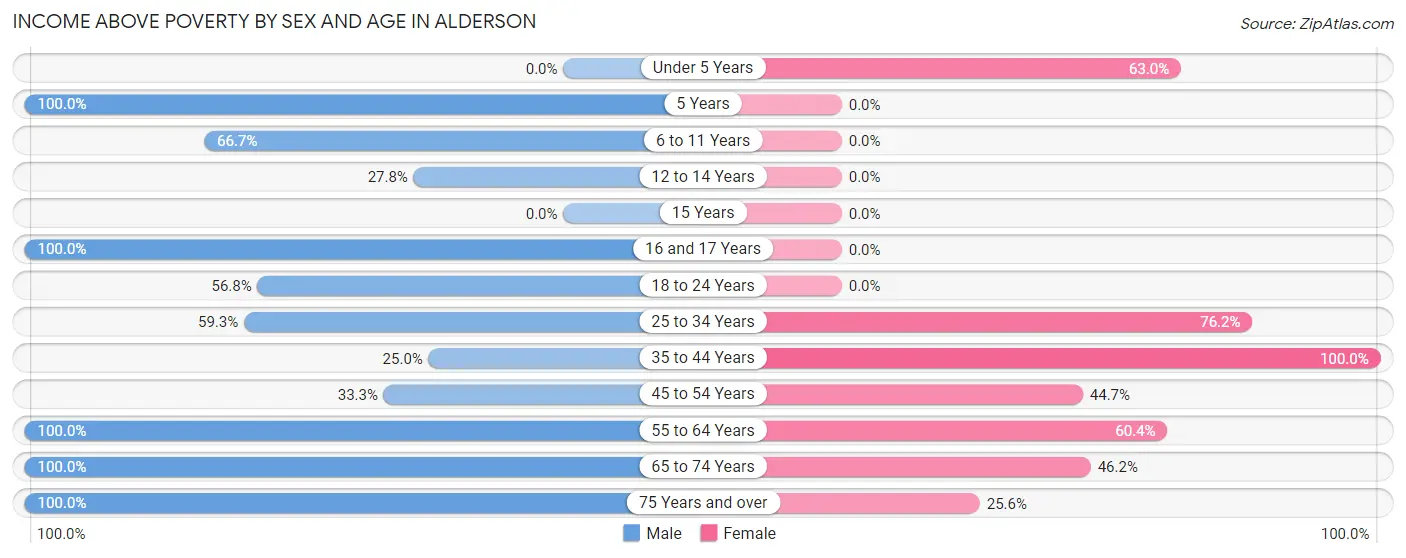
| Age Bracket | Male | Female |
| Under 5 Years | 0 (0.0%) | 17 (63.0%) |
| 5 Years | 6 (100.0%) | 0 (0.0%) |
| 6 to 11 Years | 12 (66.7%) | 0 (0.0%) |
| 12 to 14 Years | 5 (27.8%) | 0 (0.0%) |
| 15 Years | 0 (0.0%) | 0 (0.0%) |
| 16 and 17 Years | 11 (100.0%) | 0 (0.0%) |
| 18 to 24 Years | 21 (56.8%) | 0 (0.0%) |
| 25 to 34 Years | 32 (59.3%) | 32 (76.2%) |
| 35 to 44 Years | 6 (25.0%) | 23 (100.0%) |
| 45 to 54 Years | 16 (33.3%) | 34 (44.7%) |
| 55 to 64 Years | 147 (100.0%) | 55 (60.4%) |
| 65 to 74 Years | 38 (100.0%) | 61 (46.2%) |
| 75 Years and over | 29 (100.0%) | 21 (25.6%) |
| Total | 323 (71.5%) | 243 (47.0%) |
Income Below Poverty Among Married-Couple Families in Alderson
The poverty statistics for married-couple families in Alderson show that 12.4% or 14 of the total 113 families live below the poverty line. Families with 1 or 2 children have the highest poverty rate of 53.8%, comprising of 14 families. On the other hand, families with no children have the lowest poverty rate of 0.0%, which includes 0 families.
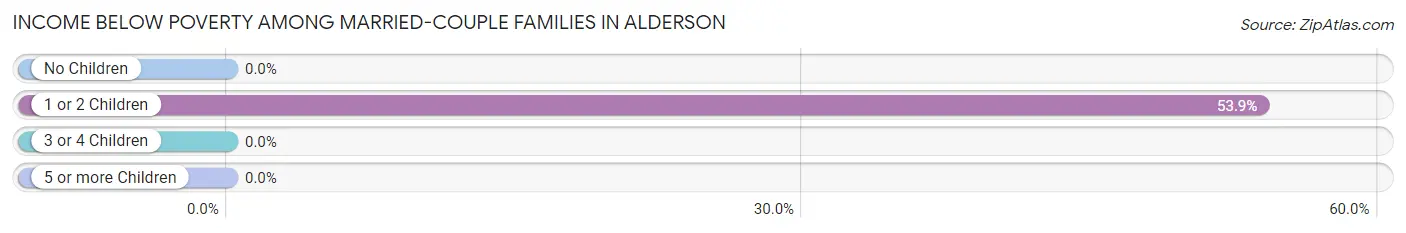
| Children | Above Poverty | Below Poverty |
| No Children | 87 (100.0%) | 0 (0.0%) |
| 1 or 2 Children | 12 (46.2%) | 14 (53.8%) |
| 3 or 4 Children | 0 (0.0%) | 0 (0.0%) |
| 5 or more Children | 0 (0.0%) | 0 (0.0%) |
| Total | 99 (87.6%) | 14 (12.4%) |
Income Below Poverty Among Single-Parent Households in Alderson
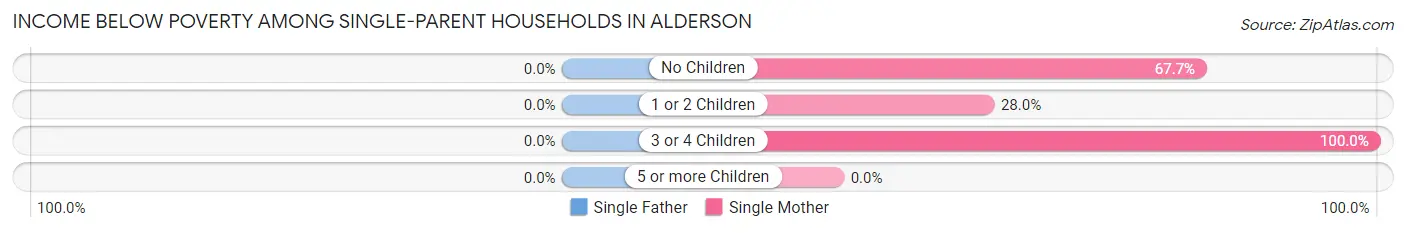
| Children | Single Father | Single Mother |
| No Children | 0 (0.0%) | 23 (67.6%) |
| 1 or 2 Children | 0 (0.0%) | 7 (28.0%) |
| 3 or 4 Children | 0 (0.0%) | 5 (100.0%) |
| 5 or more Children | 0 (0.0%) | 0 (0.0%) |
| Total | 0 (0.0%) | 35 (54.7%) |
Income Below Poverty Among Married-Couple vs Single-Parent Households in Alderson
The poverty data for Alderson shows that 14 of the married-couple family households (12.4%) and 35 of the single-parent households (45.5%) are living below the poverty level. Within the married-couple family households, those with 1 or 2 children have the highest poverty rate, with 14 households (53.8%) falling below the poverty line. Among the single-parent households, those with 3 or 4 children have the highest poverty rate, with 5 household (100.0%) living below poverty.
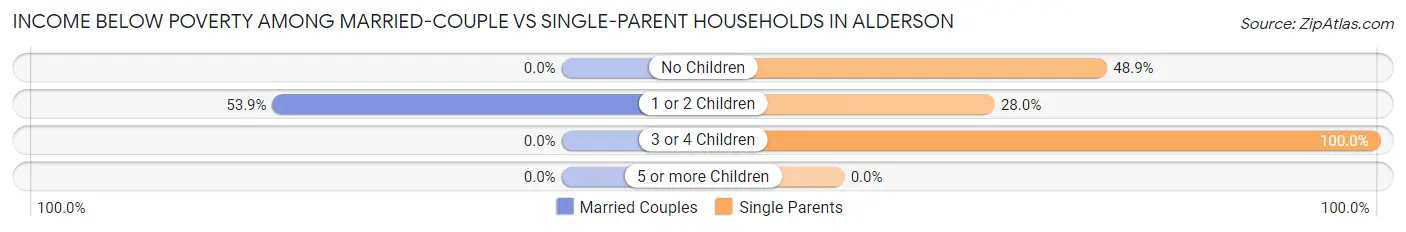
| Children | Married-Couple Families | Single-Parent Households |
| No Children | 0 (0.0%) | 23 (48.9%) |
| 1 or 2 Children | 14 (53.8%) | 7 (28.0%) |
| 3 or 4 Children | 0 (0.0%) | 5 (100.0%) |
| 5 or more Children | 0 (0.0%) | 0 (0.0%) |
| Total | 14 (12.4%) | 35 (45.5%) |
Race in Alderson
The most populous races in Alderson are White / Caucasian (915 | 94.4%), Black / African American (29 | 3.0%), and Hispanic or Latino (23 | 2.4%).
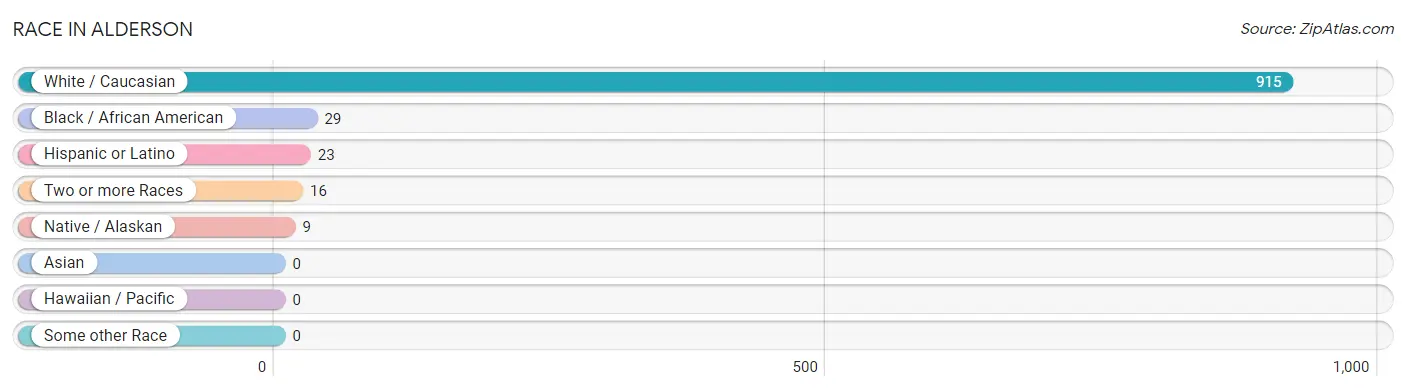
| Race | # Population | % Population |
| Asian | 0 | 0.0% |
| Black / African American | 29 | 3.0% |
| Hawaiian / Pacific | 0 | 0.0% |
| Hispanic or Latino | 23 | 2.4% |
| Native / Alaskan | 9 | 0.9% |
| White / Caucasian | 915 | 94.4% |
| Two or more Races | 16 | 1.7% |
| Some other Race | 0 | 0.0% |
| Total | 969 | 100.0% |
Ancestry in Alderson
The most populous ancestries reported in Alderson are American (372 | 38.4%), Irish (106 | 10.9%), English (58 | 6.0%), Swiss (26 | 2.7%), and Mexican (23 | 2.4%), together accounting for 60.4% of all Alderson residents.
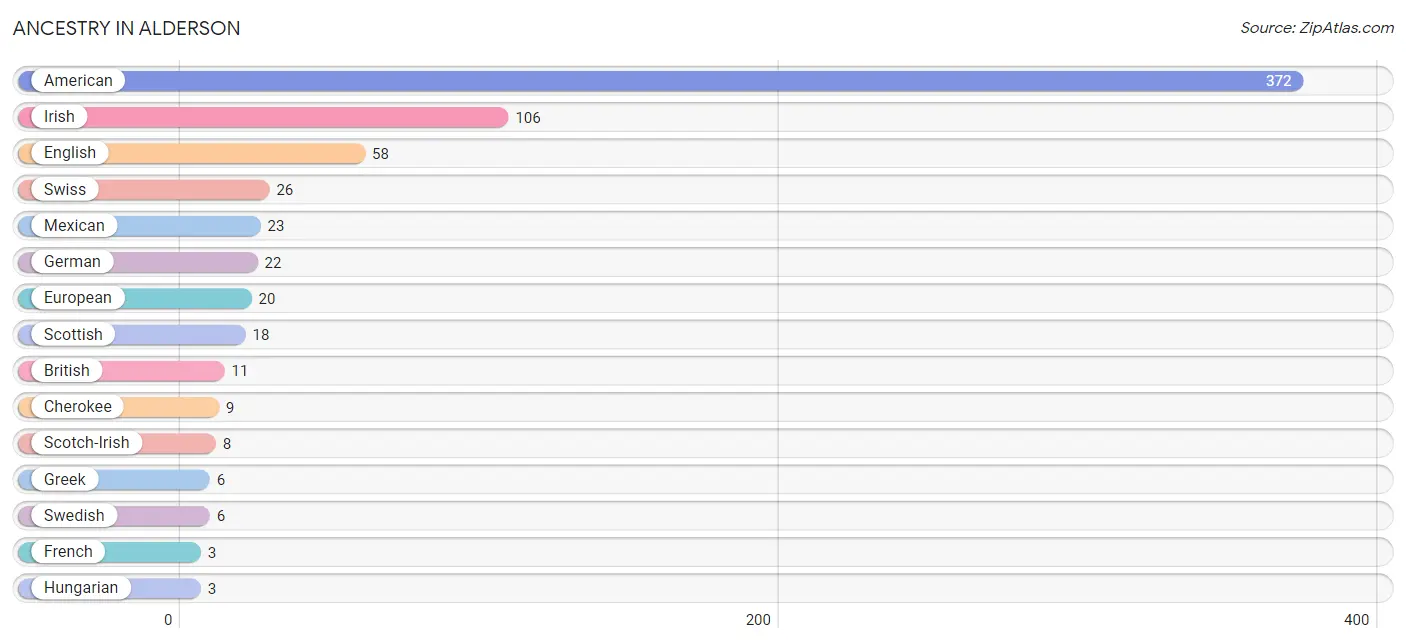
| Ancestry | # Population | % Population |
| American | 372 | 38.4% |
| British | 11 | 1.1% |
| Cherokee | 9 | 0.9% |
| English | 58 | 6.0% |
| European | 20 | 2.1% |
| French | 3 | 0.3% |
| German | 22 | 2.3% |
| Greek | 6 | 0.6% |
| Hungarian | 3 | 0.3% |
| Irish | 106 | 10.9% |
| Mexican | 23 | 2.4% |
| Scotch-Irish | 8 | 0.8% |
| Scottish | 18 | 1.9% |
| Swedish | 6 | 0.6% |
| Swiss | 26 | 2.7% | View All 15 Rows |
Immigrants in Alderson

| Immigration Origin | # Population | % Population | View All 0 Rows |
Sex and Age in Alderson
Sex and Age in Alderson
The most populous age groups in Alderson are 55 to 59 Years (83 | 18.4%) for men and 70 to 74 Years (88 | 17.0%) for women.
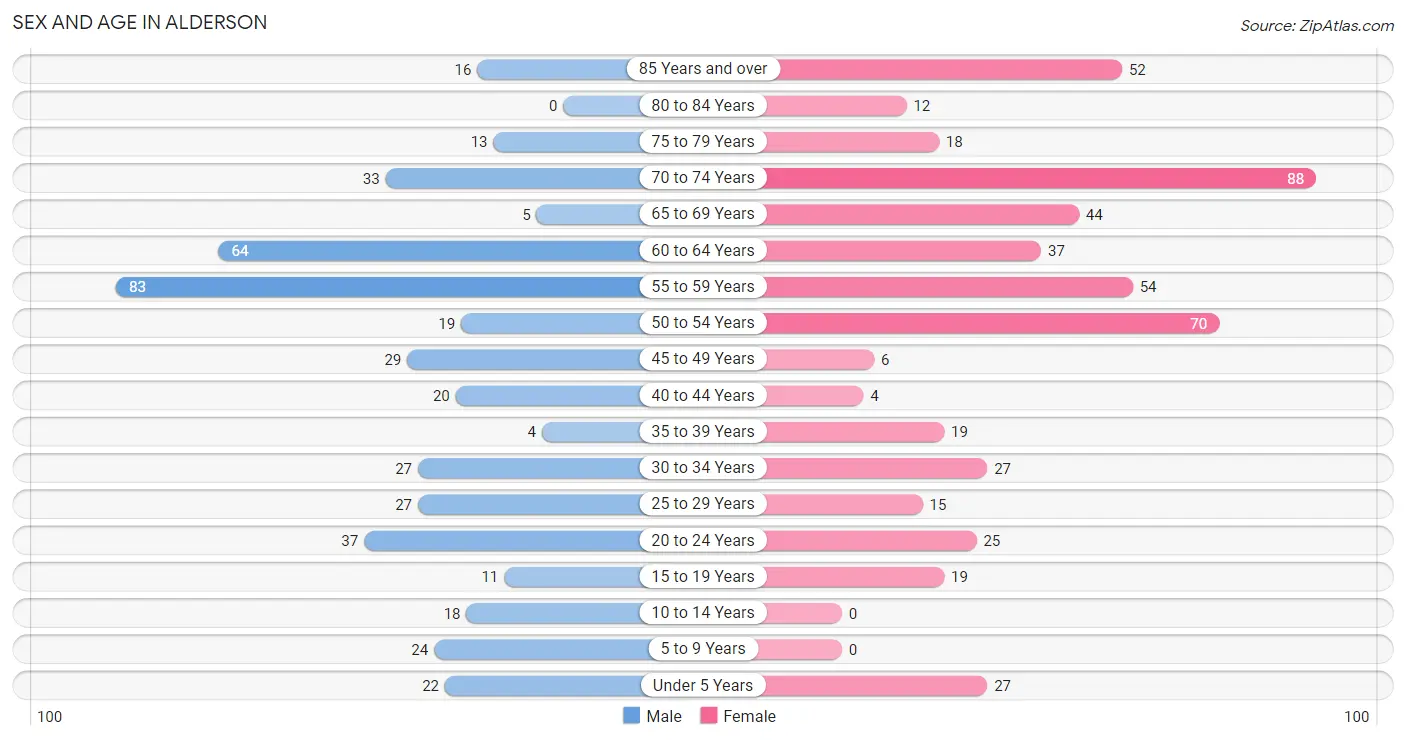
| Age Bracket | Male | Female |
| Under 5 Years | 22 (4.9%) | 27 (5.2%) |
| 5 to 9 Years | 24 (5.3%) | 0 (0.0%) |
| 10 to 14 Years | 18 (4.0%) | 0 (0.0%) |
| 15 to 19 Years | 11 (2.4%) | 19 (3.7%) |
| 20 to 24 Years | 37 (8.2%) | 25 (4.8%) |
| 25 to 29 Years | 27 (6.0%) | 15 (2.9%) |
| 30 to 34 Years | 27 (6.0%) | 27 (5.2%) |
| 35 to 39 Years | 4 (0.9%) | 19 (3.7%) |
| 40 to 44 Years | 20 (4.4%) | 4 (0.8%) |
| 45 to 49 Years | 29 (6.4%) | 6 (1.2%) |
| 50 to 54 Years | 19 (4.2%) | 70 (13.5%) |
| 55 to 59 Years | 83 (18.4%) | 54 (10.4%) |
| 60 to 64 Years | 64 (14.2%) | 37 (7.2%) |
| 65 to 69 Years | 5 (1.1%) | 44 (8.5%) |
| 70 to 74 Years | 33 (7.3%) | 88 (17.0%) |
| 75 to 79 Years | 13 (2.9%) | 18 (3.5%) |
| 80 to 84 Years | 0 (0.0%) | 12 (2.3%) |
| 85 Years and over | 16 (3.5%) | 52 (10.1%) |
| Total | 452 (100.0%) | 517 (100.0%) |
Families and Households in Alderson
Median Family Size in Alderson
The median family size in Alderson is 3.25 persons per family, with single female/mother families (64 | 33.7%) accounting for the largest median family size of 3.42 persons per family. On the other hand, single male/father families (13 | 6.8%) represent the smallest median family size with 2.46 persons per family.
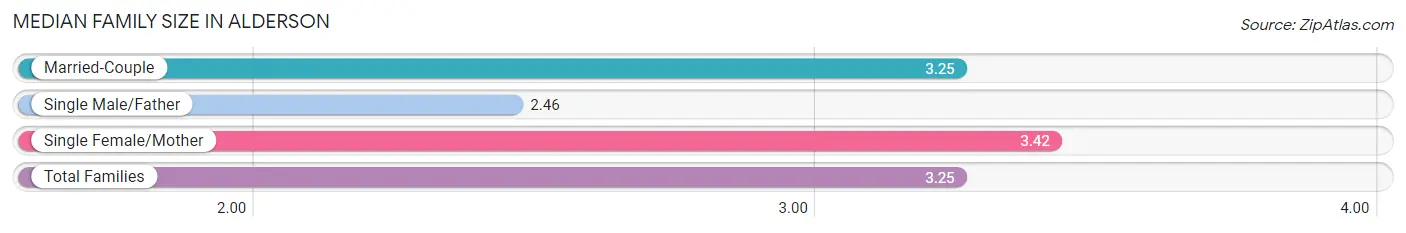
| Family Type | # Families | Family Size |
| Married-Couple | 113 (59.5%) | 3.25 |
| Single Male/Father | 13 (6.8%) | 2.46 |
| Single Female/Mother | 64 (33.7%) | 3.42 |
| Total Families | 190 (100.0%) | 3.25 |
Median Household Size in Alderson
The median household size in Alderson is 1.98 persons per household, with single female/mother households (64 | 13.1%) accounting for the largest median household size of 3.86 persons per household. non-family households (299 | 61.2%) represent the smallest median household size with 1.08 persons per household.
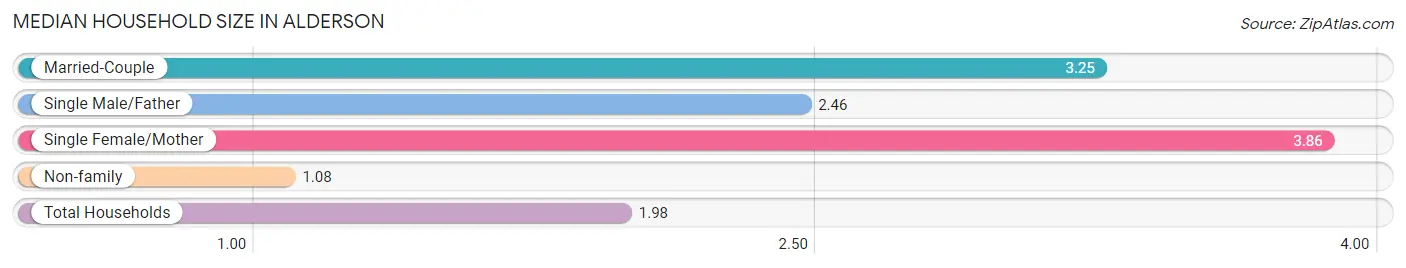
| Household Type | # Households | Household Size |
| Married-Couple | 113 (23.1%) | 3.25 |
| Single Male/Father | 13 (2.7%) | 2.46 |
| Single Female/Mother | 64 (13.1%) | 3.86 |
| Non-family | 299 (61.2%) | 1.08 |
| Total Households | 489 (100.0%) | 1.98 |
Household Size by Marriage Status in Alderson
Out of a total of 489 households in Alderson, 190 (38.9%) are family households, while 299 (61.2%) are nonfamily households. The most numerous type of family households are 2-person households, comprising 110, and the most common type of nonfamily households are 1-person households, comprising 272.
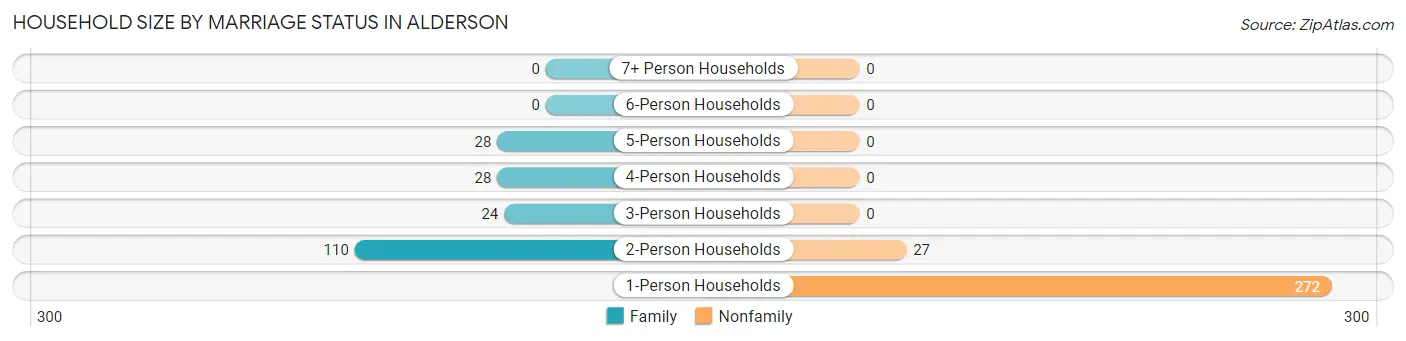
| Household Size | Family Households | Nonfamily Households |
| 1-Person Households | - | 272 (55.6%) |
| 2-Person Households | 110 (22.5%) | 27 (5.5%) |
| 3-Person Households | 24 (4.9%) | 0 (0.0%) |
| 4-Person Households | 28 (5.7%) | 0 (0.0%) |
| 5-Person Households | 28 (5.7%) | 0 (0.0%) |
| 6-Person Households | 0 (0.0%) | 0 (0.0%) |
| 7+ Person Households | 0 (0.0%) | 0 (0.0%) |
| Total | 190 (38.9%) | 299 (61.2%) |
Female Fertility in Alderson
Fertility by Age in Alderson
Average fertility rate in Alderson is 26.0 births per 1,000 women. Women in the age bracket of 15 to 19 years have the highest fertility rate with 158.0 births per 1,000 women. Women in the age bracket of 15 to 19 years acount for 100.0% of all women with births.
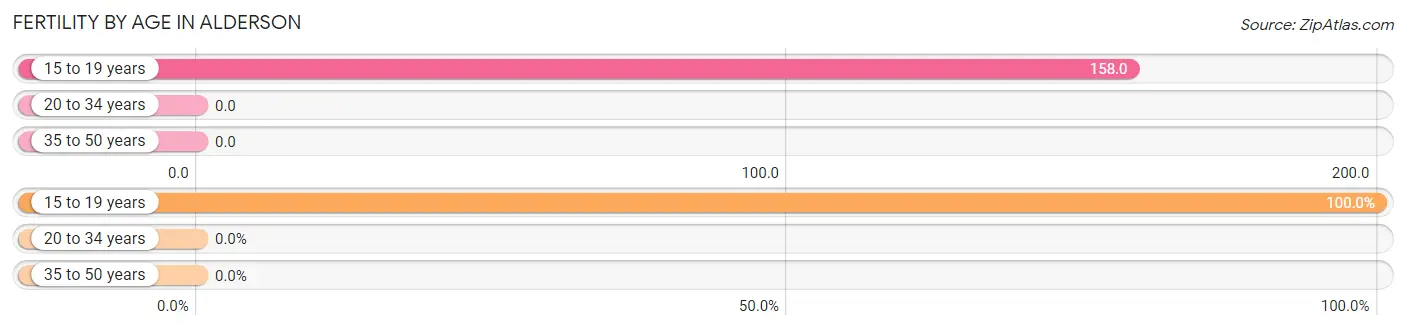
| Age Bracket | Women with Births | Births / 1,000 Women |
| 15 to 19 years | 3 (100.0%) | 158.0 |
| 20 to 34 years | 0 (0.0%) | 0.0 |
| 35 to 50 years | 0 (0.0%) | 0.0 |
| Total | 3 (100.0%) | 26.0 |
Fertility by Age by Marriage Status in Alderson
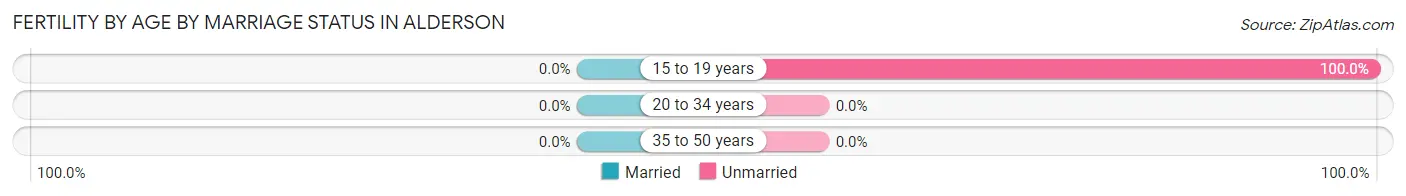
| Age Bracket | Married | Unmarried |
| 15 to 19 years | 0 (0.0%) | 3 (100.0%) |
| 20 to 34 years | 0 (0.0%) | 0 (0.0%) |
| 35 to 50 years | 0 (0.0%) | 0 (0.0%) |
| Total | 0 (0.0%) | 3 (100.0%) |
Fertility by Education in Alderson
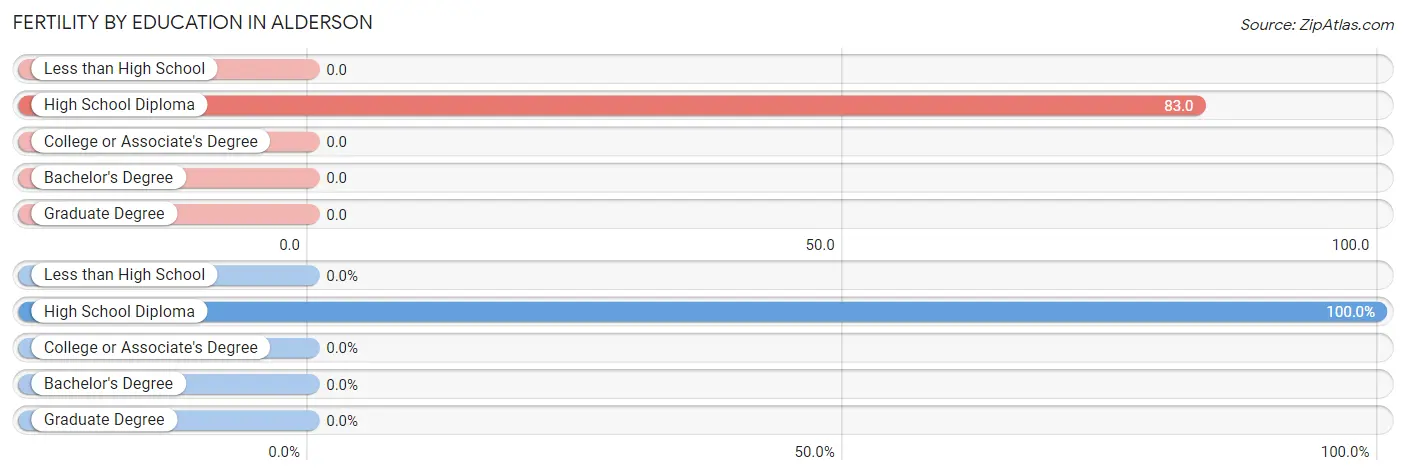
| Educational Attainment | Women with Births | Births / 1,000 Women |
| Less than High School | 0 (0.0%) | 0.0 |
| High School Diploma | 3 (100.0%) | 83.0 |
| College or Associate's Degree | 0 (0.0%) | 0.0 |
| Bachelor's Degree | 0 (0.0%) | 0.0 |
| Graduate Degree | 0 (0.0%) | 0.0 |
| Total | 3 (100.0%) | 26.0 |
Fertility by Education by Marriage Status in Alderson
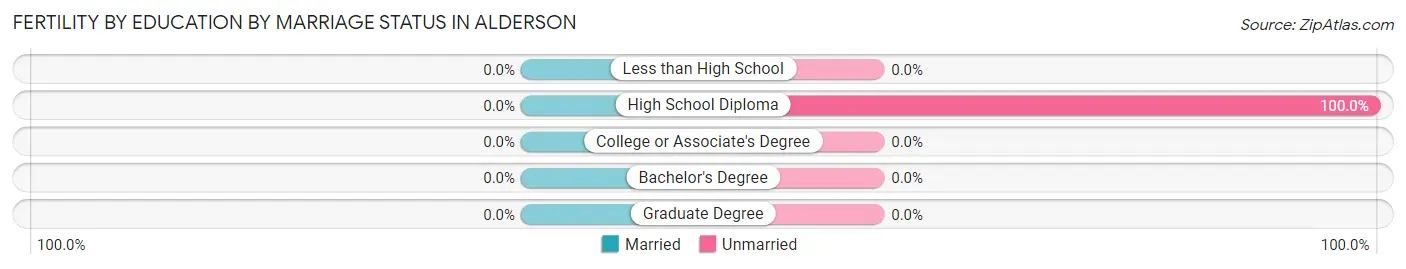
| Educational Attainment | Married | Unmarried |
| Less than High School | 0 (0.0%) | 0 (0.0%) |
| High School Diploma | 0 (0.0%) | 3 (100.0%) |
| College or Associate's Degree | 0 (0.0%) | 0 (0.0%) |
| Bachelor's Degree | 0 (0.0%) | 0 (0.0%) |
| Graduate Degree | 0 (0.0%) | 0 (0.0%) |
| Total | 0 (0.0%) | 3 (100.0%) |
Employment Characteristics in Alderson
Employment by Class of Employer in Alderson
Among the 275 employed individuals in Alderson, private company employees (219 | 79.6%), state government employees (28 | 10.2%), and self-employed (incorporated) (14 | 5.1%) make up the most common classes of employment.
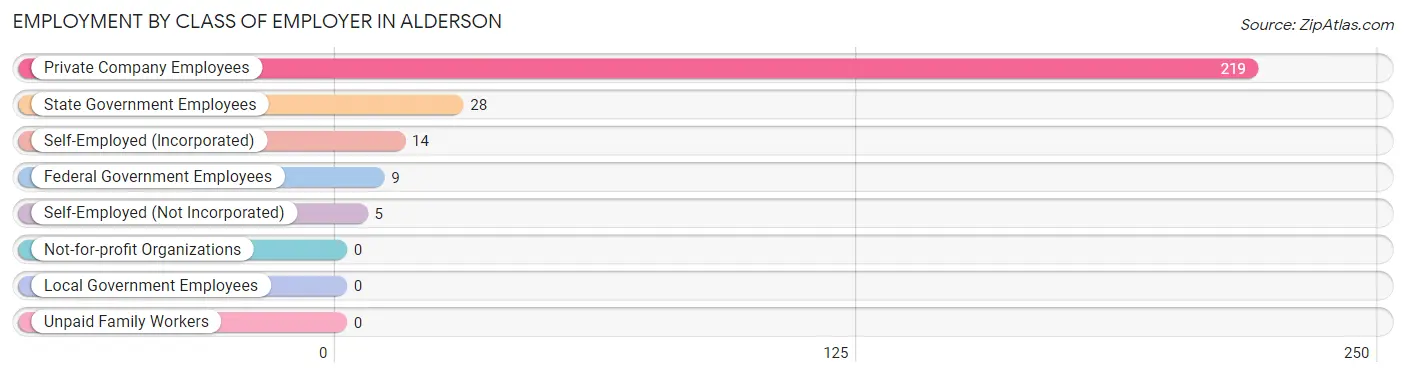
| Employer Class | # Employees | % Employees |
| Private Company Employees | 219 | 79.6% |
| Self-Employed (Incorporated) | 14 | 5.1% |
| Self-Employed (Not Incorporated) | 5 | 1.8% |
| Not-for-profit Organizations | 0 | 0.0% |
| Local Government Employees | 0 | 0.0% |
| State Government Employees | 28 | 10.2% |
| Federal Government Employees | 9 | 3.3% |
| Unpaid Family Workers | 0 | 0.0% |
| Total | 275 | 100.0% |
Employment Status by Age in Alderson
According to the labor force statistics for Alderson, out of the total population over 16 years of age (878), 33.7% or 296 individuals are in the labor force, with 1.7% or 5 of them unemployed. The age group with the highest labor force participation rate is 35 to 44 years, with 83.0% or 39 individuals in the labor force. Within the labor force, the 20 to 24 years age range has the highest percentage of unemployed individuals, with 11.9% or 5 of them being unemployed.
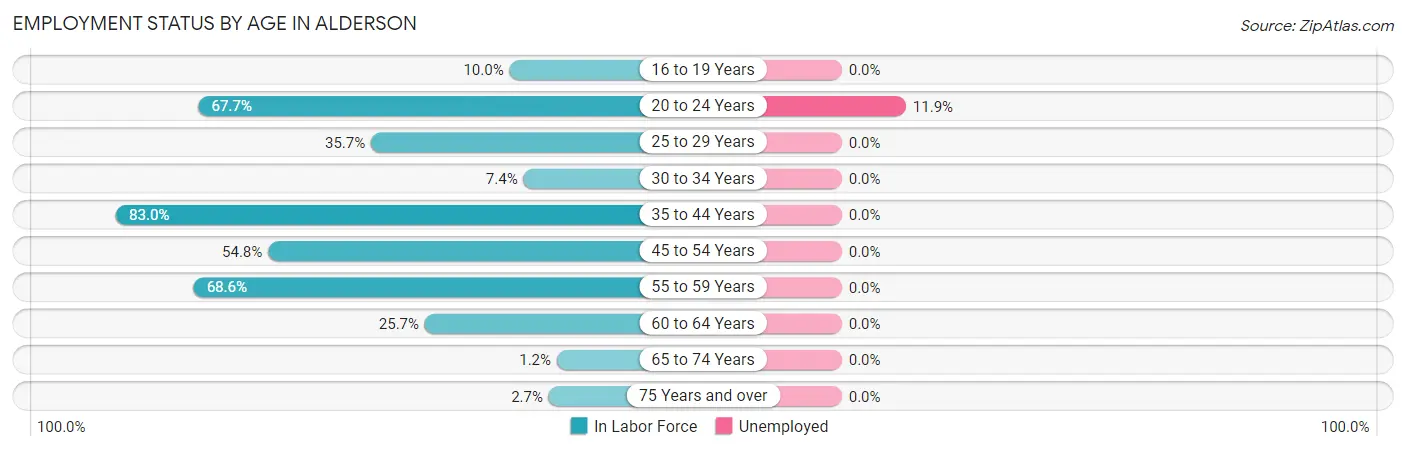
| Age Bracket | In Labor Force | Unemployed |
| 16 to 19 Years | 3 (10.0%) | 0 (0.0%) |
| 20 to 24 Years | 42 (67.7%) | 5 (11.9%) |
| 25 to 29 Years | 15 (35.7%) | 0 (0.0%) |
| 30 to 34 Years | 4 (7.4%) | 0 (0.0%) |
| 35 to 44 Years | 39 (83.0%) | 0 (0.0%) |
| 45 to 54 Years | 68 (54.8%) | 0 (0.0%) |
| 55 to 59 Years | 94 (68.6%) | 0 (0.0%) |
| 60 to 64 Years | 26 (25.7%) | 0 (0.0%) |
| 65 to 74 Years | 2 (1.2%) | 0 (0.0%) |
| 75 Years and over | 3 (2.7%) | 0 (0.0%) |
| Total | 296 (33.7%) | 5 (1.7%) |
Employment Status by Educational Attainment in Alderson
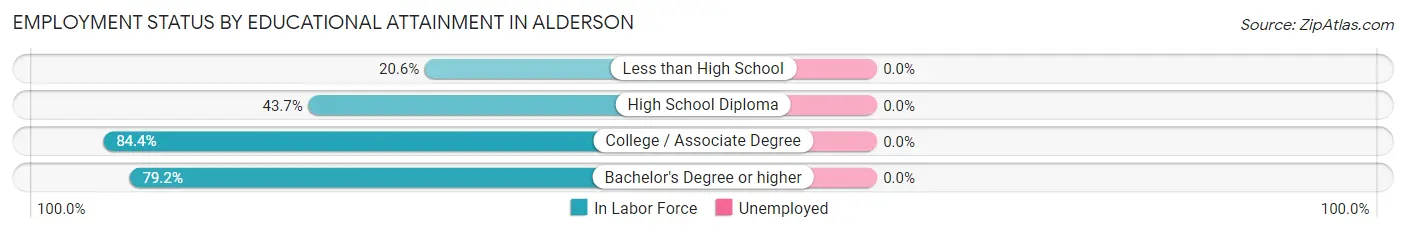
| Educational Attainment | In Labor Force | Unemployed |
| Less than High School | 22 (20.6%) | 0 (0.0%) |
| High School Diploma | 117 (43.7%) | 0 (0.0%) |
| College / Associate Degree | 65 (84.4%) | 0 (0.0%) |
| Bachelor's Degree or higher | 42 (79.2%) | 0 (0.0%) |
| Total | 246 (48.7%) | 0 (0.0%) |
Employment Occupations by Sex in Alderson
Management, Business, Science and Arts Occupations
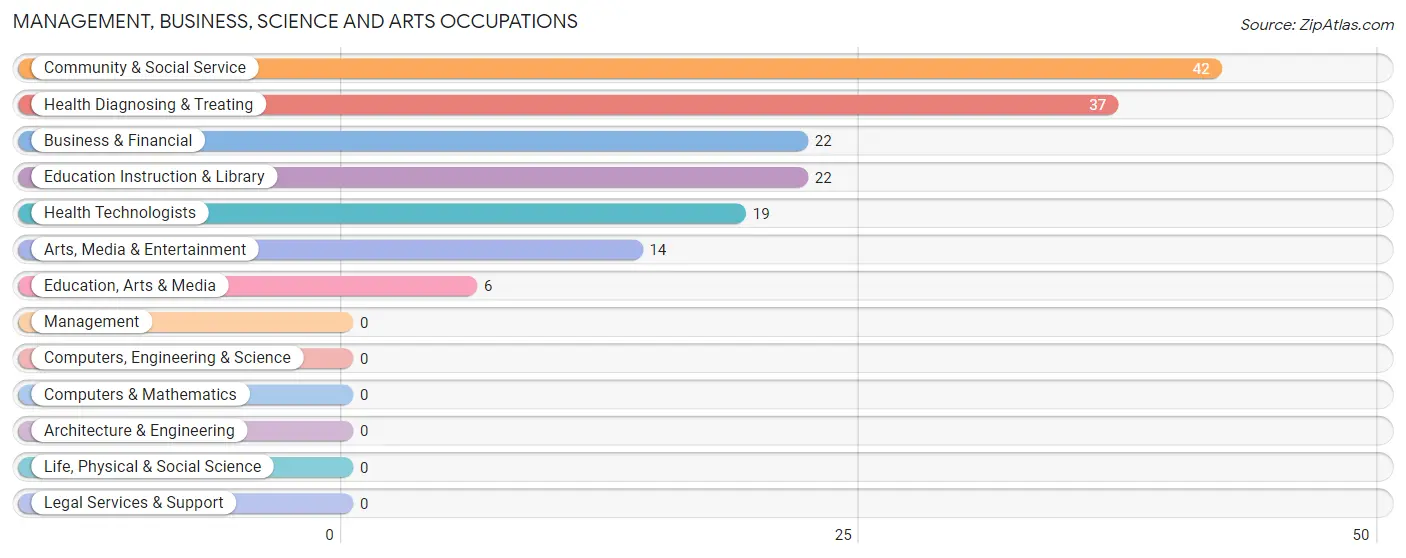
The most common Management, Business, Science and Arts occupations in Alderson are Community & Social Service (42 | 14.4%), Health Diagnosing & Treating (37 | 12.7%), Business & Financial (22 | 7.6%), Education Instruction & Library (22 | 7.6%), and Health Technologists (19 | 6.5%).
Management, Business, Science and Arts Occupations by Sex
Within the Management, Business, Science and Arts occupations in Alderson, the most male-oriented occupations are Arts, Media & Entertainment (100.0%), Business & Financial (72.7%), and Health Diagnosing & Treating (48.6%), while the most female-oriented occupations are Education, Arts & Media (100.0%), Education Instruction & Library (100.0%), and Health Technologists (100.0%).
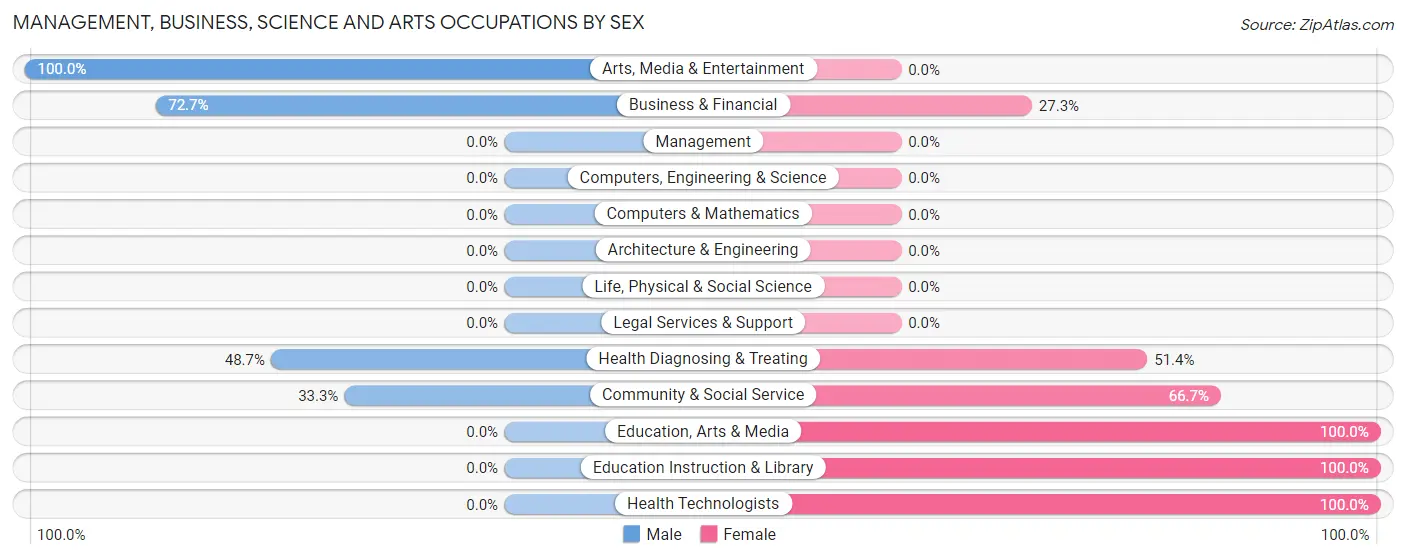
| Occupation | Male | Female |
| Management | 0 (0.0%) | 0 (0.0%) |
| Business & Financial | 16 (72.7%) | 6 (27.3%) |
| Computers, Engineering & Science | 0 (0.0%) | 0 (0.0%) |
| Computers & Mathematics | 0 (0.0%) | 0 (0.0%) |
| Architecture & Engineering | 0 (0.0%) | 0 (0.0%) |
| Life, Physical & Social Science | 0 (0.0%) | 0 (0.0%) |
| Community & Social Service | 14 (33.3%) | 28 (66.7%) |
| Education, Arts & Media | 0 (0.0%) | 6 (100.0%) |
| Legal Services & Support | 0 (0.0%) | 0 (0.0%) |
| Education Instruction & Library | 0 (0.0%) | 22 (100.0%) |
| Arts, Media & Entertainment | 14 (100.0%) | 0 (0.0%) |
| Health Diagnosing & Treating | 18 (48.6%) | 19 (51.3%) |
| Health Technologists | 0 (0.0%) | 19 (100.0%) |
| Total (Category) | 48 (47.5%) | 53 (52.5%) |
| Total (Overall) | 173 (59.5%) | 118 (40.6%) |
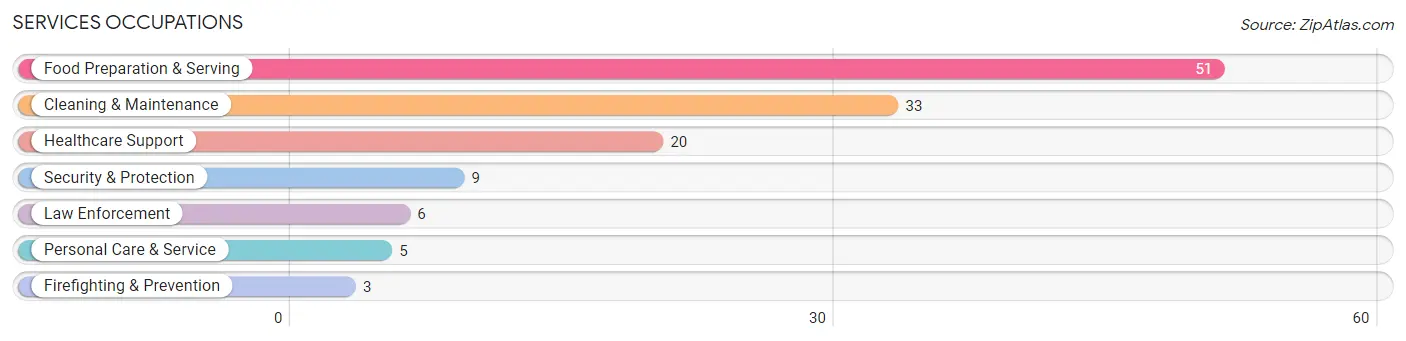
Services Occupations
The most common Services occupations in Alderson are Food Preparation & Serving (51 | 17.5%), Cleaning & Maintenance (33 | 11.3%), Healthcare Support (20 | 6.9%), Security & Protection (9 | 3.1%), and Law Enforcement (6 | 2.1%).
Services Occupations by Sex
Within the Services occupations in Alderson, the most male-oriented occupations are Law Enforcement (100.0%), Cleaning & Maintenance (84.9%), and Security & Protection (66.7%), while the most female-oriented occupations are Healthcare Support (100.0%), Firefighting & Prevention (100.0%), and Personal Care & Service (100.0%).
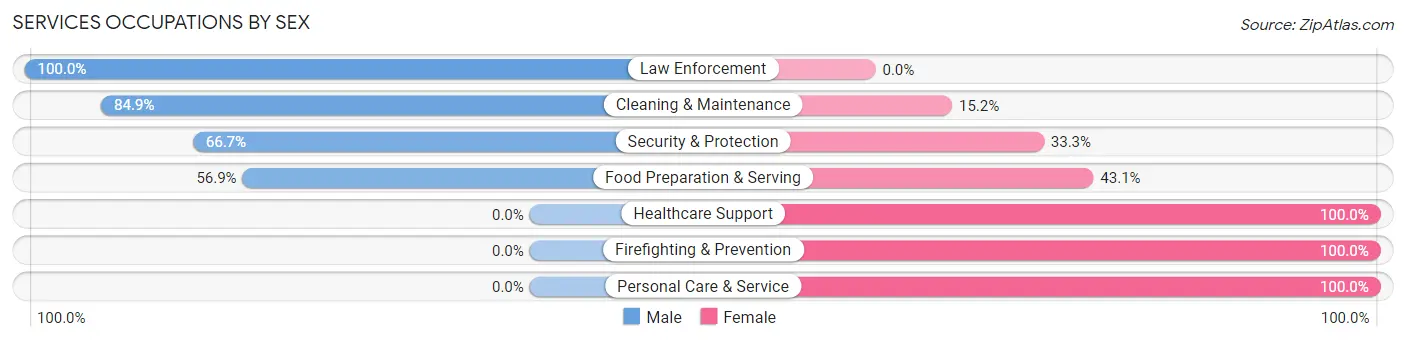
| Occupation | Male | Female |
| Healthcare Support | 0 (0.0%) | 20 (100.0%) |
| Security & Protection | 6 (66.7%) | 3 (33.3%) |
| Firefighting & Prevention | 0 (0.0%) | 3 (100.0%) |
| Law Enforcement | 6 (100.0%) | 0 (0.0%) |
| Food Preparation & Serving | 29 (56.9%) | 22 (43.1%) |
| Cleaning & Maintenance | 28 (84.9%) | 5 (15.1%) |
| Personal Care & Service | 0 (0.0%) | 5 (100.0%) |
| Total (Category) | 63 (53.4%) | 55 (46.6%) |
| Total (Overall) | 173 (59.5%) | 118 (40.6%) |
Sales and Office Occupations
The most common Sales and Office occupations in Alderson are Office & Administration (10 | 3.4%), and Sales & Related (5 | 1.7%).
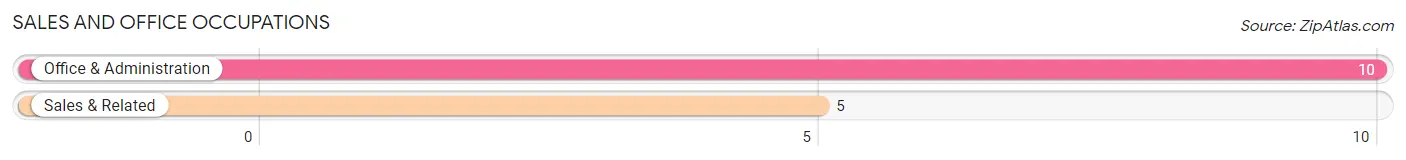
Sales and Office Occupations by Sex
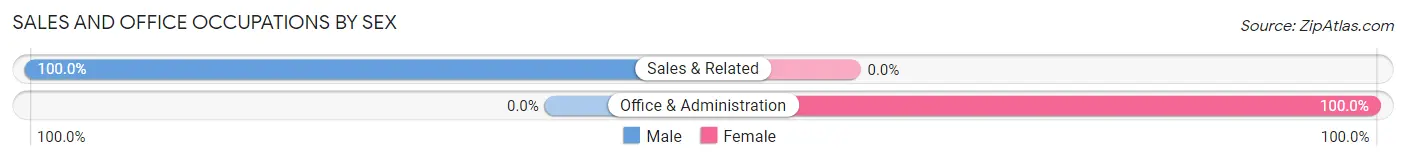
| Occupation | Male | Female |
| Sales & Related | 5 (100.0%) | 0 (0.0%) |
| Office & Administration | 0 (0.0%) | 10 (100.0%) |
| Total (Category) | 5 (33.3%) | 10 (66.7%) |
| Total (Overall) | 173 (59.5%) | 118 (40.6%) |
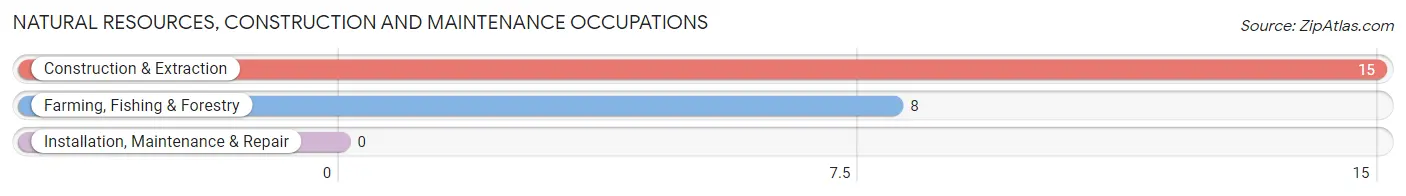
Natural Resources, Construction and Maintenance Occupations
The most common Natural Resources, Construction and Maintenance occupations in Alderson are Construction & Extraction (15 | 5.1%), and Farming, Fishing & Forestry (8 | 2.8%).
Natural Resources, Construction and Maintenance Occupations by Sex
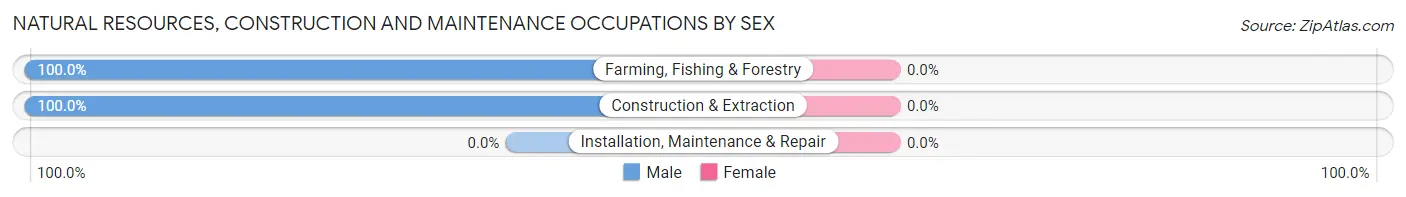
| Occupation | Male | Female |
| Farming, Fishing & Forestry | 8 (100.0%) | 0 (0.0%) |
| Construction & Extraction | 15 (100.0%) | 0 (0.0%) |
| Installation, Maintenance & Repair | 0 (0.0%) | 0 (0.0%) |
| Total (Category) | 23 (100.0%) | 0 (0.0%) |
| Total (Overall) | 173 (59.5%) | 118 (40.6%) |
Production, Transportation and Moving Occupations
The most common Production, Transportation and Moving occupations in Alderson are , and Transportation (34 | 11.7%).
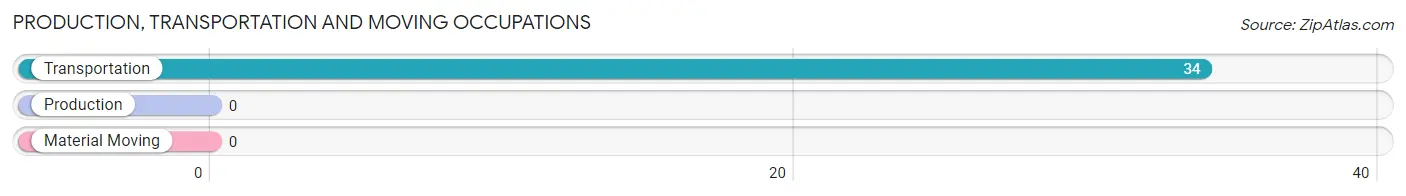
Production, Transportation and Moving Occupations by Sex
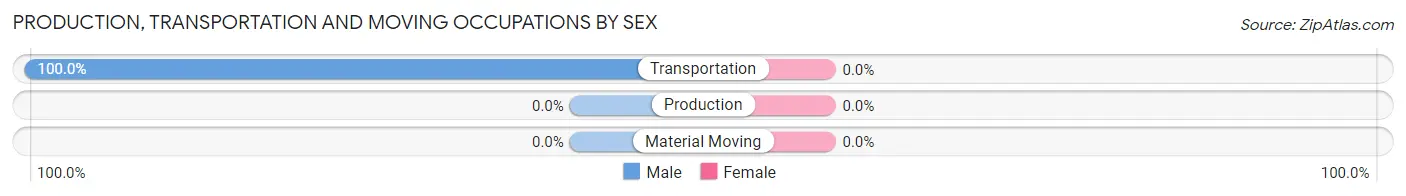
| Occupation | Male | Female |
| Production | 0 (0.0%) | 0 (0.0%) |
| Transportation | 34 (100.0%) | 0 (0.0%) |
| Material Moving | 0 (0.0%) | 0 (0.0%) |
| Total (Category) | 34 (100.0%) | 0 (0.0%) |
| Total (Overall) | 173 (59.5%) | 118 (40.6%) |
Employment Industries by Sex in Alderson
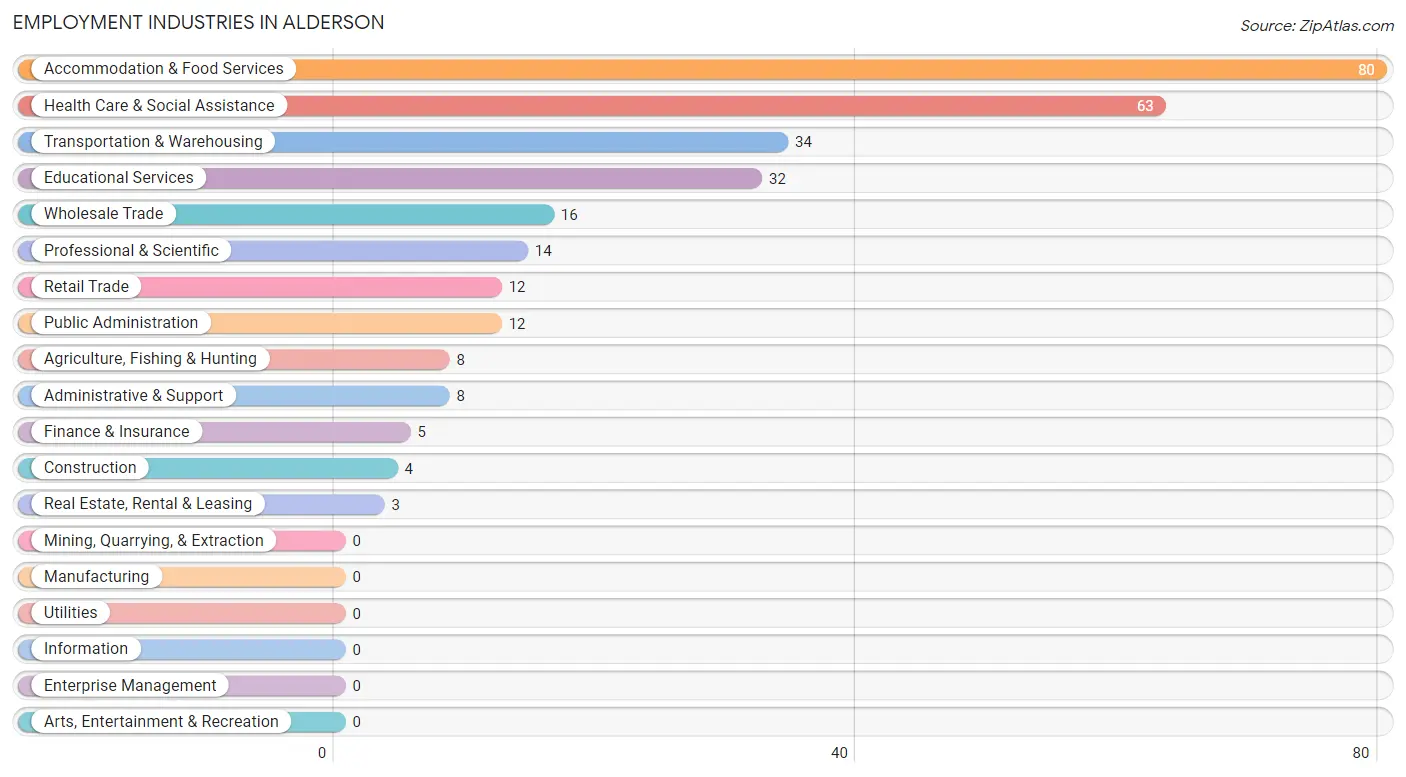
Employment Industries in Alderson
The major employment industries in Alderson include Accommodation & Food Services (80 | 27.5%), Health Care & Social Assistance (63 | 21.6%), Transportation & Warehousing (34 | 11.7%), Educational Services (32 | 11.0%), and Wholesale Trade (16 | 5.5%).
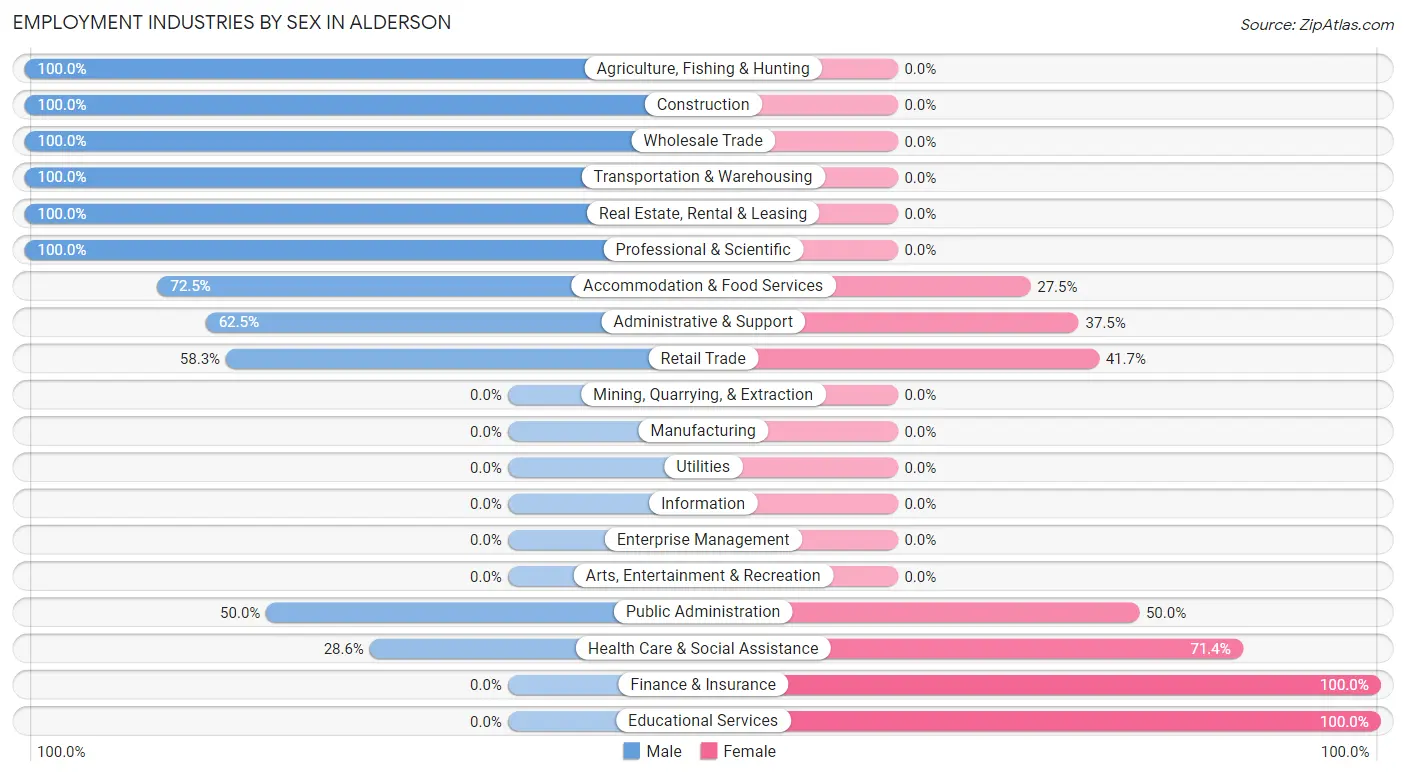
Employment Industries by Sex in Alderson
The Alderson industries that see more men than women are Agriculture, Fishing & Hunting (100.0%), Construction (100.0%), and Wholesale Trade (100.0%), whereas the industries that tend to have a higher number of women are Finance & Insurance (100.0%), Educational Services (100.0%), and Health Care & Social Assistance (71.4%).
| Industry | Male | Female |
| Agriculture, Fishing & Hunting | 8 (100.0%) | 0 (0.0%) |
| Mining, Quarrying, & Extraction | 0 (0.0%) | 0 (0.0%) |
| Construction | 4 (100.0%) | 0 (0.0%) |
| Manufacturing | 0 (0.0%) | 0 (0.0%) |
| Wholesale Trade | 16 (100.0%) | 0 (0.0%) |
| Retail Trade | 7 (58.3%) | 5 (41.7%) |
| Transportation & Warehousing | 34 (100.0%) | 0 (0.0%) |
| Utilities | 0 (0.0%) | 0 (0.0%) |
| Information | 0 (0.0%) | 0 (0.0%) |
| Finance & Insurance | 0 (0.0%) | 5 (100.0%) |
| Real Estate, Rental & Leasing | 3 (100.0%) | 0 (0.0%) |
| Professional & Scientific | 14 (100.0%) | 0 (0.0%) |
| Enterprise Management | 0 (0.0%) | 0 (0.0%) |
| Administrative & Support | 5 (62.5%) | 3 (37.5%) |
| Educational Services | 0 (0.0%) | 32 (100.0%) |
| Health Care & Social Assistance | 18 (28.6%) | 45 (71.4%) |
| Arts, Entertainment & Recreation | 0 (0.0%) | 0 (0.0%) |
| Accommodation & Food Services | 58 (72.5%) | 22 (27.5%) |
| Public Administration | 6 (50.0%) | 6 (50.0%) |
| Total | 173 (59.5%) | 118 (40.6%) |
Education in Alderson
School Enrollment in Alderson
The most common levels of schooling among the 82 students in Alderson are high school (56 | 68.3%), elementary school (12 | 14.6%), and nursery / preschool (11 | 13.4%).

| School Level | # Students | % Students |
| Nursery / Preschool | 11 | 13.4% |
| Kindergarten | 3 | 3.7% |
| Elementary School | 12 | 14.6% |
| Middle School | 0 | 0.0% |
| High School | 56 | 68.3% |
| College / Undergraduate | 0 | 0.0% |
| Graduate / Professional | 0 | 0.0% |
| Total | 82 | 100.0% |
School Enrollment by Age by Funding Source in Alderson
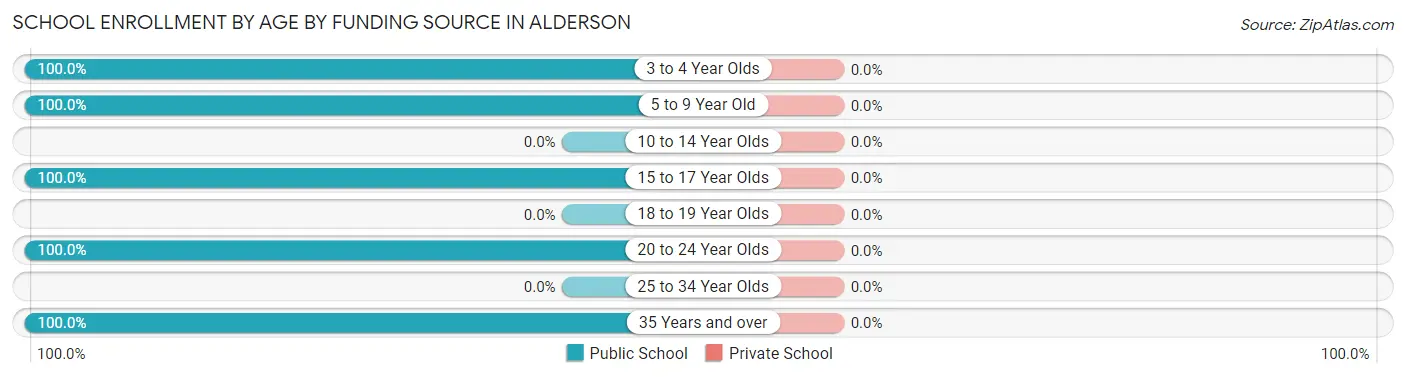
| Age Bracket | Public School | Private School |
| 3 to 4 Year Olds | 14 (100.0%) | 0 (0.0%) |
| 5 to 9 Year Old | 12 (100.0%) | 0 (0.0%) |
| 10 to 14 Year Olds | 0 (0.0%) | 0 (0.0%) |
| 15 to 17 Year Olds | 27 (100.0%) | 0 (0.0%) |
| 18 to 19 Year Olds | 0 (0.0%) | 0 (0.0%) |
| 20 to 24 Year Olds | 20 (100.0%) | 0 (0.0%) |
| 25 to 34 Year Olds | 0 (0.0%) | 0 (0.0%) |
| 35 Years and over | 9 (100.0%) | 0 (0.0%) |
| Total | 82 (100.0%) | 0 (0.0%) |
Educational Attainment by Field of Study in Alderson
Education (30 | 29.7%), science & technology (28 | 27.7%), arts & humanities (10 | 9.9%), liberal arts & history (8 | 7.9%), and business (7 | 6.9%) are the most common fields of study among 101 individuals in Alderson who have obtained a bachelor's degree or higher.
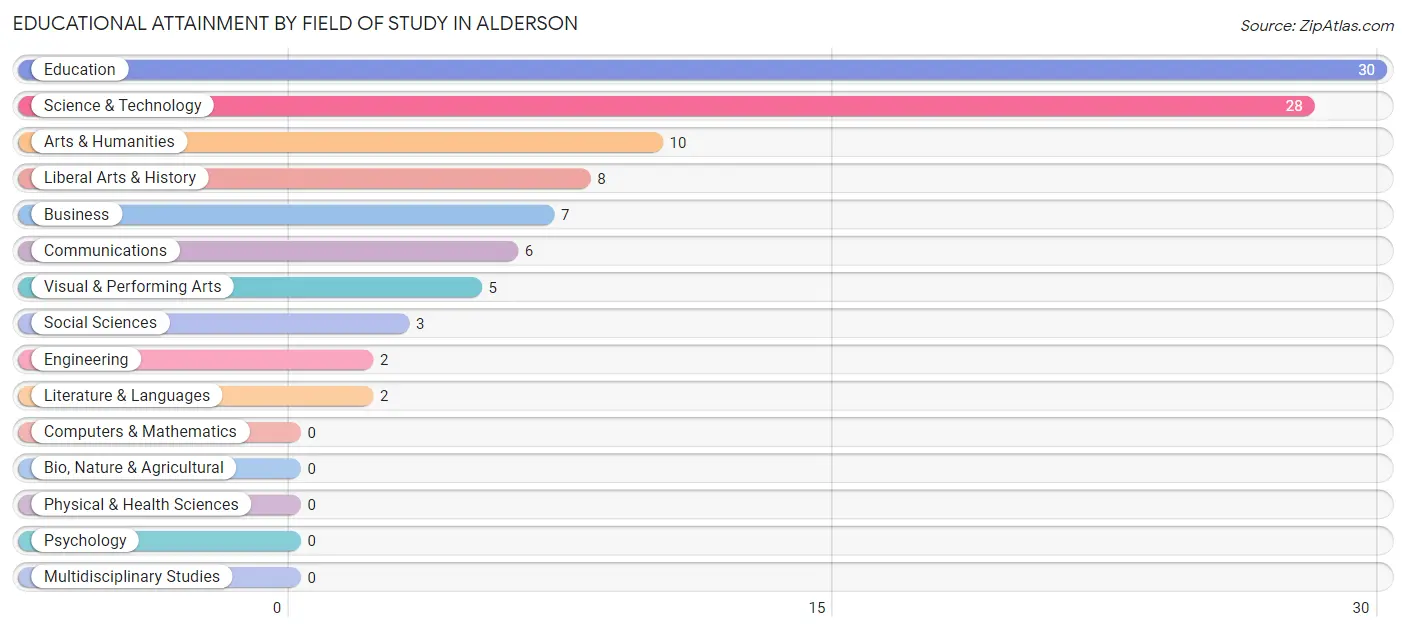
| Field of Study | # Graduates | % Graduates |
| Computers & Mathematics | 0 | 0.0% |
| Bio, Nature & Agricultural | 0 | 0.0% |
| Physical & Health Sciences | 0 | 0.0% |
| Psychology | 0 | 0.0% |
| Social Sciences | 3 | 3.0% |
| Engineering | 2 | 2.0% |
| Multidisciplinary Studies | 0 | 0.0% |
| Science & Technology | 28 | 27.7% |
| Business | 7 | 6.9% |
| Education | 30 | 29.7% |
| Literature & Languages | 2 | 2.0% |
| Liberal Arts & History | 8 | 7.9% |
| Visual & Performing Arts | 5 | 5.0% |
| Communications | 6 | 5.9% |
| Arts & Humanities | 10 | 9.9% |
| Total | 101 | 100.0% |
Transportation & Commute in Alderson
Vehicle Availability by Sex in Alderson
The most prevalent vehicle ownership categories in Alderson are males with 2 vehicles (113, accounting for 72.0%) and females with 2 vehicles (80, making up 95.8%).
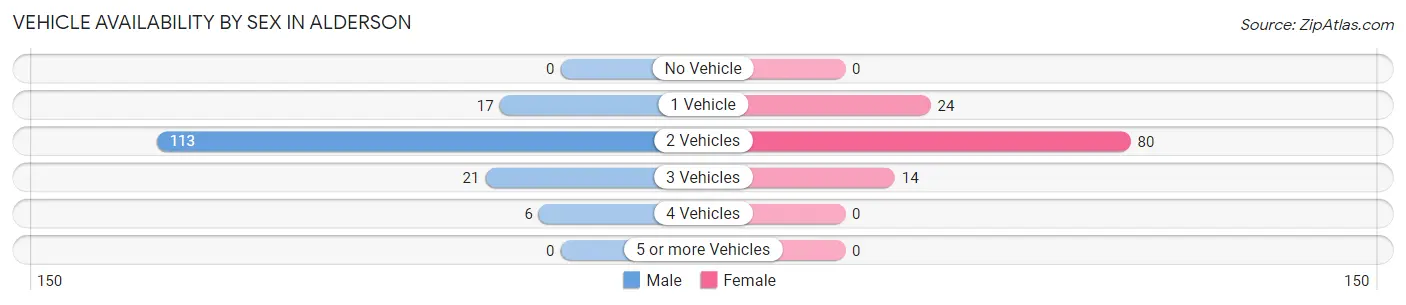
| Vehicles Available | Male | Female |
| No Vehicle | 0 (0.0%) | 0 (0.0%) |
| 1 Vehicle | 17 (10.8%) | 24 (20.3%) |
| 2 Vehicles | 113 (72.0%) | 80 (67.8%) |
| 3 Vehicles | 21 (13.4%) | 14 (11.9%) |
| 4 Vehicles | 6 (3.8%) | 0 (0.0%) |
| 5 or more Vehicles | 0 (0.0%) | 0 (0.0%) |
| Total | 157 (100.0%) | 118 (100.0%) |
Commute Time in Alderson
The most frequently occuring commute durations in Alderson are 30 to 34 minutes (92 commuters, 35.2%), less than 5 minutes (52 commuters, 19.9%), and 35 to 39 minutes (40 commuters, 15.3%).
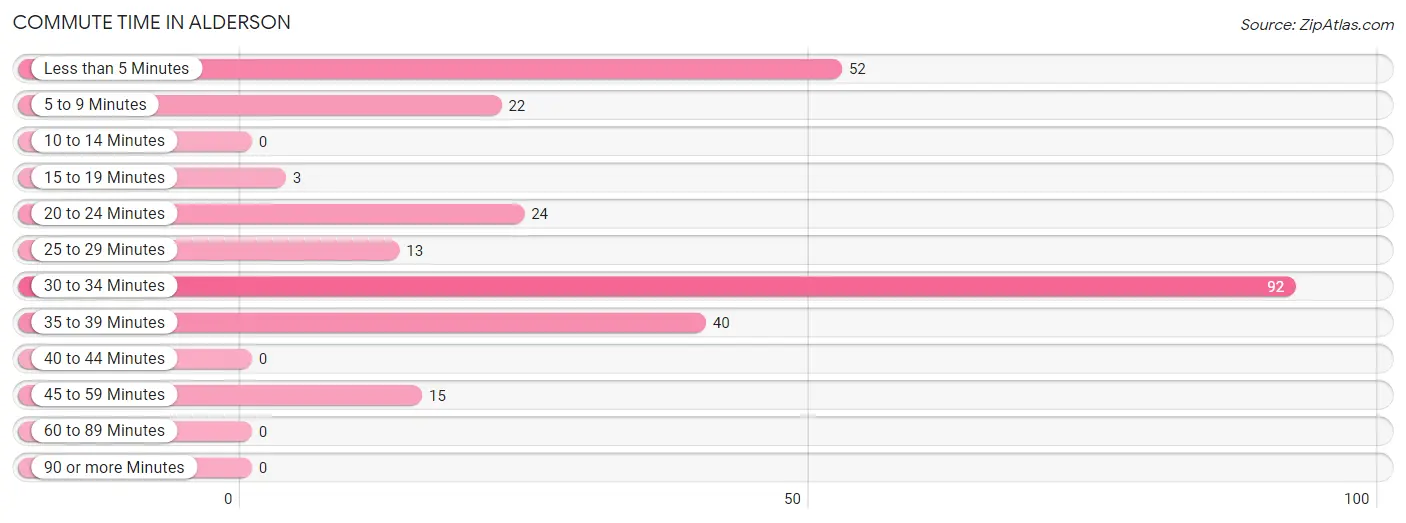
| Commute Time | # Commuters | % Commuters |
| Less than 5 Minutes | 52 | 19.9% |
| 5 to 9 Minutes | 22 | 8.4% |
| 10 to 14 Minutes | 0 | 0.0% |
| 15 to 19 Minutes | 3 | 1.1% |
| 20 to 24 Minutes | 24 | 9.2% |
| 25 to 29 Minutes | 13 | 5.0% |
| 30 to 34 Minutes | 92 | 35.2% |
| 35 to 39 Minutes | 40 | 15.3% |
| 40 to 44 Minutes | 0 | 0.0% |
| 45 to 59 Minutes | 15 | 5.8% |
| 60 to 89 Minutes | 0 | 0.0% |
| 90 or more Minutes | 0 | 0.0% |
Commute Time by Sex in Alderson
The most common commute times in Alderson are 30 to 34 minutes (72 commuters, 50.3%) for males and less than 5 minutes (39 commuters, 33.1%) for females.
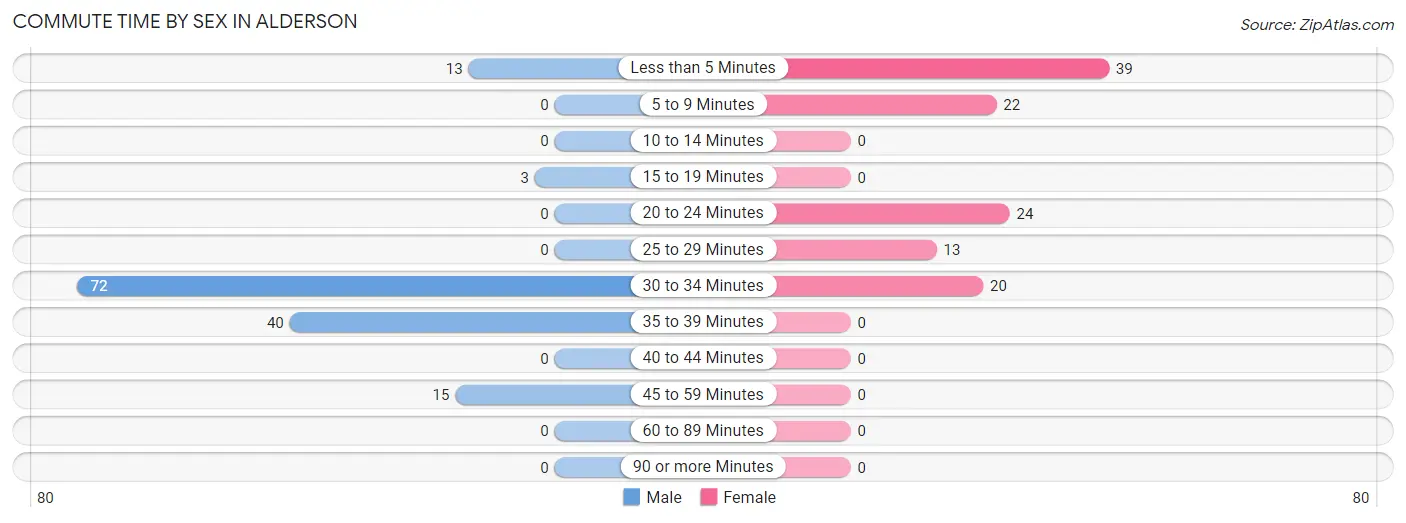
| Commute Time | Male | Female |
| Less than 5 Minutes | 13 (9.1%) | 39 (33.1%) |
| 5 to 9 Minutes | 0 (0.0%) | 22 (18.6%) |
| 10 to 14 Minutes | 0 (0.0%) | 0 (0.0%) |
| 15 to 19 Minutes | 3 (2.1%) | 0 (0.0%) |
| 20 to 24 Minutes | 0 (0.0%) | 24 (20.3%) |
| 25 to 29 Minutes | 0 (0.0%) | 13 (11.0%) |
| 30 to 34 Minutes | 72 (50.3%) | 20 (17.0%) |
| 35 to 39 Minutes | 40 (28.0%) | 0 (0.0%) |
| 40 to 44 Minutes | 0 (0.0%) | 0 (0.0%) |
| 45 to 59 Minutes | 15 (10.5%) | 0 (0.0%) |
| 60 to 89 Minutes | 0 (0.0%) | 0 (0.0%) |
| 90 or more Minutes | 0 (0.0%) | 0 (0.0%) |
Time of Departure to Work by Sex in Alderson
The most frequent times of departure to work in Alderson are 4:00 PM to 11:59 PM (50, 35.0%) for males and 7:30 AM to 7:59 AM (50, 42.4%) for females.
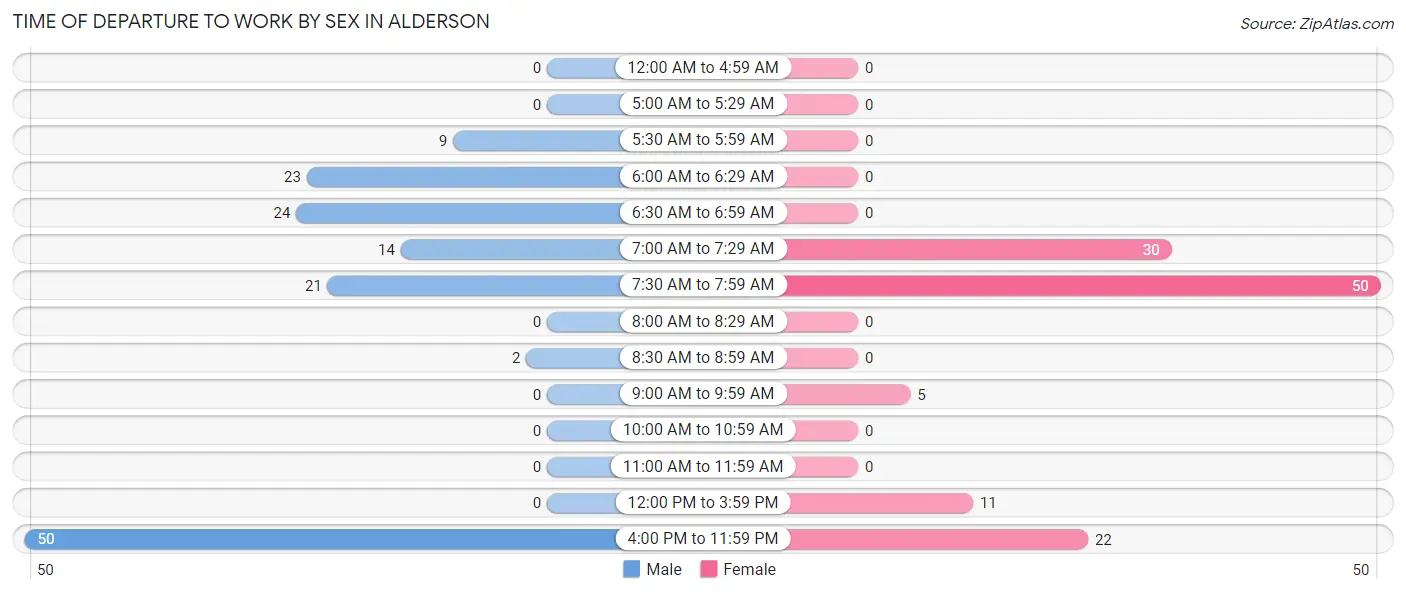
| Time of Departure | Male | Female |
| 12:00 AM to 4:59 AM | 0 (0.0%) | 0 (0.0%) |
| 5:00 AM to 5:29 AM | 0 (0.0%) | 0 (0.0%) |
| 5:30 AM to 5:59 AM | 9 (6.3%) | 0 (0.0%) |
| 6:00 AM to 6:29 AM | 23 (16.1%) | 0 (0.0%) |
| 6:30 AM to 6:59 AM | 24 (16.8%) | 0 (0.0%) |
| 7:00 AM to 7:29 AM | 14 (9.8%) | 30 (25.4%) |
| 7:30 AM to 7:59 AM | 21 (14.7%) | 50 (42.4%) |
| 8:00 AM to 8:29 AM | 0 (0.0%) | 0 (0.0%) |
| 8:30 AM to 8:59 AM | 2 (1.4%) | 0 (0.0%) |
| 9:00 AM to 9:59 AM | 0 (0.0%) | 5 (4.2%) |
| 10:00 AM to 10:59 AM | 0 (0.0%) | 0 (0.0%) |
| 11:00 AM to 11:59 AM | 0 (0.0%) | 0 (0.0%) |
| 12:00 PM to 3:59 PM | 0 (0.0%) | 11 (9.3%) |
| 4:00 PM to 11:59 PM | 50 (35.0%) | 22 (18.6%) |
| Total | 143 (100.0%) | 118 (100.0%) |
Housing Occupancy in Alderson
Occupancy by Ownership in Alderson
Of the total 489 dwellings in Alderson, owner-occupied units account for 330 (67.5%), while renter-occupied units make up 159 (32.5%).
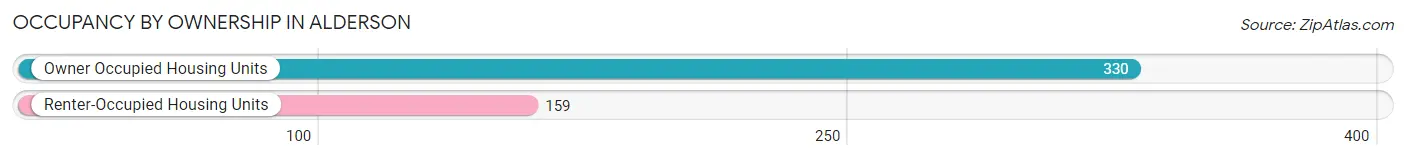
| Occupancy | # Housing Units | % Housing Units |
| Owner Occupied Housing Units | 330 | 67.5% |
| Renter-Occupied Housing Units | 159 | 32.5% |
| Total Occupied Housing Units | 489 | 100.0% |
Occupancy by Household Size in Alderson
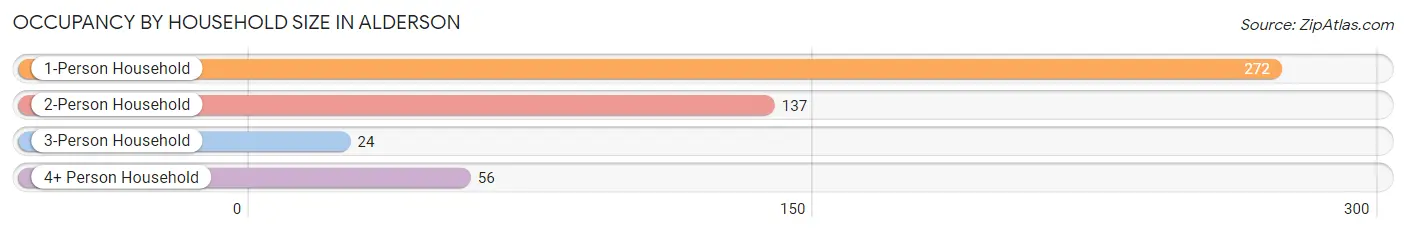
| Household Size | # Housing Units | % Housing Units |
| 1-Person Household | 272 | 55.6% |
| 2-Person Household | 137 | 28.0% |
| 3-Person Household | 24 | 4.9% |
| 4+ Person Household | 56 | 11.5% |
| Total Housing Units | 489 | 100.0% |
Occupancy by Ownership by Household Size in Alderson
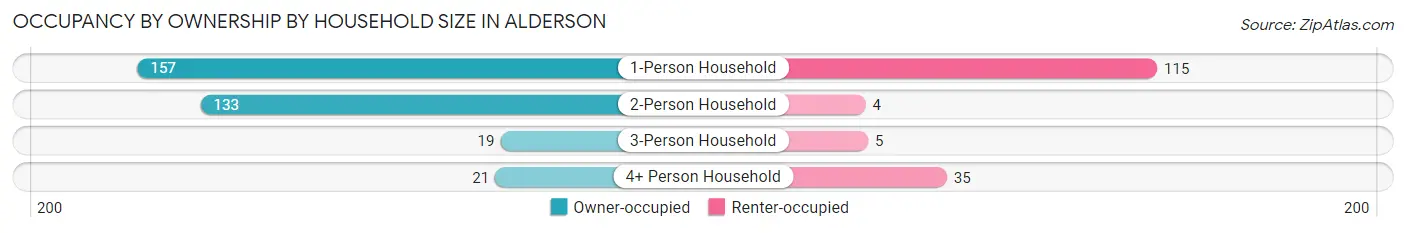
| Household Size | Owner-occupied | Renter-occupied |
| 1-Person Household | 157 (57.7%) | 115 (42.3%) |
| 2-Person Household | 133 (97.1%) | 4 (2.9%) |
| 3-Person Household | 19 (79.2%) | 5 (20.8%) |
| 4+ Person Household | 21 (37.5%) | 35 (62.5%) |
| Total Housing Units | 330 (67.5%) | 159 (32.5%) |
Occupancy by Educational Attainment in Alderson
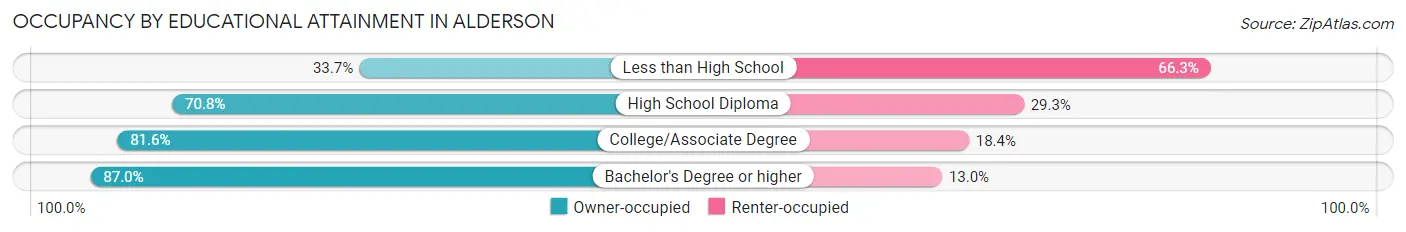
| Household Size | Owner-occupied | Renter-occupied |
| Less than High School | 31 (33.7%) | 61 (66.3%) |
| High School Diploma | 179 (70.8%) | 74 (29.2%) |
| College/Associate Degree | 80 (81.6%) | 18 (18.4%) |
| Bachelor's Degree or higher | 40 (87.0%) | 6 (13.0%) |
Occupancy by Age of Householder in Alderson
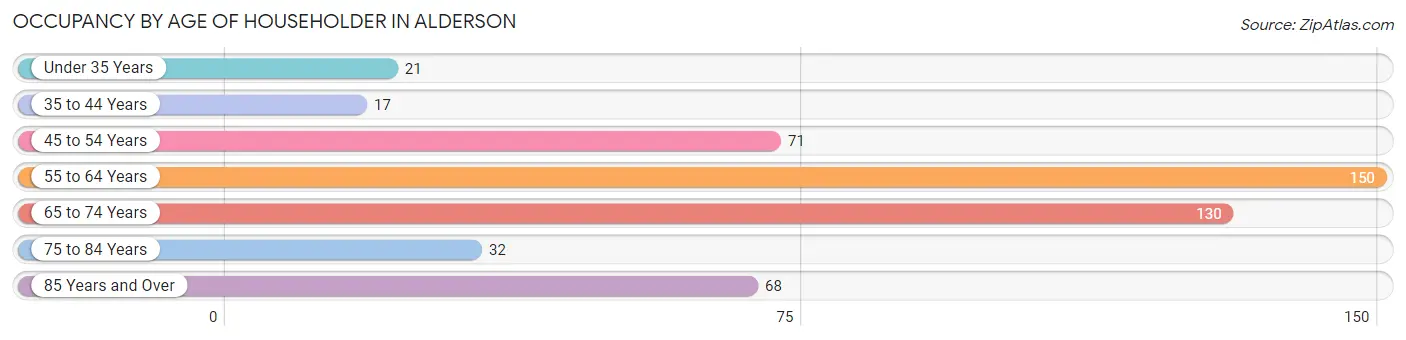
| Age Bracket | # Households | % Households |
| Under 35 Years | 21 | 4.3% |
| 35 to 44 Years | 17 | 3.5% |
| 45 to 54 Years | 71 | 14.5% |
| 55 to 64 Years | 150 | 30.7% |
| 65 to 74 Years | 130 | 26.6% |
| 75 to 84 Years | 32 | 6.5% |
| 85 Years and Over | 68 | 13.9% |
| Total | 489 | 100.0% |
Housing Finances in Alderson
Median Income by Occupancy in Alderson
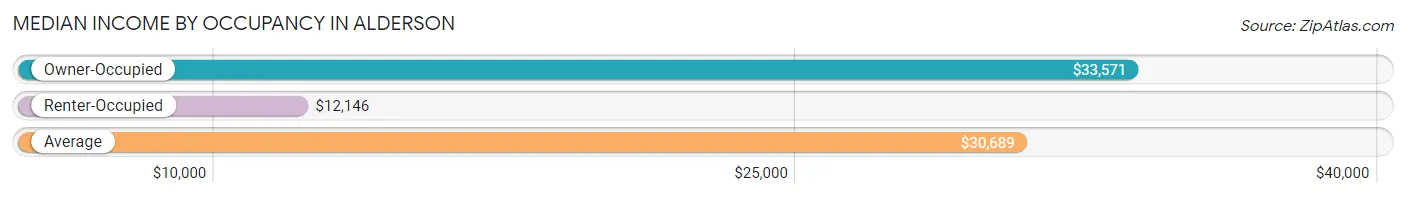
| Occupancy Type | # Households | Median Income |
| Owner-Occupied | 330 (67.5%) | $33,571 |
| Renter-Occupied | 159 (32.5%) | $12,146 |
| Average | 489 (100.0%) | $30,689 |
Occupancy by Householder Income Bracket in Alderson
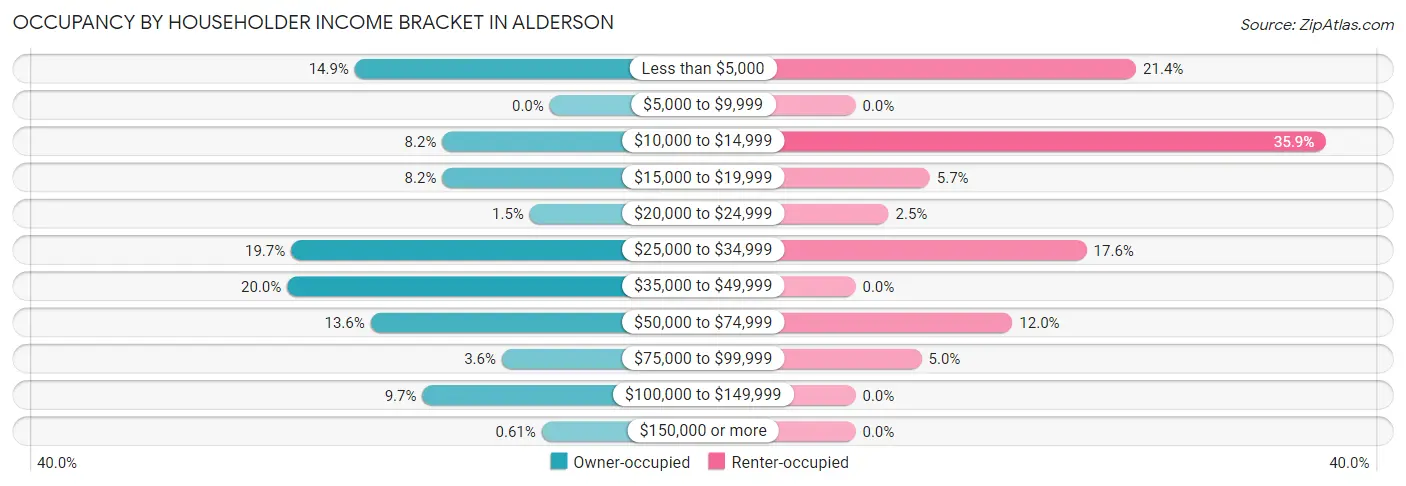
| Income Bracket | Owner-occupied | Renter-occupied |
| Less than $5,000 | 49 (14.8%) | 34 (21.4%) |
| $5,000 to $9,999 | 0 (0.0%) | 0 (0.0%) |
| $10,000 to $14,999 | 27 (8.2%) | 57 (35.8%) |
| $15,000 to $19,999 | 27 (8.2%) | 9 (5.7%) |
| $20,000 to $24,999 | 5 (1.5%) | 4 (2.5%) |
| $25,000 to $34,999 | 65 (19.7%) | 28 (17.6%) |
| $35,000 to $49,999 | 66 (20.0%) | 0 (0.0%) |
| $50,000 to $74,999 | 45 (13.6%) | 19 (11.9%) |
| $75,000 to $99,999 | 12 (3.6%) | 8 (5.0%) |
| $100,000 to $149,999 | 32 (9.7%) | 0 (0.0%) |
| $150,000 or more | 2 (0.6%) | 0 (0.0%) |
| Total | 330 (100.0%) | 159 (100.0%) |
Monthly Housing Cost Tiers in Alderson
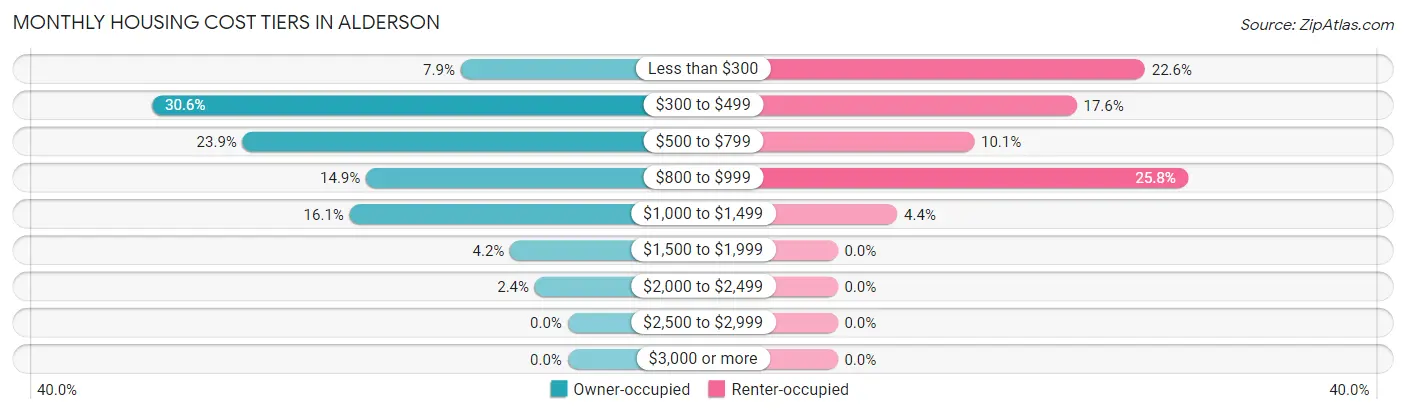
| Monthly Cost | Owner-occupied | Renter-occupied |
| Less than $300 | 26 (7.9%) | 36 (22.6%) |
| $300 to $499 | 101 (30.6%) | 28 (17.6%) |
| $500 to $799 | 79 (23.9%) | 16 (10.1%) |
| $800 to $999 | 49 (14.8%) | 41 (25.8%) |
| $1,000 to $1,499 | 53 (16.1%) | 7 (4.4%) |
| $1,500 to $1,999 | 14 (4.2%) | 0 (0.0%) |
| $2,000 to $2,499 | 8 (2.4%) | 0 (0.0%) |
| $2,500 to $2,999 | 0 (0.0%) | 0 (0.0%) |
| $3,000 or more | 0 (0.0%) | 0 (0.0%) |
| Total | 330 (100.0%) | 159 (100.0%) |
Physical Housing Characteristics in Alderson
Housing Structures in Alderson
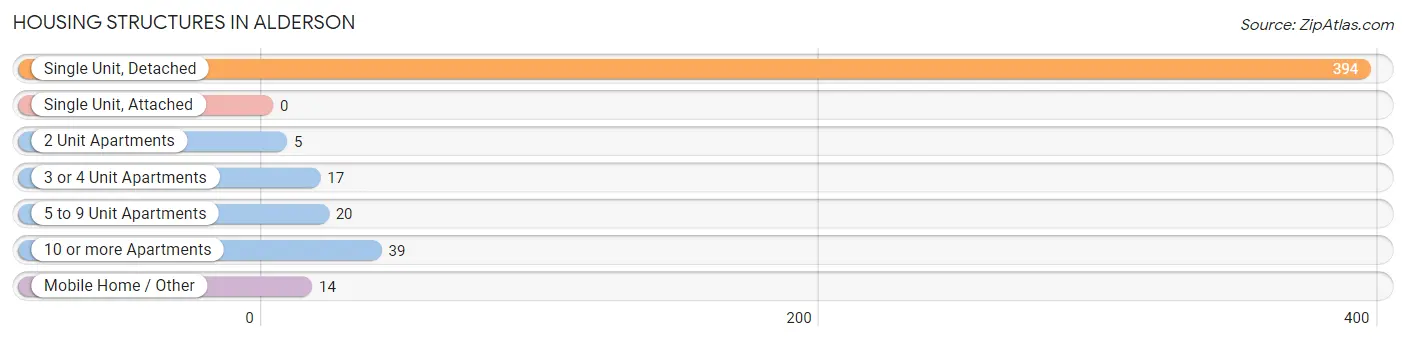
| Structure Type | # Housing Units | % Housing Units |
| Single Unit, Detached | 394 | 80.6% |
| Single Unit, Attached | 0 | 0.0% |
| 2 Unit Apartments | 5 | 1.0% |
| 3 or 4 Unit Apartments | 17 | 3.5% |
| 5 to 9 Unit Apartments | 20 | 4.1% |
| 10 or more Apartments | 39 | 8.0% |
| Mobile Home / Other | 14 | 2.9% |
| Total | 489 | 100.0% |
Housing Structures by Occupancy in Alderson
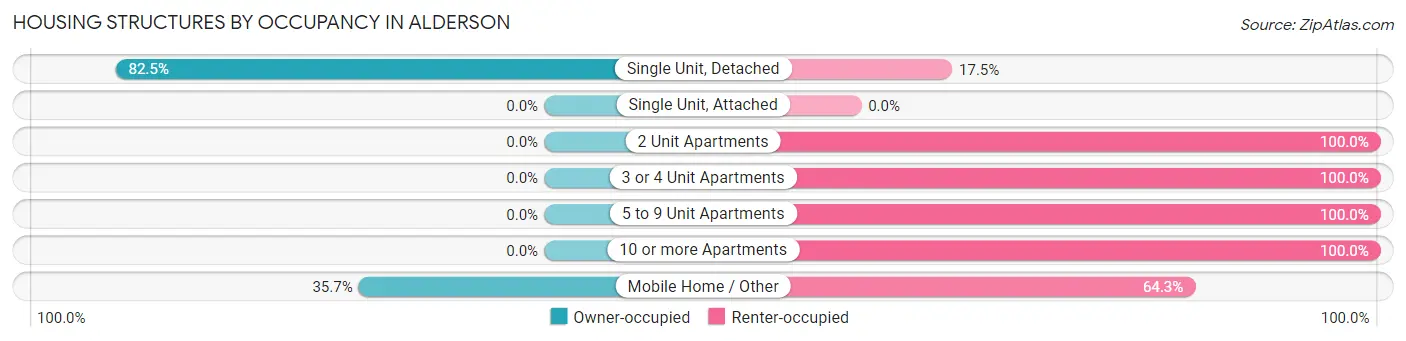
| Structure Type | Owner-occupied | Renter-occupied |
| Single Unit, Detached | 325 (82.5%) | 69 (17.5%) |
| Single Unit, Attached | 0 (0.0%) | 0 (0.0%) |
| 2 Unit Apartments | 0 (0.0%) | 5 (100.0%) |
| 3 or 4 Unit Apartments | 0 (0.0%) | 17 (100.0%) |
| 5 to 9 Unit Apartments | 0 (0.0%) | 20 (100.0%) |
| 10 or more Apartments | 0 (0.0%) | 39 (100.0%) |
| Mobile Home / Other | 5 (35.7%) | 9 (64.3%) |
| Total | 330 (67.5%) | 159 (32.5%) |
Housing Structures by Number of Rooms in Alderson
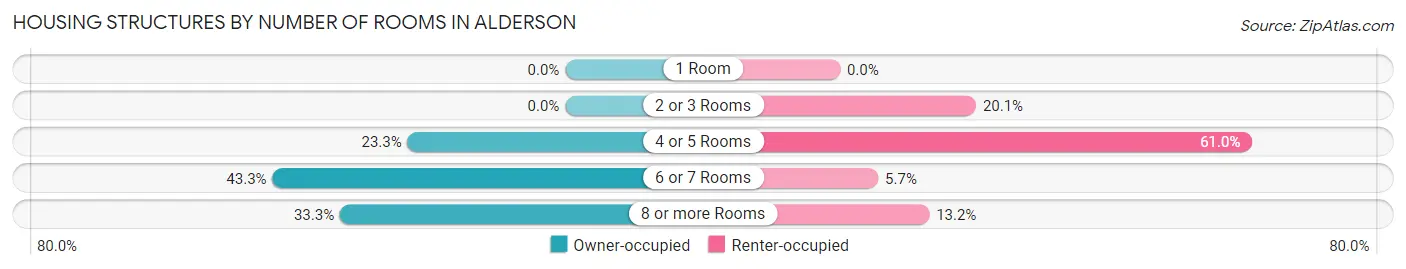
| Number of Rooms | Owner-occupied | Renter-occupied |
| 1 Room | 0 (0.0%) | 0 (0.0%) |
| 2 or 3 Rooms | 0 (0.0%) | 32 (20.1%) |
| 4 or 5 Rooms | 77 (23.3%) | 97 (61.0%) |
| 6 or 7 Rooms | 143 (43.3%) | 9 (5.7%) |
| 8 or more Rooms | 110 (33.3%) | 21 (13.2%) |
| Total | 330 (100.0%) | 159 (100.0%) |
Housing Structure by Heating Type in Alderson
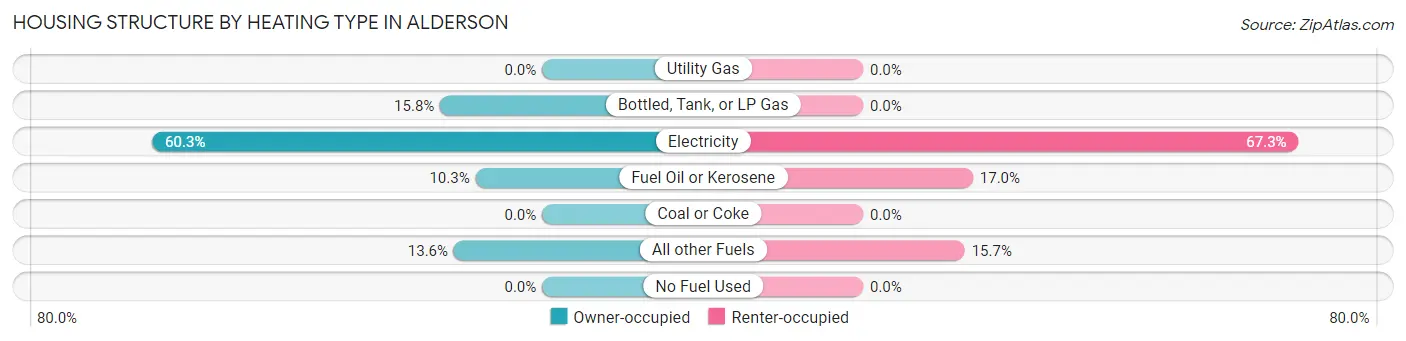
| Heating Type | Owner-occupied | Renter-occupied |
| Utility Gas | 0 (0.0%) | 0 (0.0%) |
| Bottled, Tank, or LP Gas | 52 (15.8%) | 0 (0.0%) |
| Electricity | 199 (60.3%) | 107 (67.3%) |
| Fuel Oil or Kerosene | 34 (10.3%) | 27 (17.0%) |
| Coal or Coke | 0 (0.0%) | 0 (0.0%) |
| All other Fuels | 45 (13.6%) | 25 (15.7%) |
| No Fuel Used | 0 (0.0%) | 0 (0.0%) |
| Total | 330 (100.0%) | 159 (100.0%) |
Household Vehicle Usage in Alderson
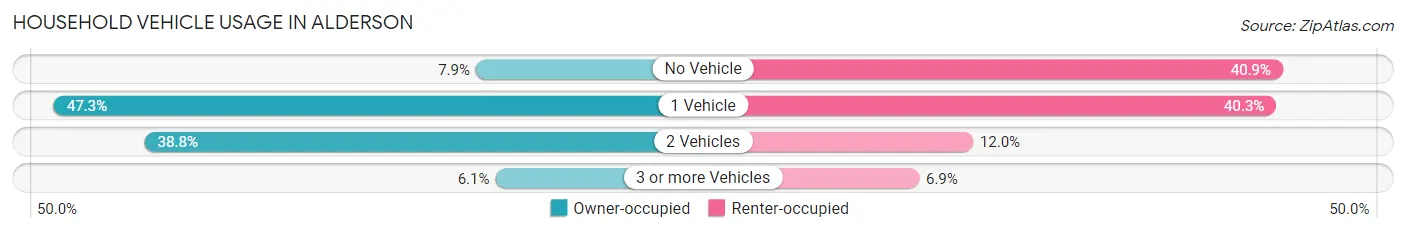
| Vehicles per Household | Owner-occupied | Renter-occupied |
| No Vehicle | 26 (7.9%) | 65 (40.9%) |
| 1 Vehicle | 156 (47.3%) | 64 (40.3%) |
| 2 Vehicles | 128 (38.8%) | 19 (11.9%) |
| 3 or more Vehicles | 20 (6.1%) | 11 (6.9%) |
| Total | 330 (100.0%) | 159 (100.0%) |
Real Estate & Mortgages in Alderson
Real Estate and Mortgage Overview in Alderson
| Characteristic | Without Mortgage | With Mortgage |
| Housing Units | 171 | 159 |
| Median Property Value | $125,300 | $89,400 |
| Median Household Income | $31,641 | $0 |
| Monthly Housing Costs | $366 | $0 |
| Real Estate Taxes | $680 | $12 |
Property Value by Mortgage Status in Alderson
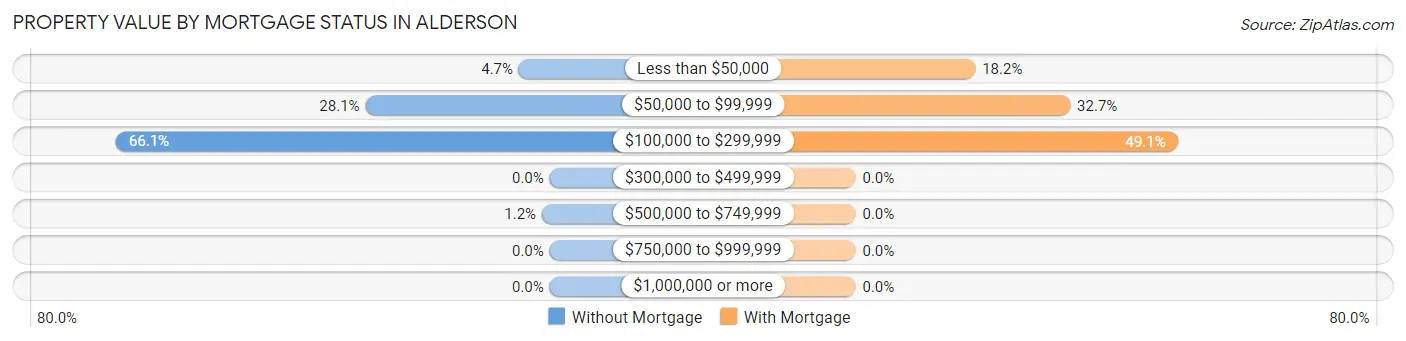
| Property Value | Without Mortgage | With Mortgage |
| Less than $50,000 | 8 (4.7%) | 29 (18.2%) |
| $50,000 to $99,999 | 48 (28.1%) | 52 (32.7%) |
| $100,000 to $299,999 | 113 (66.1%) | 78 (49.1%) |
| $300,000 to $499,999 | 0 (0.0%) | 0 (0.0%) |
| $500,000 to $749,999 | 2 (1.2%) | 0 (0.0%) |
| $750,000 to $999,999 | 0 (0.0%) | 0 (0.0%) |
| $1,000,000 or more | 0 (0.0%) | 0 (0.0%) |
| Total | 171 (100.0%) | 159 (100.0%) |
Household Income by Mortgage Status in Alderson
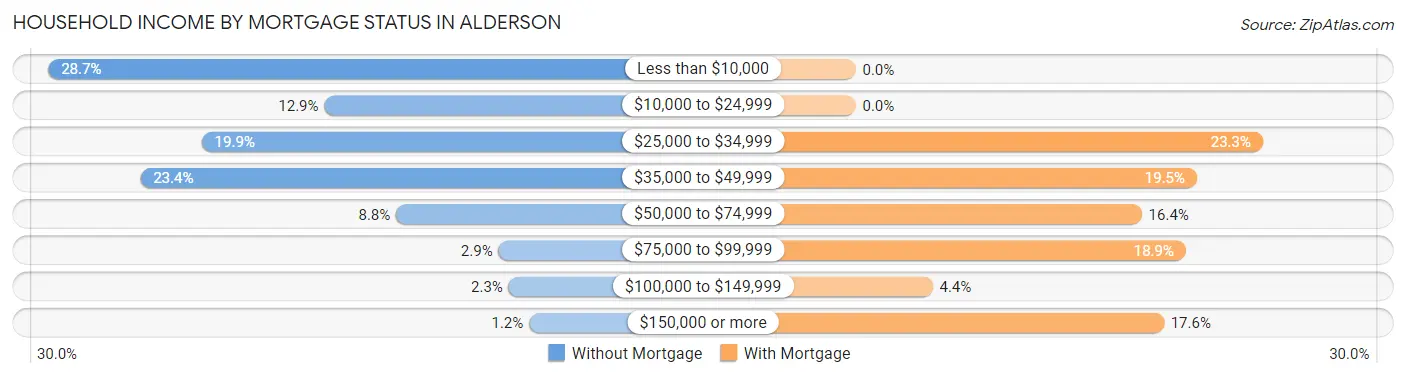
| Household Income | Without Mortgage | With Mortgage |
| Less than $10,000 | 49 (28.6%) | 0 (0.0%) |
| $10,000 to $24,999 | 22 (12.9%) | 0 (0.0%) |
| $25,000 to $34,999 | 34 (19.9%) | 37 (23.3%) |
| $35,000 to $49,999 | 40 (23.4%) | 31 (19.5%) |
| $50,000 to $74,999 | 15 (8.8%) | 26 (16.4%) |
| $75,000 to $99,999 | 5 (2.9%) | 30 (18.9%) |
| $100,000 to $149,999 | 4 (2.3%) | 7 (4.4%) |
| $150,000 or more | 2 (1.2%) | 28 (17.6%) |
| Total | 171 (100.0%) | 159 (100.0%) |
Property Value to Household Income Ratio in Alderson
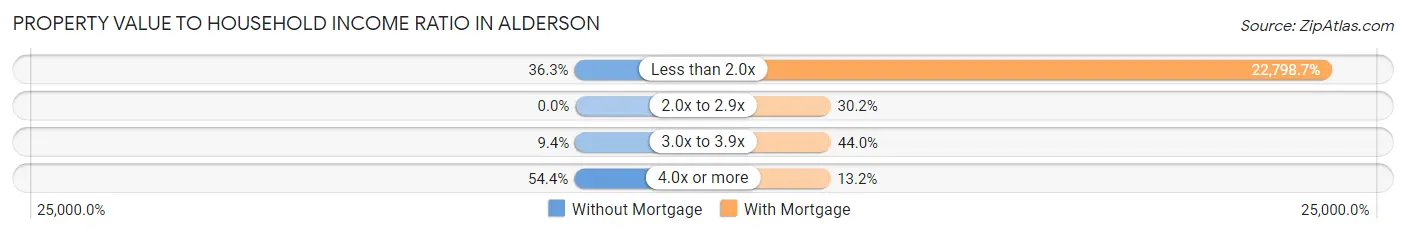
| Value-to-Income Ratio | Without Mortgage | With Mortgage |
| Less than 2.0x | 62 (36.3%) | 36,250 (22,798.7%) |
| 2.0x to 2.9x | 0 (0.0%) | 48 (30.2%) |
| 3.0x to 3.9x | 16 (9.4%) | 70 (44.0%) |
| 4.0x or more | 93 (54.4%) | 21 (13.2%) |
| Total | 171 (100.0%) | 159 (100.0%) |
Real Estate Taxes by Mortgage Status in Alderson
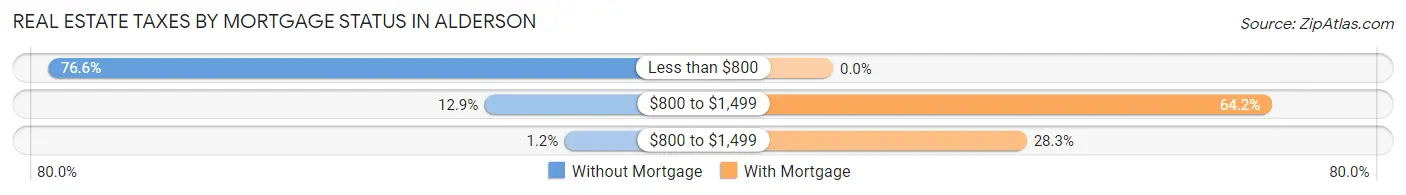
| Property Taxes | Without Mortgage | With Mortgage |
| Less than $800 | 131 (76.6%) | 0 (0.0%) |
| $800 to $1,499 | 22 (12.9%) | 102 (64.1%) |
| $800 to $1,499 | 2 (1.2%) | 45 (28.3%) |
| Total | 171 (100.0%) | 159 (100.0%) |
Health & Disability in Alderson
Health Insurance Coverage by Age in Alderson
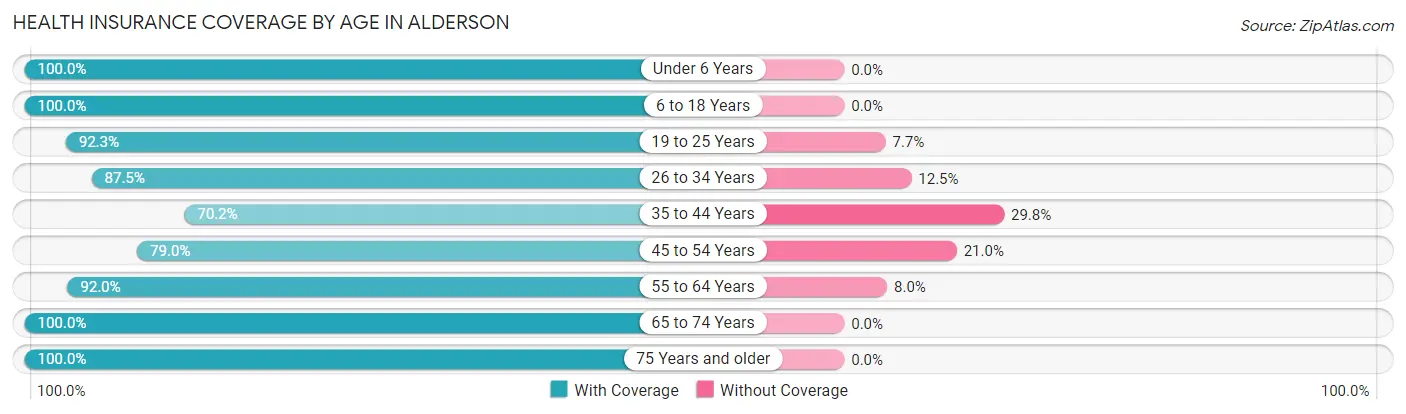
| Age Bracket | With Coverage | Without Coverage |
| Under 6 Years | 55 (100.0%) | 0 (0.0%) |
| 6 to 18 Years | 63 (100.0%) | 0 (0.0%) |
| 19 to 25 Years | 60 (92.3%) | 5 (7.7%) |
| 26 to 34 Years | 84 (87.5%) | 12 (12.5%) |
| 35 to 44 Years | 33 (70.2%) | 14 (29.8%) |
| 45 to 54 Years | 98 (79.0%) | 26 (21.0%) |
| 55 to 64 Years | 219 (92.0%) | 19 (8.0%) |
| 65 to 74 Years | 170 (100.0%) | 0 (0.0%) |
| 75 Years and older | 111 (100.0%) | 0 (0.0%) |
| Total | 893 (92.2%) | 76 (7.8%) |
Health Insurance Coverage by Citizenship Status in Alderson
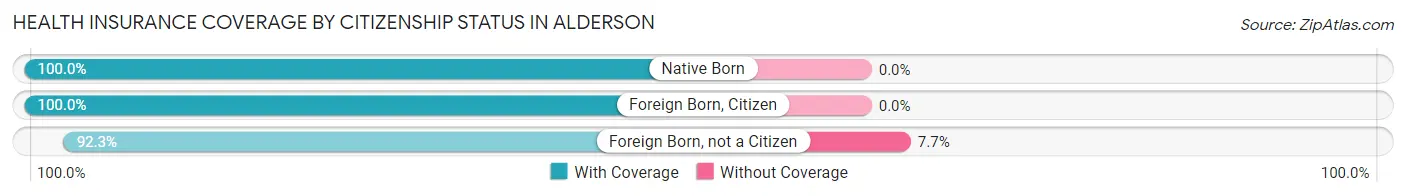
| Citizenship Status | With Coverage | Without Coverage |
| Native Born | 55 (100.0%) | 0 (0.0%) |
| Foreign Born, Citizen | 63 (100.0%) | 0 (0.0%) |
| Foreign Born, not a Citizen | 60 (92.3%) | 5 (7.7%) |
Health Insurance Coverage by Household Income in Alderson
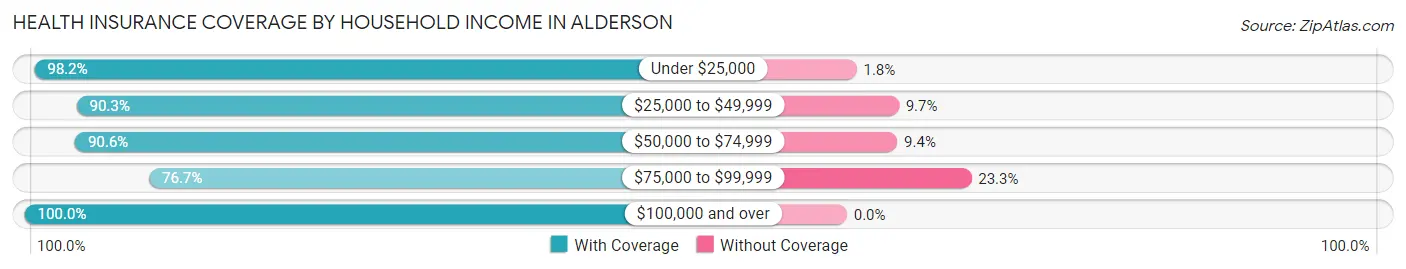
| Household Income | With Coverage | Without Coverage |
| Under $25,000 | 270 (98.2%) | 5 (1.8%) |
| $25,000 to $49,999 | 306 (90.3%) | 33 (9.7%) |
| $50,000 to $74,999 | 163 (90.6%) | 17 (9.4%) |
| $75,000 to $99,999 | 69 (76.7%) | 21 (23.3%) |
| $100,000 and over | 85 (100.0%) | 0 (0.0%) |
Public vs Private Health Insurance Coverage by Age in Alderson
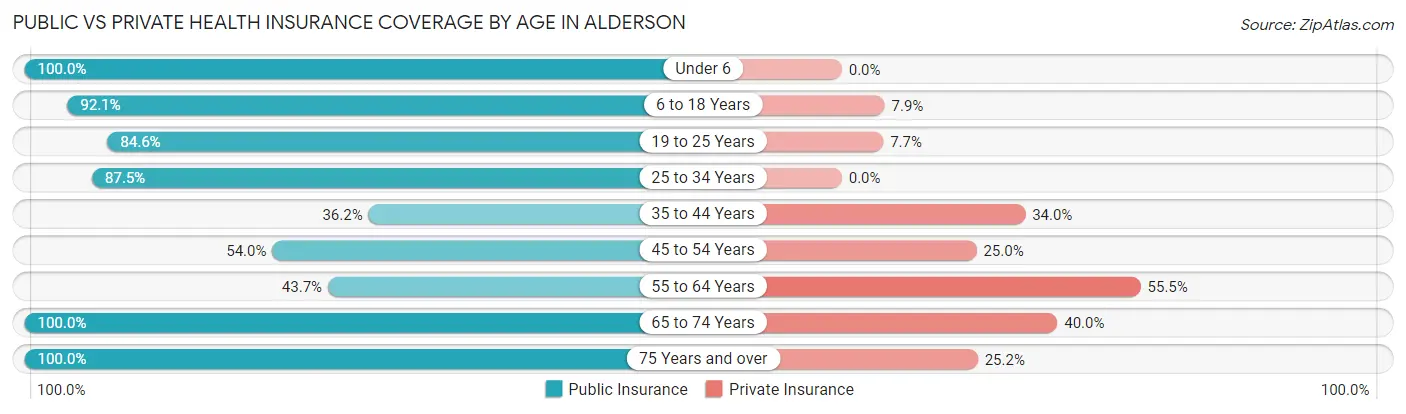
| Age Bracket | Public Insurance | Private Insurance |
| Under 6 | 55 (100.0%) | 0 (0.0%) |
| 6 to 18 Years | 58 (92.1%) | 5 (7.9%) |
| 19 to 25 Years | 55 (84.6%) | 5 (7.7%) |
| 25 to 34 Years | 84 (87.5%) | 0 (0.0%) |
| 35 to 44 Years | 17 (36.2%) | 16 (34.0%) |
| 45 to 54 Years | 67 (54.0%) | 31 (25.0%) |
| 55 to 64 Years | 104 (43.7%) | 132 (55.5%) |
| 65 to 74 Years | 170 (100.0%) | 68 (40.0%) |
| 75 Years and over | 111 (100.0%) | 28 (25.2%) |
| Total | 721 (74.4%) | 285 (29.4%) |
Disability Status by Sex by Age in Alderson
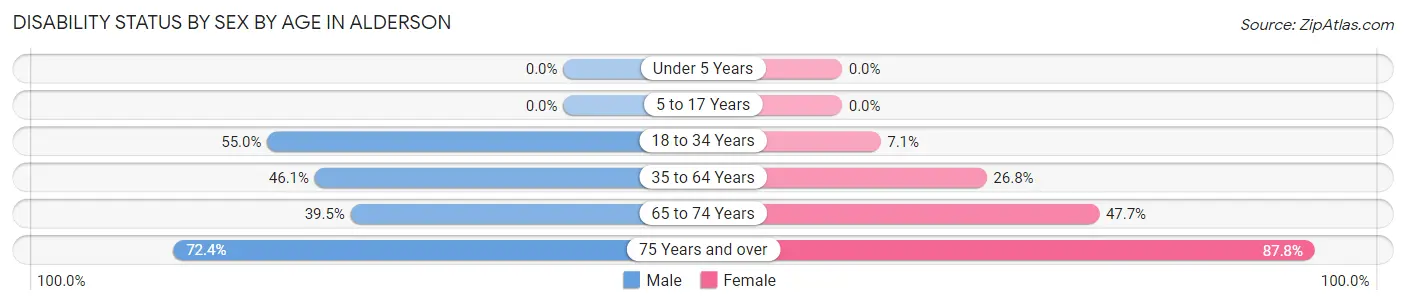
| Age Bracket | Male | Female |
| Under 5 Years | 0 (0.0%) | 0 (0.0%) |
| 5 to 17 Years | 0 (0.0%) | 0 (0.0%) |
| 18 to 34 Years | 50 (54.9%) | 5 (7.1%) |
| 35 to 64 Years | 101 (46.1%) | 51 (26.8%) |
| 65 to 74 Years | 15 (39.5%) | 63 (47.7%) |
| 75 Years and over | 21 (72.4%) | 72 (87.8%) |
Disability Class by Sex by Age in Alderson
Disability Class: Hearing Difficulty
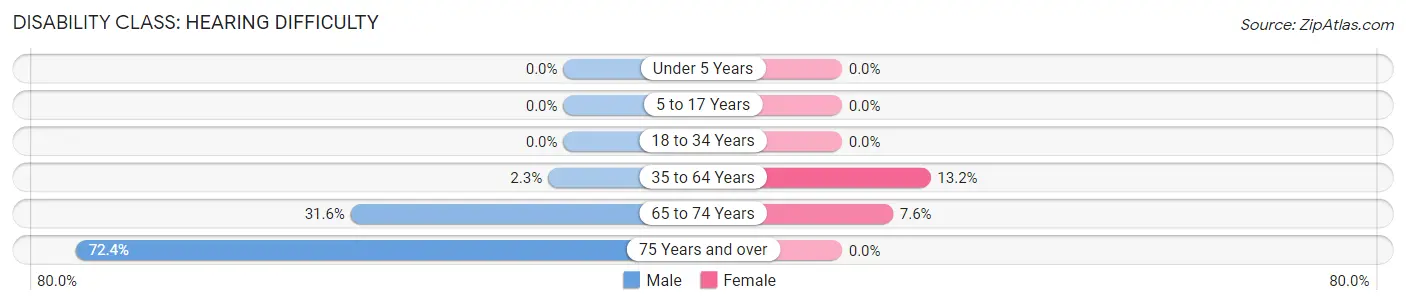
| Age Bracket | Male | Female |
| Under 5 Years | 0 (0.0%) | 0 (0.0%) |
| 5 to 17 Years | 0 (0.0%) | 0 (0.0%) |
| 18 to 34 Years | 0 (0.0%) | 0 (0.0%) |
| 35 to 64 Years | 5 (2.3%) | 25 (13.2%) |
| 65 to 74 Years | 12 (31.6%) | 10 (7.6%) |
| 75 Years and over | 21 (72.4%) | 0 (0.0%) |
Disability Class: Vision Difficulty
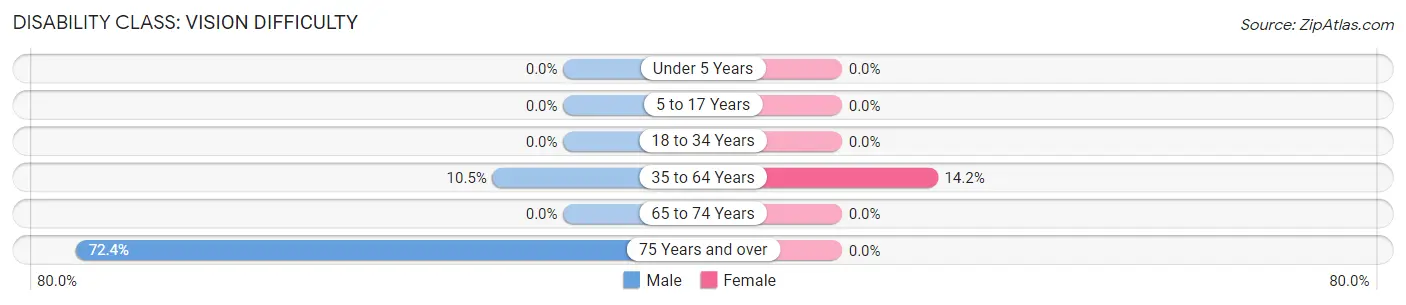
| Age Bracket | Male | Female |
| Under 5 Years | 0 (0.0%) | 0 (0.0%) |
| 5 to 17 Years | 0 (0.0%) | 0 (0.0%) |
| 18 to 34 Years | 0 (0.0%) | 0 (0.0%) |
| 35 to 64 Years | 23 (10.5%) | 27 (14.2%) |
| 65 to 74 Years | 0 (0.0%) | 0 (0.0%) |
| 75 Years and over | 21 (72.4%) | 0 (0.0%) |
Disability Class: Cognitive Difficulty
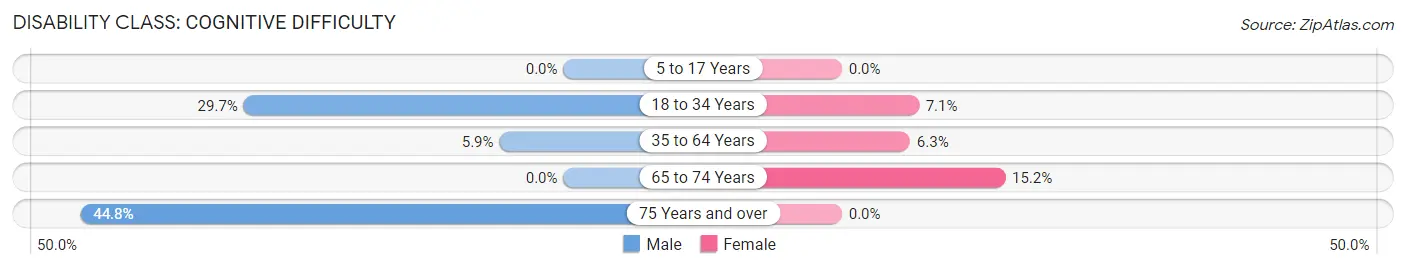
| Age Bracket | Male | Female |
| 5 to 17 Years | 0 (0.0%) | 0 (0.0%) |
| 18 to 34 Years | 27 (29.7%) | 5 (7.1%) |
| 35 to 64 Years | 13 (5.9%) | 12 (6.3%) |
| 65 to 74 Years | 0 (0.0%) | 20 (15.1%) |
| 75 Years and over | 13 (44.8%) | 0 (0.0%) |
Disability Class: Ambulatory Difficulty
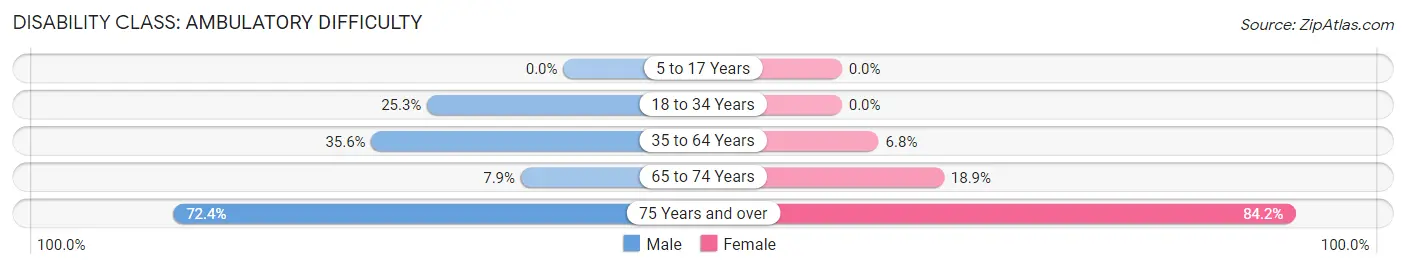
| Age Bracket | Male | Female |
| 5 to 17 Years | 0 (0.0%) | 0 (0.0%) |
| 18 to 34 Years | 23 (25.3%) | 0 (0.0%) |
| 35 to 64 Years | 78 (35.6%) | 13 (6.8%) |
| 65 to 74 Years | 3 (7.9%) | 25 (18.9%) |
| 75 Years and over | 21 (72.4%) | 69 (84.2%) |
Disability Class: Self-Care Difficulty
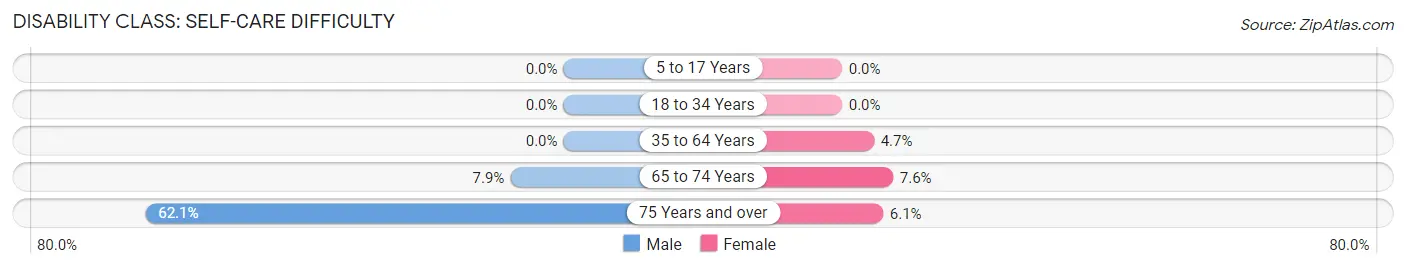
| Age Bracket | Male | Female |
| 5 to 17 Years | 0 (0.0%) | 0 (0.0%) |
| 18 to 34 Years | 0 (0.0%) | 0 (0.0%) |
| 35 to 64 Years | 0 (0.0%) | 9 (4.7%) |
| 65 to 74 Years | 3 (7.9%) | 10 (7.6%) |
| 75 Years and over | 18 (62.1%) | 5 (6.1%) |
Technology Access in Alderson
Computing Device Access in Alderson
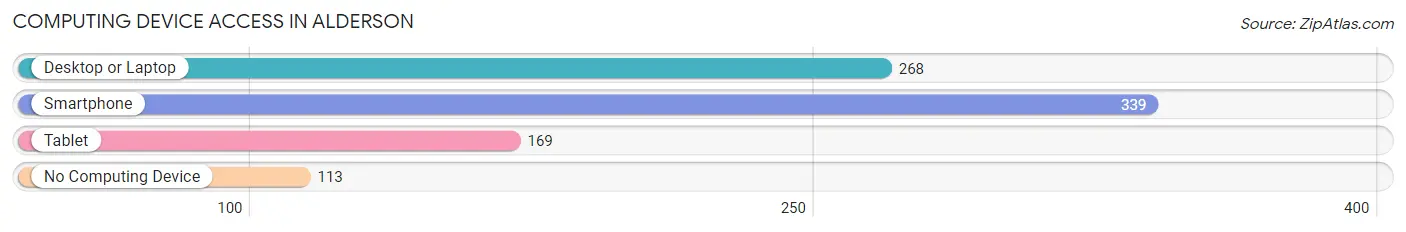
| Device Type | # Households | % Households |
| Desktop or Laptop | 268 | 54.8% |
| Smartphone | 339 | 69.3% |
| Tablet | 169 | 34.6% |
| No Computing Device | 113 | 23.1% |
| Total | 489 | 100.0% |
Internet Access in Alderson
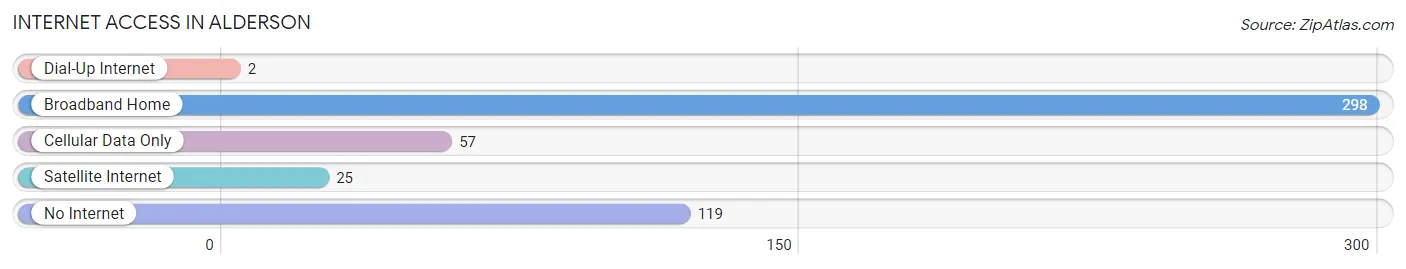
| Internet Type | # Households | % Households |
| Dial-Up Internet | 2 | 0.4% |
| Broadband Home | 298 | 60.9% |
| Cellular Data Only | 57 | 11.7% |
| Satellite Internet | 25 | 5.1% |
| No Internet | 119 | 24.3% |
| Total | 489 | 100.0% |
Alderson Summary
Alderson, West Virginia is a small town located in the southeastern part of the state, in Monroe County. It is situated on the Greenbrier River, and is the county seat of Monroe County. The town was founded in 1883 by the Chesapeake and Ohio Railway, and was named after railroad executive John B. Alderson.
History
Alderson was founded in 1883 by the Chesapeake and Ohio Railway. The town was named after railroad executive John B. Alderson. The town was originally a stop on the railroad, and was used as a shipping point for coal and timber. The town grew quickly, and by the early 1900s, it had become a thriving community.
In the early 1900s, Alderson was a popular destination for tourists. The town was known for its natural beauty, and was home to several resorts and hotels. The town was also home to a number of businesses, including a flour mill, a sawmill, a furniture factory, and a canning factory.
In the 1920s, Alderson became a popular destination for the Ku Klux Klan. The Klan held rallies in the town, and the town became a center of Klan activity in the region. The Klan's presence in the town declined in the 1930s, and the town returned to its more peaceful roots.
In the 1950s, Alderson became a popular destination for hippies and counterculture activists. The town was home to a number of communes, and was a center of the hippie movement in the region. The hippie movement in the town declined in the 1970s, and the town returned to its more traditional roots.
Geography
Alderson is located in the southeastern part of West Virginia, in Monroe County. The town is situated on the Greenbrier River, and is the county seat of Monroe County. The town is located in the Appalachian Mountains, and is surrounded by rolling hills and forests. The town is located near the border of Virginia and Kentucky, and is about an hour's drive from the state capital of Charleston.
Economy
Alderson's economy is largely based on tourism and agriculture. The town is home to several resorts and hotels, and is a popular destination for tourists. The town is also home to a number of small businesses, including restaurants, shops, and galleries. The town is also home to a number of farms, and is a major producer of apples, peaches, and other fruits and vegetables.
Demographics
As of the 2010 census, Alderson had a population of 1,845. The town is predominantly white, with about 95% of the population being white. The town is also home to a small African American population, as well as a small Hispanic population. The median household income in the town is $30,000, and the median home value is $90,000.
Common Questions
What is Per Capita Income in Alderson?
Per Capita income in Alderson is $20,394.
What is the Median Family Income in Alderson?
Median Family Income in Alderson is $51,731.
What is the Median Household income in Alderson?
Median Household Income in Alderson is $30,689.
What is Income or Wage Gap in Alderson?
Income or Wage Gap in Alderson is 8.7%.
Women in Alderson earn 91.3 cents for every dollar earned by a man.
What is Inequality or Gini Index in Alderson?
Inequality or Gini Index in Alderson is 0.47.
What is the Total Population of Alderson?
Total Population of Alderson is 969.
What is the Total Male Population of Alderson?
Total Male Population of Alderson is 452.
What is the Total Female Population of Alderson?
Total Female Population of Alderson is 517.
What is the Ratio of Males per 100 Females in Alderson?
There are 87.43 Males per 100 Females in Alderson.
What is the Ratio of Females per 100 Males in Alderson?
There are 114.38 Females per 100 Males in Alderson.
What is the Median Population Age in Alderson?
Median Population Age in Alderson is 56.1 Years.
What is the Average Family Size in Alderson
Average Family Size in Alderson is 3.2 People.
What is the Average Household Size in Alderson
Average Household Size in Alderson is 2.0 People.
How Large is the Labor Force in Alderson?
There are 296 People in the Labor Forcein in Alderson.
What is the Percentage of People in the Labor Force in Alderson?
33.7% of People are in the Labor Force in Alderson.
What is the Unemployment Rate in Alderson?
Unemployment Rate in Alderson is 1.7%.