Pullman, WV Map & Demographics
Pullman Map
Pullman Overview
$16,005
PER CAPITA INCOME
$49,803
AVG FAMILY INCOME
$57,880
AVG HOUSEHOLD INCOME
24.7%
WAGE / INCOME GAP [ % ]
75.3¢/ $1
WAGE / INCOME GAP [ $ ]
0.16
INEQUALITY / GINI INDEX
303
TOTAL POPULATION
212
MALE POPULATION
91
FEMALE POPULATION
232.97
MALES / 100 FEMALES
42.92
FEMALES / 100 MALES
35.9
MEDIAN AGE
5.1
AVG FAMILY SIZE
4.4
AVG HOUSEHOLD SIZE
93
LABOR FORCE [ PEOPLE ]
34.1%
PERCENT IN LABOR FORCE
Pullman Zip Codes
Pullman Area Codes
Income in Pullman
Income Overview in Pullman
Per Capita Income in Pullman is $16,005, while median incomes of families and households are $49,803 and $57,880 respectively.
| Characteristic | Number | Measure |
| Per Capita Income | 303 | $16,005 |
| Median Family Income | 53 | $49,803 |
| Mean Family Income | 53 | $52,979 |
| Median Household Income | 69 | $57,880 |
| Mean Household Income | 69 | $55,281 |
| Income Deficit | 53 | $0 |
| Wage / Income Gap (%) | 303 | 24.69% |
| Wage / Income Gap ($) | 303 | 75.31¢ per $1 |
| Gini / Inequality Index | 303 | 0.16 |
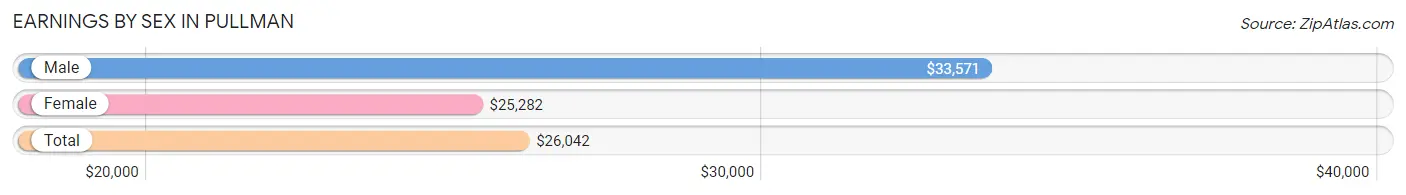
Earnings by Sex in Pullman
Average Earnings in Pullman are $26,042, $33,571 for men and $25,282 for women, a difference of 24.7%.
| Sex | Number | Average Earnings |
| Male | 36 (38.7%) | $33,571 |
| Female | 57 (61.3%) | $25,282 |
| Total | 93 (100.0%) | $26,042 |
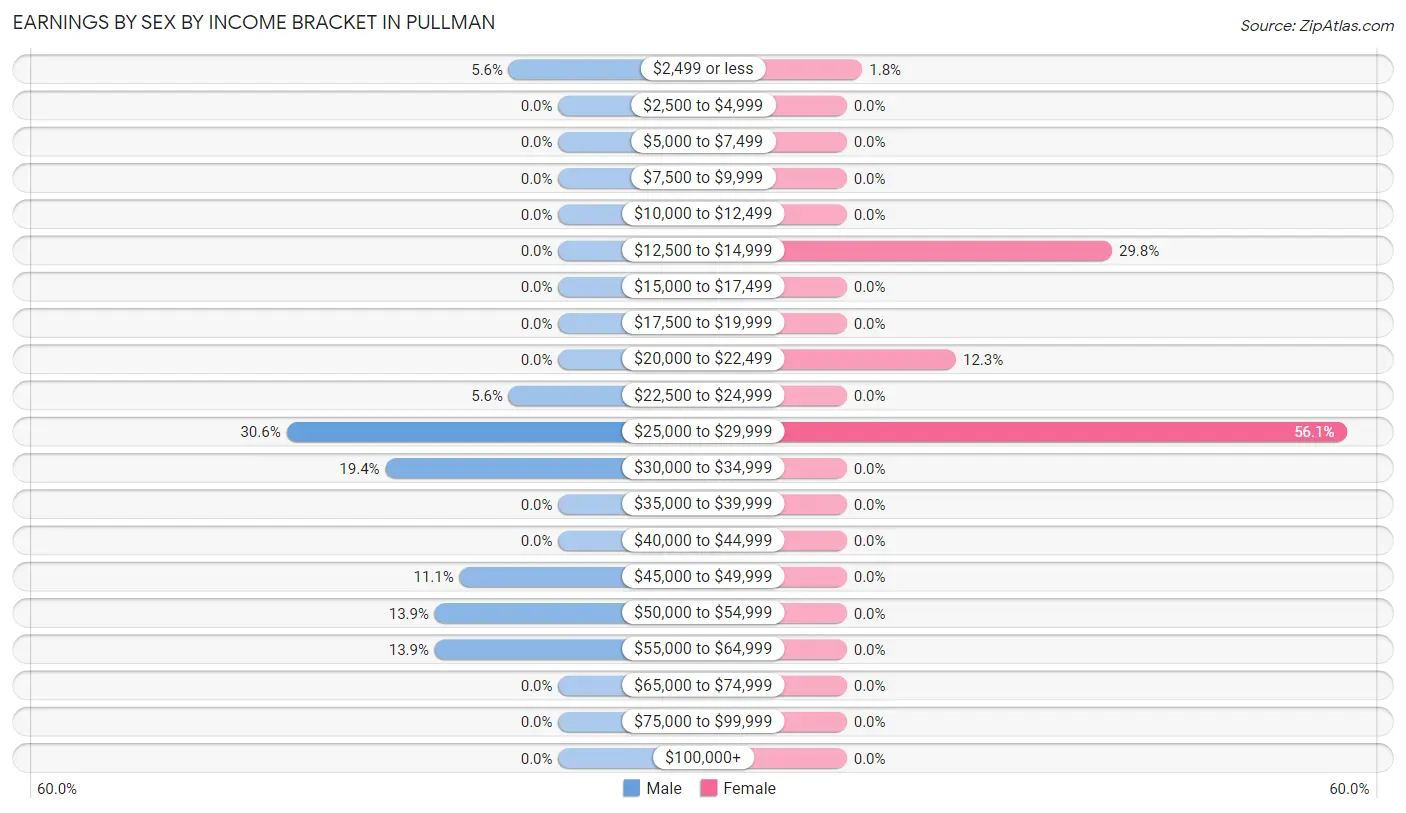
Earnings by Sex by Income Bracket in Pullman
The most common earnings brackets in Pullman are $25,000 to $29,999 for men (11 | 30.6%) and $25,000 to $29,999 for women (32 | 56.1%).
| Income | Male | Female |
| $2,499 or less | 2 (5.6%) | 1 (1.8%) |
| $2,500 to $4,999 | 0 (0.0%) | 0 (0.0%) |
| $5,000 to $7,499 | 0 (0.0%) | 0 (0.0%) |
| $7,500 to $9,999 | 0 (0.0%) | 0 (0.0%) |
| $10,000 to $12,499 | 0 (0.0%) | 0 (0.0%) |
| $12,500 to $14,999 | 0 (0.0%) | 17 (29.8%) |
| $15,000 to $17,499 | 0 (0.0%) | 0 (0.0%) |
| $17,500 to $19,999 | 0 (0.0%) | 0 (0.0%) |
| $20,000 to $22,499 | 0 (0.0%) | 7 (12.3%) |
| $22,500 to $24,999 | 2 (5.6%) | 0 (0.0%) |
| $25,000 to $29,999 | 11 (30.6%) | 32 (56.1%) |
| $30,000 to $34,999 | 7 (19.4%) | 0 (0.0%) |
| $35,000 to $39,999 | 0 (0.0%) | 0 (0.0%) |
| $40,000 to $44,999 | 0 (0.0%) | 0 (0.0%) |
| $45,000 to $49,999 | 4 (11.1%) | 0 (0.0%) |
| $50,000 to $54,999 | 5 (13.9%) | 0 (0.0%) |
| $55,000 to $64,999 | 5 (13.9%) | 0 (0.0%) |
| $65,000 to $74,999 | 0 (0.0%) | 0 (0.0%) |
| $75,000 to $99,999 | 0 (0.0%) | 0 (0.0%) |
| $100,000+ | 0 (0.0%) | 0 (0.0%) |
| Total | 36 (100.0%) | 57 (100.0%) |
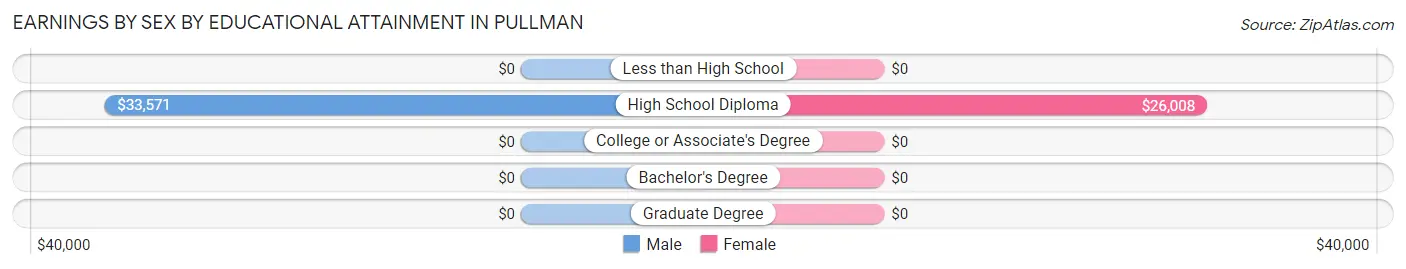
Earnings by Sex by Educational Attainment in Pullman
Average earnings in Pullman are $33,571 for men and $25,323 for women, a difference of 24.6%. Men with an educational attainment of high school diploma enjoy the highest average annual earnings of $33,571, while those with high school diploma education earn the least with $33,571. Women with an educational attainment of high school diploma earn the most with the average annual earnings of $26,008, while those with high school diploma education have the smallest earnings of $26,008.
| Educational Attainment | Male Income | Female Income |
| Less than High School | - | - |
| High School Diploma | $33,571 | $26,008 |
| College or Associate's Degree | - | - |
| Bachelor's Degree | - | - |
| Graduate Degree | - | - |
| Total | $33,571 | $25,323 |
Family Income in Pullman
Family Income Brackets in Pullman
According to the Pullman family income data, there are 23 families falling into the $35,000 to $49,999 income range, which is the most common income bracket and makes up 43.4% of all families.
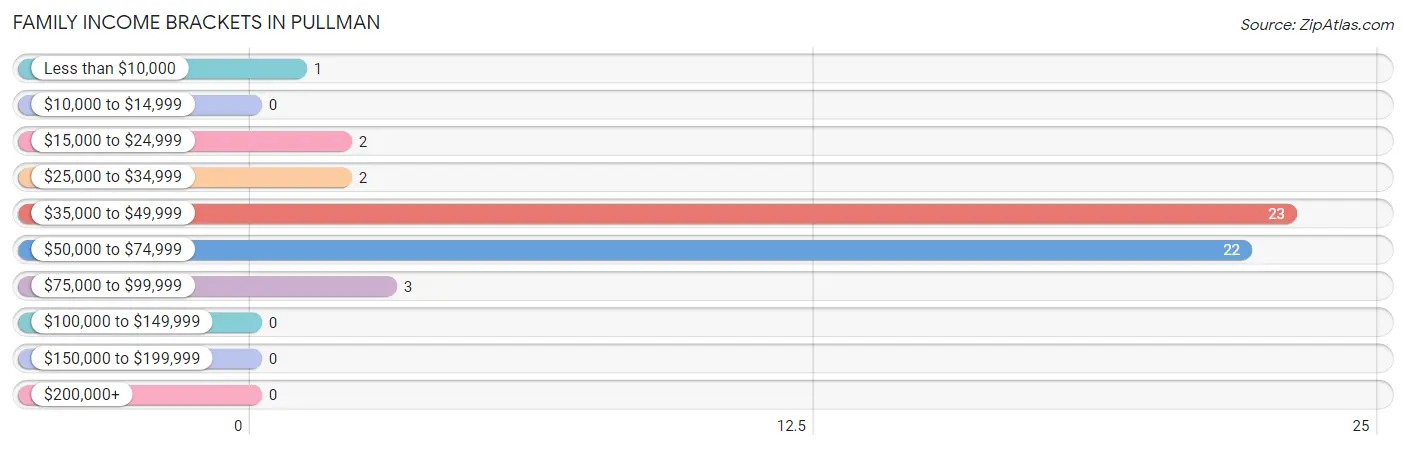
| Income Bracket | # Families | % Families |
| Less than $10,000 | 1 | 1.9% |
| $10,000 to $14,999 | 0 | 0.0% |
| $15,000 to $24,999 | 2 | 3.8% |
| $25,000 to $34,999 | 2 | 3.8% |
| $35,000 to $49,999 | 23 | 43.4% |
| $50,000 to $74,999 | 22 | 41.5% |
| $75,000 to $99,999 | 3 | 5.7% |
| $100,000 to $149,999 | 0 | 0.0% |
| $150,000 to $199,999 | 0 | 0.0% |
| $200,000+ | 0 | 0.0% |
Family Income by Famaliy Size in Pullman
3-person families (26 | 49.1%) account for the highest median family income in Pullman with $58,421 per family, while 3-person families (26 | 49.1%) have the highest median income of $19,474 per family member.
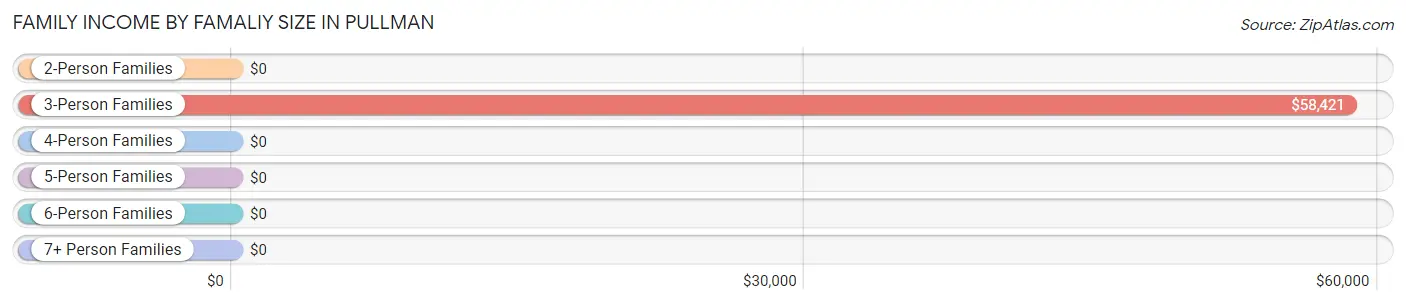
| Income Bracket | # Families | Median Income |
| 2-Person Families | 6 (11.3%) | $0 |
| 3-Person Families | 26 (49.1%) | $58,421 |
| 4-Person Families | 19 (35.8%) | $0 |
| 5-Person Families | 2 (3.8%) | $0 |
| 6-Person Families | 0 (0.0%) | $0 |
| 7+ Person Families | 0 (0.0%) | $0 |
| Total | 53 (100.0%) | $49,803 |
Family Income by Number of Earners in Pullman
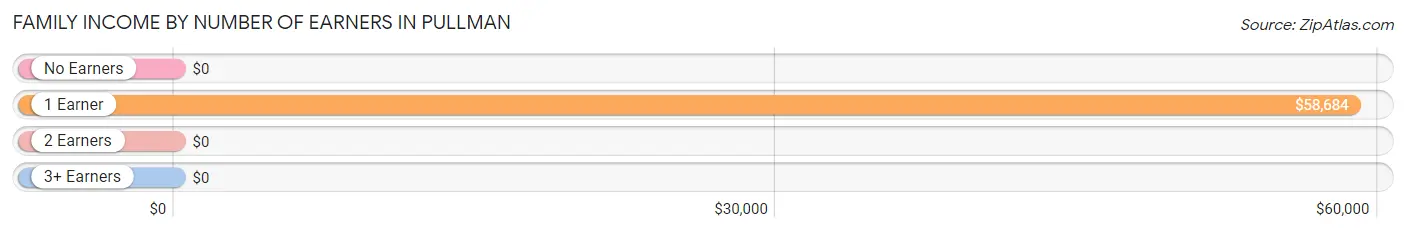
| Number of Earners | # Families | Median Income |
| No Earners | 3 (5.7%) | $0 |
| 1 Earner | 30 (56.6%) | $58,684 |
| 2 Earners | 18 (34.0%) | $0 |
| 3+ Earners | 2 (3.8%) | $0 |
| Total | 53 (100.0%) | $49,803 |
Household Income in Pullman
Household Income Brackets in Pullman
With 29 households falling in the category, the $50,000 to $74,999 income range is the most frequent in Pullman, accounting for 42.0% of all households.
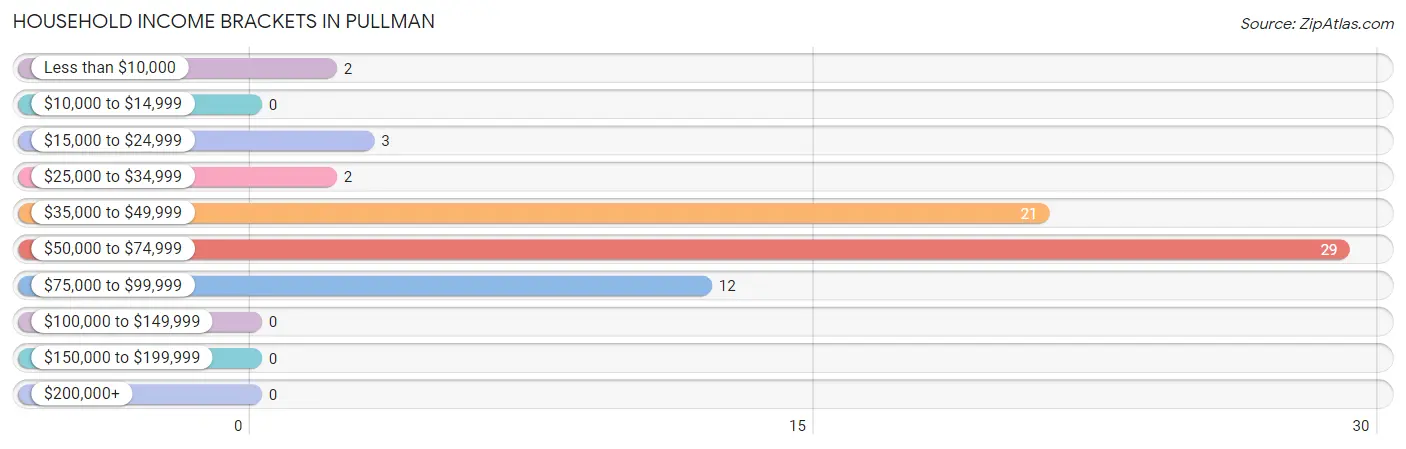
| Income Bracket | # Households | % Households |
| Less than $10,000 | 2 | 2.9% |
| $10,000 to $14,999 | 0 | 0.0% |
| $15,000 to $24,999 | 3 | 4.3% |
| $25,000 to $34,999 | 2 | 2.9% |
| $35,000 to $49,999 | 21 | 30.4% |
| $50,000 to $74,999 | 29 | 42.0% |
| $75,000 to $99,999 | 12 | 17.4% |
| $100,000 to $149,999 | 0 | 0.0% |
| $150,000 to $199,999 | 0 | 0.0% |
| $200,000+ | 0 | 0.0% |
Household Income by Householder Age in Pullman
The median household income in Pullman is $57,880, with the highest median household income of $75,179 found in the 45 to 64 years age bracket for the primary householder. A total of 15 households (21.7%) fall into this category.
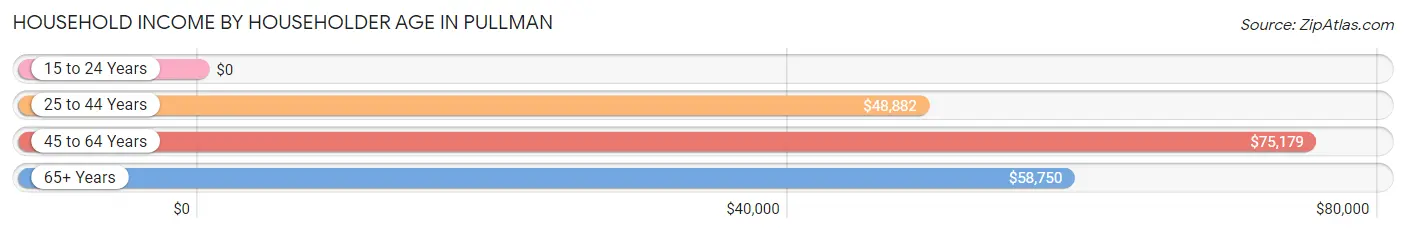
| Income Bracket | # Households | Median Income |
| 15 to 24 Years | 0 (0.0%) | $0 |
| 25 to 44 Years | 25 (36.2%) | $48,882 |
| 45 to 64 Years | 15 (21.7%) | $75,179 |
| 65+ Years | 29 (42.0%) | $58,750 |
| Total | 69 (100.0%) | $57,880 |
Poverty in Pullman
Income Below Poverty by Sex and Age in Pullman
With 3.3% poverty level for males and 16.5% for females among the residents of Pullman, 55 to 64 year old males and under 5 year old females are the most vulnerable to poverty, with 5 males (100.0%) and 3 females (42.9%) in their respective age groups living below the poverty level.
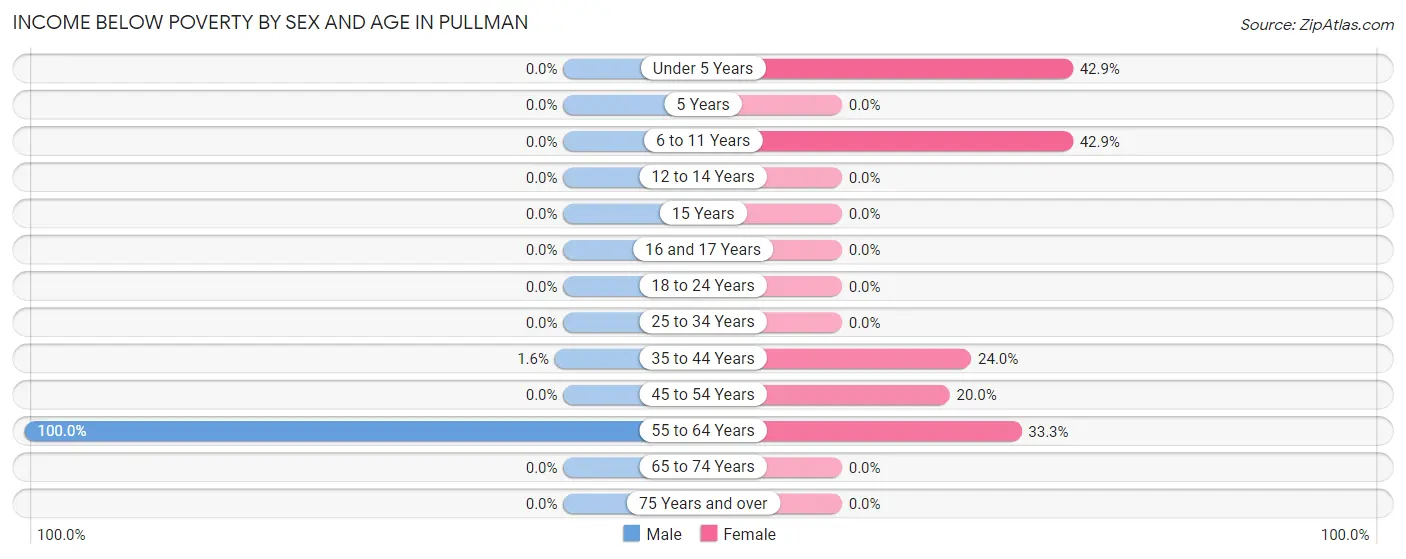
| Age Bracket | Male | Female |
| Under 5 Years | 0 (0.0%) | 3 (42.9%) |
| 5 Years | 0 (0.0%) | 0 (0.0%) |
| 6 to 11 Years | 0 (0.0%) | 3 (42.9%) |
| 12 to 14 Years | 0 (0.0%) | 0 (0.0%) |
| 15 Years | 0 (0.0%) | 0 (0.0%) |
| 16 and 17 Years | 0 (0.0%) | 0 (0.0%) |
| 18 to 24 Years | 0 (0.0%) | 0 (0.0%) |
| 25 to 34 Years | 0 (0.0%) | 0 (0.0%) |
| 35 to 44 Years | 2 (1.6%) | 6 (24.0%) |
| 45 to 54 Years | 0 (0.0%) | 2 (20.0%) |
| 55 to 64 Years | 5 (100.0%) | 1 (33.3%) |
| 65 to 74 Years | 0 (0.0%) | 0 (0.0%) |
| 75 Years and over | 0 (0.0%) | 0 (0.0%) |
| Total | 7 (3.3%) | 15 (16.5%) |
Income Above Poverty by Sex and Age in Pullman
According to the poverty statistics in Pullman, males aged 6 to 11 years and females aged 16 and 17 years are the age groups that are most secure financially, with 100.0% of males and 100.0% of females in these age groups living above the poverty line.
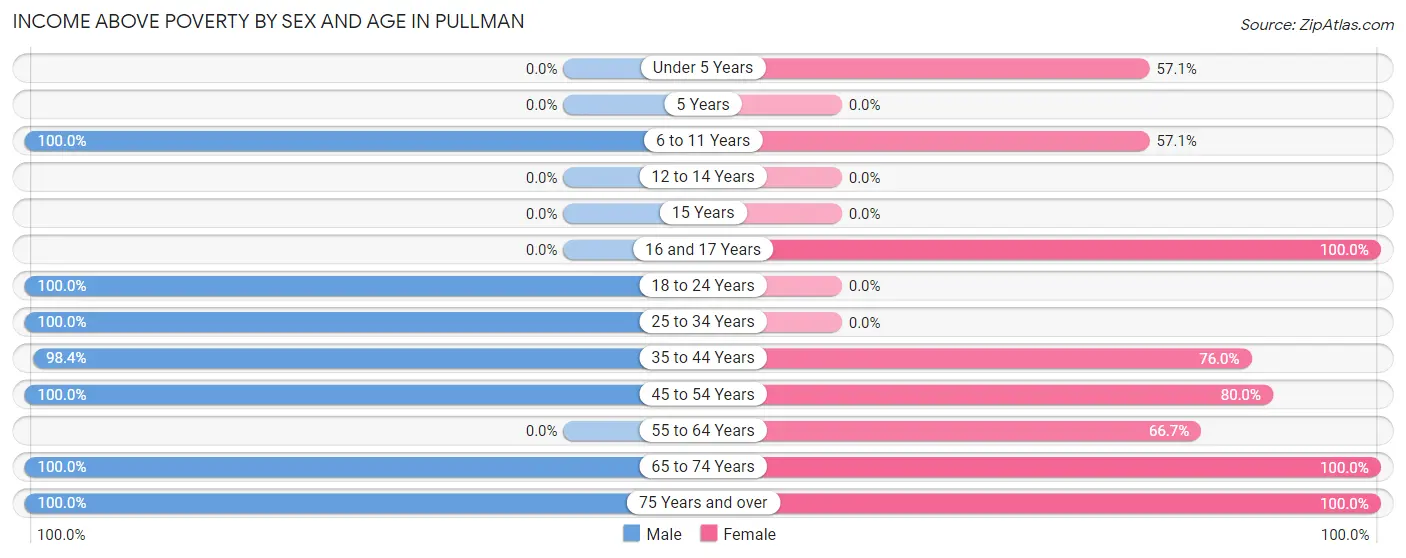
| Age Bracket | Male | Female |
| Under 5 Years | 0 (0.0%) | 4 (57.1%) |
| 5 Years | 0 (0.0%) | 0 (0.0%) |
| 6 to 11 Years | 16 (100.0%) | 4 (57.1%) |
| 12 to 14 Years | 0 (0.0%) | 0 (0.0%) |
| 15 Years | 0 (0.0%) | 0 (0.0%) |
| 16 and 17 Years | 0 (0.0%) | 1 (100.0%) |
| 18 to 24 Years | 17 (100.0%) | 0 (0.0%) |
| 25 to 34 Years | 9 (100.0%) | 0 (0.0%) |
| 35 to 44 Years | 124 (98.4%) | 19 (76.0%) |
| 45 to 54 Years | 7 (100.0%) | 8 (80.0%) |
| 55 to 64 Years | 0 (0.0%) | 2 (66.7%) |
| 65 to 74 Years | 9 (100.0%) | 34 (100.0%) |
| 75 Years and over | 23 (100.0%) | 4 (100.0%) |
| Total | 205 (96.7%) | 76 (83.5%) |
Income Below Poverty Among Married-Couple Families in Pullman
The poverty statistics for married-couple families in Pullman show that 2.1% or 1 of the total 47 families live below the poverty line. Families with no children have the highest poverty rate of 3.6%, comprising of 1 families. On the other hand, families with 1 or 2 children have the lowest poverty rate of 0.0%, which includes 0 families.
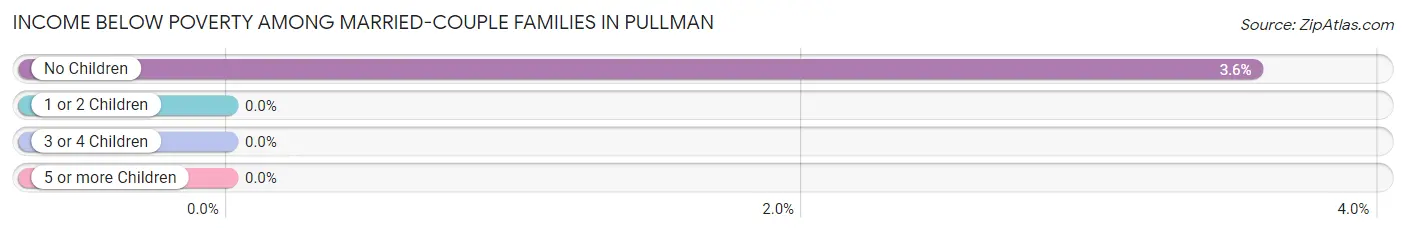
| Children | Above Poverty | Below Poverty |
| No Children | 27 (96.4%) | 1 (3.6%) |
| 1 or 2 Children | 19 (100.0%) | 0 (0.0%) |
| 3 or 4 Children | 0 (0.0%) | 0 (0.0%) |
| 5 or more Children | 0 (0.0%) | 0 (0.0%) |
| Total | 46 (97.9%) | 1 (2.1%) |
Income Below Poverty Among Single-Parent Households in Pullman
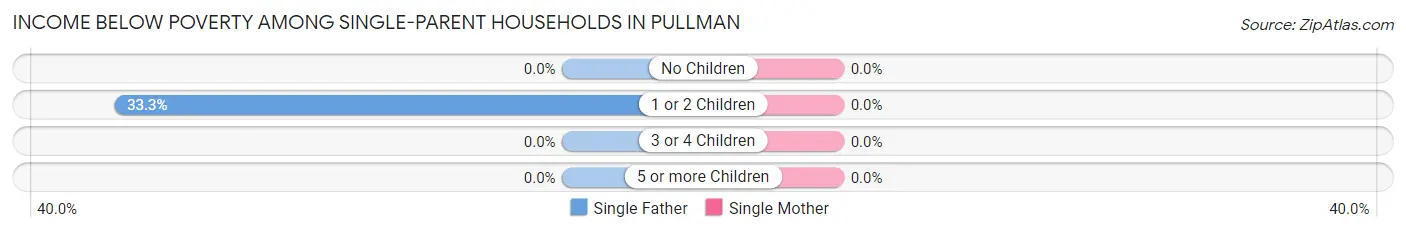
| Children | Single Father | Single Mother |
| No Children | 0 (0.0%) | 0 (0.0%) |
| 1 or 2 Children | 2 (33.3%) | 0 (0.0%) |
| 3 or 4 Children | 0 (0.0%) | 0 (0.0%) |
| 5 or more Children | 0 (0.0%) | 0 (0.0%) |
| Total | 2 (33.3%) | 0 (0.0%) |
Income Below Poverty Among Married-Couple vs Single-Parent Households in Pullman
The poverty data for Pullman shows that 1 of the married-couple family households (2.1%) and 2 of the single-parent households (33.3%) are living below the poverty level. Within the married-couple family households, those with no children have the highest poverty rate, with 1 households (3.6%) falling below the poverty line. Among the single-parent households, those with 1 or 2 children have the highest poverty rate, with 2 household (33.3%) living below poverty.
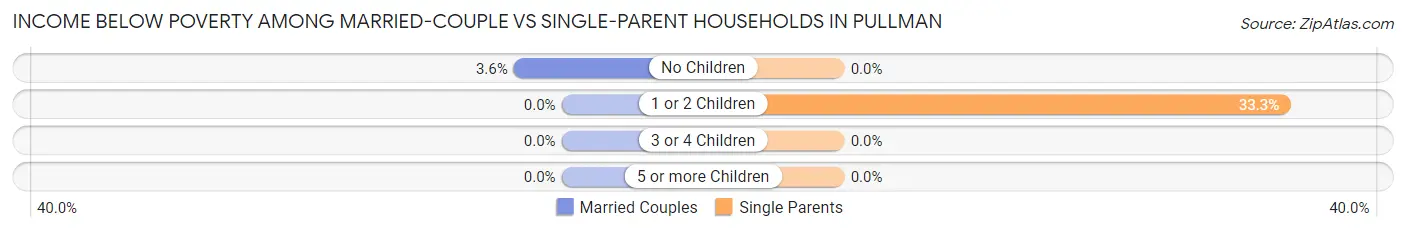
| Children | Married-Couple Families | Single-Parent Households |
| No Children | 1 (3.6%) | 0 (0.0%) |
| 1 or 2 Children | 0 (0.0%) | 2 (33.3%) |
| 3 or 4 Children | 0 (0.0%) | 0 (0.0%) |
| 5 or more Children | 0 (0.0%) | 0 (0.0%) |
| Total | 1 (2.1%) | 2 (33.3%) |
Race in Pullman
The most populous races in Pullman are White / Caucasian (298 | 98.4%), and Two or more Races (5 | 1.7%).
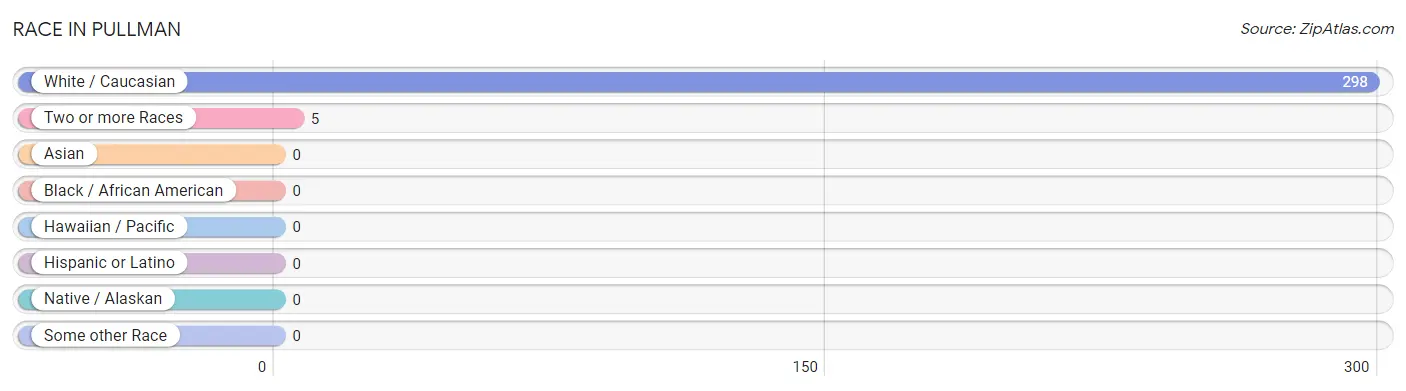
| Race | # Population | % Population |
| Asian | 0 | 0.0% |
| Black / African American | 0 | 0.0% |
| Hawaiian / Pacific | 0 | 0.0% |
| Hispanic or Latino | 0 | 0.0% |
| Native / Alaskan | 0 | 0.0% |
| White / Caucasian | 298 | 98.4% |
| Two or more Races | 5 | 1.7% |
| Some other Race | 0 | 0.0% |
| Total | 303 | 100.0% |
Ancestry in Pullman
The most populous ancestries reported in Pullman are Irish (143 | 47.2%), French (138 | 45.5%), German (34 | 11.2%), English (14 | 4.6%), and Polish (11 | 3.6%), together accounting for 112.2% of all Pullman residents.
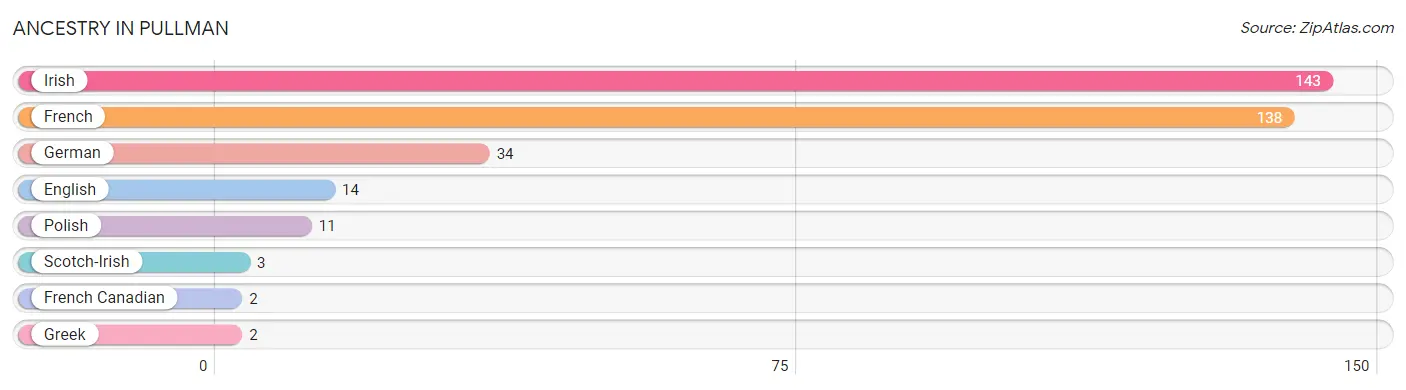
| Ancestry | # Population | % Population |
| English | 14 | 4.6% |
| French | 138 | 45.5% |
| French Canadian | 2 | 0.7% |
| German | 34 | 11.2% |
| Greek | 2 | 0.7% |
| Irish | 143 | 47.2% |
| Polish | 11 | 3.6% |
| Scotch-Irish | 3 | 1.0% | View All 8 Rows |
Immigrants in Pullman

| Immigration Origin | # Population | % Population | View All 0 Rows |
Sex and Age in Pullman
Sex and Age in Pullman
The most populous age groups in Pullman are 35 to 39 Years (120 | 56.6%) for men and 70 to 74 Years (32 | 35.2%) for women.
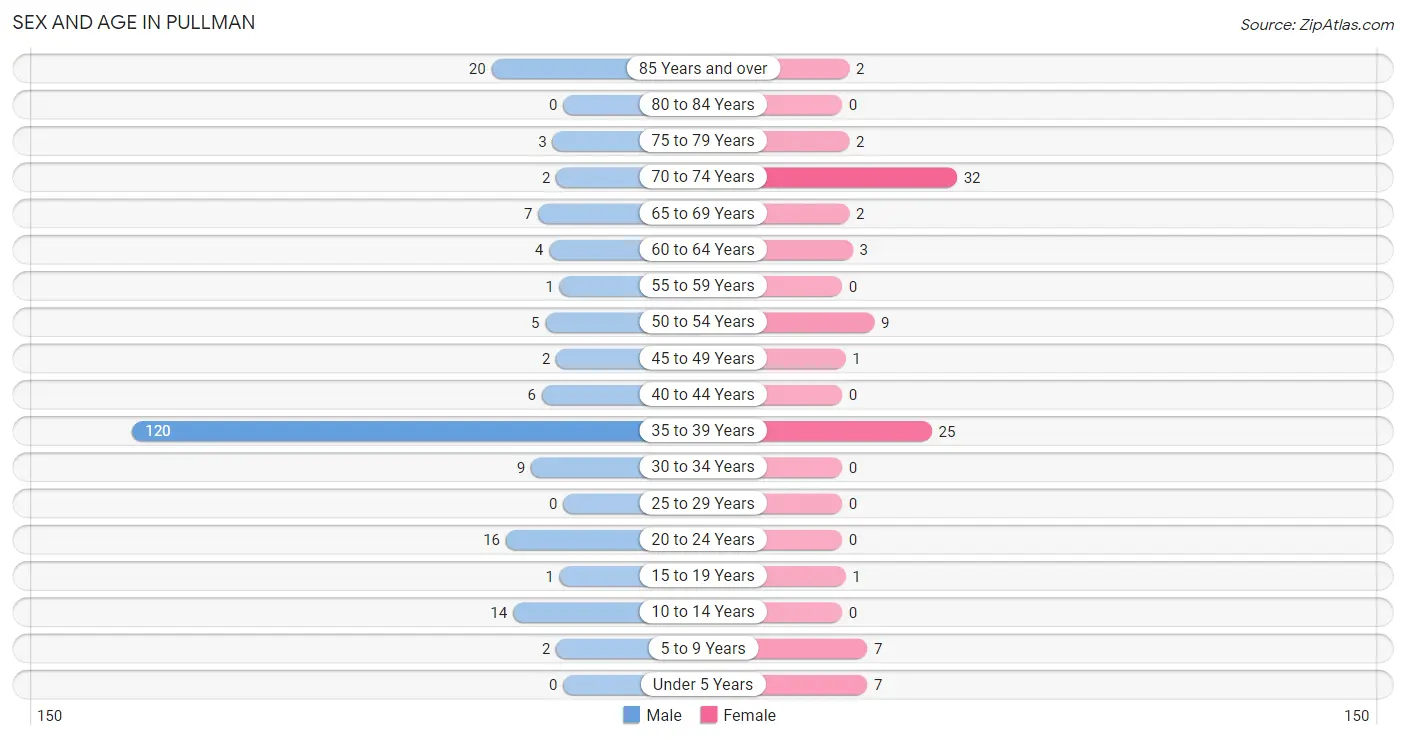
| Age Bracket | Male | Female |
| Under 5 Years | 0 (0.0%) | 7 (7.7%) |
| 5 to 9 Years | 2 (0.9%) | 7 (7.7%) |
| 10 to 14 Years | 14 (6.6%) | 0 (0.0%) |
| 15 to 19 Years | 1 (0.5%) | 1 (1.1%) |
| 20 to 24 Years | 16 (7.5%) | 0 (0.0%) |
| 25 to 29 Years | 0 (0.0%) | 0 (0.0%) |
| 30 to 34 Years | 9 (4.3%) | 0 (0.0%) |
| 35 to 39 Years | 120 (56.6%) | 25 (27.5%) |
| 40 to 44 Years | 6 (2.8%) | 0 (0.0%) |
| 45 to 49 Years | 2 (0.9%) | 1 (1.1%) |
| 50 to 54 Years | 5 (2.4%) | 9 (9.9%) |
| 55 to 59 Years | 1 (0.5%) | 0 (0.0%) |
| 60 to 64 Years | 4 (1.9%) | 3 (3.3%) |
| 65 to 69 Years | 7 (3.3%) | 2 (2.2%) |
| 70 to 74 Years | 2 (0.9%) | 32 (35.2%) |
| 75 to 79 Years | 3 (1.4%) | 2 (2.2%) |
| 80 to 84 Years | 0 (0.0%) | 0 (0.0%) |
| 85 Years and over | 20 (9.4%) | 2 (2.2%) |
| Total | 212 (100.0%) | 91 (100.0%) |
Families and Households in Pullman
Median Family Size in Pullman
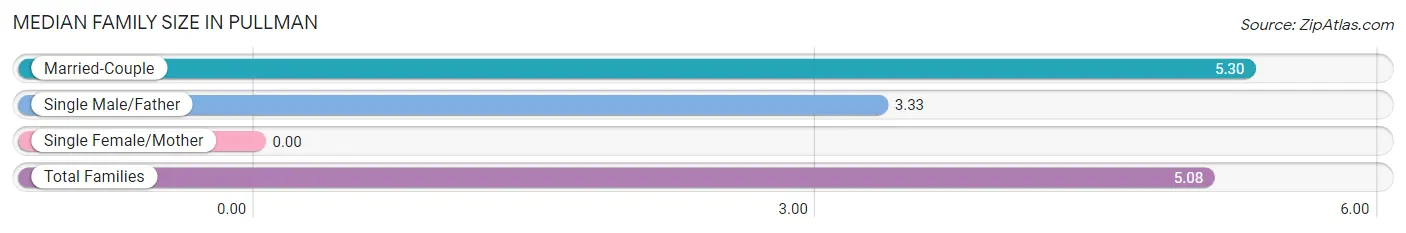
| Family Type | # Families | Family Size |
| Married-Couple | 47 (88.7%) | 5.30 |
| Single Male/Father | 6 (11.3%) | 3.33 |
| Single Female/Mother | 0 (0.0%) | - |
| Total Families | 53 (100.0%) | 5.08 |
Median Household Size in Pullman
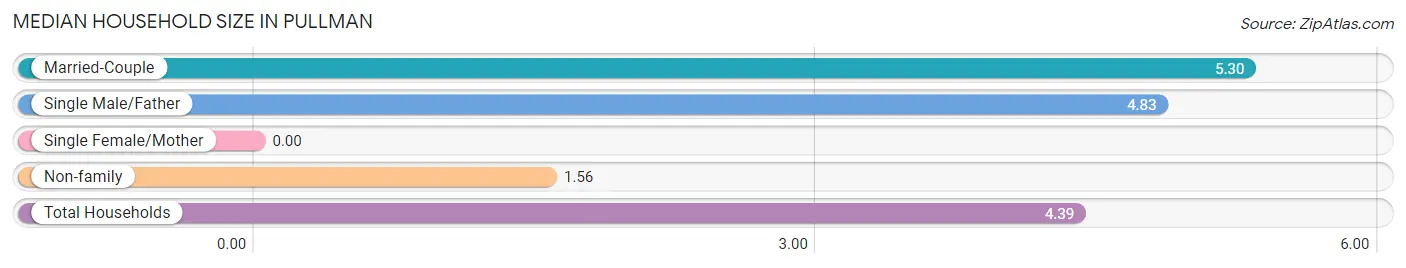
| Household Type | # Households | Household Size |
| Married-Couple | 47 (68.1%) | 5.30 |
| Single Male/Father | 6 (8.7%) | 4.83 |
| Single Female/Mother | 0 (0.0%) | - |
| Non-family | 16 (23.2%) | 1.56 |
| Total Households | 69 (100.0%) | 4.39 |
Household Size by Marriage Status in Pullman
Out of a total of 69 households in Pullman, 53 (76.8%) are family households, while 16 (23.2%) are nonfamily households. The most numerous type of family households are 4-person households, comprising 23, and the most common type of nonfamily households are 2-person households, comprising 10.
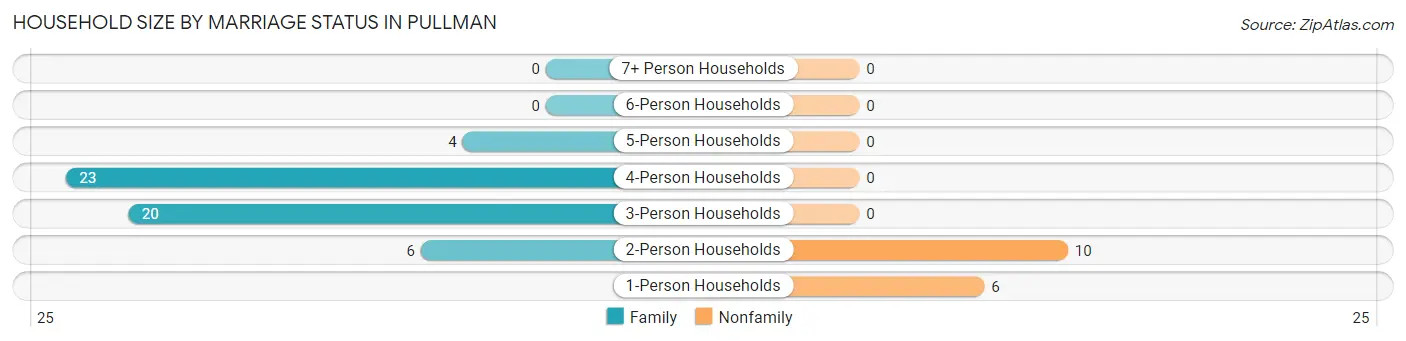
| Household Size | Family Households | Nonfamily Households |
| 1-Person Households | - | 6 (8.7%) |
| 2-Person Households | 6 (8.7%) | 10 (14.5%) |
| 3-Person Households | 20 (29.0%) | 0 (0.0%) |
| 4-Person Households | 23 (33.3%) | 0 (0.0%) |
| 5-Person Households | 4 (5.8%) | 0 (0.0%) |
| 6-Person Households | 0 (0.0%) | 0 (0.0%) |
| 7+ Person Households | 0 (0.0%) | 0 (0.0%) |
| Total | 53 (76.8%) | 16 (23.2%) |
Female Fertility in Pullman
Fertility by Age in Pullman
| Age Bracket | Women with Births | Births / 1,000 Women |
| 15 to 19 years | 0 (0.0%) | 0.0 |
| 20 to 34 years | 0 (0.0%) | 0.0 |
| 35 to 50 years | 0 (0.0%) | 0.0 |
| Total | 0 (0.0%) | 0.0 |
Fertility by Age by Marriage Status in Pullman
| Age Bracket | Married | Unmarried |
| 15 to 19 years | 0 (0.0%) | 0 (0.0%) |
| 20 to 34 years | 0 (0.0%) | 0 (0.0%) |
| 35 to 50 years | 0 (0.0%) | 0 (0.0%) |
| Total | 0 (0.0%) | 0 (0.0%) |
Fertility by Education in Pullman
| Educational Attainment | Women with Births | Births / 1,000 Women |
| Less than High School | 0 (0.0%) | 0.0 |
| High School Diploma | 0 (0.0%) | 0.0 |
| College or Associate's Degree | 0 (0.0%) | 0.0 |
| Bachelor's Degree | 0 (0.0%) | 0.0 |
| Graduate Degree | 0 (0.0%) | 0.0 |
| Total | 0 (0.0%) | 0.0 |
Fertility by Education by Marriage Status in Pullman
| Educational Attainment | Married | Unmarried |
| Less than High School | 0 (0.0%) | 0 (0.0%) |
| High School Diploma | 0 (0.0%) | 0 (0.0%) |
| College or Associate's Degree | 0 (0.0%) | 0 (0.0%) |
| Bachelor's Degree | 0 (0.0%) | 0 (0.0%) |
| Graduate Degree | 0 (0.0%) | 0 (0.0%) |
| Total | 0 (0.0%) | 0 (0.0%) |
Employment Characteristics in Pullman
Employment by Class of Employer in Pullman
Among the 82 employed individuals in Pullman, local government employees (50 | 61.0%), private company employees (29 | 35.4%), and self-employed (not incorporated) (2 | 2.4%) make up the most common classes of employment.
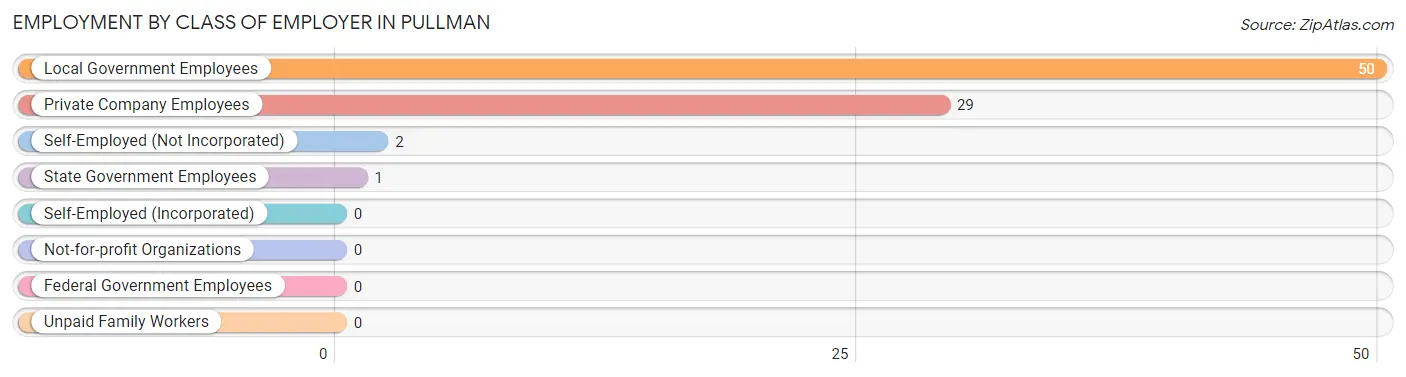
| Employer Class | # Employees | % Employees |
| Private Company Employees | 29 | 35.4% |
| Self-Employed (Incorporated) | 0 | 0.0% |
| Self-Employed (Not Incorporated) | 2 | 2.4% |
| Not-for-profit Organizations | 0 | 0.0% |
| Local Government Employees | 50 | 61.0% |
| State Government Employees | 1 | 1.2% |
| Federal Government Employees | 0 | 0.0% |
| Unpaid Family Workers | 0 | 0.0% |
| Total | 82 | 100.0% |
Employment Status by Age in Pullman
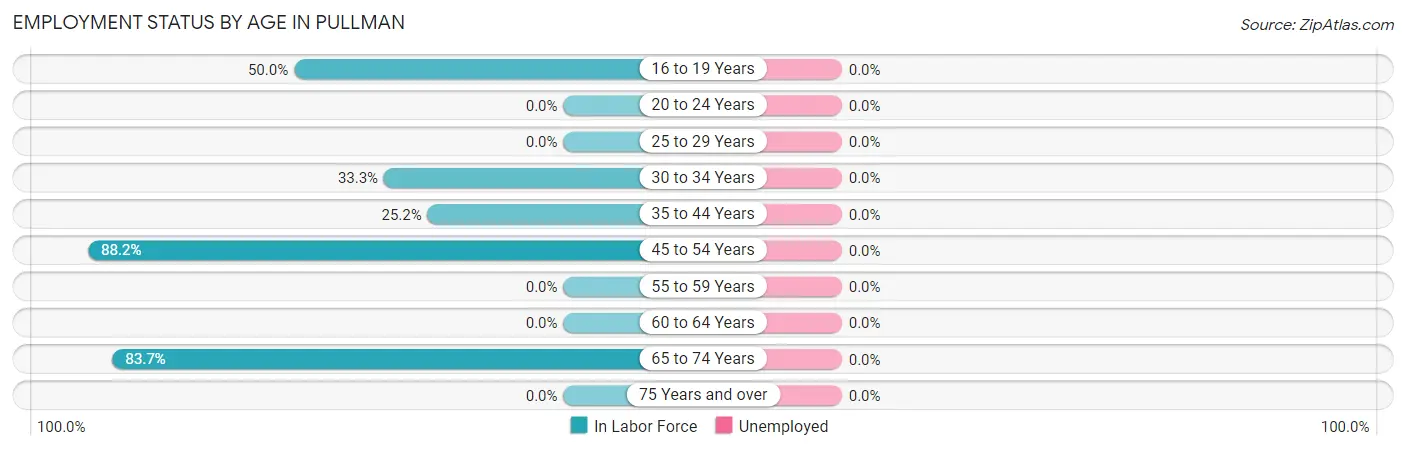
| Age Bracket | In Labor Force | Unemployed |
| 16 to 19 Years | 1 (50.0%) | 0 (0.0%) |
| 20 to 24 Years | 0 (0.0%) | 0 (0.0%) |
| 25 to 29 Years | 0 (0.0%) | 0 (0.0%) |
| 30 to 34 Years | 3 (33.3%) | 0 (0.0%) |
| 35 to 44 Years | 38 (25.2%) | 0 (0.0%) |
| 45 to 54 Years | 15 (88.2%) | 0 (0.0%) |
| 55 to 59 Years | 0 (0.0%) | 0 (0.0%) |
| 60 to 64 Years | 0 (0.0%) | 0 (0.0%) |
| 65 to 74 Years | 36 (83.7%) | 0 (0.0%) |
| 75 Years and over | 0 (0.0%) | 0 (0.0%) |
| Total | 93 (34.1%) | 0 (0.0%) |
Employment Status by Educational Attainment in Pullman
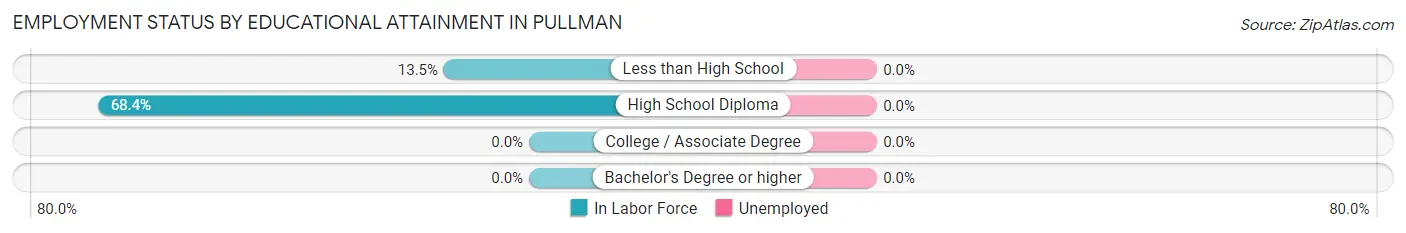
| Educational Attainment | In Labor Force | Unemployed |
| Less than High School | 17 (13.5%) | 0 (0.0%) |
| High School Diploma | 39 (68.4%) | 0 (0.0%) |
| College / Associate Degree | 0 (0.0%) | 0 (0.0%) |
| Bachelor's Degree or higher | 0 (0.0%) | 0 (0.0%) |
| Total | 56 (30.3%) | 0 (0.0%) |
Employment Occupations by Sex in Pullman
Management, Business, Science and Arts Occupations
The most common Management, Business, Science and Arts occupations in Pullman are Community & Social Service (7 | 7.5%), Education Instruction & Library (7 | 7.5%), Business & Financial (2 | 2.1%), and Health Diagnosing & Treating (2 | 2.1%).
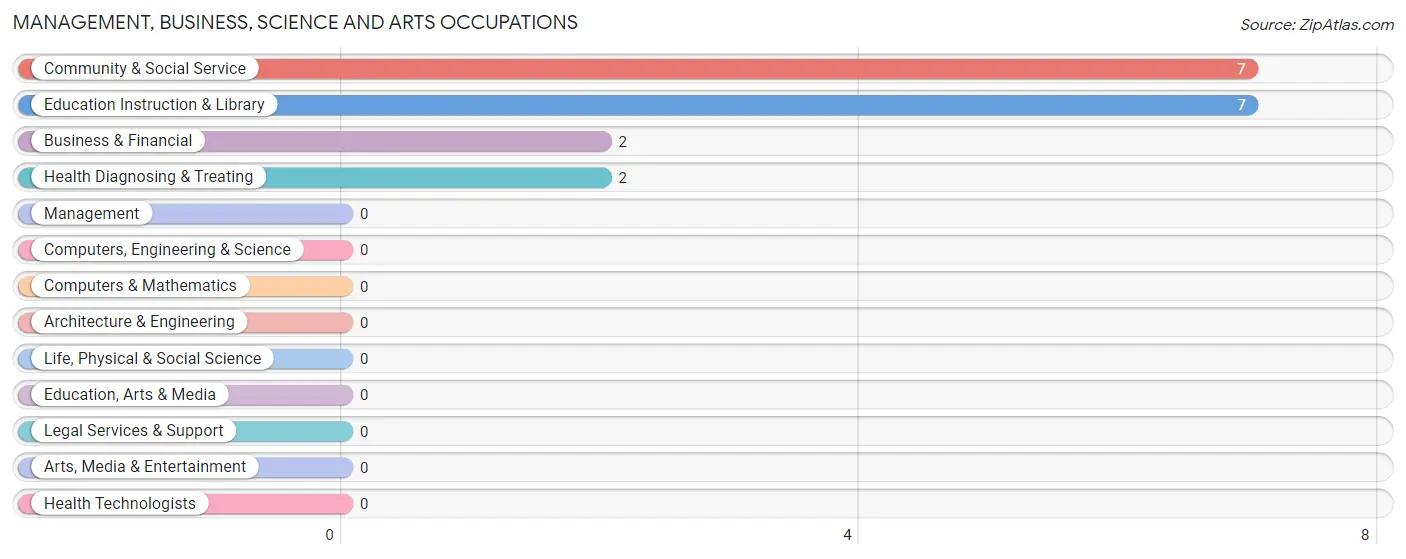
Management, Business, Science and Arts Occupations by Sex
Within the Management, Business, Science and Arts occupations in Pullman, the most male-oriented occupations are Business & Financial (100.0%), and Health Diagnosing & Treating (100.0%), while the most female-oriented occupations are Community & Social Service (100.0%), and Education Instruction & Library (100.0%).
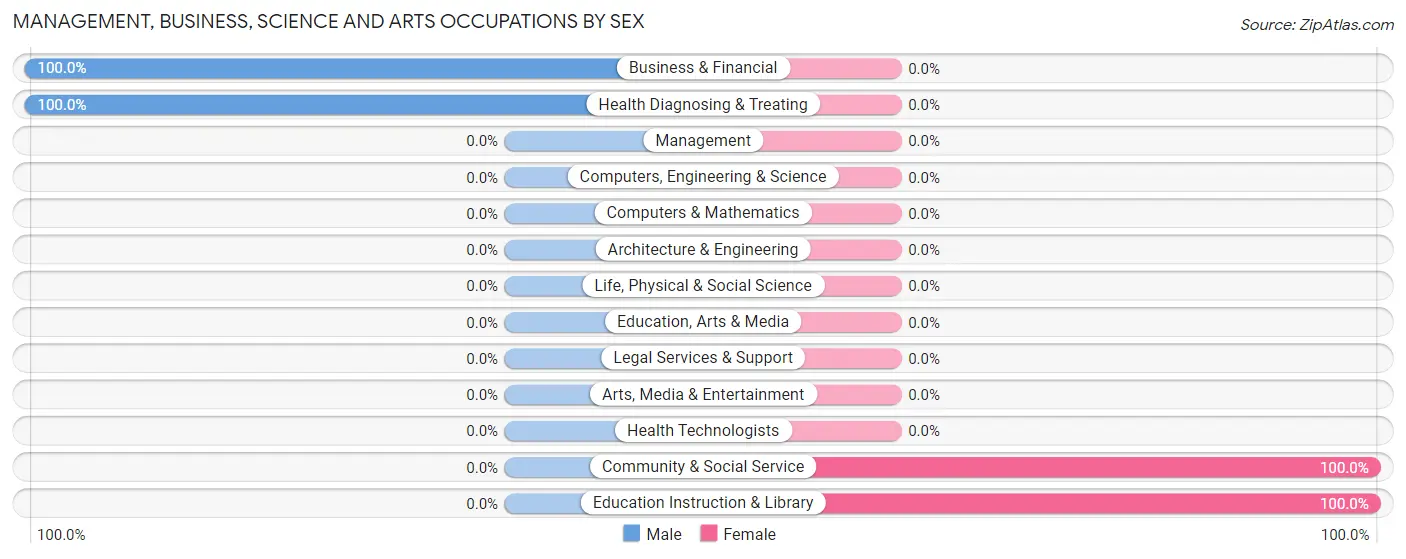
| Occupation | Male | Female |
| Management | 0 (0.0%) | 0 (0.0%) |
| Business & Financial | 2 (100.0%) | 0 (0.0%) |
| Computers, Engineering & Science | 0 (0.0%) | 0 (0.0%) |
| Computers & Mathematics | 0 (0.0%) | 0 (0.0%) |
| Architecture & Engineering | 0 (0.0%) | 0 (0.0%) |
| Life, Physical & Social Science | 0 (0.0%) | 0 (0.0%) |
| Community & Social Service | 0 (0.0%) | 7 (100.0%) |
| Education, Arts & Media | 0 (0.0%) | 0 (0.0%) |
| Legal Services & Support | 0 (0.0%) | 0 (0.0%) |
| Education Instruction & Library | 0 (0.0%) | 7 (100.0%) |
| Arts, Media & Entertainment | 0 (0.0%) | 0 (0.0%) |
| Health Diagnosing & Treating | 2 (100.0%) | 0 (0.0%) |
| Health Technologists | 0 (0.0%) | 0 (0.0%) |
| Total (Category) | 4 (36.4%) | 7 (63.6%) |
| Total (Overall) | 36 (38.7%) | 57 (61.3%) |
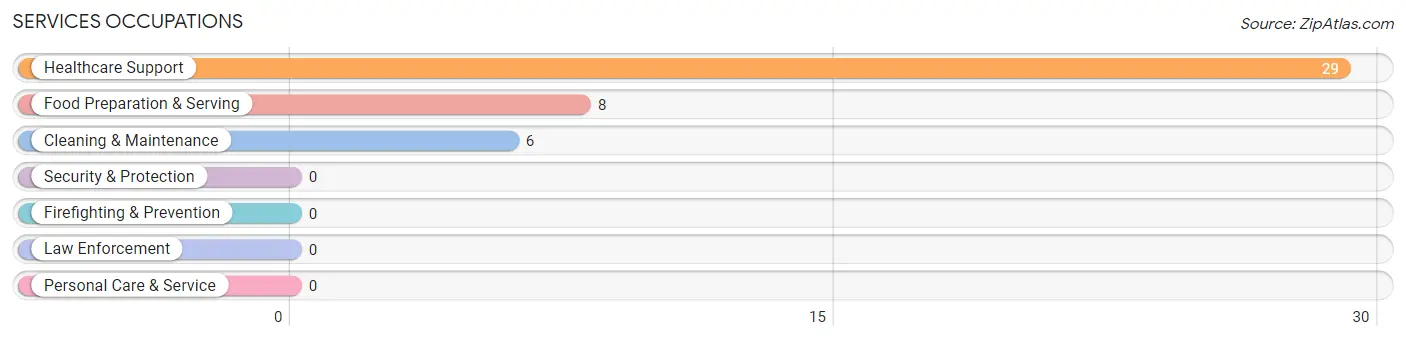
Services Occupations
The most common Services occupations in Pullman are Healthcare Support (29 | 31.2%), Food Preparation & Serving (8 | 8.6%), and Cleaning & Maintenance (6 | 6.5%).
Services Occupations by Sex
Within the Services occupations in Pullman, the most male-oriented occupations are Cleaning & Maintenance (100.0%), and Food Preparation & Serving (87.5%), while the most female-oriented occupations are Healthcare Support (100.0%), and Food Preparation & Serving (12.5%).
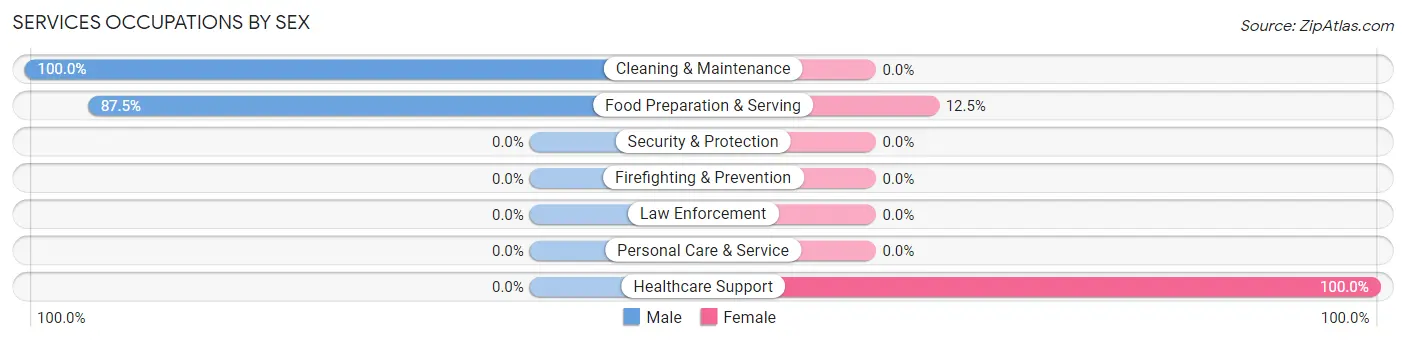
| Occupation | Male | Female |
| Healthcare Support | 0 (0.0%) | 29 (100.0%) |
| Security & Protection | 0 (0.0%) | 0 (0.0%) |
| Firefighting & Prevention | 0 (0.0%) | 0 (0.0%) |
| Law Enforcement | 0 (0.0%) | 0 (0.0%) |
| Food Preparation & Serving | 7 (87.5%) | 1 (12.5%) |
| Cleaning & Maintenance | 6 (100.0%) | 0 (0.0%) |
| Personal Care & Service | 0 (0.0%) | 0 (0.0%) |
| Total (Category) | 13 (30.2%) | 30 (69.8%) |
| Total (Overall) | 36 (38.7%) | 57 (61.3%) |
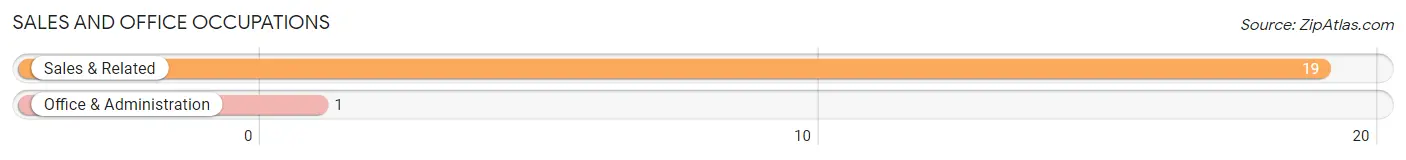
Sales and Office Occupations
The most common Sales and Office occupations in Pullman are Sales & Related (19 | 20.4%), and Office & Administration (1 | 1.1%).
Sales and Office Occupations by Sex
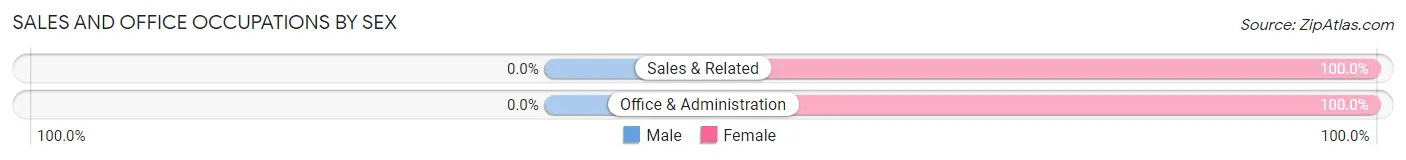
| Occupation | Male | Female |
| Sales & Related | 0 (0.0%) | 19 (100.0%) |
| Office & Administration | 0 (0.0%) | 1 (100.0%) |
| Total (Category) | 0 (0.0%) | 20 (100.0%) |
| Total (Overall) | 36 (38.7%) | 57 (61.3%) |
Natural Resources, Construction and Maintenance Occupations
The most common Natural Resources, Construction and Maintenance occupations in Pullman are , and Installation, Maintenance & Repair (16 | 17.2%).
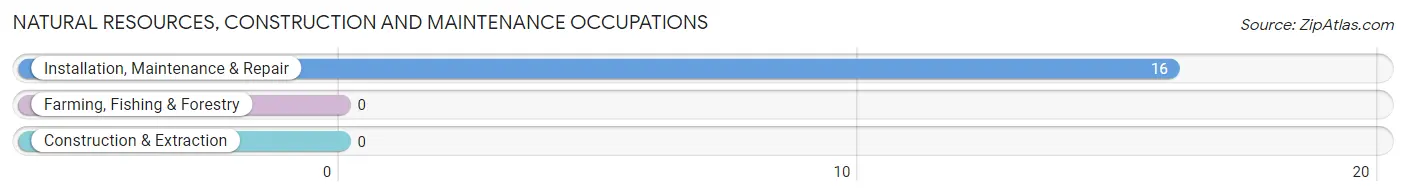
Natural Resources, Construction and Maintenance Occupations by Sex
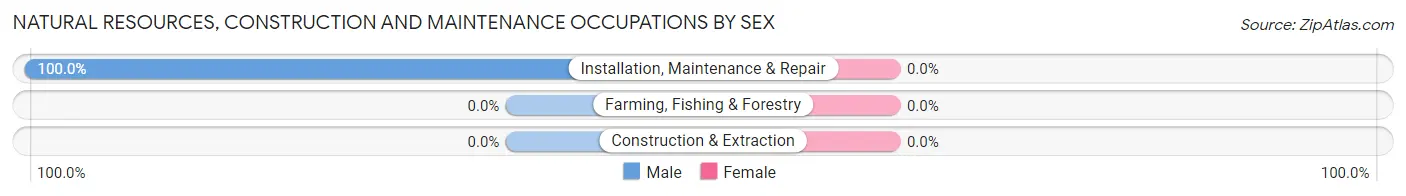
| Occupation | Male | Female |
| Farming, Fishing & Forestry | 0 (0.0%) | 0 (0.0%) |
| Construction & Extraction | 0 (0.0%) | 0 (0.0%) |
| Installation, Maintenance & Repair | 16 (100.0%) | 0 (0.0%) |
| Total (Category) | 16 (100.0%) | 0 (0.0%) |
| Total (Overall) | 36 (38.7%) | 57 (61.3%) |
Production, Transportation and Moving Occupations
The most common Production, Transportation and Moving occupations in Pullman are , and Production (3 | 3.2%).
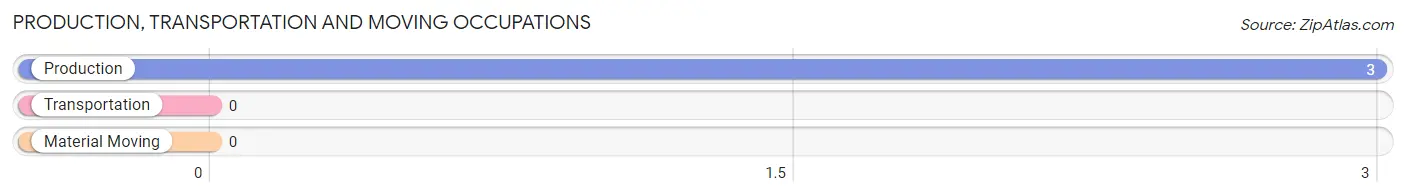
Production, Transportation and Moving Occupations by Sex
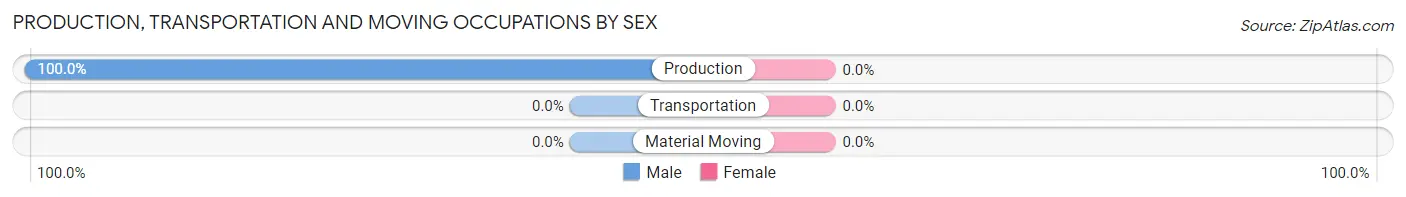
| Occupation | Male | Female |
| Production | 3 (100.0%) | 0 (0.0%) |
| Transportation | 0 (0.0%) | 0 (0.0%) |
| Material Moving | 0 (0.0%) | 0 (0.0%) |
| Total (Category) | 3 (100.0%) | 0 (0.0%) |
| Total (Overall) | 36 (38.7%) | 57 (61.3%) |
Employment Industries by Sex in Pullman
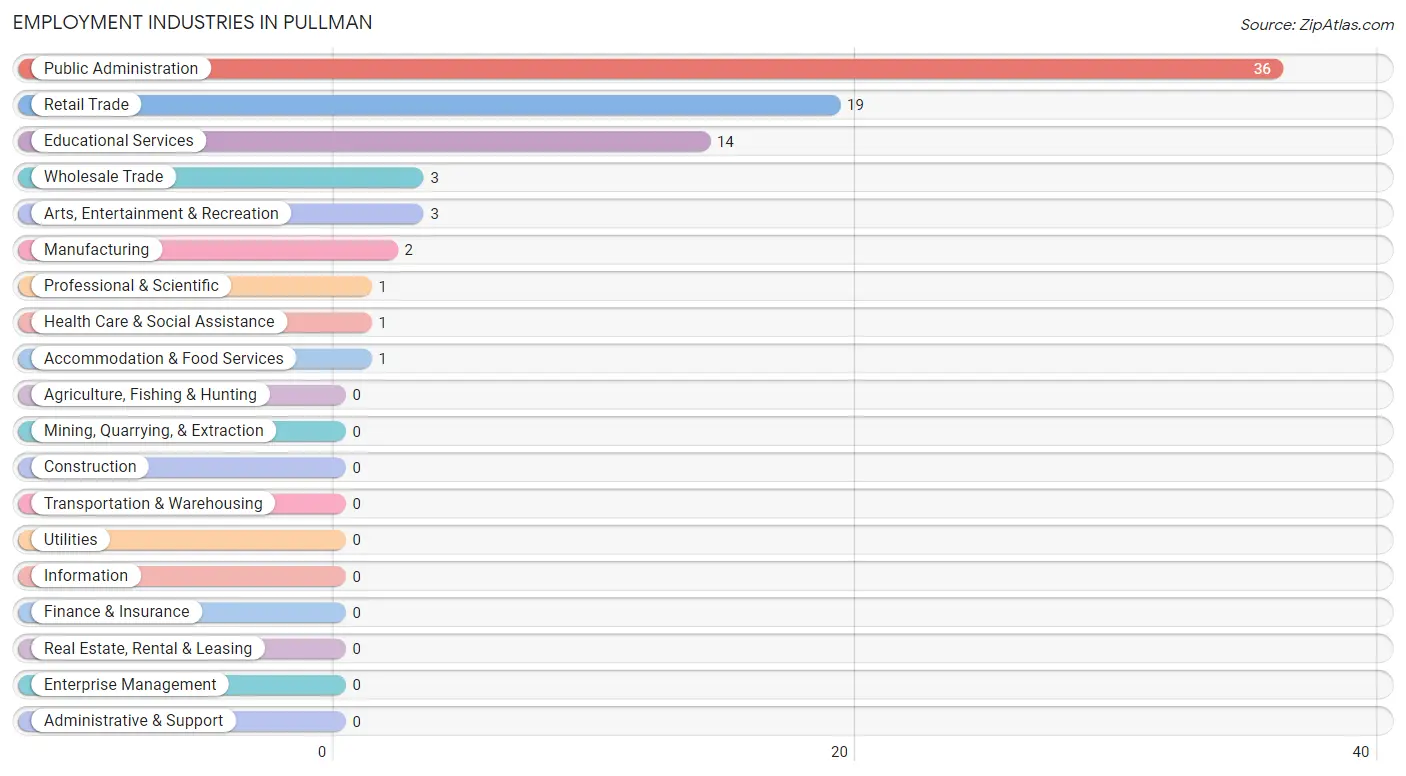
Employment Industries in Pullman
The major employment industries in Pullman include Public Administration (36 | 38.7%), Retail Trade (19 | 20.4%), Educational Services (14 | 15.0%), Wholesale Trade (3 | 3.2%), and Arts, Entertainment & Recreation (3 | 3.2%).
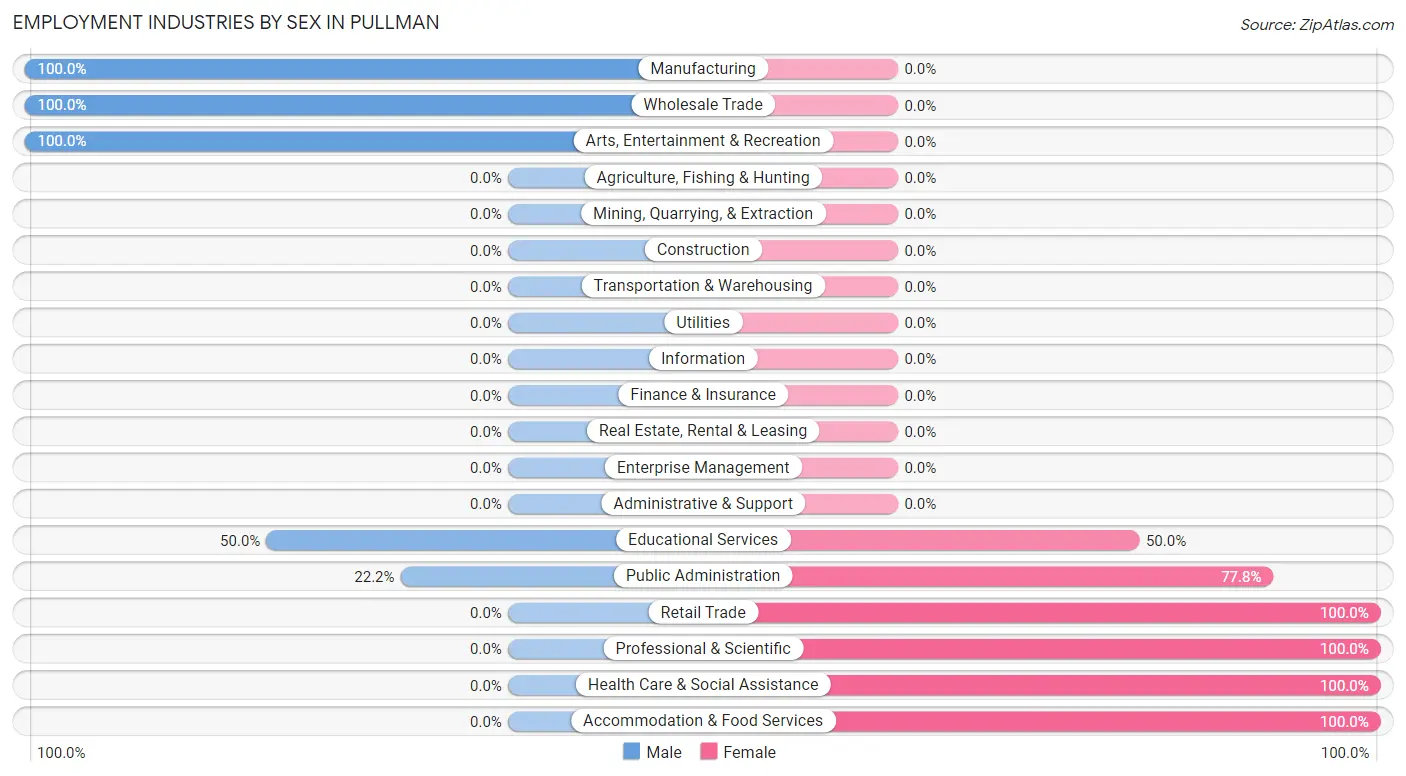
Employment Industries by Sex in Pullman
The Pullman industries that see more men than women are Manufacturing (100.0%), Wholesale Trade (100.0%), and Arts, Entertainment & Recreation (100.0%), whereas the industries that tend to have a higher number of women are Retail Trade (100.0%), Professional & Scientific (100.0%), and Health Care & Social Assistance (100.0%).
| Industry | Male | Female |
| Agriculture, Fishing & Hunting | 0 (0.0%) | 0 (0.0%) |
| Mining, Quarrying, & Extraction | 0 (0.0%) | 0 (0.0%) |
| Construction | 0 (0.0%) | 0 (0.0%) |
| Manufacturing | 2 (100.0%) | 0 (0.0%) |
| Wholesale Trade | 3 (100.0%) | 0 (0.0%) |
| Retail Trade | 0 (0.0%) | 19 (100.0%) |
| Transportation & Warehousing | 0 (0.0%) | 0 (0.0%) |
| Utilities | 0 (0.0%) | 0 (0.0%) |
| Information | 0 (0.0%) | 0 (0.0%) |
| Finance & Insurance | 0 (0.0%) | 0 (0.0%) |
| Real Estate, Rental & Leasing | 0 (0.0%) | 0 (0.0%) |
| Professional & Scientific | 0 (0.0%) | 1 (100.0%) |
| Enterprise Management | 0 (0.0%) | 0 (0.0%) |
| Administrative & Support | 0 (0.0%) | 0 (0.0%) |
| Educational Services | 7 (50.0%) | 7 (50.0%) |
| Health Care & Social Assistance | 0 (0.0%) | 1 (100.0%) |
| Arts, Entertainment & Recreation | 3 (100.0%) | 0 (0.0%) |
| Accommodation & Food Services | 0 (0.0%) | 1 (100.0%) |
| Public Administration | 8 (22.2%) | 28 (77.8%) |
| Total | 36 (38.7%) | 57 (61.3%) |
Education in Pullman
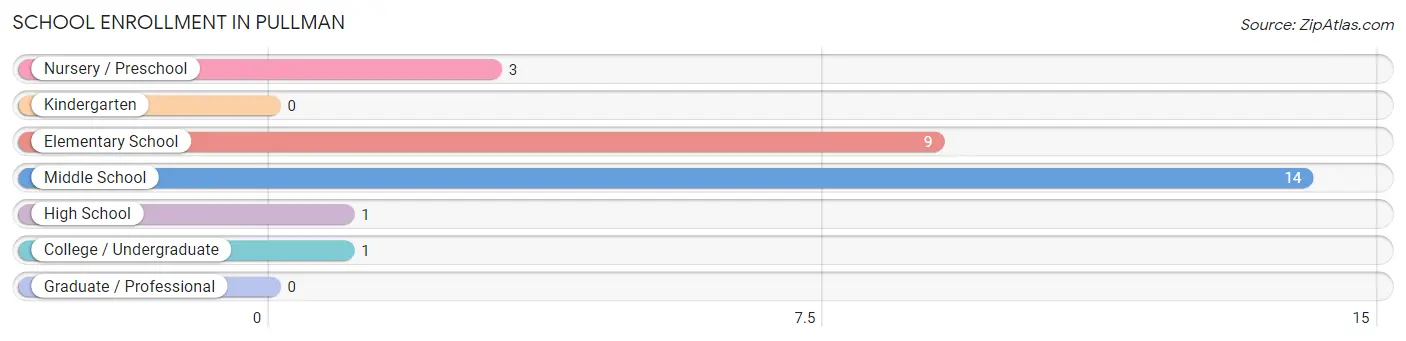
School Enrollment in Pullman
The most common levels of schooling among the 28 students in Pullman are middle school (14 | 50.0%), elementary school (9 | 32.1%), and nursery / preschool (3 | 10.7%).
| School Level | # Students | % Students |
| Nursery / Preschool | 3 | 10.7% |
| Kindergarten | 0 | 0.0% |
| Elementary School | 9 | 32.1% |
| Middle School | 14 | 50.0% |
| High School | 1 | 3.6% |
| College / Undergraduate | 1 | 3.6% |
| Graduate / Professional | 0 | 0.0% |
| Total | 28 | 100.0% |
School Enrollment by Age by Funding Source in Pullman
Out of a total of 28 students who are enrolled in schools in Pullman, 14 (50.0%) attend a private institution, while the remaining 14 (50.0%) are enrolled in public schools. The age group of 10 to 14 year olds has the highest likelihood of being enrolled in private schools, with 14 (100.0% in the age bracket) enrolled. Conversely, the age group of 3 to 4 year olds has the lowest likelihood of being enrolled in a private school, with 3 (100.0% in the age bracket) attending a public institution.
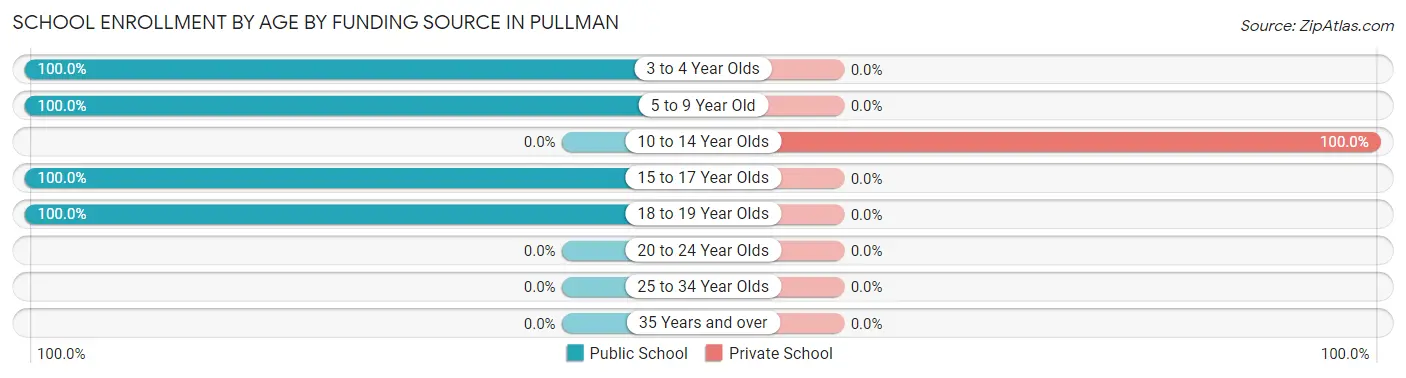
| Age Bracket | Public School | Private School |
| 3 to 4 Year Olds | 3 (100.0%) | 0 (0.0%) |
| 5 to 9 Year Old | 9 (100.0%) | 0 (0.0%) |
| 10 to 14 Year Olds | 0 (0.0%) | 14 (100.0%) |
| 15 to 17 Year Olds | 1 (100.0%) | 0 (0.0%) |
| 18 to 19 Year Olds | 1 (100.0%) | 0 (0.0%) |
| 20 to 24 Year Olds | 0 (0.0%) | 0 (0.0%) |
| 25 to 34 Year Olds | 0 (0.0%) | 0 (0.0%) |
| 35 Years and over | 0 (0.0%) | 0 (0.0%) |
| Total | 14 (50.0%) | 14 (50.0%) |
Educational Attainment by Field of Study in Pullman
| Field of Study | # Graduates | % Graduates |
| Computers & Mathematics | 0 | 0.0% |
| Bio, Nature & Agricultural | 0 | 0.0% |
| Physical & Health Sciences | 0 | 0.0% |
| Psychology | 0 | 0.0% |
| Social Sciences | 0 | 0.0% |
| Engineering | 0 | 0.0% |
| Multidisciplinary Studies | 0 | 0.0% |
| Science & Technology | 0 | 0.0% |
| Business | 0 | 0.0% |
| Education | 0 | 0.0% |
| Literature & Languages | 0 | 0.0% |
| Liberal Arts & History | 0 | 0.0% |
| Visual & Performing Arts | 0 | 0.0% |
| Communications | 0 | 0.0% |
| Arts & Humanities | 0 | 0.0% |
| Total | 0 | 0.0% |
Transportation & Commute in Pullman
Vehicle Availability by Sex in Pullman
The most prevalent vehicle ownership categories in Pullman are males with 2 vehicles (15, accounting for 60.0%) and females with 2 vehicles (21, making up 26.3%).
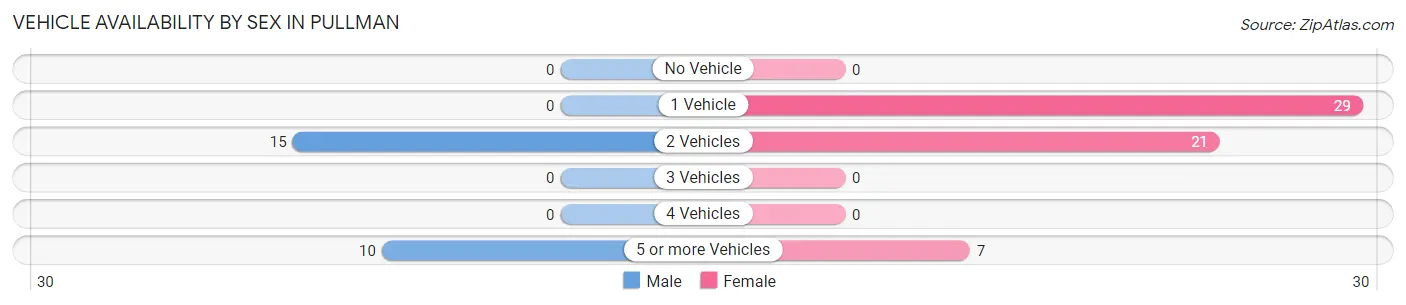
| Vehicles Available | Male | Female |
| No Vehicle | 0 (0.0%) | 0 (0.0%) |
| 1 Vehicle | 0 (0.0%) | 29 (50.9%) |
| 2 Vehicles | 15 (60.0%) | 21 (36.8%) |
| 3 Vehicles | 0 (0.0%) | 0 (0.0%) |
| 4 Vehicles | 0 (0.0%) | 0 (0.0%) |
| 5 or more Vehicles | 10 (40.0%) | 7 (12.3%) |
| Total | 25 (100.0%) | 57 (100.0%) |
Commute Time in Pullman
The most frequently occuring commute durations in Pullman are 15 to 19 minutes (17 commuters, 32.1%), 25 to 29 minutes (10 commuters, 18.9%), and 60 to 89 minutes (10 commuters, 18.9%).
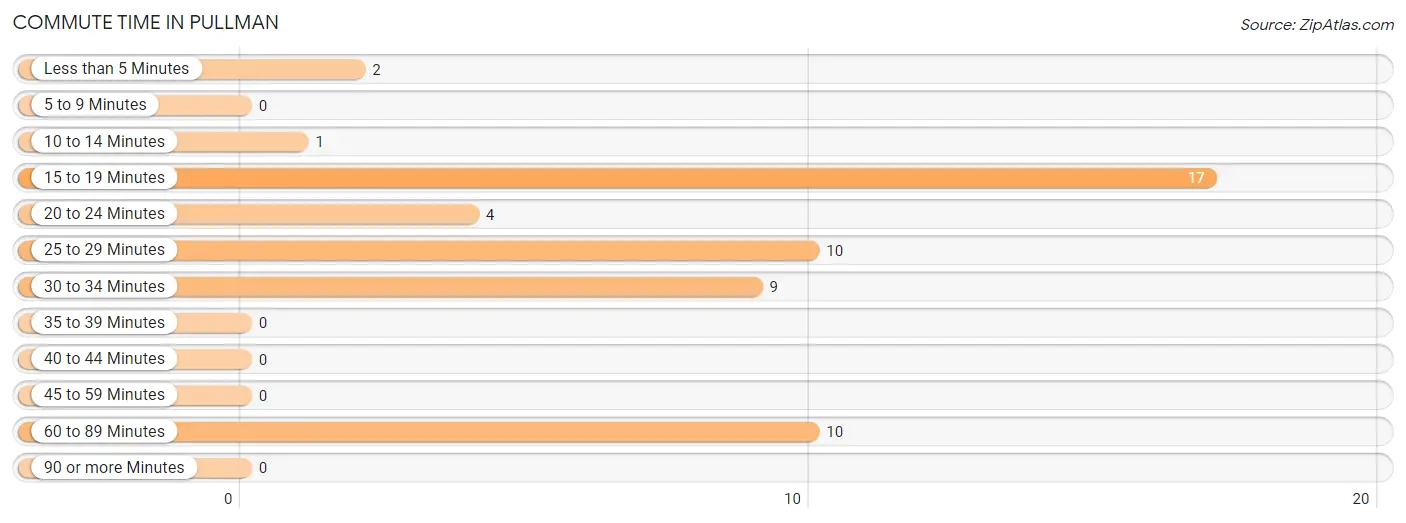
| Commute Time | # Commuters | % Commuters |
| Less than 5 Minutes | 2 | 3.8% |
| 5 to 9 Minutes | 0 | 0.0% |
| 10 to 14 Minutes | 1 | 1.9% |
| 15 to 19 Minutes | 17 | 32.1% |
| 20 to 24 Minutes | 4 | 7.5% |
| 25 to 29 Minutes | 10 | 18.9% |
| 30 to 34 Minutes | 9 | 17.0% |
| 35 to 39 Minutes | 0 | 0.0% |
| 40 to 44 Minutes | 0 | 0.0% |
| 45 to 59 Minutes | 0 | 0.0% |
| 60 to 89 Minutes | 10 | 18.9% |
| 90 or more Minutes | 0 | 0.0% |
Commute Time by Sex in Pullman
The most common commute times in Pullman are 30 to 34 minutes (9 commuters, 36.0%) for males and 15 to 19 minutes (17 commuters, 60.7%) for females.
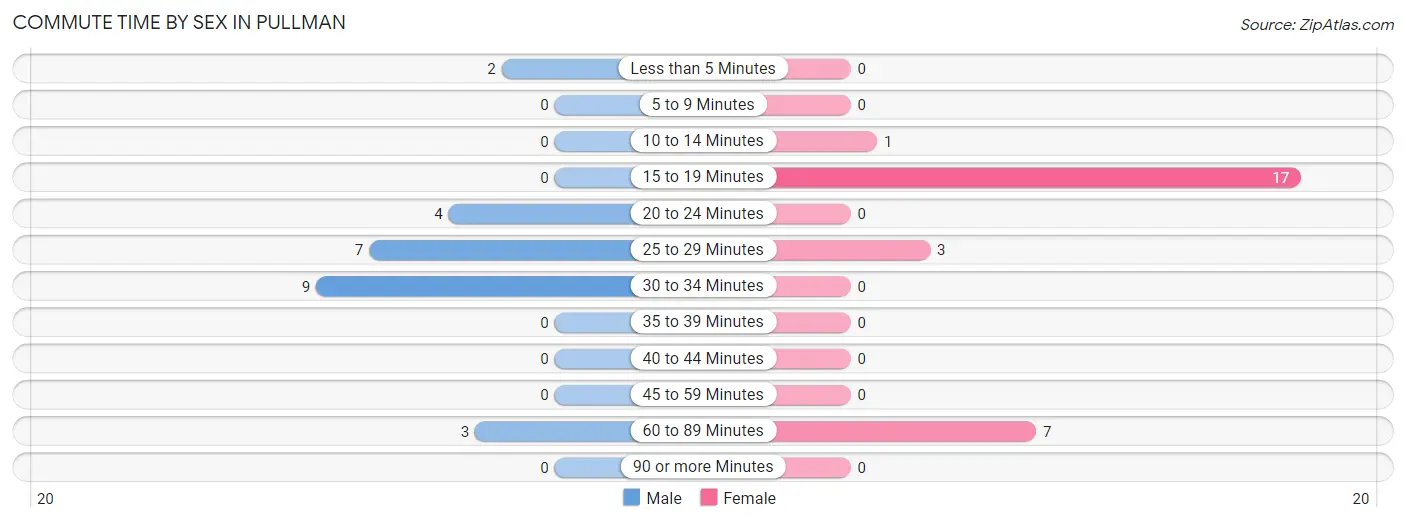
| Commute Time | Male | Female |
| Less than 5 Minutes | 2 (8.0%) | 0 (0.0%) |
| 5 to 9 Minutes | 0 (0.0%) | 0 (0.0%) |
| 10 to 14 Minutes | 0 (0.0%) | 1 (3.6%) |
| 15 to 19 Minutes | 0 (0.0%) | 17 (60.7%) |
| 20 to 24 Minutes | 4 (16.0%) | 0 (0.0%) |
| 25 to 29 Minutes | 7 (28.0%) | 3 (10.7%) |
| 30 to 34 Minutes | 9 (36.0%) | 0 (0.0%) |
| 35 to 39 Minutes | 0 (0.0%) | 0 (0.0%) |
| 40 to 44 Minutes | 0 (0.0%) | 0 (0.0%) |
| 45 to 59 Minutes | 0 (0.0%) | 0 (0.0%) |
| 60 to 89 Minutes | 3 (12.0%) | 7 (25.0%) |
| 90 or more Minutes | 0 (0.0%) | 0 (0.0%) |
Time of Departure to Work by Sex in Pullman
The most frequent times of departure to work in Pullman are 5:30 AM to 5:59 AM (7, 28.0%) for males and 5:30 AM to 5:59 AM (17, 60.7%) for females.
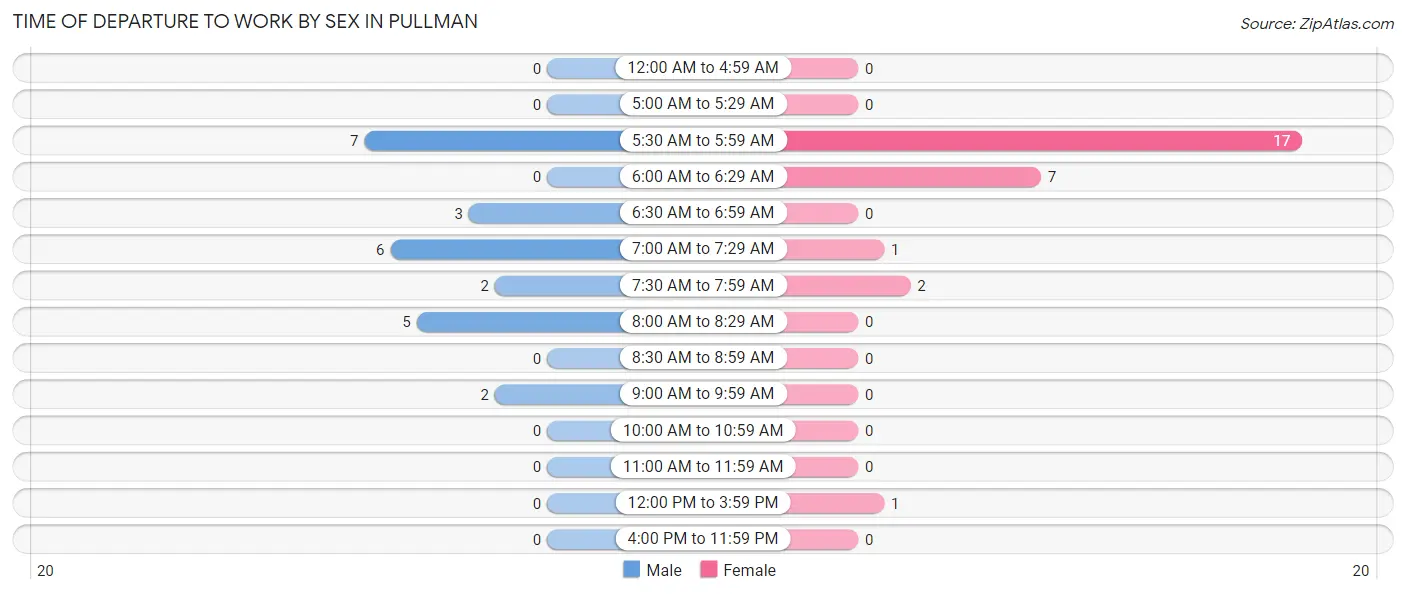
| Time of Departure | Male | Female |
| 12:00 AM to 4:59 AM | 0 (0.0%) | 0 (0.0%) |
| 5:00 AM to 5:29 AM | 0 (0.0%) | 0 (0.0%) |
| 5:30 AM to 5:59 AM | 7 (28.0%) | 17 (60.7%) |
| 6:00 AM to 6:29 AM | 0 (0.0%) | 7 (25.0%) |
| 6:30 AM to 6:59 AM | 3 (12.0%) | 0 (0.0%) |
| 7:00 AM to 7:29 AM | 6 (24.0%) | 1 (3.6%) |
| 7:30 AM to 7:59 AM | 2 (8.0%) | 2 (7.1%) |
| 8:00 AM to 8:29 AM | 5 (20.0%) | 0 (0.0%) |
| 8:30 AM to 8:59 AM | 0 (0.0%) | 0 (0.0%) |
| 9:00 AM to 9:59 AM | 2 (8.0%) | 0 (0.0%) |
| 10:00 AM to 10:59 AM | 0 (0.0%) | 0 (0.0%) |
| 11:00 AM to 11:59 AM | 0 (0.0%) | 0 (0.0%) |
| 12:00 PM to 3:59 PM | 0 (0.0%) | 1 (3.6%) |
| 4:00 PM to 11:59 PM | 0 (0.0%) | 0 (0.0%) |
| Total | 25 (100.0%) | 28 (100.0%) |
Housing Occupancy in Pullman
Occupancy by Ownership in Pullman
Of the total 69 dwellings in Pullman, owner-occupied units account for 49 (71.0%), while renter-occupied units make up 20 (29.0%).
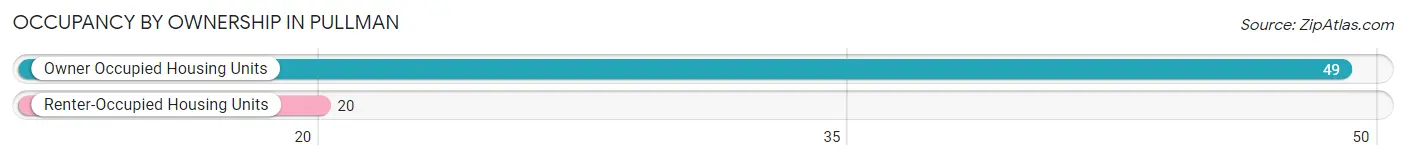
| Occupancy | # Housing Units | % Housing Units |
| Owner Occupied Housing Units | 49 | 71.0% |
| Renter-Occupied Housing Units | 20 | 29.0% |
| Total Occupied Housing Units | 69 | 100.0% |
Occupancy by Household Size in Pullman
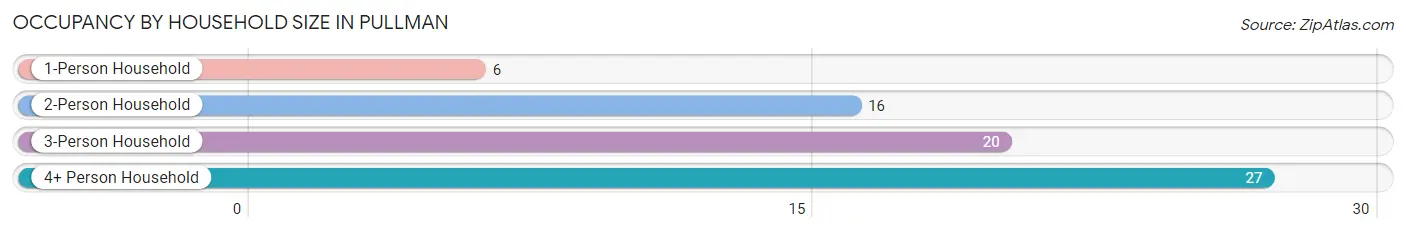
| Household Size | # Housing Units | % Housing Units |
| 1-Person Household | 6 | 8.7% |
| 2-Person Household | 16 | 23.2% |
| 3-Person Household | 20 | 29.0% |
| 4+ Person Household | 27 | 39.1% |
| Total Housing Units | 69 | 100.0% |
Occupancy by Ownership by Household Size in Pullman
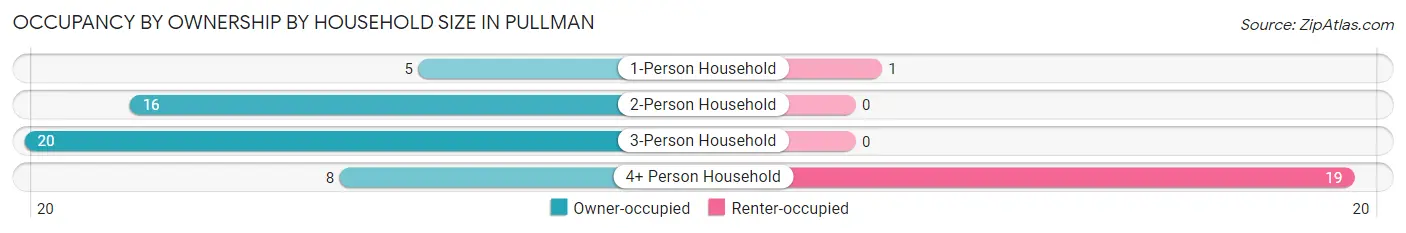
| Household Size | Owner-occupied | Renter-occupied |
| 1-Person Household | 5 (83.3%) | 1 (16.7%) |
| 2-Person Household | 16 (100.0%) | 0 (0.0%) |
| 3-Person Household | 20 (100.0%) | 0 (0.0%) |
| 4+ Person Household | 8 (29.6%) | 19 (70.4%) |
| Total Housing Units | 49 (71.0%) | 20 (29.0%) |
Occupancy by Educational Attainment in Pullman
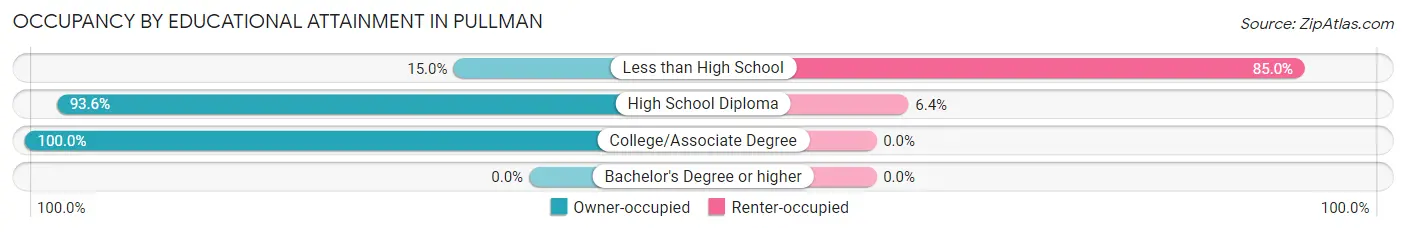
| Household Size | Owner-occupied | Renter-occupied |
| Less than High School | 3 (15.0%) | 17 (85.0%) |
| High School Diploma | 44 (93.6%) | 3 (6.4%) |
| College/Associate Degree | 2 (100.0%) | 0 (0.0%) |
| Bachelor's Degree or higher | 0 (0.0%) | 0 (0.0%) |
Occupancy by Age of Householder in Pullman
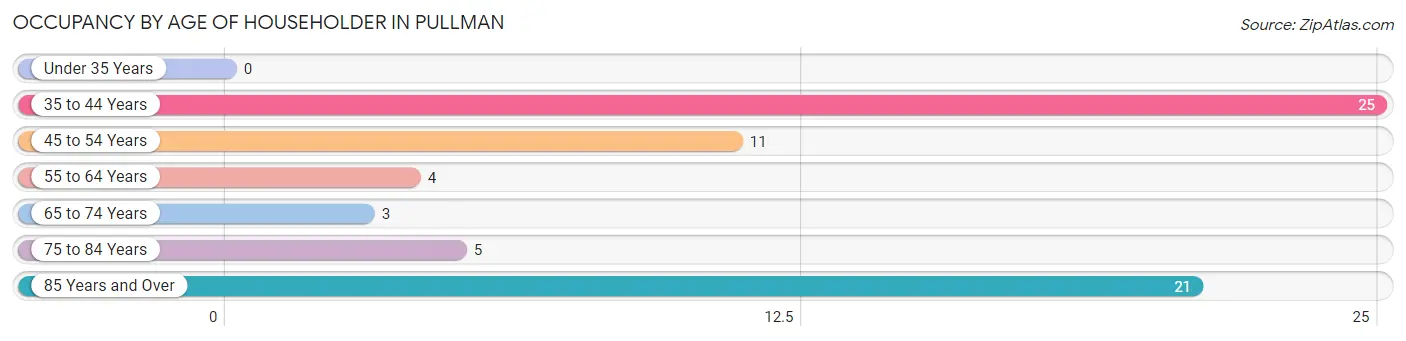
| Age Bracket | # Households | % Households |
| Under 35 Years | 0 | 0.0% |
| 35 to 44 Years | 25 | 36.2% |
| 45 to 54 Years | 11 | 15.9% |
| 55 to 64 Years | 4 | 5.8% |
| 65 to 74 Years | 3 | 4.3% |
| 75 to 84 Years | 5 | 7.2% |
| 85 Years and Over | 21 | 30.4% |
| Total | 69 | 100.0% |
Housing Finances in Pullman
Median Income by Occupancy in Pullman
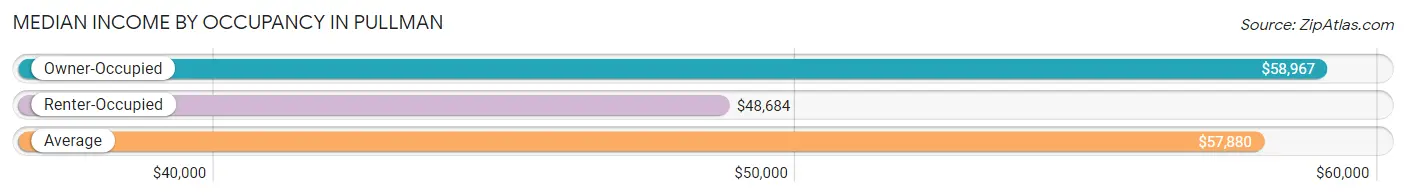
| Occupancy Type | # Households | Median Income |
| Owner-Occupied | 49 (71.0%) | $58,967 |
| Renter-Occupied | 20 (29.0%) | $48,684 |
| Average | 69 (100.0%) | $57,880 |
Occupancy by Householder Income Bracket in Pullman
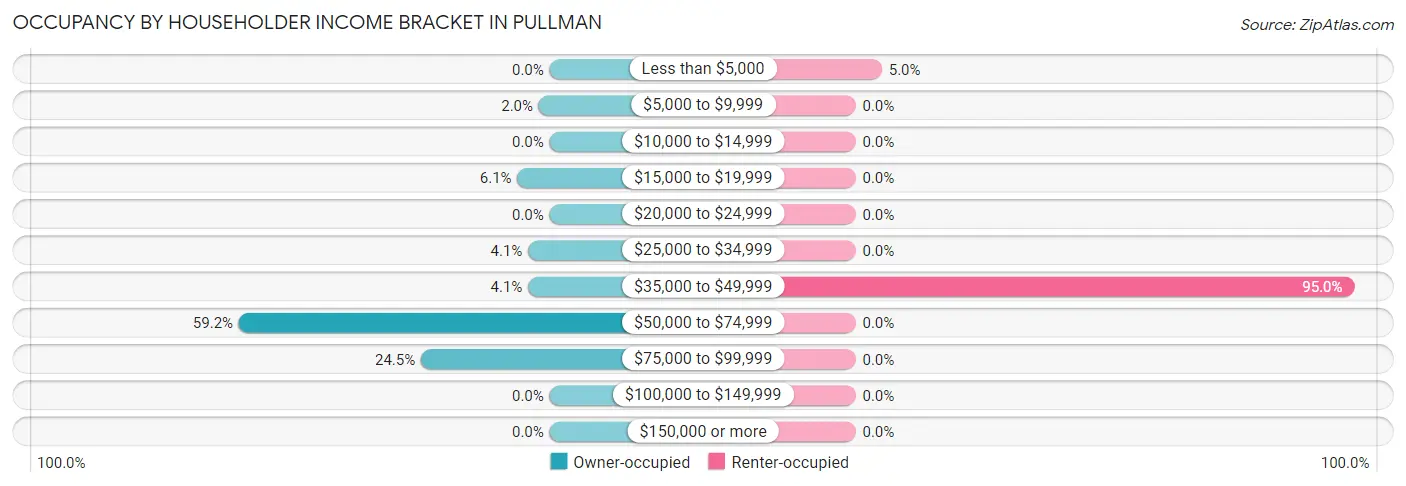
| Income Bracket | Owner-occupied | Renter-occupied |
| Less than $5,000 | 0 (0.0%) | 1 (5.0%) |
| $5,000 to $9,999 | 1 (2.0%) | 0 (0.0%) |
| $10,000 to $14,999 | 0 (0.0%) | 0 (0.0%) |
| $15,000 to $19,999 | 3 (6.1%) | 0 (0.0%) |
| $20,000 to $24,999 | 0 (0.0%) | 0 (0.0%) |
| $25,000 to $34,999 | 2 (4.1%) | 0 (0.0%) |
| $35,000 to $49,999 | 2 (4.1%) | 19 (95.0%) |
| $50,000 to $74,999 | 29 (59.2%) | 0 (0.0%) |
| $75,000 to $99,999 | 12 (24.5%) | 0 (0.0%) |
| $100,000 to $149,999 | 0 (0.0%) | 0 (0.0%) |
| $150,000 or more | 0 (0.0%) | 0 (0.0%) |
| Total | 49 (100.0%) | 20 (100.0%) |
Monthly Housing Cost Tiers in Pullman
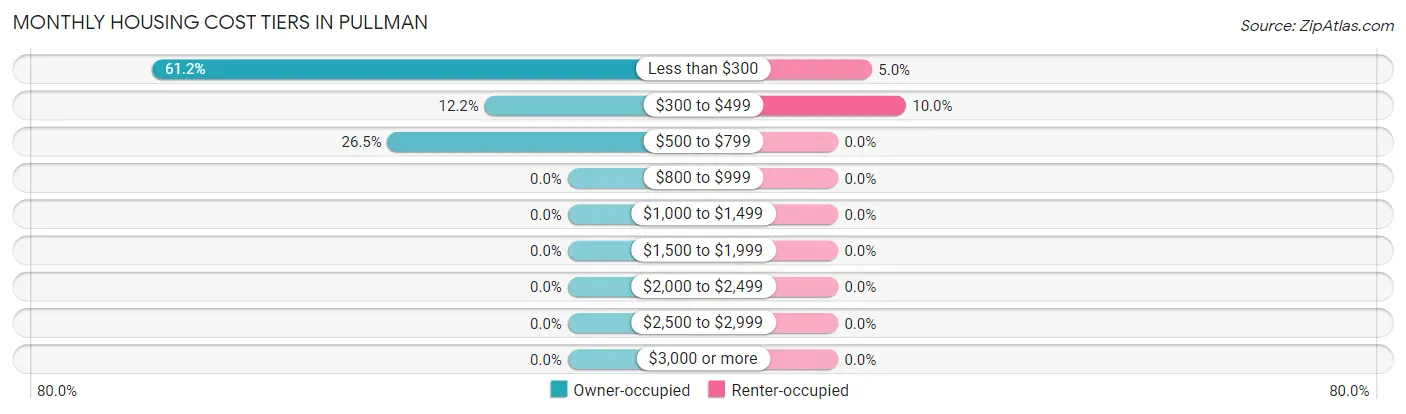
| Monthly Cost | Owner-occupied | Renter-occupied |
| Less than $300 | 30 (61.2%) | 1 (5.0%) |
| $300 to $499 | 6 (12.2%) | 2 (10.0%) |
| $500 to $799 | 13 (26.5%) | 0 (0.0%) |
| $800 to $999 | 0 (0.0%) | 0 (0.0%) |
| $1,000 to $1,499 | 0 (0.0%) | 0 (0.0%) |
| $1,500 to $1,999 | 0 (0.0%) | 0 (0.0%) |
| $2,000 to $2,499 | 0 (0.0%) | 0 (0.0%) |
| $2,500 to $2,999 | 0 (0.0%) | 0 (0.0%) |
| $3,000 or more | 0 (0.0%) | 0 (0.0%) |
| Total | 49 (100.0%) | 20 (100.0%) |
Physical Housing Characteristics in Pullman
Housing Structures in Pullman
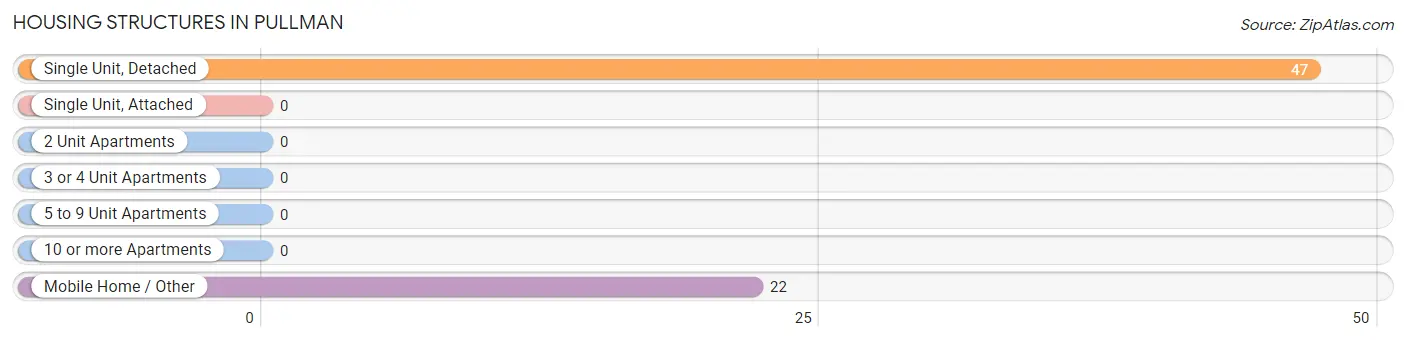
| Structure Type | # Housing Units | % Housing Units |
| Single Unit, Detached | 47 | 68.1% |
| Single Unit, Attached | 0 | 0.0% |
| 2 Unit Apartments | 0 | 0.0% |
| 3 or 4 Unit Apartments | 0 | 0.0% |
| 5 to 9 Unit Apartments | 0 | 0.0% |
| 10 or more Apartments | 0 | 0.0% |
| Mobile Home / Other | 22 | 31.9% |
| Total | 69 | 100.0% |
Housing Structures by Occupancy in Pullman
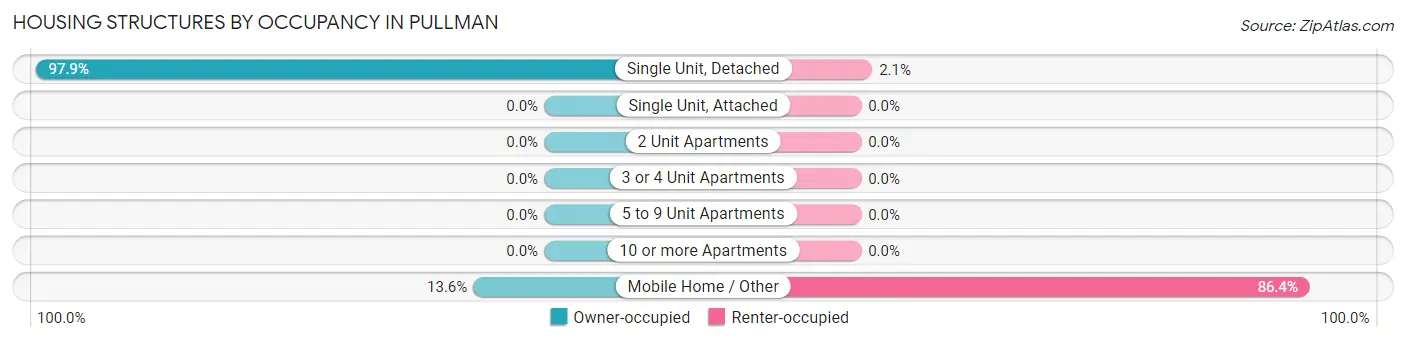
| Structure Type | Owner-occupied | Renter-occupied |
| Single Unit, Detached | 46 (97.9%) | 1 (2.1%) |
| Single Unit, Attached | 0 (0.0%) | 0 (0.0%) |
| 2 Unit Apartments | 0 (0.0%) | 0 (0.0%) |
| 3 or 4 Unit Apartments | 0 (0.0%) | 0 (0.0%) |
| 5 to 9 Unit Apartments | 0 (0.0%) | 0 (0.0%) |
| 10 or more Apartments | 0 (0.0%) | 0 (0.0%) |
| Mobile Home / Other | 3 (13.6%) | 19 (86.4%) |
| Total | 49 (71.0%) | 20 (29.0%) |
Housing Structures by Number of Rooms in Pullman
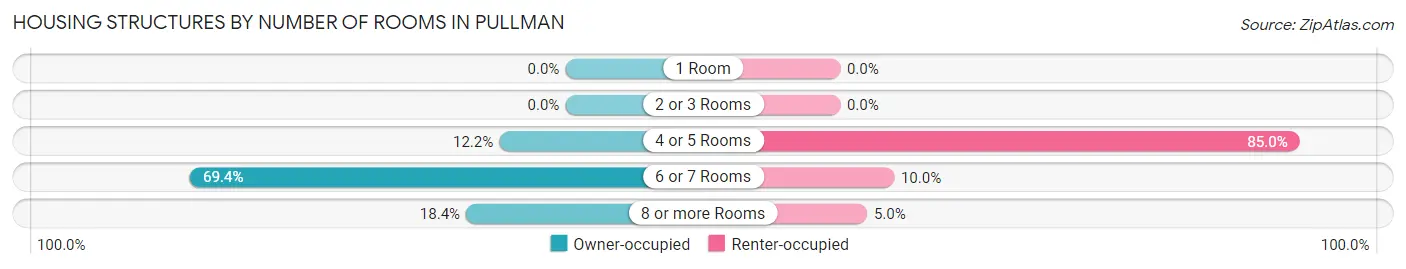
| Number of Rooms | Owner-occupied | Renter-occupied |
| 1 Room | 0 (0.0%) | 0 (0.0%) |
| 2 or 3 Rooms | 0 (0.0%) | 0 (0.0%) |
| 4 or 5 Rooms | 6 (12.2%) | 17 (85.0%) |
| 6 or 7 Rooms | 34 (69.4%) | 2 (10.0%) |
| 8 or more Rooms | 9 (18.4%) | 1 (5.0%) |
| Total | 49 (100.0%) | 20 (100.0%) |
Housing Structure by Heating Type in Pullman
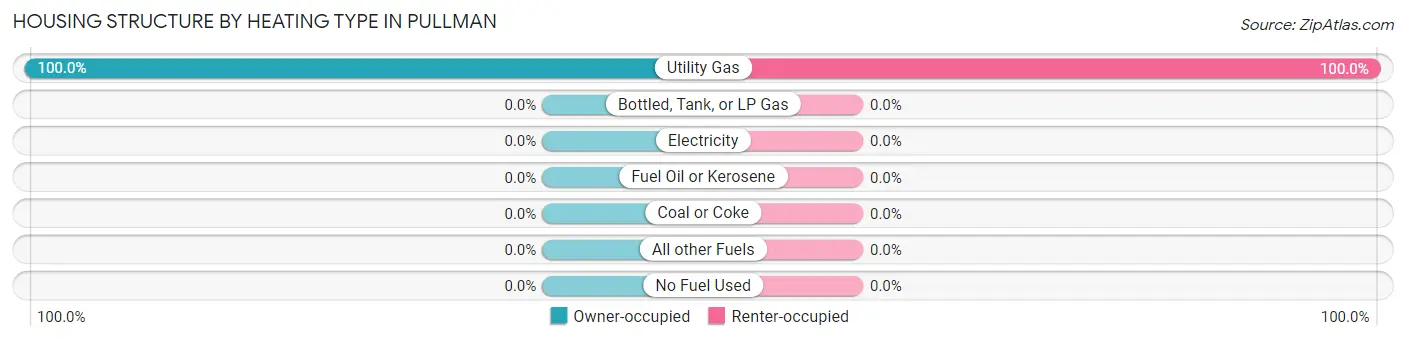
| Heating Type | Owner-occupied | Renter-occupied |
| Utility Gas | 49 (100.0%) | 20 (100.0%) |
| Bottled, Tank, or LP Gas | 0 (0.0%) | 0 (0.0%) |
| Electricity | 0 (0.0%) | 0 (0.0%) |
| Fuel Oil or Kerosene | 0 (0.0%) | 0 (0.0%) |
| Coal or Coke | 0 (0.0%) | 0 (0.0%) |
| All other Fuels | 0 (0.0%) | 0 (0.0%) |
| No Fuel Used | 0 (0.0%) | 0 (0.0%) |
| Total | 49 (100.0%) | 20 (100.0%) |
Household Vehicle Usage in Pullman
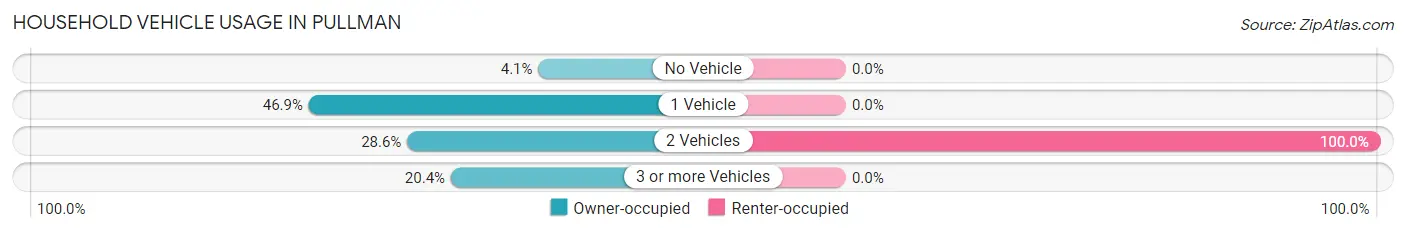
| Vehicles per Household | Owner-occupied | Renter-occupied |
| No Vehicle | 2 (4.1%) | 0 (0.0%) |
| 1 Vehicle | 23 (46.9%) | 0 (0.0%) |
| 2 Vehicles | 14 (28.6%) | 20 (100.0%) |
| 3 or more Vehicles | 10 (20.4%) | 0 (0.0%) |
| Total | 49 (100.0%) | 20 (100.0%) |
Real Estate & Mortgages in Pullman
Real Estate and Mortgage Overview in Pullman
| Characteristic | Without Mortgage | With Mortgage |
| Housing Units | 40 | 9 |
| Median Property Value | $109,800 | $0 |
| Median Household Income | $58,478 | $0 |
| Monthly Housing Costs | $234 | $0 |
| Real Estate Taxes | $1,119 | $0 |
Property Value by Mortgage Status in Pullman
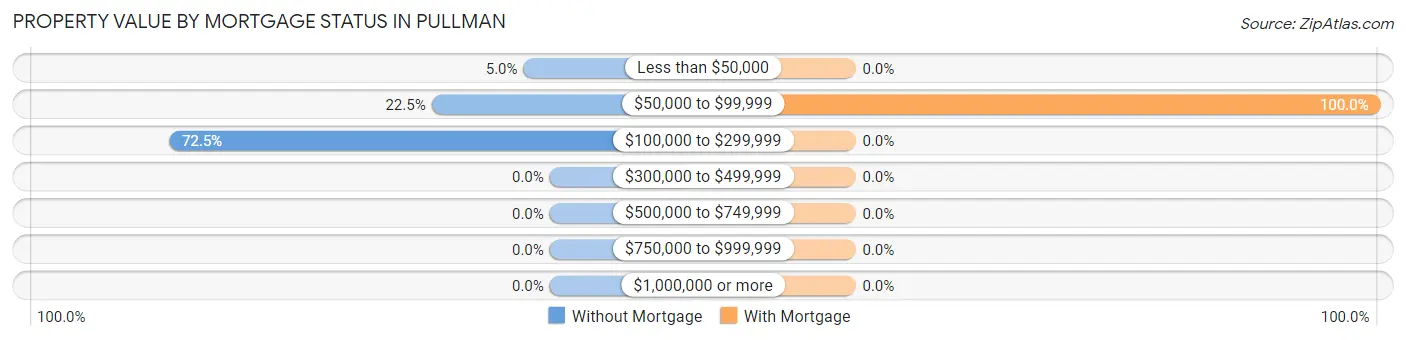
| Property Value | Without Mortgage | With Mortgage |
| Less than $50,000 | 2 (5.0%) | 0 (0.0%) |
| $50,000 to $99,999 | 9 (22.5%) | 9 (100.0%) |
| $100,000 to $299,999 | 29 (72.5%) | 0 (0.0%) |
| $300,000 to $499,999 | 0 (0.0%) | 0 (0.0%) |
| $500,000 to $749,999 | 0 (0.0%) | 0 (0.0%) |
| $750,000 to $999,999 | 0 (0.0%) | 0 (0.0%) |
| $1,000,000 or more | 0 (0.0%) | 0 (0.0%) |
| Total | 40 (100.0%) | 9 (100.0%) |
Household Income by Mortgage Status in Pullman
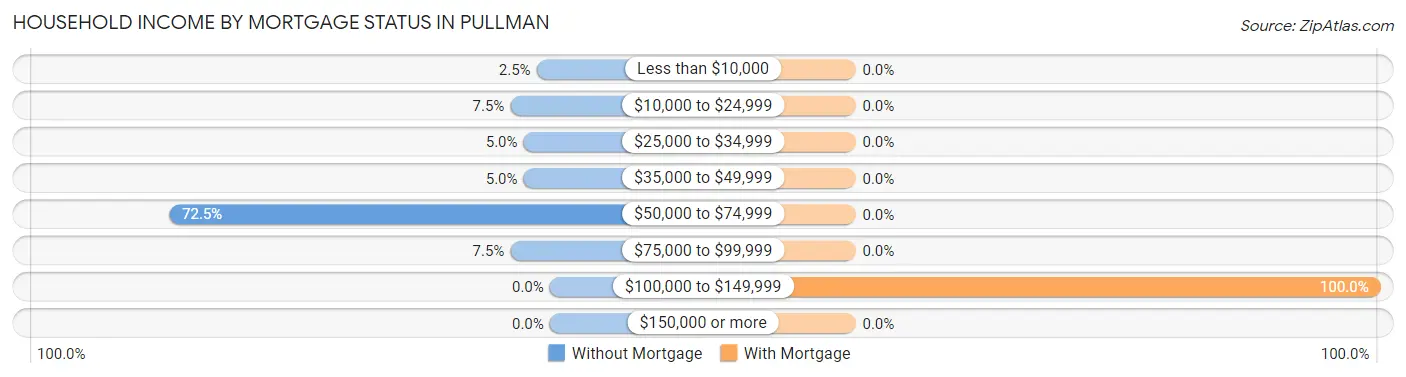
| Household Income | Without Mortgage | With Mortgage |
| Less than $10,000 | 1 (2.5%) | 0 (0.0%) |
| $10,000 to $24,999 | 3 (7.5%) | 0 (0.0%) |
| $25,000 to $34,999 | 2 (5.0%) | 0 (0.0%) |
| $35,000 to $49,999 | 2 (5.0%) | 0 (0.0%) |
| $50,000 to $74,999 | 29 (72.5%) | 0 (0.0%) |
| $75,000 to $99,999 | 3 (7.5%) | 0 (0.0%) |
| $100,000 to $149,999 | 0 (0.0%) | 9 (100.0%) |
| $150,000 or more | 0 (0.0%) | 0 (0.0%) |
| Total | 40 (100.0%) | 9 (100.0%) |
Property Value to Household Income Ratio in Pullman
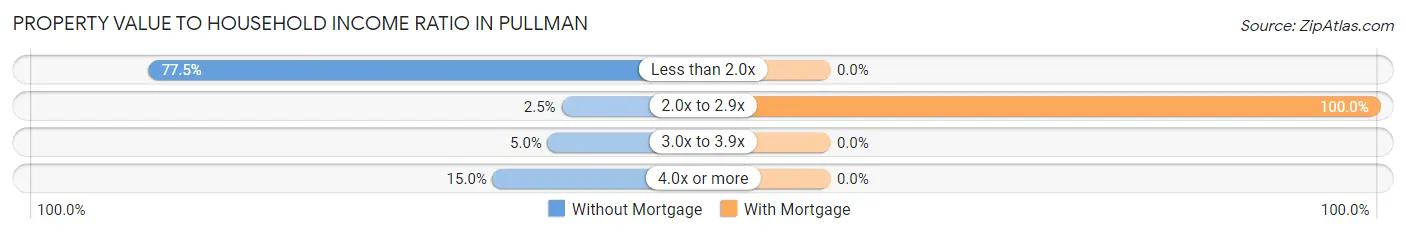
| Value-to-Income Ratio | Without Mortgage | With Mortgage |
| Less than 2.0x | 31 (77.5%) | 0 (0.0%) |
| 2.0x to 2.9x | 1 (2.5%) | 9 (100.0%) |
| 3.0x to 3.9x | 2 (5.0%) | 0 (0.0%) |
| 4.0x or more | 6 (15.0%) | 0 (0.0%) |
| Total | 40 (100.0%) | 9 (100.0%) |
Real Estate Taxes by Mortgage Status in Pullman
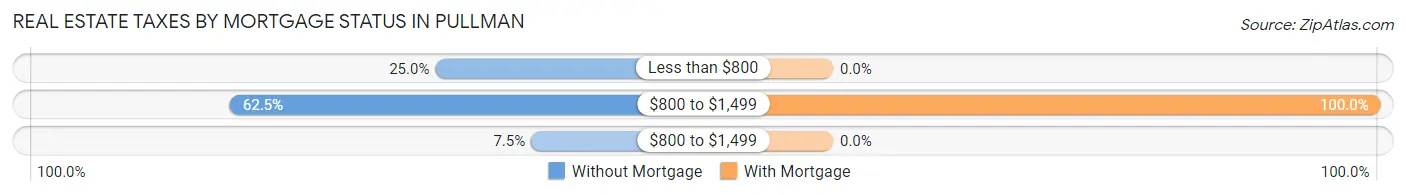
| Property Taxes | Without Mortgage | With Mortgage |
| Less than $800 | 10 (25.0%) | 0 (0.0%) |
| $800 to $1,499 | 25 (62.5%) | 9 (100.0%) |
| $800 to $1,499 | 3 (7.5%) | 0 (0.0%) |
| Total | 40 (100.0%) | 9 (100.0%) |
Health & Disability in Pullman
Health Insurance Coverage by Age in Pullman
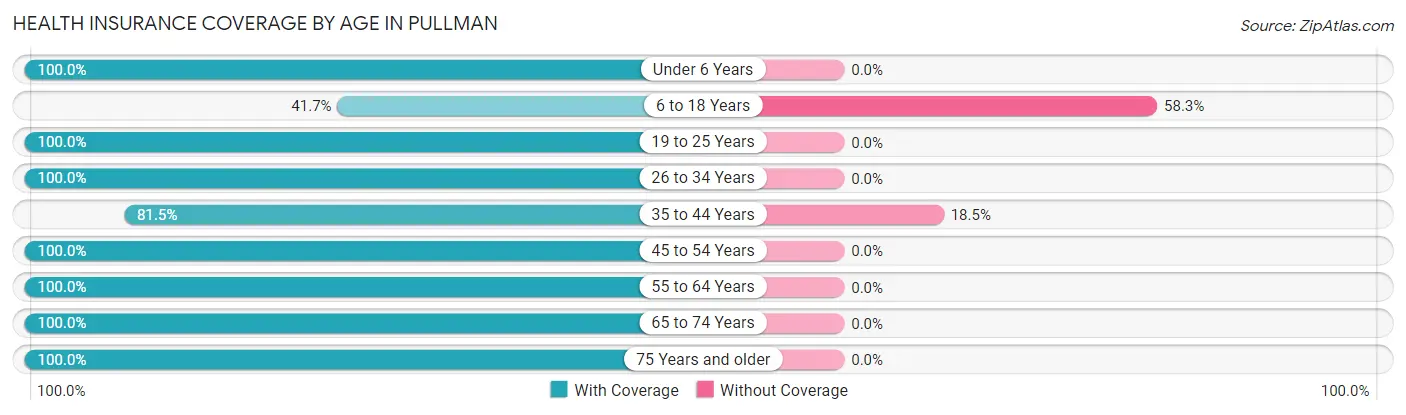
| Age Bracket | With Coverage | Without Coverage |
| Under 6 Years | 7 (100.0%) | 0 (0.0%) |
| 6 to 18 Years | 10 (41.7%) | 14 (58.3%) |
| 19 to 25 Years | 17 (100.0%) | 0 (0.0%) |
| 26 to 34 Years | 9 (100.0%) | 0 (0.0%) |
| 35 to 44 Years | 123 (81.5%) | 28 (18.5%) |
| 45 to 54 Years | 17 (100.0%) | 0 (0.0%) |
| 55 to 64 Years | 8 (100.0%) | 0 (0.0%) |
| 65 to 74 Years | 43 (100.0%) | 0 (0.0%) |
| 75 Years and older | 27 (100.0%) | 0 (0.0%) |
| Total | 261 (86.1%) | 42 (13.9%) |
Health Insurance Coverage by Citizenship Status in Pullman
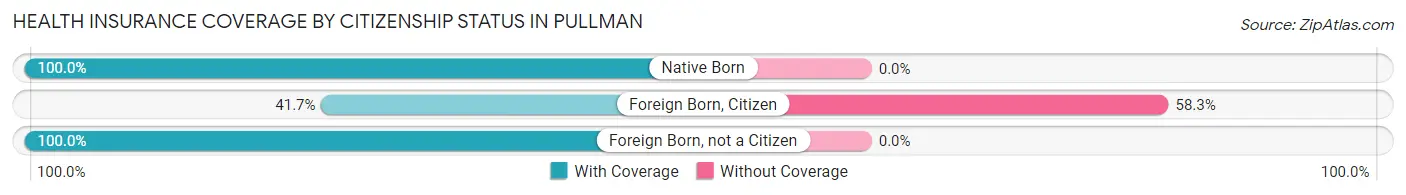
| Citizenship Status | With Coverage | Without Coverage |
| Native Born | 7 (100.0%) | 0 (0.0%) |
| Foreign Born, Citizen | 10 (41.7%) | 14 (58.3%) |
| Foreign Born, not a Citizen | 17 (100.0%) | 0 (0.0%) |
Health Insurance Coverage by Household Income in Pullman
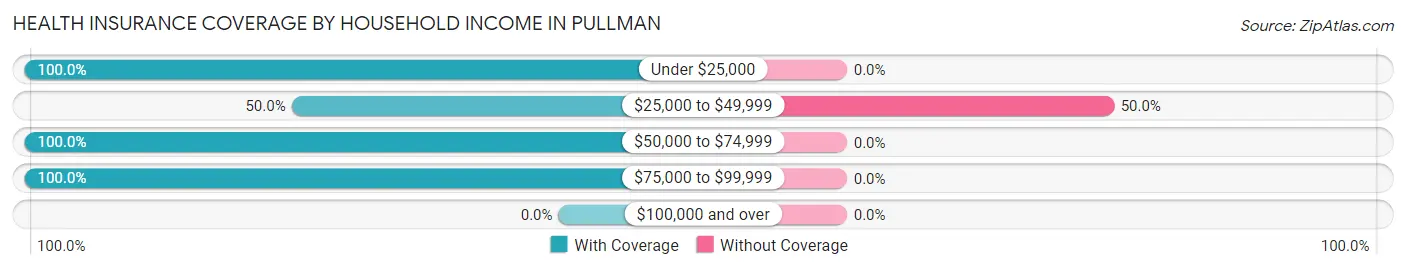
| Household Income | With Coverage | Without Coverage |
| Under $25,000 | 6 (100.0%) | 0 (0.0%) |
| $25,000 to $49,999 | 42 (50.0%) | 42 (50.0%) |
| $50,000 to $74,999 | 183 (100.0%) | 0 (0.0%) |
| $75,000 to $99,999 | 30 (100.0%) | 0 (0.0%) |
| $100,000 and over | 0 (0.0%) | 0 (0.0%) |
Public vs Private Health Insurance Coverage by Age in Pullman
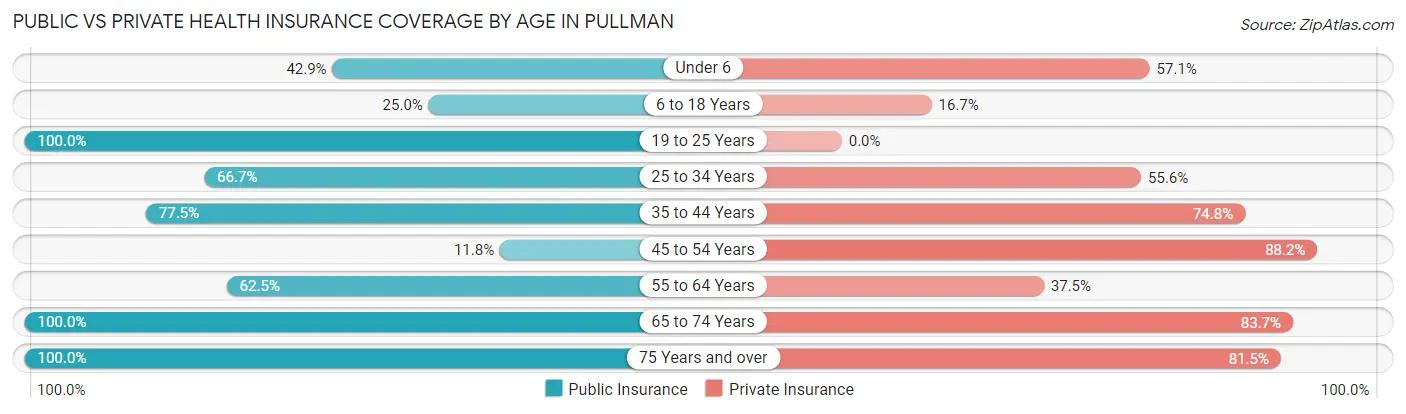
| Age Bracket | Public Insurance | Private Insurance |
| Under 6 | 3 (42.9%) | 4 (57.1%) |
| 6 to 18 Years | 6 (25.0%) | 4 (16.7%) |
| 19 to 25 Years | 17 (100.0%) | 0 (0.0%) |
| 25 to 34 Years | 6 (66.7%) | 5 (55.6%) |
| 35 to 44 Years | 117 (77.5%) | 113 (74.8%) |
| 45 to 54 Years | 2 (11.8%) | 15 (88.2%) |
| 55 to 64 Years | 5 (62.5%) | 3 (37.5%) |
| 65 to 74 Years | 43 (100.0%) | 36 (83.7%) |
| 75 Years and over | 27 (100.0%) | 22 (81.5%) |
| Total | 226 (74.6%) | 202 (66.7%) |
Disability Status by Sex by Age in Pullman
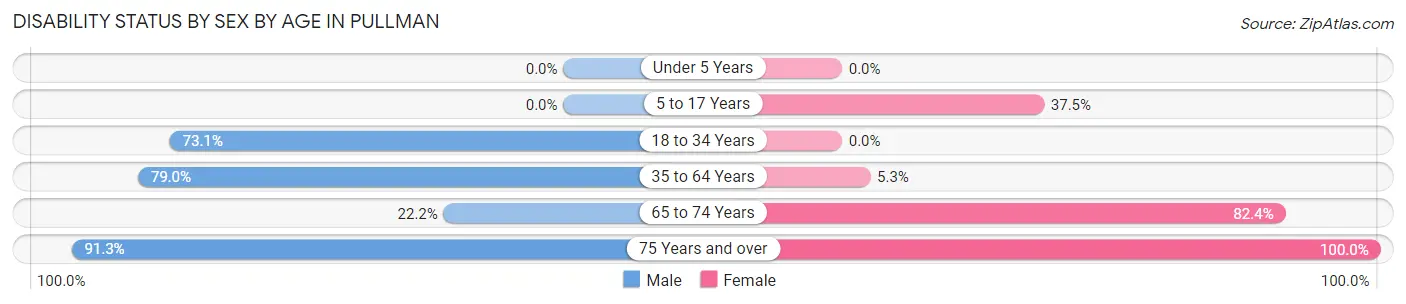
| Age Bracket | Male | Female |
| Under 5 Years | 0 (0.0%) | 0 (0.0%) |
| 5 to 17 Years | 0 (0.0%) | 3 (37.5%) |
| 18 to 34 Years | 19 (73.1%) | 0 (0.0%) |
| 35 to 64 Years | 109 (79.0%) | 2 (5.3%) |
| 65 to 74 Years | 2 (22.2%) | 28 (82.4%) |
| 75 Years and over | 21 (91.3%) | 4 (100.0%) |
Disability Class by Sex by Age in Pullman
Disability Class: Hearing Difficulty
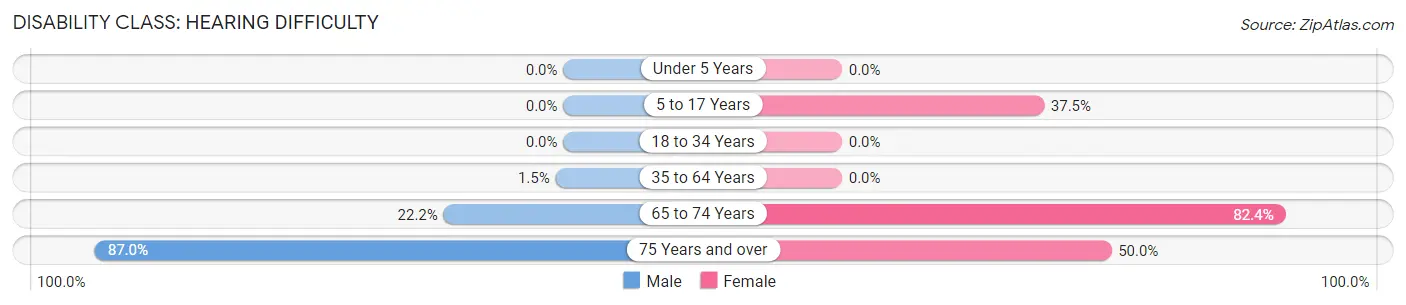
| Age Bracket | Male | Female |
| Under 5 Years | 0 (0.0%) | 0 (0.0%) |
| 5 to 17 Years | 0 (0.0%) | 3 (37.5%) |
| 18 to 34 Years | 0 (0.0%) | 0 (0.0%) |
| 35 to 64 Years | 2 (1.5%) | 0 (0.0%) |
| 65 to 74 Years | 2 (22.2%) | 28 (82.4%) |
| 75 Years and over | 20 (87.0%) | 2 (50.0%) |
Disability Class: Vision Difficulty
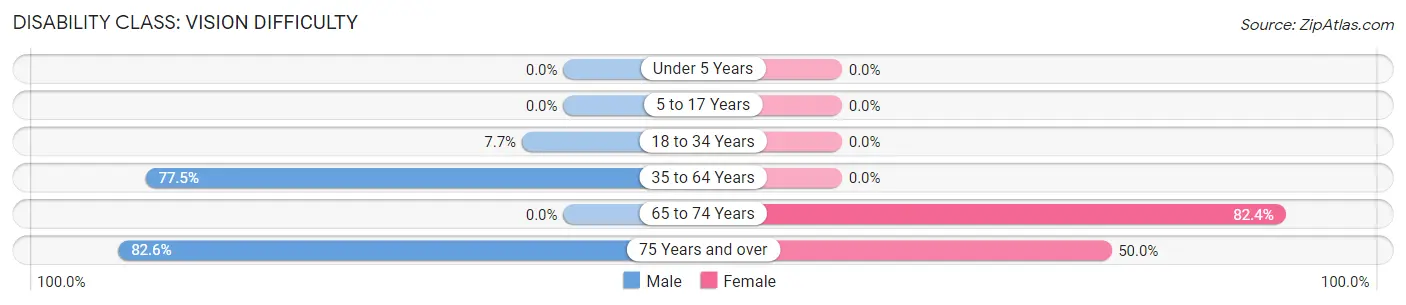
| Age Bracket | Male | Female |
| Under 5 Years | 0 (0.0%) | 0 (0.0%) |
| 5 to 17 Years | 0 (0.0%) | 0 (0.0%) |
| 18 to 34 Years | 2 (7.7%) | 0 (0.0%) |
| 35 to 64 Years | 107 (77.5%) | 0 (0.0%) |
| 65 to 74 Years | 0 (0.0%) | 28 (82.4%) |
| 75 Years and over | 19 (82.6%) | 2 (50.0%) |
Disability Class: Cognitive Difficulty
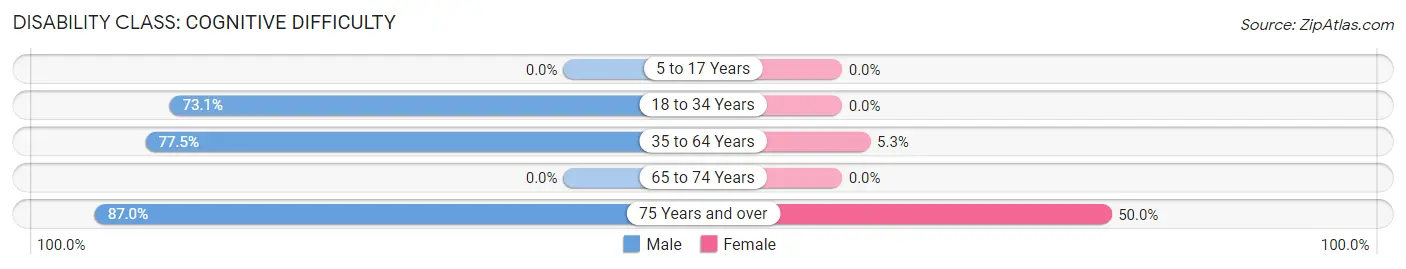
| Age Bracket | Male | Female |
| 5 to 17 Years | 0 (0.0%) | 0 (0.0%) |
| 18 to 34 Years | 19 (73.1%) | 0 (0.0%) |
| 35 to 64 Years | 107 (77.5%) | 2 (5.3%) |
| 65 to 74 Years | 0 (0.0%) | 0 (0.0%) |
| 75 Years and over | 20 (87.0%) | 2 (50.0%) |
Disability Class: Ambulatory Difficulty
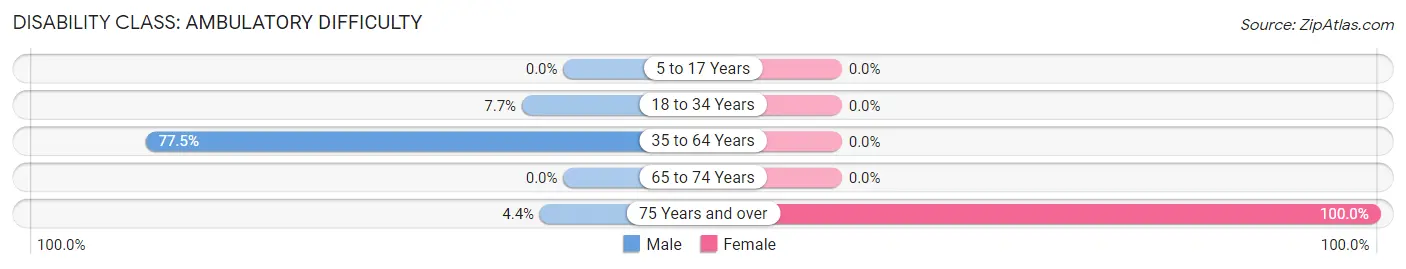
| Age Bracket | Male | Female |
| 5 to 17 Years | 0 (0.0%) | 0 (0.0%) |
| 18 to 34 Years | 2 (7.7%) | 0 (0.0%) |
| 35 to 64 Years | 107 (77.5%) | 0 (0.0%) |
| 65 to 74 Years | 0 (0.0%) | 0 (0.0%) |
| 75 Years and over | 1 (4.3%) | 4 (100.0%) |
Disability Class: Self-Care Difficulty
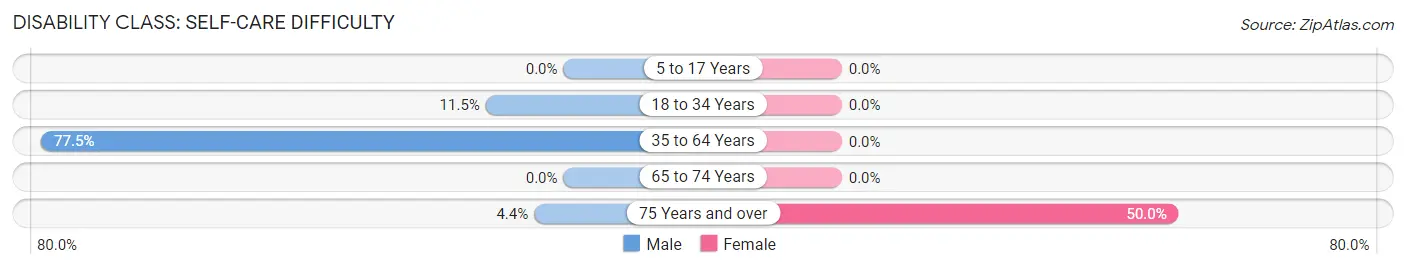
| Age Bracket | Male | Female |
| 5 to 17 Years | 0 (0.0%) | 0 (0.0%) |
| 18 to 34 Years | 3 (11.5%) | 0 (0.0%) |
| 35 to 64 Years | 107 (77.5%) | 0 (0.0%) |
| 65 to 74 Years | 0 (0.0%) | 0 (0.0%) |
| 75 Years and over | 1 (4.3%) | 2 (50.0%) |
Technology Access in Pullman
Computing Device Access in Pullman
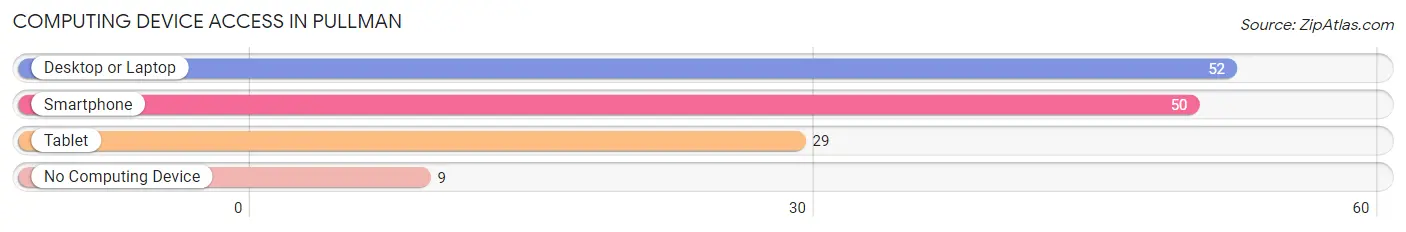
| Device Type | # Households | % Households |
| Desktop or Laptop | 52 | 75.4% |
| Smartphone | 50 | 72.5% |
| Tablet | 29 | 42.0% |
| No Computing Device | 9 | 13.0% |
| Total | 69 | 100.0% |
Internet Access in Pullman
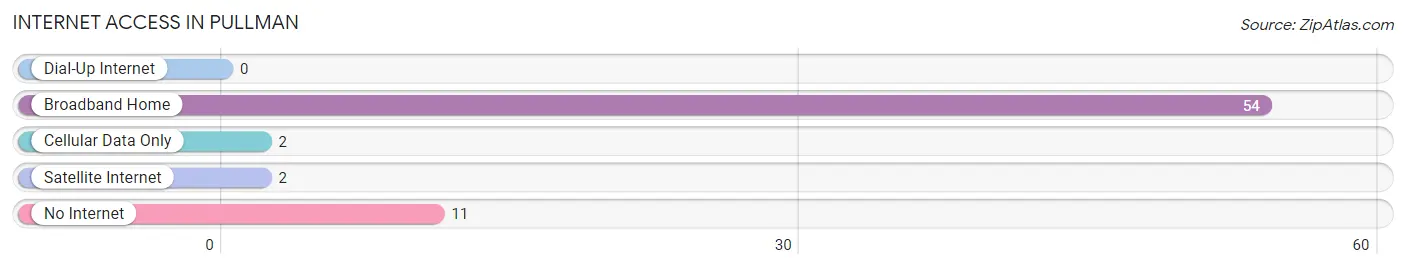
| Internet Type | # Households | % Households |
| Dial-Up Internet | 0 | 0.0% |
| Broadband Home | 54 | 78.3% |
| Cellular Data Only | 2 | 2.9% |
| Satellite Internet | 2 | 2.9% |
| No Internet | 11 | 15.9% |
| Total | 69 | 100.0% |
Pullman Summary
Pullman, West Virginia is a small town located in the eastern part of the state, in Mason County. It is situated on the banks of the Ohio River, and is part of the Huntington-Ashland metropolitan area. The town has a population of just over 1,000 people, and is known for its rural charm and small-town atmosphere.
History
The area that is now Pullman was first settled in the late 1700s by a group of settlers from Pennsylvania. The town was originally known as “Pullman’s Landing”, and was a popular stop for steamboats traveling up and down the Ohio River. In 1845, the town was officially incorporated as Pullman, and the first post office was established in 1848.
In the late 1800s, Pullman was a thriving river port, with a number of businesses and industries located in the area. The town was also home to a number of coal mines, which provided employment for many of the town’s residents.
In the early 1900s, Pullman began to decline as the river traffic decreased and the coal industry began to decline. The town’s population began to decline as well, and by the 1950s, the population had dropped to just over 500 people.
Geography
Pullman is located in the eastern part of West Virginia, in Mason County. It is situated on the banks of the Ohio River, and is part of the Huntington-Ashland metropolitan area. The town is located approximately 25 miles south of Huntington, and is about a two-hour drive from Charleston, the state capital.
The town is situated in a rural area, and is surrounded by rolling hills and farmland. The town is also located near the Kanawha River, which provides a number of recreational opportunities for residents and visitors alike.
Economy
The economy of Pullman is largely based on agriculture and tourism. The town is home to a number of farms, which produce a variety of crops, including corn, soybeans, and wheat. The town is also home to a number of small businesses, including restaurants, shops, and other services.
In recent years, Pullman has become a popular destination for tourists, due to its rural charm and small-town atmosphere. The town is home to a number of historic sites, including the Pullman Historic District, which is listed on the National Register of Historic Places.
Demographics
As of the 2010 census, the population of Pullman was 1,072. The racial makeup of the town was 97.3% White, 0.7% African American, 0.2% Native American, 0.2% Asian, 0.1% Pacific Islander, and 1.5% from two or more races. The median household income in Pullman was $37,917, and the median family income was $45,625.
Conclusion
Pullman, West Virginia is a small town located in the eastern part of the state, in Mason County. It is situated on the banks of the Ohio River, and is part of the Huntington-Ashland metropolitan area. The town has a population of just over 1,000 people, and is known for its rural charm and small-town atmosphere. The economy of Pullman is largely based on agriculture and tourism, and the town is home to a number of historic sites. The racial makeup of the town is predominantly White, with a small percentage of African American, Native American, Asian, and Pacific Islander residents.
Common Questions
What is Per Capita Income in Pullman?
Per Capita income in Pullman is $16,005.
What is the Median Family Income in Pullman?
Median Family Income in Pullman is $49,803.
What is the Median Household income in Pullman?
Median Household Income in Pullman is $57,880.
What is Income or Wage Gap in Pullman?
Income or Wage Gap in Pullman is 24.7%.
Women in Pullman earn 75.3 cents for every dollar earned by a man.
What is Inequality or Gini Index in Pullman?
Inequality or Gini Index in Pullman is 0.16.
What is the Total Population of Pullman?
Total Population of Pullman is 303.
What is the Total Male Population of Pullman?
Total Male Population of Pullman is 212.
What is the Total Female Population of Pullman?
Total Female Population of Pullman is 91.
What is the Ratio of Males per 100 Females in Pullman?
There are 232.97 Males per 100 Females in Pullman.
What is the Ratio of Females per 100 Males in Pullman?
There are 42.92 Females per 100 Males in Pullman.
What is the Median Population Age in Pullman?
Median Population Age in Pullman is 35.9 Years.
What is the Average Family Size in Pullman
Average Family Size in Pullman is 5.1 People.
What is the Average Household Size in Pullman
Average Household Size in Pullman is 4.4 People.
How Large is the Labor Force in Pullman?
There are 93 People in the Labor Forcein in Pullman.
What is the Percentage of People in the Labor Force in Pullman?
34.1% of People are in the Labor Force in Pullman.